Data Analysis Icon
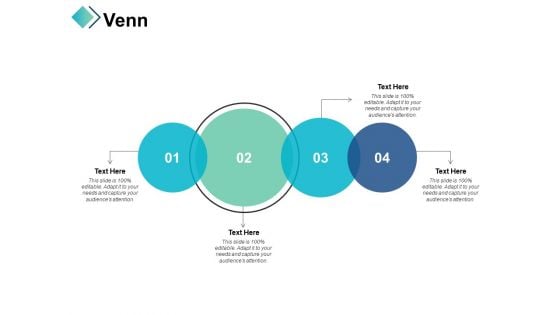
Venn Performance Review Process Ppt PowerPoint Presentation Infographic Template Portfolio
This is a venn performance review process ppt powerpoint presentation infographic template portfolio. This is a four stage process. The stages in this process are management, strategy, analysis, business, marketing.
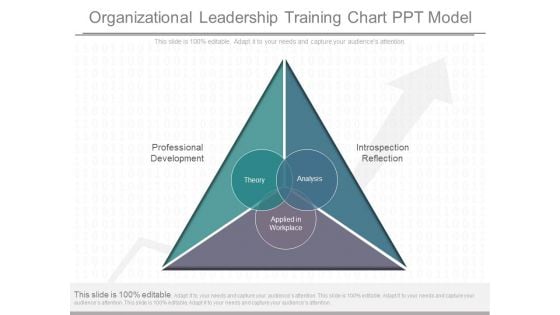
Organizational Leadership Training Chart Ppt Model
This is a organizational leadership training chart ppt model. This is a three stage process. The stages in this process are professional development, introspection reflection, applied in workplace, theory, analysis.
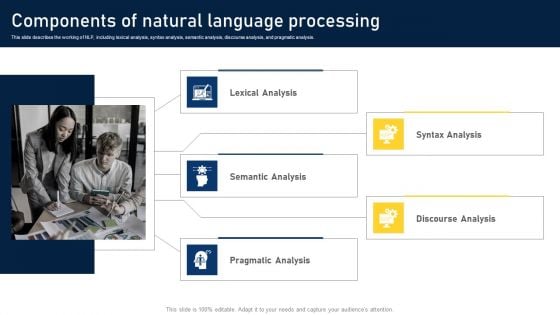
NLP Applications Methodology Components Of Natural Language Processing Demonstration PDF
This slide describes the working of NLP, including lexical analysis, syntax analysis, semantic analysis, discourse analysis, and pragmatic analysis. If you are looking for a format to display your unique thoughts, then the professionally designed NLP Applications Methodology Components Of Natural Language Processing Demonstration PDF is the one for you. You can use it as a Google Slides template or a PowerPoint template. Incorporate impressive visuals, symbols, images, and other charts. Modify or reorganize the text boxes as you desire. Experiment with shade schemes and font pairings. Alter, share or cooperate with other people on your work. Download NLP Applications Methodology Components Of Natural Language Processing Demonstration PDF and find out how to give a successful presentation. Present a perfect display to your team and make your presentation unforgettable.
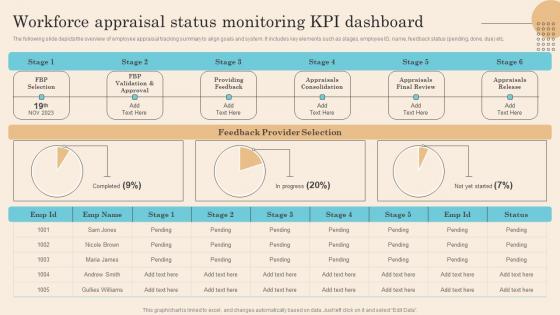
Workforce Appraisal Status Monitoring Kpi Dashboard Executing Successful Staff Performance Graphics Pdf
The following slide depicts the overview of employee appraisal tracking summary to align goals and system. It includes key elements such as stages, employee ID, name, feedback status pending, done, due etc. There are so many reasons you need a Workforce Appraisal Status Monitoring Kpi Dashboard Executing Successful Staff Performance Graphics Pdf. The first reason is you can not spend time making everything from scratch, Thus, Slidegeeks has made presentation templates for you too. You can easily download these templates from our website easily. The following slide depicts the overview of employee appraisal tracking summary to align goals and system. It includes key elements such as stages, employee ID, name, feedback status pending, done, due etc.
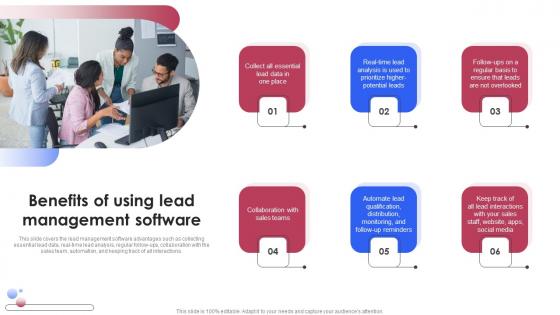
Benefits Of Using Lead Management Software Various Techniques For Managing Themes PDF
This slide covers the lead management software advantages such as collecting essential lead data, real-time lead analysis, regular follow-ups, collaboration with the sales team, automation, and keeping track of all interactions. Slidegeeks is here to make your presentations a breeze with Benefits Of Using Lead Management Software Various Techniques For Managing Themes PDF With our easy-to-use and customizable templates, you can focus on delivering your ideas rather than worrying about formatting. With a variety of designs to choose from, you are sure to find one that suits your needs. And with animations and unique photos, illustrations, and fonts, you can make your presentation pop. So whether you are giving a sales pitch or presenting to the board, make sure to check out Slidegeeks first This slide covers the lead management software advantages such as collecting essential lead data, real-time lead analysis, regular follow-ups, collaboration with the sales team, automation, and keeping track of all interactions.
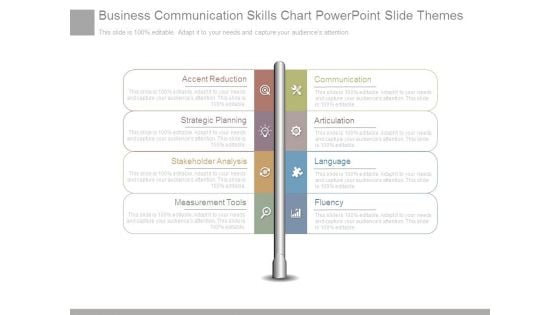
Business Communication Skills Chart Powerpoint Slide Themes
This is a business communication skills chart powerpoint slide themes. This is a eight stage process. The stages in this process are accent reduction, communication, strategic planning, articulation, stakeholder analysis, language, measurement tools, fluency.
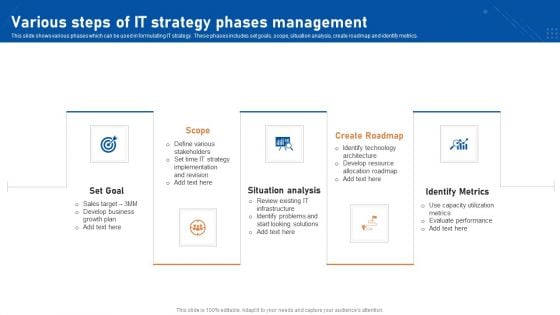
Various Steps Of IT Strategy Phases Management Introduction PDF
This slide shows various phases which can be used in formulating IT strategy. These phases includes set goals, scope, situation analysis, create roadmap and identify metrics.Presenting Various Steps Of IT Strategy Phases Management Introduction PDF to dispense important information. This template comprises five stages. It also presents valuable insights into the topics including Situation Analysis, Create Roadmap, Identify Metrics. This is a completely customizable PowerPoint theme that can be put to use immediately. So, download it and address the topic impactfully.
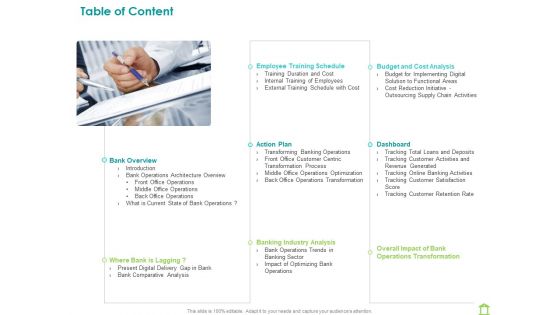
Operations Of Commercial Bank Table Of Content Ppt Professional Themes PDF
Presenting operations of commercial bank table of content ppt professional themes pdf to provide visual cues and insights. Share and navigate important information on one stages that need your due attention. This template can be used to pitch topics like employee training schedule, budget and cost analysis, dashboard, action plan, banking industry analysis, overall impact of bank operations transformation, bank overview. In addition, this PPT design contains high-resolution images, graphics, etc, that are easily editable and available for immediate download.
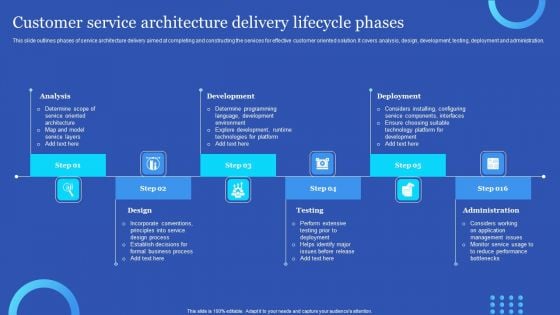
Customer Service Architecture Delivery Lifecycle Phases Download PDF
This slide outlines phases of service architecture delivery aimed at completing and constructing the services for effective customer oriented solution. It covers analysis, design, development, testing, deployment and administration. Presenting Customer Service Architecture Delivery Lifecycle Phases Download PDF to dispense important information. This template comprises six stages. It also presents valuable insights into the topics including Administration, Deployment, Analysis. This is a completely customizable PowerPoint theme that can be put to use immediately. So, download it and address the topic impactfully.
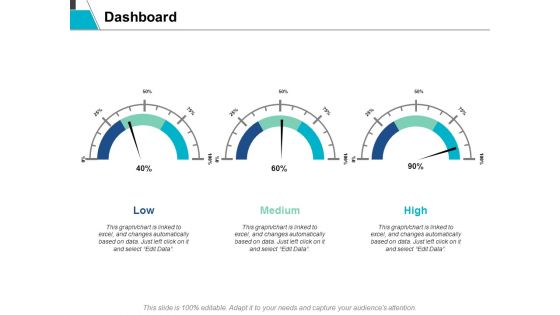
Dashboard Marketing Ppt Powerpoint Presentation Professional Mockup
This is a dashboard marketing ppt powerpoint presentation professional mockup. The topics discussed in this diagram are finance, marketing, management, investment, analysis. This is a completely editable PowerPoint presentation, and is available for immediate download.
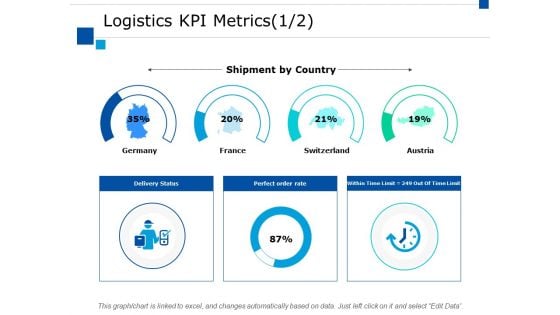
Logistics Kpi Metrics Business Ppt PowerPoint Presentation Ideas Infographics
This is a logistics kpi metrics business ppt powerpoint presentation ideas infographics. This is a four stage process. The stages in this process are finance, marketing, management, investment, analysis.
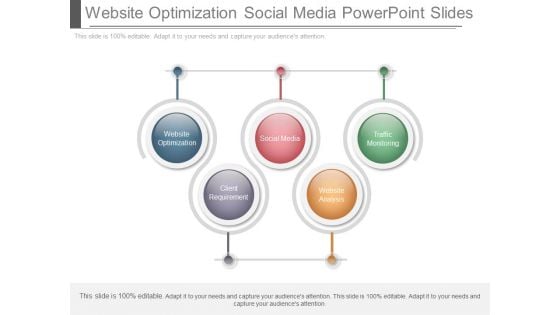
Website Optimization Social Media Powerpoint Slides
This is a website optimization social media powerpoint slides. This is a five stage process. The stages in this process are website optimization, social media, traffic monitoring, client requirement, website analysis.
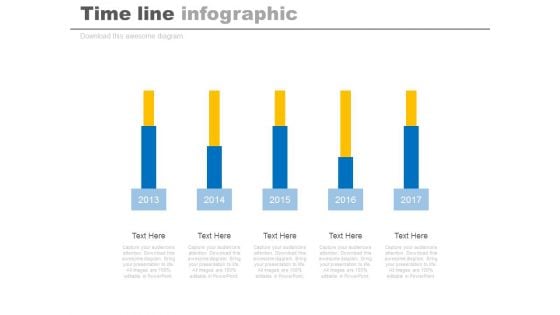
Five Years Planning Timeline Chart Powerpoint Slides
This timeline diagram displays five sequential year steps. This PowerPoint template may be used to display when statistical analysis. This timeline design is most useful for showing important milestones and deadlines.
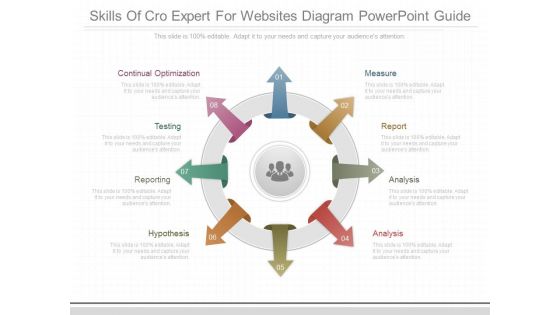
Skills Of Cro Expert For Websites Diagram Powerpoint Guide
This is a skills of cro expert for websites diagram powerpoint guide. This is a eight stage process. The stages in this process are continual optimization, testing, reporting, hypothesis, measure, report, analysis.
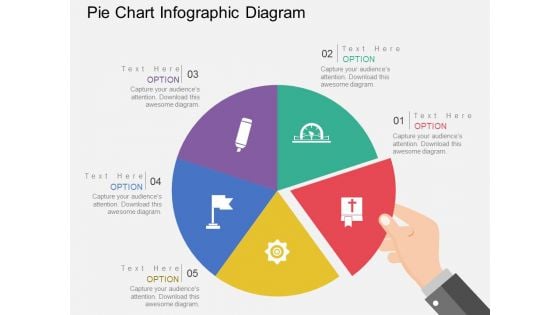
Pie Chart Infographic Diagram Powerpoint Templates
This Power Point template has been designed with pie chart infographic. This business slide is useful to present financial ratio analysis. Use this diagram to make business presentation. Illustrate these thoughts with this slide.
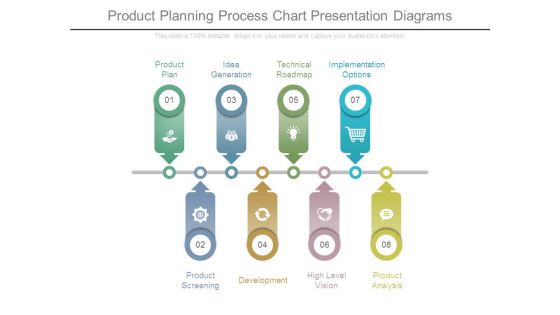
Product Planning Process Chart Presentation Diagrams
This is a product planning process chart presentation diagrams. This is a eight stage process. The stages in this process are product plan, idea generation, technical roadmap, implementation options, product screening, development, high level vision, product analysis.
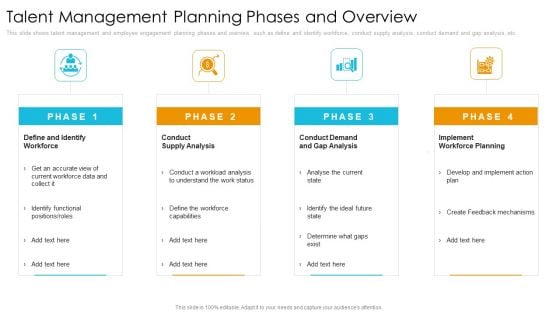
Talent Management Planning Phases And Overview Formats PDF
Presenting talent management planning phases and overview formats pdf to provide visual cues and insights. Share and navigate important information on four stages that need your due attention. This template can be used to pitch topics like conduct supply analysis, conduct demand and gap analysis, implement workforce planning . In addtion, this PPT design contains high resolution images, graphics, etc, that are easily editable and available for immediate download.
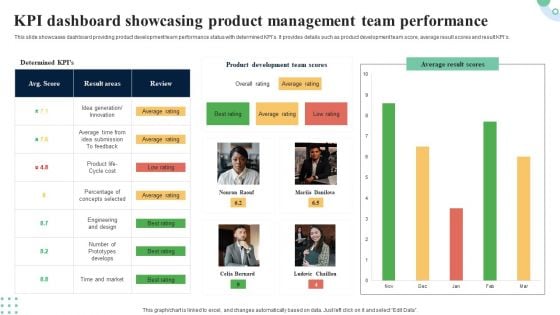
KPI Dashboard Showcasing Product Management Team Performance Demonstration PDF
This slide represents dashboard showcasing revenue assessment for new product development. It projects information regarding revenue breakdown, revenue per product, time to marketing and win or loss analysis. Showcasing this set of slides titled KPI Dashboard Showcasing Product Management Team Performance Demonstration PDF. The topics addressed in these templates are Revenue Per Project, Revenue Breakdown, Loss Analysis. All the content presented in this PPT design is completely editable. Download it and make adjustments in color, background, font etc. as per your unique business setting.

Three Person Tags With Skill Percentage Charts Powerpoint Slides
This PowerPoint template has been designed with three person?s tags with percentage values. This Info graphic diagram may be used to display team skill analysis. Download this impressive diagram to build unique presentations.
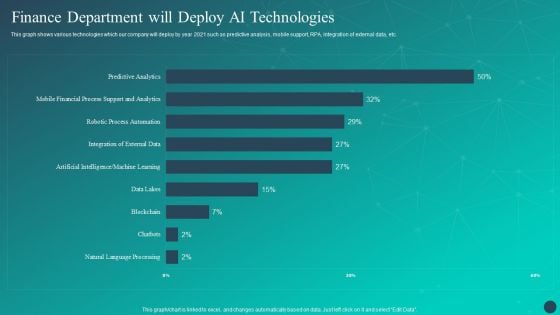
Optimizing AI Strategies To Improve Financial Services Finance Department Will Deploy AI Technologies Professional PDF
This graph shows various technologies which our company will deploy by year 2021 such as predictive analysis, mobile support, RPA, integration of external data, etc. There are so many reasons you need a Optimizing AI Strategies To Improve Financial Services Finance Department Will Deploy AI Technologies Professional PDF. The first reason is you can not spend time making everything from scratch, Thus, Slidegeeks has made presentation templates for you too. You can easily download these templates from our website easily.
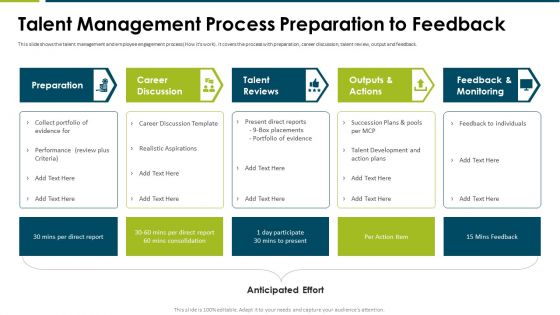
Impact Employee Engagement Strategies Organization Talent Management Process Sample PDF
This slide shows talent management and employee engagement planning phases and overview such as define and identify workforce, conduct supply analysis, conduct demand and gap analysis, etc. This is a impact employee engagement strategies organization talent management process sample pdf template with various stages. Focus and dispense information on four stages using this creative set, that comes with editable features. It contains large content boxes to add your information on topics like define and identify workforce, conduct supply analysis, implement workforce planning. You can also showcase facts, figures, and other relevant content using this PPT layout. Grab it now.

Consumer Segmentation And Monitoring Dashboard Mockup Pdf
This slide showcases a dashboard for customer segmentation based on recency, frequency and monetary analysis. It includes key segments such as loyalist, potential, churn, lost and potential. Showcasing this set of slides titled Consumer Segmentation And Monitoring Dashboard Mockup Pdf. The topics addressed in these templates are Consumer Segmentation, Monitoring Dashboard, Potential, Churn. All the content presented in this PPT design is completely editable. Download it and make adjustments in color, background, font etc. as per your unique business setting. This slide showcases a dashboard for customer segmentation based on recency, frequency and monetary analysis. It includes key segments such as loyalist, potential, churn, lost and potential.
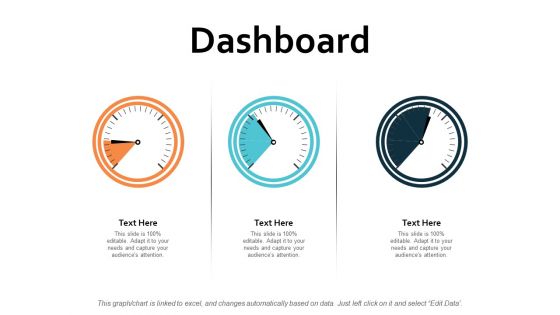
Dashboard Finance Ppt PowerPoint Presentation Infographic Template Graphic Tips
This is a dashboard finance ppt powerpoint presentation infographic template graphic tips. This is a three stage process. The stages in this process are dashboard, finance, analysis, business, investment.
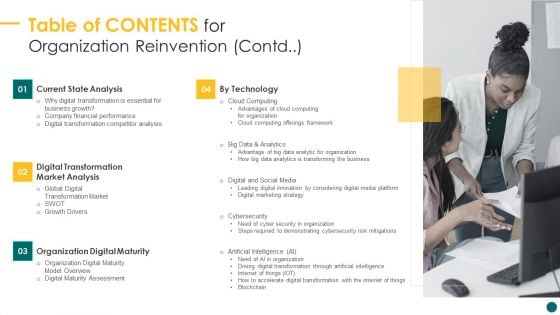
Table Of Contents For Organization Reinvention Contd Diagrams PDF
Presenting Table Of Contents For Organization Reinvention Contd Diagrams PDF to provide visual cues and insights. Share and navigate important information on four stages that need your due attention. This template can be used to pitch topics like Current State Analysis, Organization Digital Maturity, Market Analysis. In addtion, this PPT design contains high resolution images, graphics, etc, that are easily editable and available for immediate download.
Compliance Testing IT Conformance Testing Performance Tracking Dashboard Introduction PDF
This slide depicts the conformance testing performance tracking dashboard by covering details of test case analysis, tests linked to requirements, test case breakdown, tests per requirement, and so on. Deliver and pitch your topic in the best possible manner with this Compliance Testing IT Conformance Testing Performance Tracking Dashboard Introduction PDF. Use them to share invaluable insights on Requirements, Analysis, Resources and impress your audience. This template can be altered and modified as per your expectations. So, grab it now.
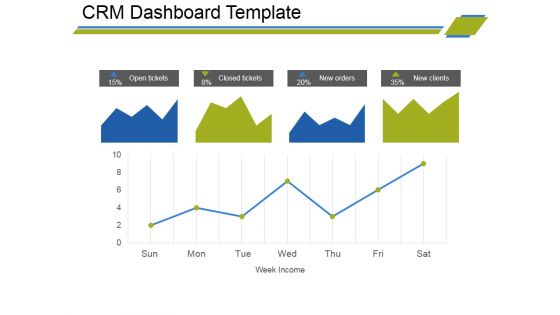
Crm Dashboard Template Ppt PowerPoint Presentation Gallery Ideas
This is a crm dashboard template ppt powerpoint presentation gallery ideas. This is a four stage process. The stages in this process are area chart, growth, strategy, business, analysis.
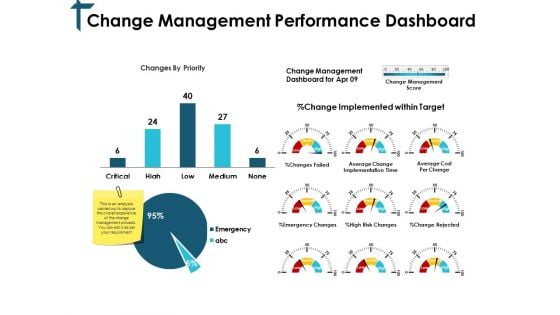
Change Management Performance Dashboard Ppt PowerPoint Presentation Professional Slides
This is a change management performance dashboard ppt powerpoint presentation professional slides. This is a three stage process. The stages in this process are finance, marketing, management, investment, analysis.
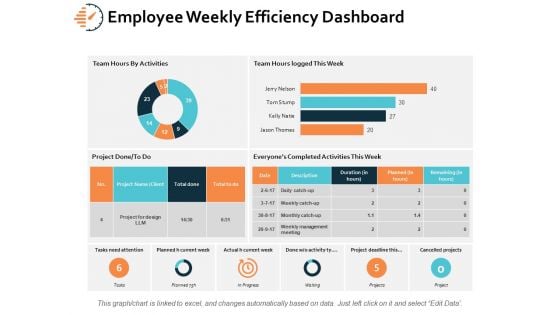
Employee Weekly Efficiency Dashboard Ppt PowerPoint Presentation Infographics Microsoft
This is a employee weekly efficiency dashboard ppt powerpoint presentation infographics microsoft. This is a six stage process. The stages in this process are finance, analysis, business, investment, marketing.
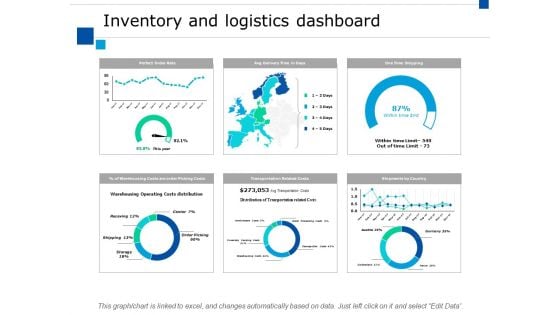
Inventory And Logistics Dashboard Ppt PowerPoint Presentation Professional Styles
This is a inventory and logistics dashboard ppt powerpoint presentation professional styles. This is a four stage process. The stages in this process are finance, marketing, management, investment, analysis.
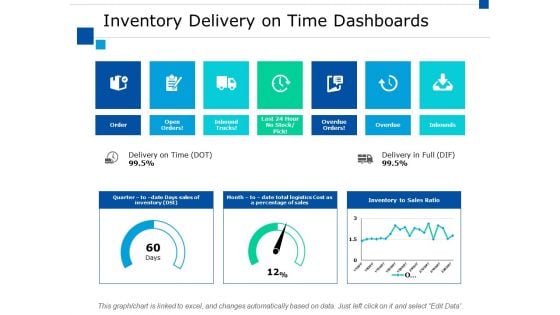
Inventory Delivery On Time Dashboards Ppt PowerPoint Presentation Slides Download
This is a inventory delivery on time dashboards ppt powerpoint presentation slides download. This is a seven stage process. The stages in this process are finance, marketing, management, investment, analysis.
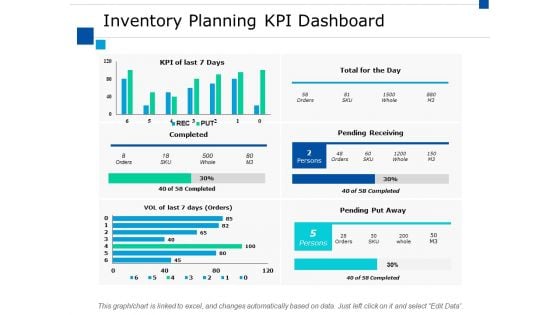
Inventory Planning Kpi Dashboard Ppt PowerPoint Presentation Summary Layout Ideas
This is a inventory planning kpi dashboard ppt powerpoint presentation summary layout ideas. This is a two stage process. The stages in this process are finance, marketing, management, investment, analysis.

Quality Control Kpi Dashboard Ppt PowerPoint Presentation Slides Topics
This is a quality control kpi dashboard ppt powerpoint presentation slides topics. This is a four stage process. The stages in this process are finance, marketing, management, investment, analysis.
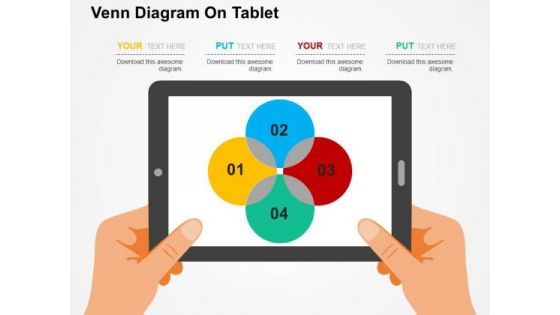
Venn Diagram On Tablet PowerPoint Template
Adjust the above image into your Presentations to visually support your content. This slide has been professionally designed with Venn diagram. This template offers an excellent background to display financial analysis.
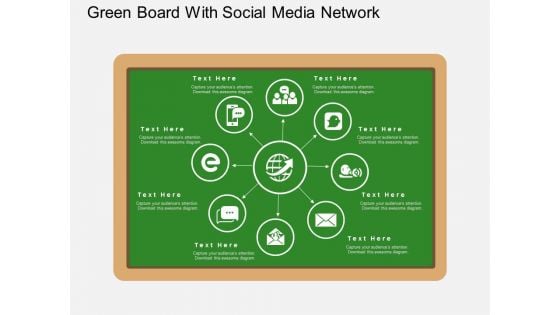
Green Board With Social Media Network PowerPoint Template
The feeling of a being a student makes everyone feel young and energetic. You too can make your audience feel so by including this creatively designed PowerPoint template in your presentation. The slide has been created by the designers keeping in mind the attentive and conscientious atmosphere that a classroom has to offer. The board can be edited to carry a chart or details about the subject of your presentation. The slide has a well-defined chart which can explain departments of an organization or products of a process. The included icons were made keeping in mind the unavoidable social media which is now an important factor even for big businesses and corporate houses. The slide can be a perfect fit in presentations meant for student seminars or e-learning educational presentations. It can also be well used to define the role of technology and communication in today?s time. The slide is customizable and you can include relevant information and icons on the board as per your requirement.

Combo Chart Ppt PowerPoint Presentation Infographic Template Themes
This is a combo chart ppt powerpoint presentation infographic template themes. This is a eight stage process. The stages in this process are combo chart, finance, marketing, strategy, analysis, business.
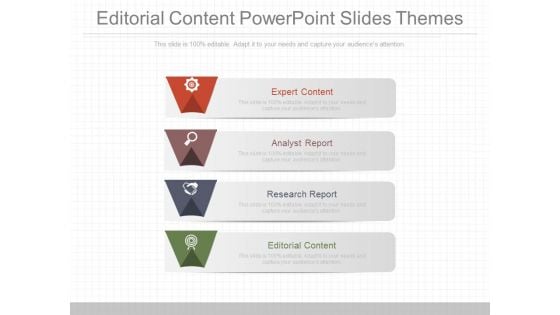
Editorial Content Powerpoint Slides Themes
This is a editorial content powerpoint slides themes. This is a six stage process. The stages in this process are career and succession planning, development plans, assessment tools and process, competency matrix, performance appraisal analysis, career and succession planning.
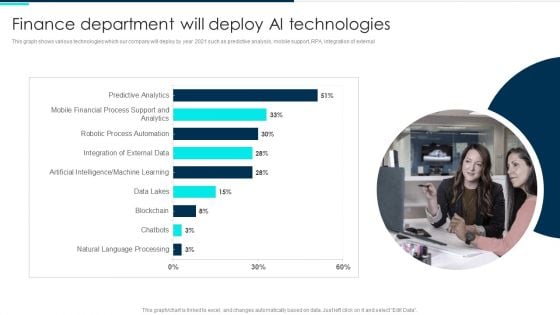
Finance Department Will Deploy Ai Technologies Deploying Artificial Intelligence In Business Topics PDF
This graph shows various technologies which our company will deploy by year 2021 such as predictive analysis, mobile support, RPA, integration of external data, etc.Deliver an awe inspiring pitch with this creative Finance Department Will Deploy Ai Technologies Deploying Artificial Intelligence In Business Topics PDF bundle. Topics like Natural Language, Blockchain, Artificial Intelligence can be discussed with this completely editable template. It is available for immediate download depending on the needs and requirements of the user.
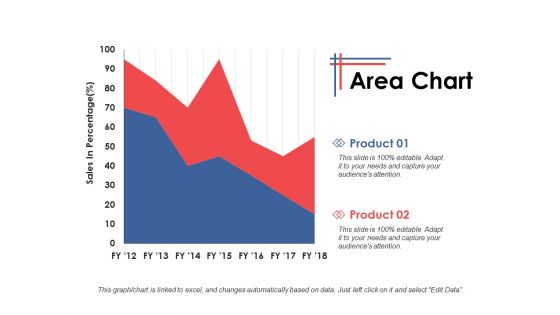
Area Chart Growth Strategy Ppt PowerPoint Presentation Infographics Themes
This is a area chart growth strategy ppt powerpoint presentation infographics themes. This is a two stage process. The stages in this process are finance, marketing, management, investment, analysis.

Techniques Of Effective International Sourcing Strategy Themes PDF
This slide consists of the techniques used for an effective strategy to source globally for getting cost effective manufacturing goods. It includes make or buy analysis, cost acquisition evaluation, supply base rationalization, etc. Presenting Techniques Of Effective International Sourcing Strategy Themes PDF to dispense important information. This template comprises three stages. It also presents valuable insights into the topics including Make Or Buy Analysis, Total Acquisition Cost Analysis, Rationalization. This is a completely customizable PowerPoint theme that can be put to use immediately. So, download it and address the topic impactfully.
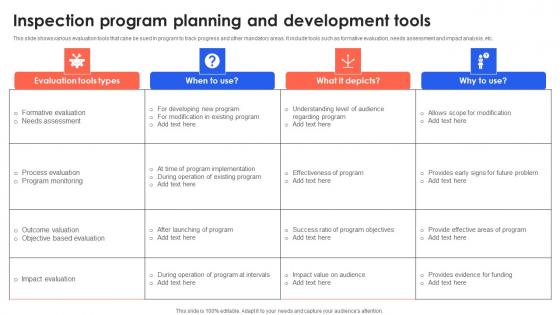
Inspection Program Planning And Development Tools Themes Pdf
This slide shows various evaluation tools that cane be sued in program to track progress and other mandatory areas. It include tools such as formative evaluation, needs assessment and impact analysis, etc.Pitch your topic with ease and precision using this Inspection Program Planning And Development Tools Themes Pdf This layout presents information on Process Evaluation, Program Monitoring, Outcome Valuation It is also available for immediate download and adjustment. So, changes can be made in the color, design, graphics or any other component to create a unique layout. This slide shows various evaluation tools that cane be sued in program to track progress and other mandatory areas. It include tools such as formative evaluation, needs assessment and impact analysis, etc.
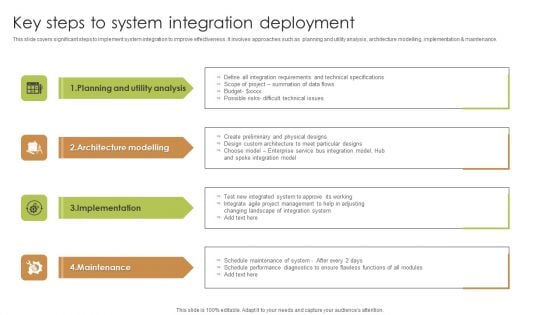
Key Steps To System Integration Deployment Information PDF Structure PDF
This slide covers significant steps to implement system integration to improve effectiveness. It involves approaches such as planning and utility analysis, architecture modelling, implementation and maintenance. Presenting Key Steps To System Integration Deployment Information PDF Structure PDF to dispense important information. This template comprises Four stages. It also presents valuable insights into the topics including Planning And Utility Analysis, Implementation, Maintenance. This is a completely customizable PowerPoint theme that can be put to use immediately. So, download it and address the topic impactfully.
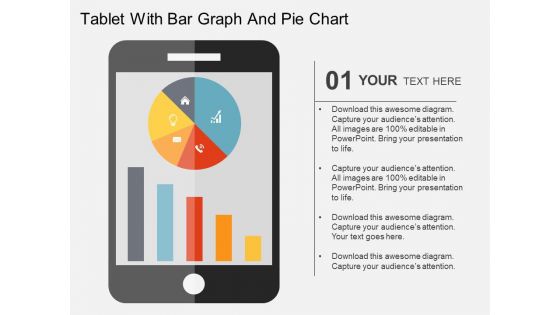
Tablet With Bar Graph And Pie Chart Powerpoint Templates
This business slide has been designed with business graphs on computer tablet. You may download this PPT slide to display statistical analysis. This slide will help you to sequence your thoughts.
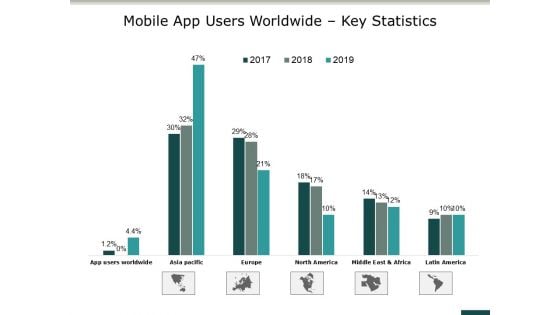
Mobile App Users Worldwide Key Statistics Ppt PowerPoint Presentation File Design Templates
This is a mobile app users worldwide key statistics ppt powerpoint presentation file design templates. This is a three stage process. The stages in this process are finance, marketing, management, investment, analysis.
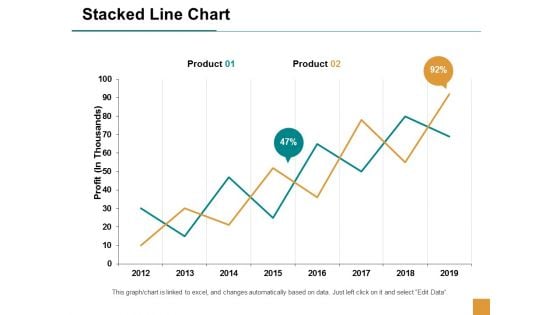
Stacked Line Chart Finance Ppt Powerpoint Presentation Outline Themes
This is a stacked line chart finance ppt powerpoint presentation outline themes. This is a two stage process. The stages in this process are finance, marketing, management, investment, analysis.
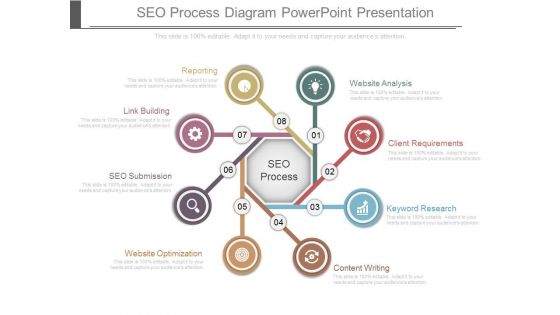
Seo Process Diagram Powerpoint Presentation
This is a seo process diagram powerpoint presentation. This is a eight stage process. The stages in this process are reporting, link building, seo submission, website optimization, content writing, keyword research, client requirements, website analysis, seo process.
4 Phase Overview Of Company Operations Ppt PowerPoint Presentation Template
This is a 4 phase overview of company operations ppt powerpoint presentation template. This is a four stage process. The stages in this process are business, strategy, marketing, analysis, success.
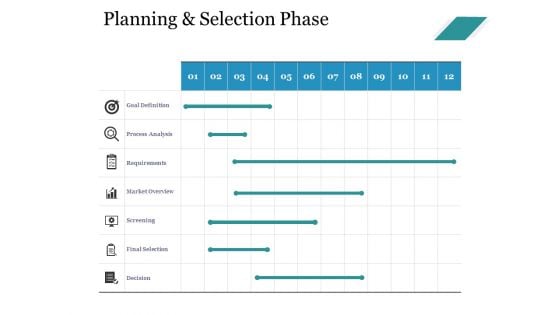
Planning And Selection Phase Ppt PowerPoint Presentation Ideas Infographic Template
This is a planning and selection phase ppt powerpoint presentation ideas infographic template. This is a tweleve stage process. The stages in this process are goal definition, process analysis, requirements, market overview, screening.
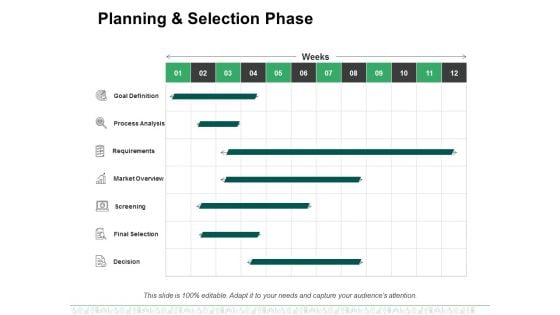
Planning And Selection Phase Ppt PowerPoint Presentation Inspiration Ideas
This is a planning and selection phase ppt powerpoint presentation inspiration ideas. This is a tweleve stage process. The stages in this process are goal definition, process analysis, requirements, market overview, screening.
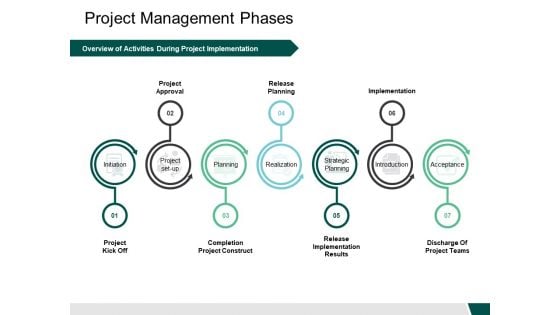
Project Management Phases Release Ppt PowerPoint Presentation Professional Microsoft
This is a project management phases release ppt powerpoint presentation professional microsoft. This is a seven stage process. The stages in this process are business, management, strategy, analysis, marketing.
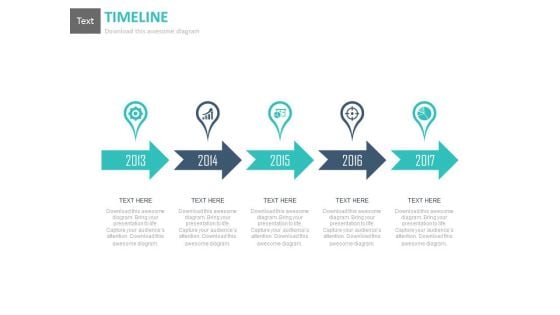
Timeline Linear Arrows Infographic Chart Powerpoint Slides
This timeline slide design can be used for business milestones, growth and progress. It contains linear years tags with icons. This timeline template can be used in presentations where you need to display future planning or it may be used for financial target analysis.
Risk Management For Organization Essential Assets Financial Performance Tracking Dashboard Designs PDF
This slide presents the dashboard which will help firm in tracking the fiscal performance. This dashboard displays revenues and expenses trends and payment received analysis. Deliver an awe inspiring pitch with this creative risk management for organization essential assets financial performance tracking dashboard designs pdf bundle. Topics like receivables analysis, revenue and expense trends can be discussed with this completely editable template. It is available for immediate download depending on the needs and requirements of the user.

Timeline Infographic Chart For Business Agenda Powerpoint Slides
This timeline slide design can be used to display yearly business growth. It contains zigzag business roadmap with icons. This timeline template can be used in presentations where you need to display a roadmap or it may be used for business target analysis.
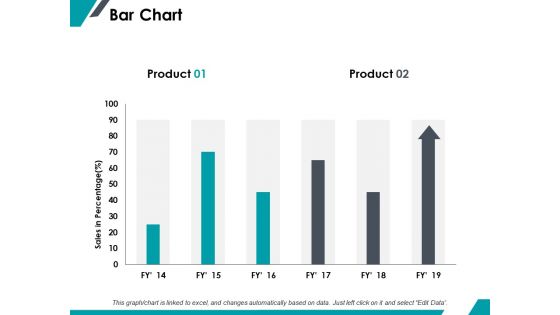
Bar Chart Finance Marketing Ppt PowerPoint Presentation Diagram Images
This is a bar chart finance marketing ppt powerpoint presentation diagram images. The topics discussed in this diagram are finance, marketing, management, investment, analysis. This is a completely editable PowerPoint presentation, and is available for immediate download.
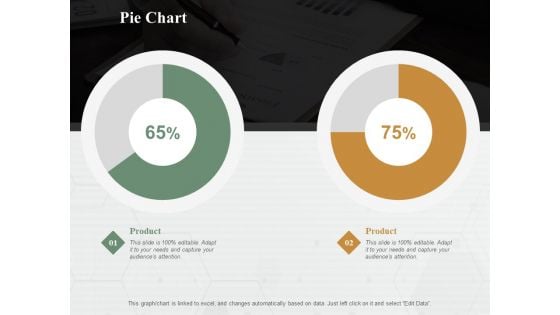
Pie Chart Finance Ppt PowerPoint Presentation Diagram Lists
This is a pie chart finance ppt powerpoint presentation diagram lists. This is a two stage process. The stages in this process are pie chart, finance, marketing, analysis, business.
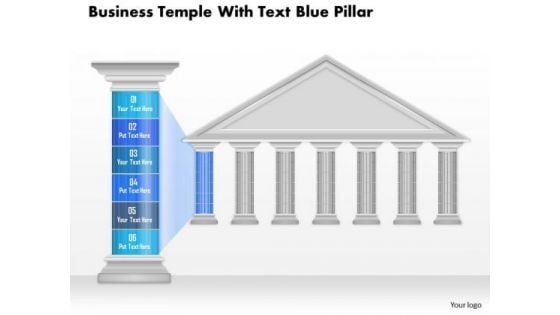
Business Diagram Business Temple With Text Blue Pillar Presentation Template
This business plan power point template has been designed with business temple graphic. This image slide contains the concept of marketing strategies and business plan analysis. Highlight your plans in any business presentations with this unique design.
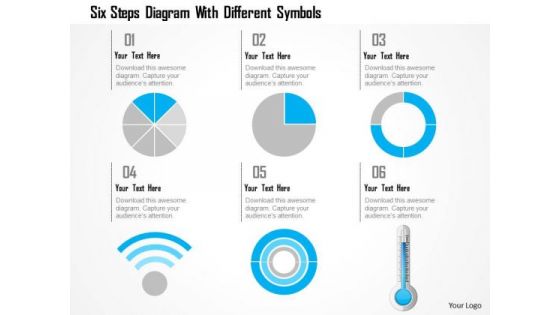
Business Diagram Six Steps Diagram With Different Symbols Presentation Template
This power point template has been crafted with graphic of 3d pie charts with Wi-Fi symbol and thermometer. This PPT contains the concept of calculation and result analysis. Use this PPT for your business and science related presentations.
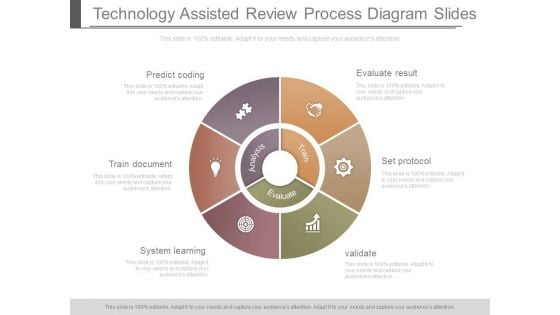
Technology Assisted Review Process Diagram Slides
This is a technology assisted review process diagram slides. This is a six stage process. The stages in this process are predict coding, train document, system learning validate, set protocol, evaluate result, analysis, evaluate, train.
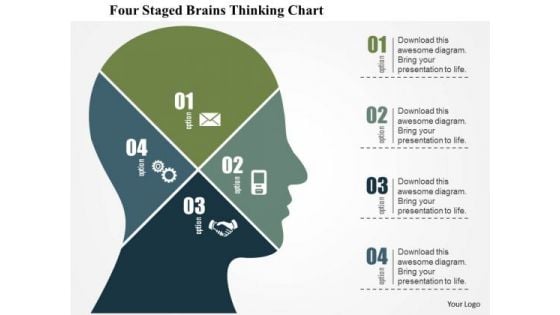
Business Diagram Four Staged Brains Thinking Chart Presentation Template
Graphic of four staged chart in human brain has been used to design this business diagram. This slide depicts concept of thinking process and analysis. Make your presentation more interactive with this business slide.
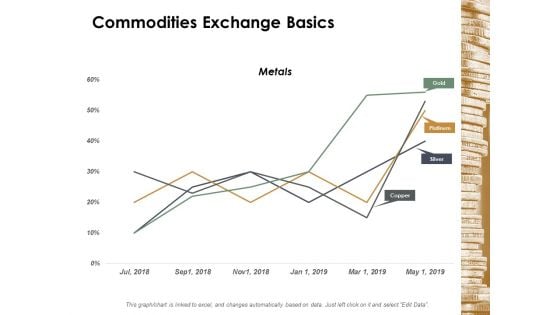
Commodities Exchange Basics Ppt Powerpoint Presentation Diagram Graph Charts
This is a commodities exchange basics ppt powerpoint presentation diagram graph charts. This is a four stage process. The stages in this process are finance, marketing, management, investment, analysis.

Donut Pie Chart Product Finance Ppt PowerPoint Presentation Diagram Ppt
This is a donut pie chart product finance ppt powerpoint presentation diagram ppt. This is a three stage process. The stages in this process are finance, management, strategy, analysis, marketing.
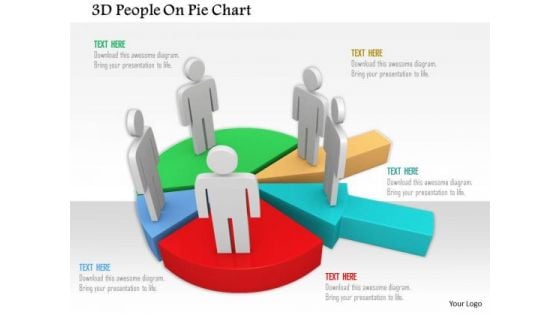
3d People On Pie Chart PowerPoint Templates
This power point diagram has been crafted with graphic of 3d team members on pie chart. This 3d diagram contains the concept of team management and result analysis. Use this diagram to create an impact on your viewers.
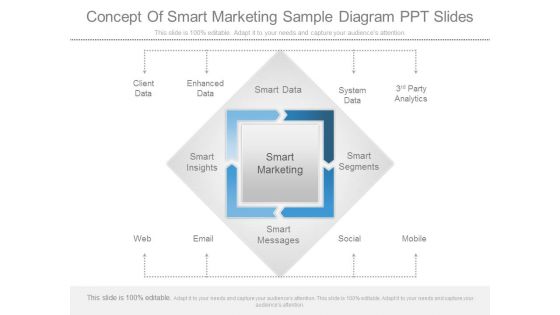
Concept Of Smart Marketing Sample Diagram Ppt Slides
This is a concept of smart marketing sample diagram ppt slides. This is a four stage process. The stages in this process are client data, enhanced data, smart data, system data, party analytics, smart insights, smart marketing, smart segments, web, email, smart messages, social, mobile.
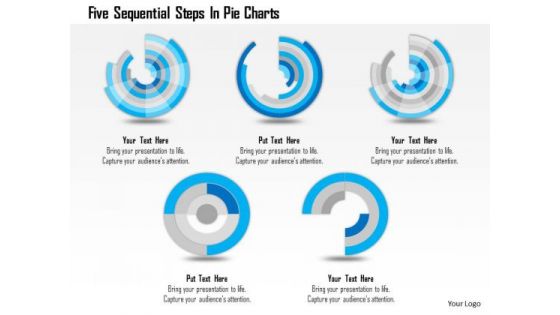
Business Diagram Five Sequential Steps In Pie Charts Presentation Template
Five sequential pie charts are used to craft this power point template. This PPT contains the concept of process flow and result analysis. Use this PPT for your business and sales related presentations and build quality presentation for your viewers.
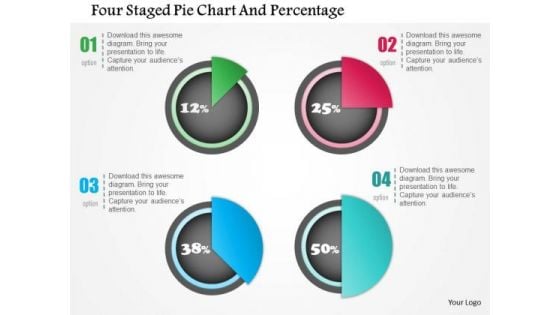
Business Diagram Four Staged Pie Chart And Percentage Presentation Template
Four staged pie chart and percentage values has been used to design this power point template. This PPT contains the concept of financial result analysis. Use this PPT for business and marketing related presentations.
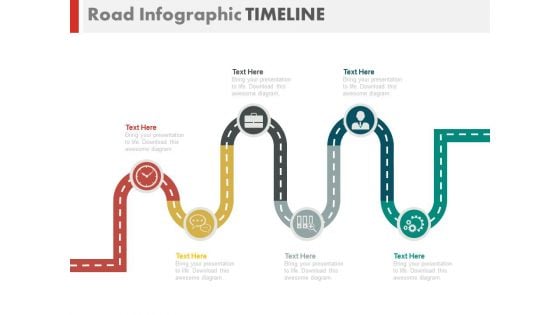
Zigzag Business Roadmap Infographics Powerpoint Slides
This timeline slide design can be used to display yearly business growth. It contains zigzag business roadmap with icons. This timeline template can be used in presentations where you need to display a roadmap or it may be used for business target analysis.
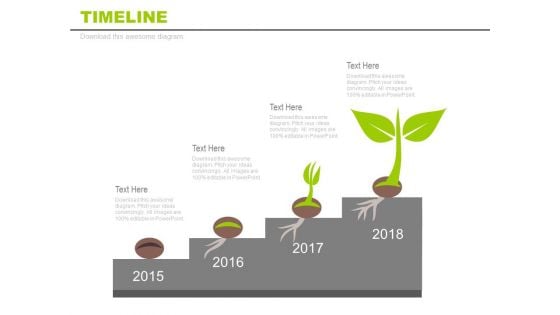
Business Milestones For Growth And Progress Powerpoint Slides
This timeline slide design can be used for business milestones, growth and progress. It contains five linear steps with financial icons. This timeline template can be used in presentations where you need to display a roadmap or it may be used for financial target analysis.
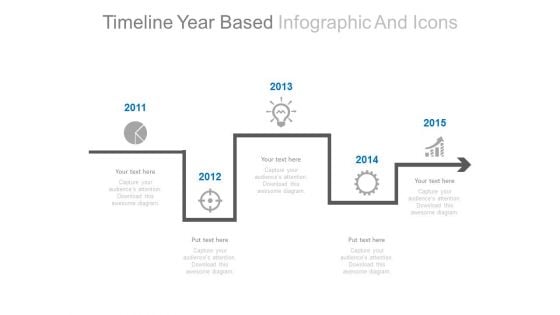
Linear Timeline Year Based Infographic Powerpoint Slides
This timeline slide design can be used to display yearly business growth. It contains zigzag business roadmap with icons. This timeline template can be used in presentations where you need to display a roadmap or it may be used for business target analysis.

Retail KPI Dashboard Showing Revenue Vs Units Sold Ppt PowerPoint Presentation Professional Smartart
This is a retail kpi dashboard showing revenue vs units sold ppt powerpoint presentation professional smartart. This is a four stage process. The stages in this process are finance, analysis, business, investment, marketing.
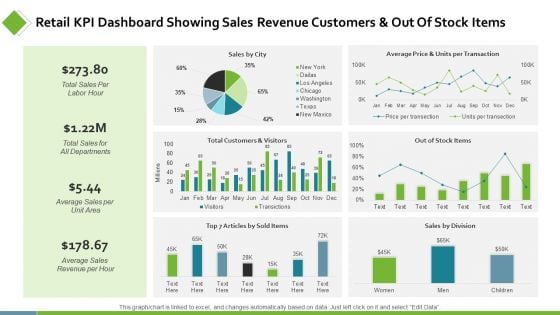
Retail KPI Dashboard Showing Sales Revenue Customers Ppt PowerPoint Presentation Show Background Designs
This is a retail kpi dashboard showing sales revenue customers ppt powerpoint presentation show background designs. This is a six stage process. The stages in this process are finance, analysis, business, investment, marketing.
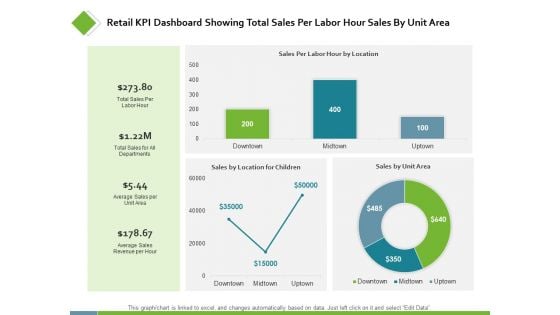
Retail KPI Dashboard Showing Total Sales Per Labor Ppt PowerPoint Presentation Styles Examples
This is a retail kpi dashboard showing total sales per labor ppt powerpoint presentation styles examples. This is a three stage process. The stages in this process are finance, analysis, business, investment, marketing.
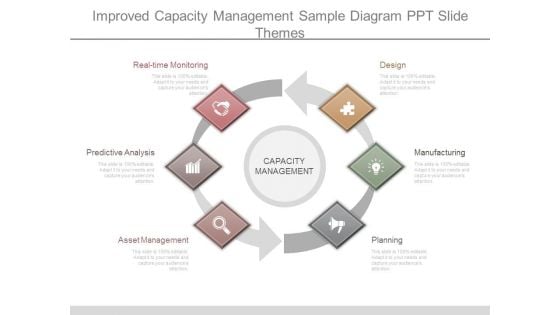
Improved Capacity Management Sample Diagram Ppt Slide Themes
This is a improved capacity management sample diagram ppt slide themes. This is a six stage process. The stages in this process are real time monitoring, predictive analysis, asset management, planning, manufacturing, design, capacity management.
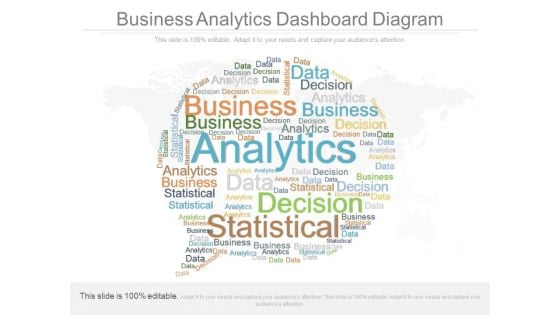
Business Analytics Dashboard Diagram
This is a business analytics dashboard diagram. This is a one stage process. The stages in this process are analytics, decision, data, business, statistics.
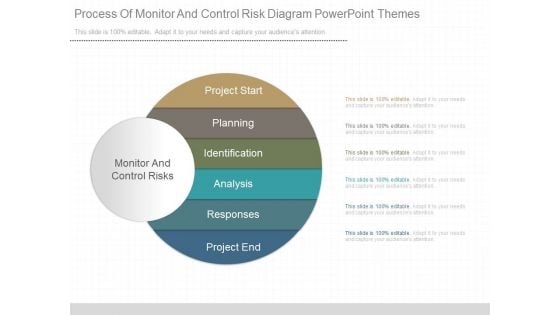
Process Of Monitor And Control Risk Diagram Powerpoint Themes
This is a process of monitor and control risk diagram powerpoint themes. This is a six stage process. The stages in this process are monitor and control risks, project start, planning, identification, analysis, responses, project end.
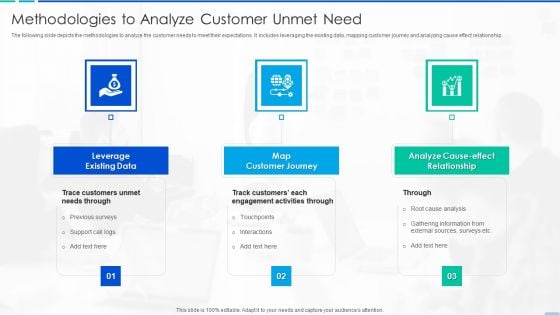
Methodologies To Analyze Customer Unmet Need Mockup PDF
The following slide depicts the methodologies to analyze the customer needs to meet their expectations. It includes leveraging the existing data, mapping customer journey and analyzing cause effect relationship. Presenting methodologies to analyze customer unmet need mockup pdf to dispense important information. This template comprises three stages. It also presents valuable insights into the topics including customers, previous surveys, analysis. This is a completely customizable PowerPoint theme that can be put to use immediately. So, download it and address the topic impactfully.
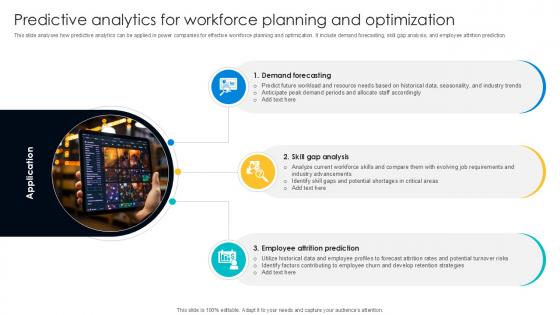
Predictive Analytics For Workforce Digital Transformation Journey PPT Template DT SS V
This slide analyses how predictive analytics can be applied in power companies for effective workforce planning and optimization. It include demand forecasting, skill gap analysis, and employee attrition prediction. Are you searching for a Demand Forecasting, Skill Gap Analysis, Employee Attrition Prediction that is uncluttered, straightforward, and original Its easy to edit, and you can change the colors to suit your personal or business branding. For a presentation that expresses how much effort you have put in, this template is ideal With all of its features, including tables, diagrams, statistics, and lists, its perfect for a business plan presentation. Make your ideas more appealing with these professional slides. Download Demand Forecasting, Skill Gap Analysis, Employee Attrition Prediction from Slidegeeks today. This slide analyses how predictive analytics can be applied in power companies for effective workforce planning and optimization. It include demand forecasting, skill gap analysis, and employee attrition prediction.
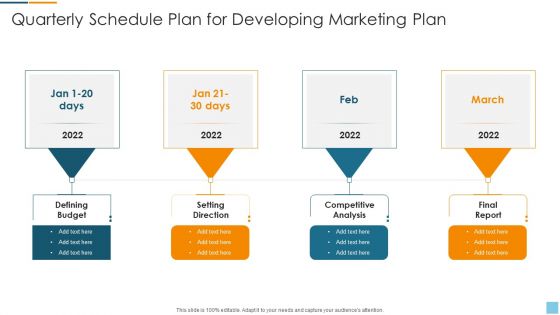
Quarterly Schedule Plan For Developing Marketing Plan Information PDF
Presenting Quarterly Schedule Plan For Developing Marketing Plan Information PDF to dispense important information. This template comprises four stages. It also presents valuable insights into the topics including Setting Direction, Competitive Analysis, Final Report. This is a completely customizable PowerPoint theme that can be put to use immediately. So, download it and address the topic impactfully.
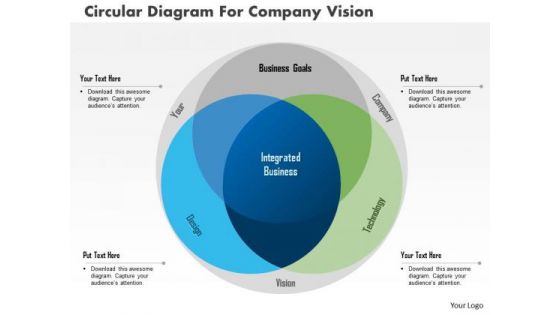
Business Diagram Circular Diagram For Company Vision Presentation Template
This power point template diagram has been crafted with three staged Venn diagram. This PPT contains the concept of future vision and analysis. Use this PPT for your business presentations.
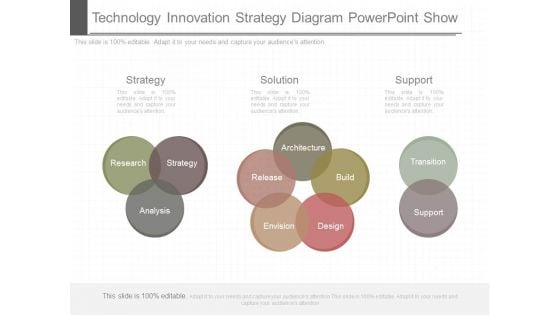
Technology Innovation Strategy Diagram Powerpoint Show
This is a technology innovation strategy diagram powerpoint show. This is a three stage process. The stages in this process are strategy, solution, support, research, strategy, analysis, architecture, release, build, envision, design, transition, support.
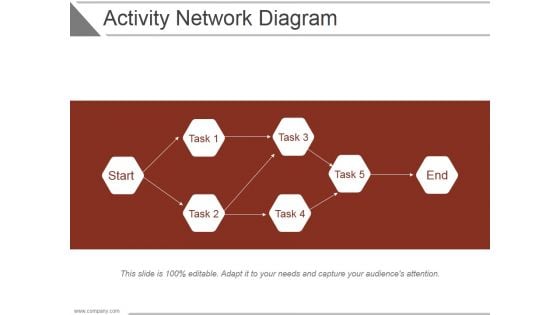
Activity Network Diagram Ppt PowerPoint Presentation Deck
This is a activity network diagram ppt powerpoint presentation deck. This is a five stage process. The stages in this process are business, strategy, analysis, marketing, hexagon, flow process.
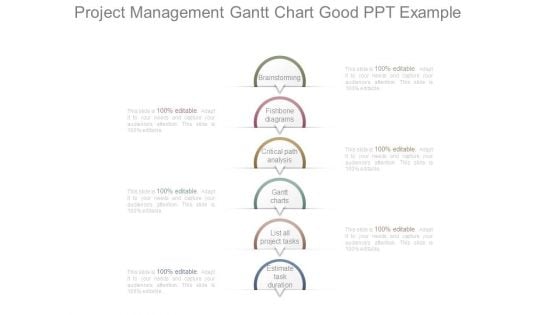
Project Management Gantt Chart Good Ppt Example
This is a project management gantt chart good ppt example. This is a six stage process. The stages in this process are brainstorming, fishbone diagrams, critical path analysis, gantt charts, list all project tasks, estimate task duration.
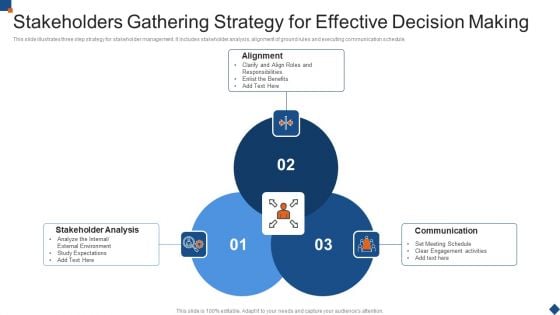
Stakeholders Gathering Strategy For Effective Decision Making Portrait PDF
This slide illustrates three step strategy for stakeholder management. It includes stakeholder analysis, alignment of ground rules and executing communication schedule.Presenting Stakeholders Gathering Strategy For Effective Decision Making Portrait PDF to dispense important information. This template comprises three stages. It also presents valuable insights into the topics including Stakeholder Analysis, Alignment, Communication This is a completely customizable PowerPoint theme that can be put to use immediately. So, download it and address the topic impactfully.
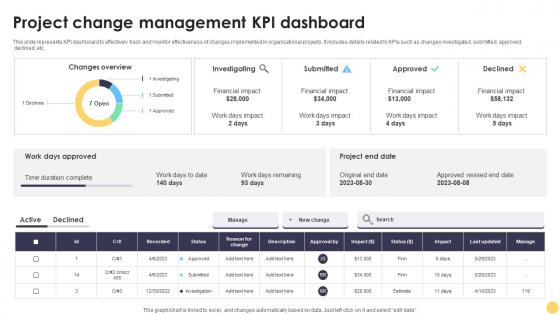
Project Change Management Kpi Dashboard Digital Project Management Strategies
This slide represents KPI dashboard to effectively track and monitor effectiveness of changes implemented in organizational projects. It includes details related to KPIs such as changes investigated, submitted, approved, declined, etc. Do you have to make sure that everyone on your team knows about any specific topic I yes, then you should give Project Change Management Kpi Dashboard Digital Project Management Strategies a try. Our experts have put a lot of knowledge and effort into creating this impeccable Project Change Management Kpi Dashboard Digital Project Management Strategies. You can use this template for your upcoming presentations, as the slides are perfect to represent even the tiniest detail. You can download these templates from the Slidegeeks website and these are easy to edit. So grab these today This slide represents KPI dashboard to effectively track and monitor effectiveness of changes implemented in organizational projects. It includes details related to KPIs such as changes investigated, submitted, approved, declined, etc.
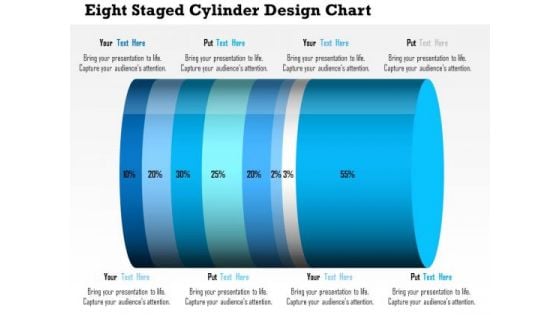
Business Daigram Eight Staged Cylinder Design Chart Presentation Templets
This business diagram contains eight staged cylinder design chart with percentage ratio. Download this diagram to display financial analysis. Use this diagram to make business and marketing related presentations.
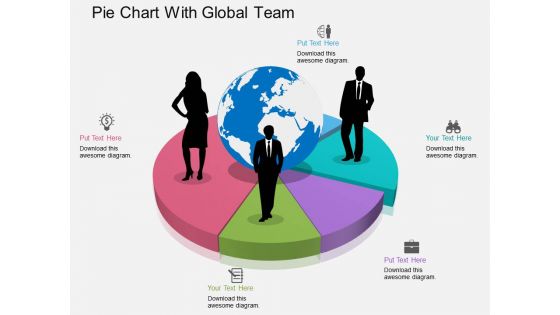
Pie Chart With Global Team Powerpoint Template
This PowerPoint template has been designed with graphics of pie chart with global team. This diagram can be used to display team performance and analysis. Capture the attention of your audience with this slide.
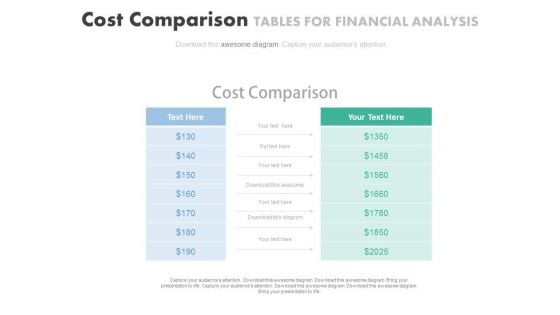
Cost Comparison Table Chart Powerpoint Slides
Our above PPT slide displays cost comparison table chart. This diagram may be used to display cost comparison and financial analysis. Download this PowerPoint template to leave permanent impression on your audience.
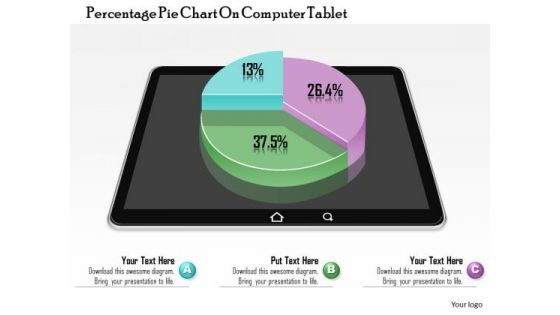
Business Diagram Percentage Pie Chart On Computer Tablet Presentation Slide Template
This business diagram power point template has been designed with graphic of pie chart. This pie chart contains the various percentage values for business result analysis. Use this pie chart for your business result display related presentations.

Monthly Project Status Report Dashboard To Monitor Work Progress PPT Template SS
The slide shows a dashboard for project progress management. It includes gross margin, billing utilization, invoiced, active users, scope delivered, quality, risks, etc. There are so many reasons you need a Monthly Project Status Report Dashboard To Monitor Work Progress PPT Template SS. The first reason is you can not spend time making everything from scratch, Thus, Slidegeeks has made presentation templates for you too. You can easily download these templates from our website easily. The slide shows a dashboard for project progress management. It includes gross margin, billing utilization, invoiced, active users, scope delivered, quality, risks, etc.
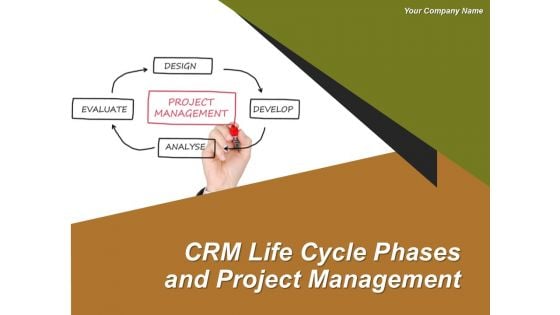
Crm Life Cycle Phases And Project Management Ppt PowerPoint Presentation Complete Deck With Slides
This is a crm life cycle phases and project management ppt powerpoint presentation complete deck with slides. This is a one stage process. The stages in this process are project management, business, marketing, success, analysis.
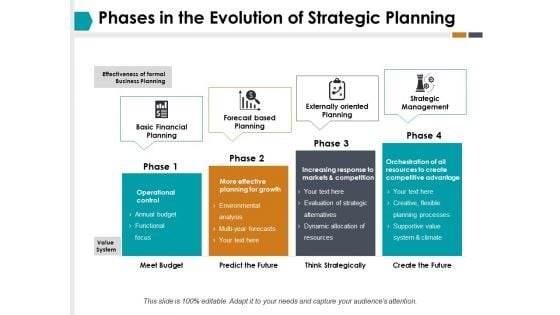
Phases In The Evolution Of Strategic Planning Ppt PowerPoint Presentation Professional Graphics Design
This is a phases in the evolution of strategic planning ppt powerpoint presentation professional graphics design. This is a four stage process. The stages in this process are annual budget, environmental analysis, strategic management, externally oriented planning, operational control.
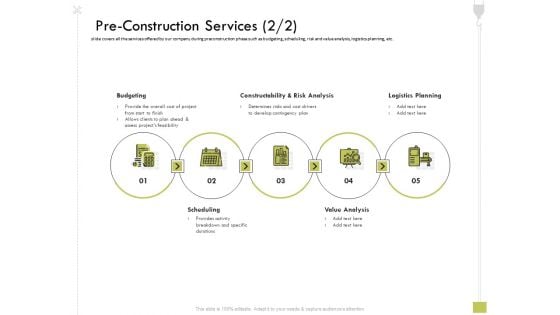
Civil Contractors Pre Construction Services Budgeting Ppt Show Images PDF
slide covers all the services offered by our company during preconstruction phase such as budgeting, scheduling, risk and value analysis, logistics planning, etc. Presenting civil contractors pre construction services budgeting ppt show images pdf to provide visual cues and insights. Share and navigate important information on five stages that need your due attention. This template can be used to pitch topics like budgeting, constructability and risk analysis, logistics planning, value analysis, pre construction services. In addtion, this PPT design contains high-resolution images, graphics, etc, that are easily editable and available for immediate download.
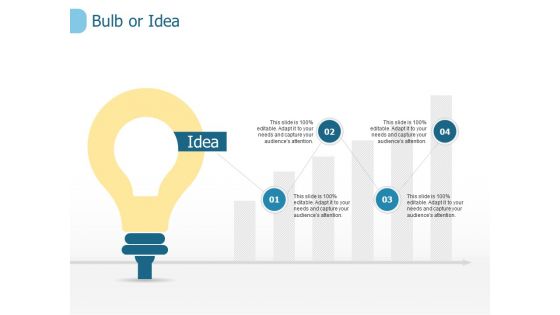
Bulb Or Idea Technology Ppt PowerPoint Presentation Model Elements
This is a bulb or idea technology ppt powerpoint presentation model elements. The topics discussed in this diagram are finance, marketing, analysis, investment, management. This is a completely editable PowerPoint presentation, and is available for immediate download.
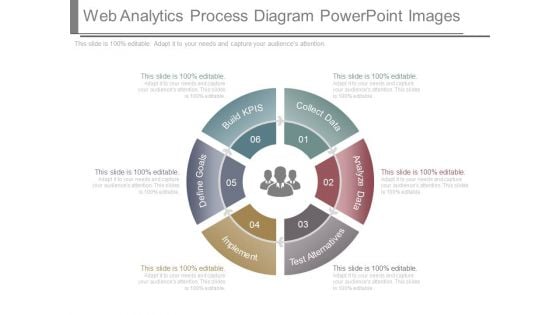
Web Analytics Process Diagram Powerpoint Images
This is a web analytics process diagram powerpoint images. This is a six stage process. The stages in this process are build kpis, define goals, implement, test alternatives, analyze data, collect data.
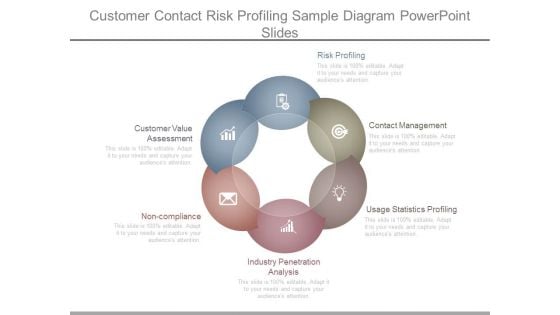
Customer Contact Risk Profiling Sample Diagram Powerpoint Slides
This is a customer contact risk profiling sample diagram powerpoint slides. This is a six stage process. The stages in this process are risk profiling, contact management, usage statistics profiling, industry penetration analysis, non compliance, customer value assessment.
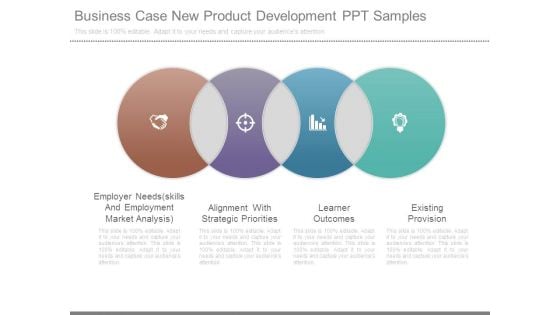
Business Case New Product Development Ppt Samples
This is a business case new product development ppt samples. This is a four stage process. The stages in this process are employer needs skills and employment market analysis, alignment with strategic priorities, learner outcomes, existing provision.
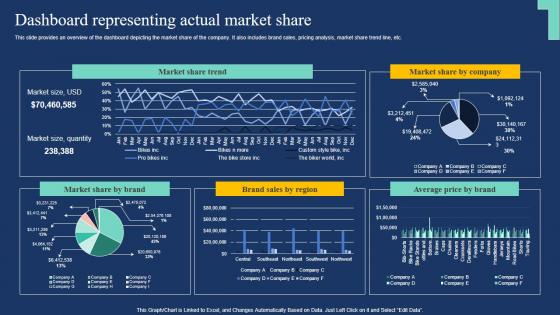
Dashboard Representing Actual Market Share Market Expansion Tactic Topics Pdf
This slide provides an overview of the dashboard depicting the market share of the company. It also includes brand sales, pricing analysis, market share trend line, etc. If your project calls for a presentation, then Slidegeeks is your go-to partner because we have professionally designed, easy-to-edit templates that are perfect for any presentation. After downloading, you can easily edit Dashboard Representing Actual Market Share Market Expansion Tactic Topics Pdf and make the changes accordingly. You can rearrange slides or fill them with different images. Check out all the handy templates This slide provides an overview of the dashboard depicting the market share of the company. It also includes brand sales, pricing analysis, market share trend line, etc.
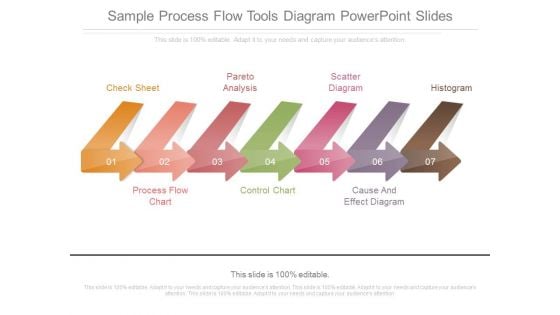
Sample Process Flow Tools Diagram Powerpoint Slides
This is a sample process flow tools diagram powerpoint slides. This is a seven stage process. The stages in this process are check sheet, process flow chart, pareto analysis, control chart, scatter diagram, cause and effect diagram, histogram.
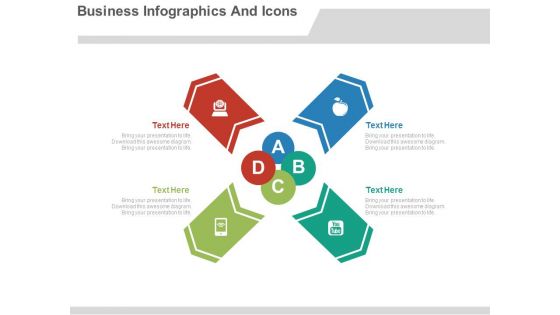
Business Infographics Theme Design Powerpoint Slides
This PPT slide has been designed with circular arrows infographic diagram. This business diagram is suitable for marketing research and analysis. This professional slide helps in making an instant impact on viewers.
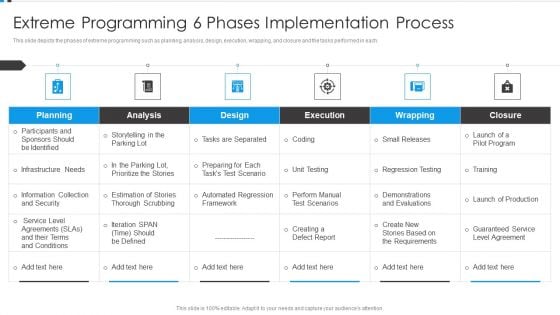
Agile Development Approach IT Extreme Programming 6 Phases Implementation Professional PDF
This slide depicts the phases of extreme programming such as planning, analysis, design, execution, wrapping, and closure and the tasks performed in each. Deliver and pitch your topic in the best possible manner with this Agile Development Approach IT Extreme Programming 6 Phases Implementation Professional PDF. Use them to share invaluable insights on Analysis, Planning, Design, Execution, Wrapping and impress your audience. This template can be altered and modified as per your expectations. So, grab it now.
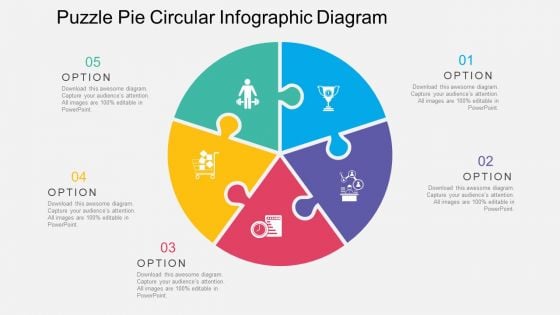
Puzzle Pie Circular Infographic Diagram Powerpoint Templates
Our above PPT slide display puzzle pie circular Infographic. Download this diagram slide to display strategy and analysis. Adjust the above diagram in your business presentations to visually support your content.
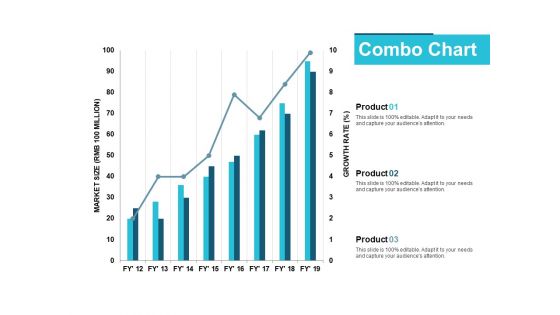
Combo Chart Finance Ppt PowerPoint Presentation Infographic Template Model
This is a combo chart finance ppt powerpoint presentation infographic template model. The topics discussed in this diagram are finance, marketing, management, investment, analysis. This is a completely editable PowerPoint presentation, and is available for immediate download.
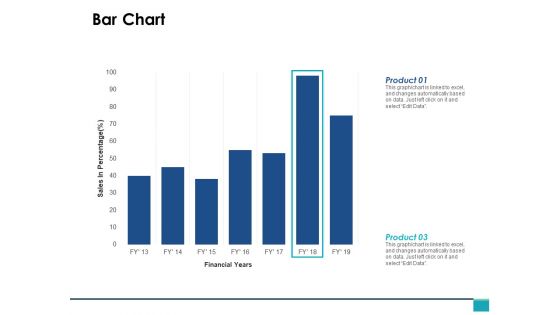
Bar Chart Finance Marketing Ppt PowerPoint Presentation Portfolio Pictures
This is a bar chart finance marketing ppt powerpoint presentation portfolio pictures. The topics discussed in this diagram are finance, marketing, management, investment, analysis. This is a completely editable PowerPoint presentation, and is available for immediate download.
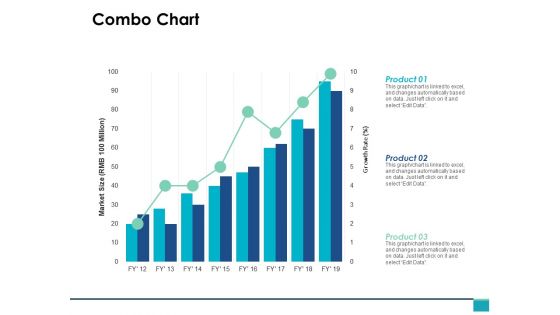
Combo Chart Management Investment Ppt PowerPoint Presentation Inspiration Maker
This is a combo chart management investment ppt powerpoint presentation inspiration maker. The topics discussed in this diagram are finance, marketing, management, investment, analysis. This is a completely editable PowerPoint presentation, and is available for immediate download.
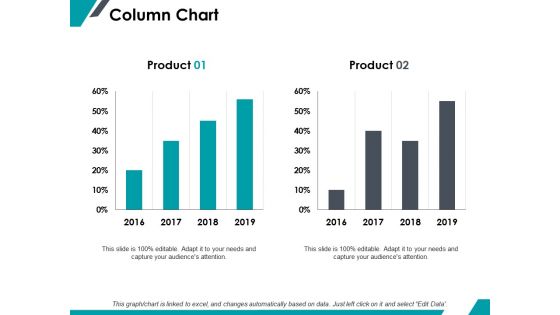
Column Chart Investment Ppt PowerPoint Presentation Pictures Inspiration
This is a column chart investment ppt powerpoint presentation pictures inspiration. The topics discussed in this diagram are finance, marketing, management, investment, analysis. This is a completely editable PowerPoint presentation, and is available for immediate download.
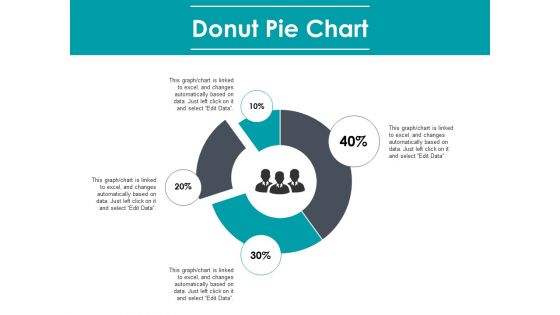
Donut Pie Chart Finance Marketing Ppt PowerPoint Presentation Layouts Ideas
This is a donut pie chart finance marketing ppt powerpoint presentation layouts ideas. The topics discussed in this diagram are finance, marketing, management, investment, analysis. This is a completely editable PowerPoint presentation, and is available for immediate download.
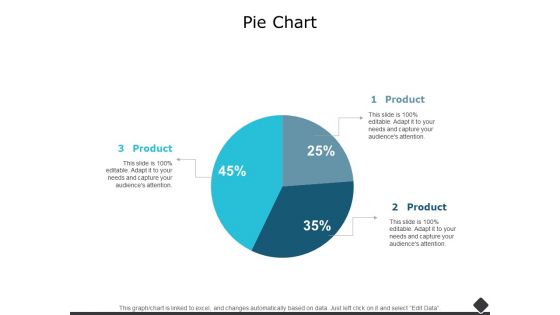
Pie Chart Finance Marketing Ppt PowerPoint Presentation Professional Design Ideas
This is a pie chart finance marketing ppt powerpoint presentation professional design ideas. The topics discussed in this diagram are finance, marketing, management, investment, analysis. This is a completely editable PowerPoint presentation, and is available for immediate download.
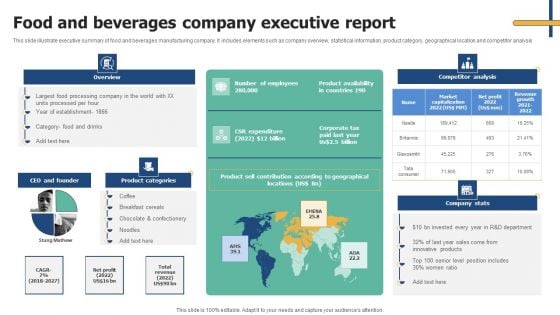
Food And Beverages Company Executive Report Slides PDF
This slide illustrate executive summary of food and beverages manufacturing company. It includes elements such as company overview, statistical information, product category, geographical location and competitor analysis. Presenting Food And Beverages Company Executive Report Slides PDF to dispense important information. This template comprises one stages. It also presents valuable insights into the topics including CEO And Founder, Product Categories, Competitor Analysis. This is a completely customizable PowerPoint theme that can be put to use immediately. So, download it and address the topic impactfully.

The Digital Project Managers Project Change Management Kpi Dashboard
This slide represents KPI dashboard to effectively track and monitor effectiveness of changes implemented in organizational projects. It includes details related to KPIs such as changes investigated, submitted, approved, declined, etc. This The Digital Project Managers Project Change Management Kpi Dashboard from Slidegeeks makes it easy to present information on your topic with precision. It provides customization options, so you can make changes to the colors, design, graphics, or any other component to create a unique layout. It is also available for immediate download, so you can begin using it right away. Slidegeeks has done good research to ensure that you have everything you need to make your presentation stand out. Make a name out there for a brilliant performance. This slide represents KPI dashboard to effectively track and monitor effectiveness of changes implemented in organizational projects. It includes details related to KPIs such as changes investigated, submitted, approved, declined, etc.
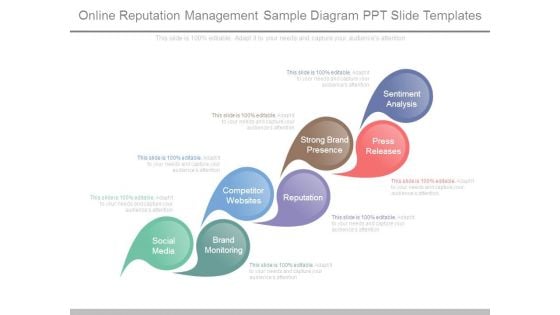
Online Reputation Management Sample Diagram Ppt Slide Templates
This is a online reputation management sample diagram ppt slide templates. This is a seven stage process. The stages in this process are sentiment analysis, press releases, strong brand presence, reputation, competitor websites, brand monitoring, social media.
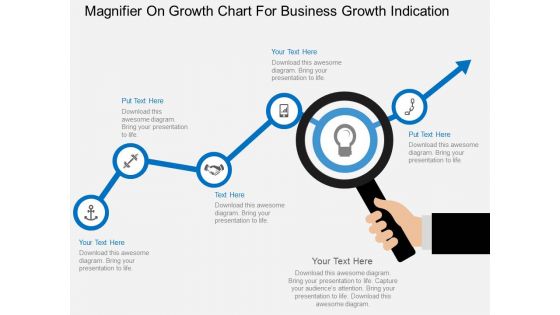
Magnifier On Growth Chart For Business Growth Indication Powerpoint Template
This business slide contains graphics of magnifier on growth chart. This PowerPoint template helps to display business planning and analysis. Use this diagram to impart more clarity to concept and to create more sound impact on viewers.
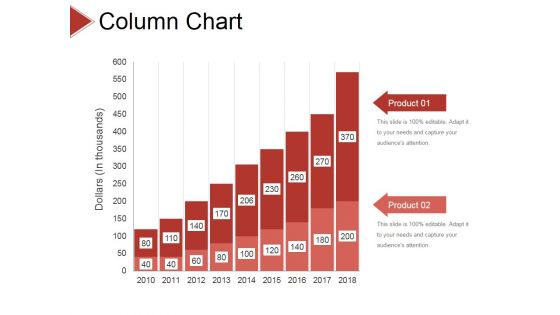
Column Chart Ppt PowerPoint Presentation Gallery Layouts
This is a column chart ppt powerpoint presentation gallery layouts. This is a two stage process. The stages in this process are business, strategy, analysis, pretention, chart and graph, growth.
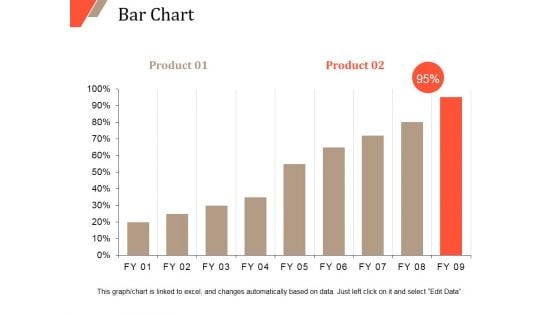
Bar Chart Ppt PowerPoint Presentation Outline Infographics
This is a bar chart ppt powerpoint presentation outline infographics. This is a two stage process. The stages in this process are bar chart, finance, marketing, strategy, analysis, business.
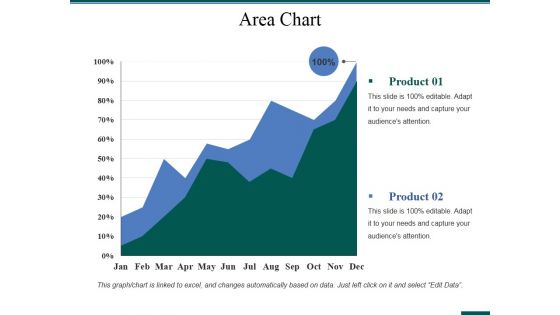
Area Chart Ppt PowerPoint Presentation Pictures Slideshow
This is a area chart ppt powerpoint presentation pictures slideshow. This is a two stage process. The stages in this process are area chart, finance, analysis, marketing, strategy, business.
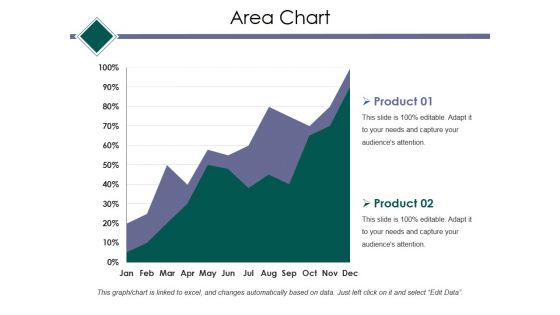
Area Chart Ppt PowerPoint Presentation Model Layout
This is a area chart ppt powerpoint presentation model layout. This is a two stage process. The stages in this process are area chart, finance, marketing, strategy, analysis, business.
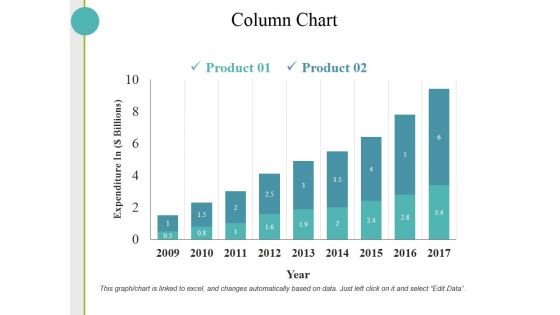
Column Chart Ppt PowerPoint Presentation Pictures Outfit
This is a column chart ppt powerpoint presentation pictures outfit. This is a two stage process. The stages in this process are column chart, finance, marketing, strategy, analysis, business.
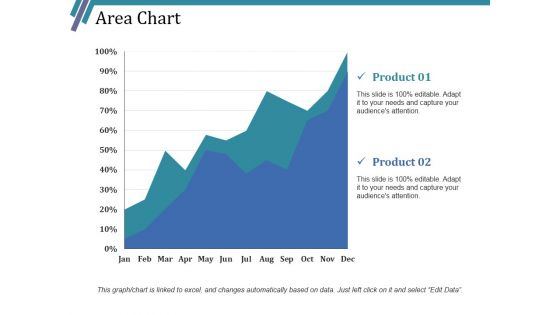
Area Chart Ppt PowerPoint Presentation Styles Templates
This is a area chart ppt powerpoint presentation styles templates. This is a two stage process. The stages in this process are area chart, growth, finance, marketing, strategy, analysis.
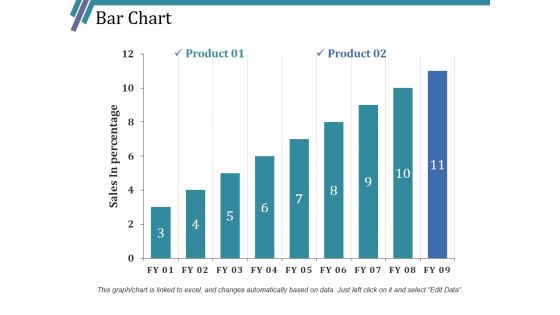
Bar Chart Ppt PowerPoint Presentation Styles Smartart
This is a bar chart ppt powerpoint presentation styles smartart. This is a two stage process. The stages in this process are bar chart, growth, finance, marketing, strategy, analysis.
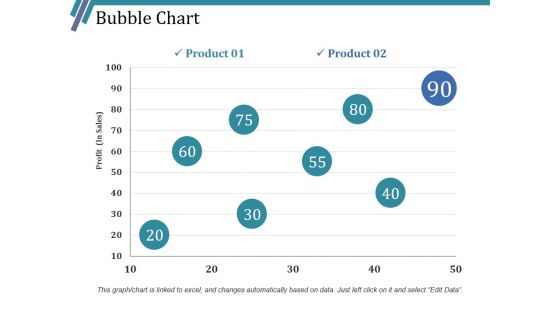
Bubble Chart Ppt PowerPoint Presentation Inspiration Picture
This is a bubble chart ppt powerpoint presentation inspiration picture. This is a two stage process. The stages in this process are bubble chart, growth, finance, marketing, strategy, analysis.
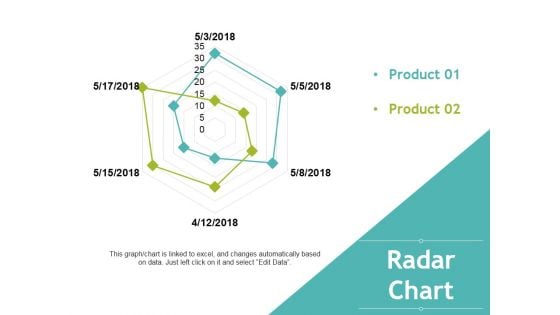
Radar Chart Ppt PowerPoint Presentation Professional Brochure
This is a radar chart ppt powerpoint presentation professional brochure. This is a two stage process. The stages in this process are radar chart, finance, marketing, strategy, analysis, business.
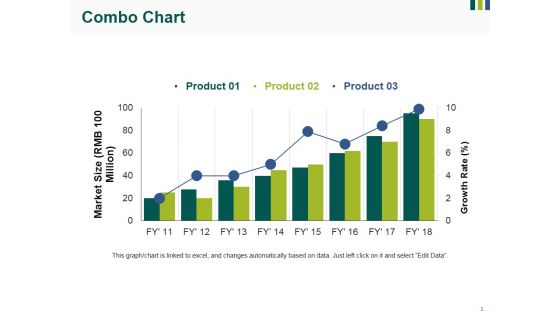
Combo Chart Ppt PowerPoint Presentation Inspiration Vector
This is a combo chart ppt powerpoint presentation inspiration vector. This is a three stage process. The stages in this process are combo chart, finance, marketing, strategy, analysis, business.
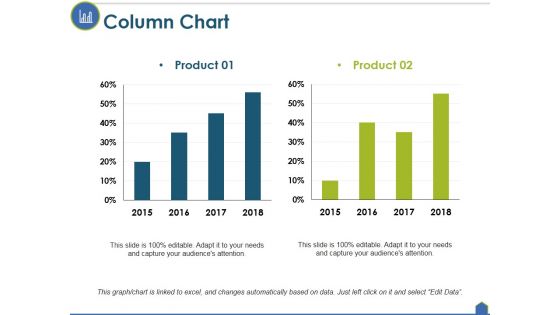
Column Chart Ppt PowerPoint Presentation Inspiration Good
This is a column chart ppt powerpoint presentation inspiration good. This is a two stage process. The stages in this process are column chart, finance, marketing, strategy, analysis, business.

 Home
Home