Data Analysis Icon
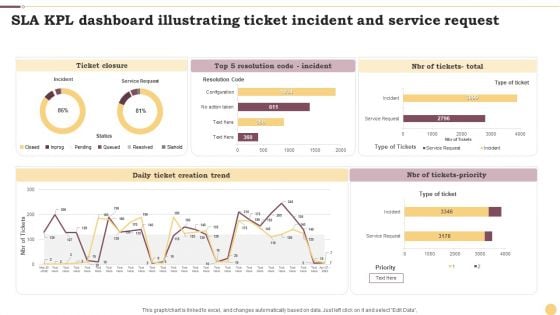
SLA KPL Dashboard Illustrating Ticket Incident And Service Request Ppt File Portrait PDF
This graph or chart is linked to excel, and changes automatically based on data. Just left click on it and select Edit Data. Showcasing this set of slides titled SLA KPL Dashboard Illustrating Ticket Incident And Service Request Ppt File Portrait PDF. The topics addressed in these templates are Ticket Closure, Daily Ticket, Creation Trend, NBR Tickets Priority. All the content presented in this PPT design is completely editable. Download it and make adjustments in color, background, font etc. as per your unique business setting.
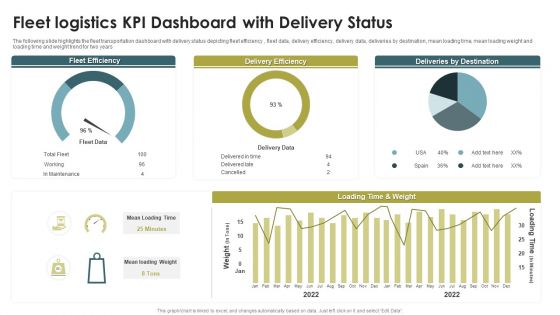
Fleet Logistics KPI Dashboard With Delivery Status Ppt Model Guide PDF
The following slide highlights the fleet transportation dashboard with delivery status depicting fleet efficiency , fleet data, delivery efficiency, delivery data, deliveries by destination, mean loading time, mean loading weight and loading time and weight trend for two years. Pitch your topic with ease and precision using this Fleet Logistics KPI Dashboard With Delivery Status Ppt Model Guide PDF. This layout presents information on Fleet Efficiency, Delivery Efficiency, Deliveries By Destination. It is also available for immediate download and adjustment. So, changes can be made in the color, design, graphics or any other component to create a unique layout.
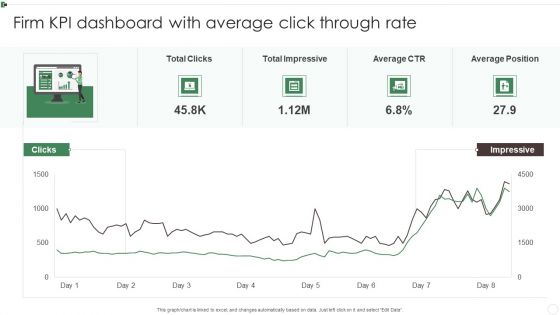
Firm KPI Dashboard With Average Click Through Rate Ppt Inspiration Sample PDF
This graph or chart is linked to excel, and changes automatically based on data. Just left click on it and select Edit Data. Pitch your topic with ease and precision using this Firm KPI Dashboard With Average Click Through Rate Ppt Inspiration Sample PDF. This layout presents information on Total Clicks, Total Impressive, Average CTR, Average Position. It is also available for immediate download and adjustment. So, changes can be made in the color, design, graphics or any other component to create a unique layout.
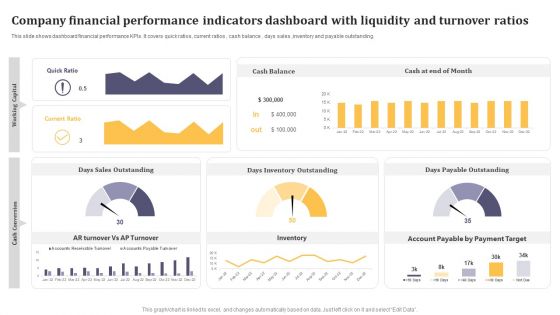
Company Financial Performance Indicators Dashboard With Liquidity And Turnover Ratios Formats PDF
This graph or chart is linked to excel, and changes automatically based on data. Just left click on it and select Edit Data. Pitch your topic with ease and precision using this Company Financial Performance Indicators Dashboard With Liquidity And Turnover Ratios Formats PDF. This layout presents information on Cash Balance, Days Inventory Outstanding, Days Payable Outstanding. It is also available for immediate download and adjustment. So, changes can be made in the color, design, graphics or any other component to create a unique layout.
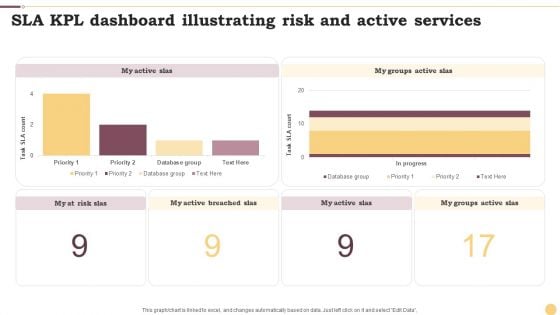
SLA KPL Dashboard Illustrating Risk And Active Services Ppt Portfolio Design Inspiration PDF
This graph or chart is linked to excel, and changes automatically based on data. Just left click on it and select Edit Data. Pitch your topic with ease and precision using this SLA KPL Dashboard Illustrating Risk And Active Services Ppt Portfolio Design Inspiration PDF. This layout presents information on My Active SLAs, Database Group, Priority. It is also available for immediate download and adjustment. So, changes can be made in the color, design, graphics or any other component to create a unique layout.
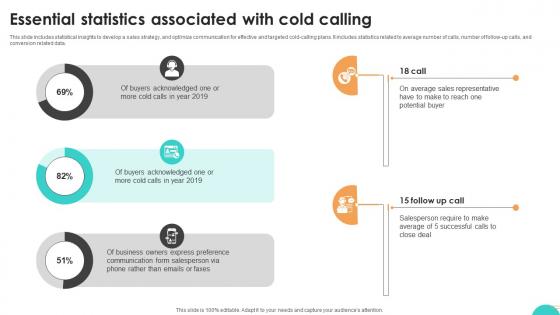
Ultimate Guide To Cold Essential Statistics Associated With Cold Calling SA SS V
This slide includes statistical insights to develop a sales strategy, and optimize communication for effective and targeted cold-calling plans. It includes statistics related to average number of calls, number of follow-up calls, and conversion related data. Formulating a presentation can take up a lot of effort and time, so the content and message should always be the primary focus. The visuals of the PowerPoint can enhance the presenters message, so our Ultimate Guide To Cold Essential Statistics Associated With Cold Calling SA SS V was created to help save time. Instead of worrying about the design, the presenter can concentrate on the message while our designers work on creating the ideal templates for whatever situation is needed. Slidegeeks has experts for everything from amazing designs to valuable content, we have put everything into Ultimate Guide To Cold Essential Statistics Associated With Cold Calling SA SS V. This slide includes statistical insights to develop a sales strategy, and optimize communication for effective and targeted cold-calling plans. It includes statistics related to average number of calls, number of follow-up calls, and conversion related data.
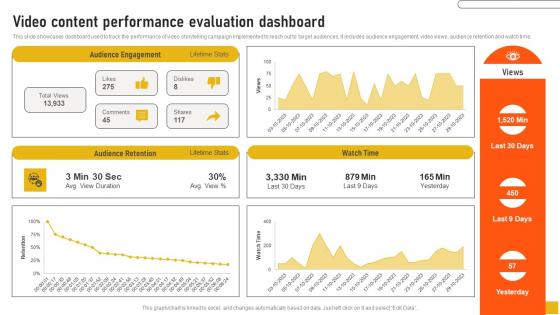
Video Content Performance Evaluation Dashboard Comprehensive Guide Clipart Pdf
This slide showcases dashboard used to track the performance of video storytelling campaign implemented to reach out to target audiences. It includes audience engagement, video views, audience retention and watch time. Here you can discover an assortment of the finest PowerPoint and Google Slides templates. With these templates, you can create presentations for a variety of purposes while simultaneously providing your audience with an eye-catching visual experience. Download Video Content Performance Evaluation Dashboard Comprehensive Guide Clipart Pdf to deliver an impeccable presentation. These templates will make your job of preparing presentations much quicker, yet still, maintain a high level of quality. Slidegeeks has experienced researchers who prepare these templates and write high-quality content for you. Later on, you can personalize the content by editing the Video Content Performance Evaluation Dashboard Comprehensive Guide Clipart Pdf This slide showcases dashboard used to track the performance of video storytelling campaign implemented to reach out to target audiences. It includes audience engagement, video views, audience retention and watch time.
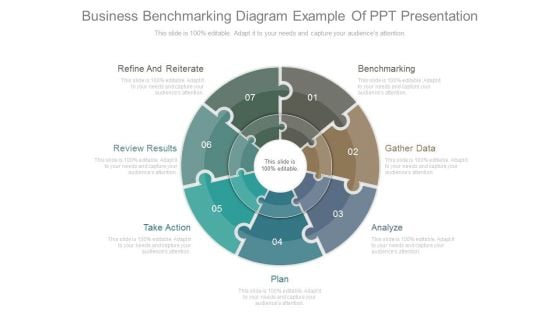
Business Benchmarking Diagram Example Of Ppt Presentation
This is a business benchmarking diagram example of ppt presentation. This is a seven stage process. The stages in this process are refine and reiterate, review results, take action, plan, analyze, gather data, benchmarking.

Strategic Promotions Ppt Diagram Powerpoint Topics
This is a strategic promotions ppt diagram powerpoint topics. This is a seven stage process. The stages in this process are brand identity, new market penetration, develop vision, research best practices, long term planning, short term planning, synthesize data.
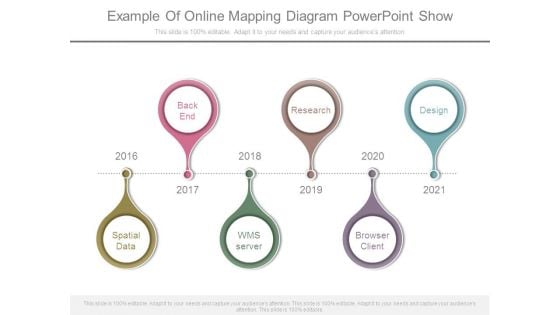
Example Of Online Mapping Diagram Powerpoint Show
This is a example of online mapping diagram powerpoint show. This is a six stage process. The stages in this process are back end, research, design, spatial data, wms server, browser client.
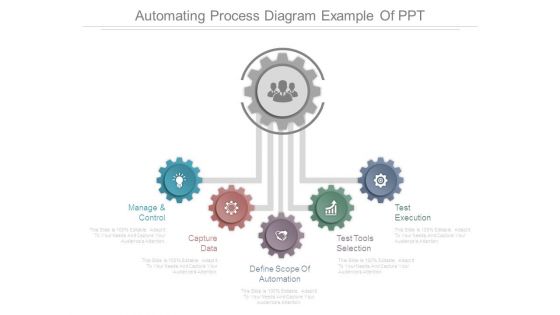
Automating Process Diagram Example Of Ppt
This is a automating process diagram example of ppt. This is a five stage process. The stages in this process are manage and control, capture data, define scope of automation, test tools selection, test execution.
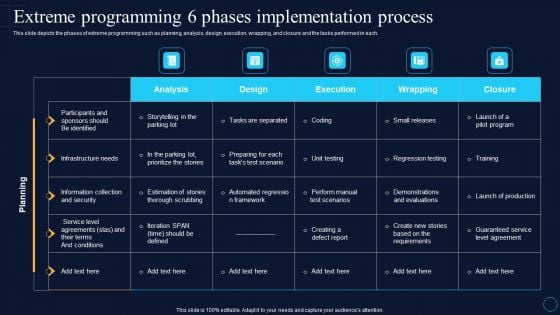
Extreme Programming 6 Phases Implementatin Software Development Approaches Designs PDF
This slide depicts the phases of extreme programming such as planning, analysis, design, execution, wrapping, and closure and the tasks performed in each.Find highly impressive Extreme Programming 6 Phases Implementatin Software Development Approaches Designs PDF on Slidegeeks to deliver a meaningful presentation. You can save an ample amount of time using these presentation templates. No need to worry to prepare everything from scratch because Slidegeeks experts have already done a huge research and work for you. You need to download Extreme Programming 6 Phases Implementatin Software Development Approaches Designs PDF for your upcoming presentation. All the presentation templates are 100precent editable and you can change the color and personalize the content accordingly. Download now,
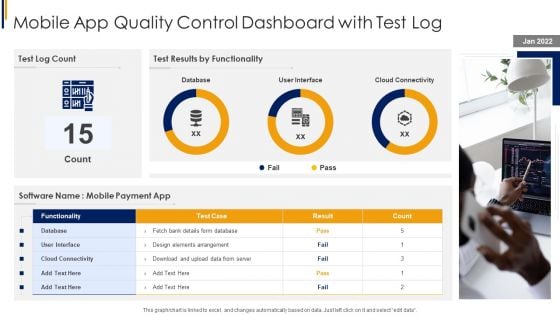
Mobile App Quality Control Dashboard With Test Log Graphics PDF
Pitch your topic with ease and precision using this Mobile App Quality Control Dashboard With Test Log Graphics PDF. This layout presents information on Arrangement, Elements, Data. It is also available for immediate download and adjustment. So, changes can be made in the color, design, graphics or any other component to create a unique layout.
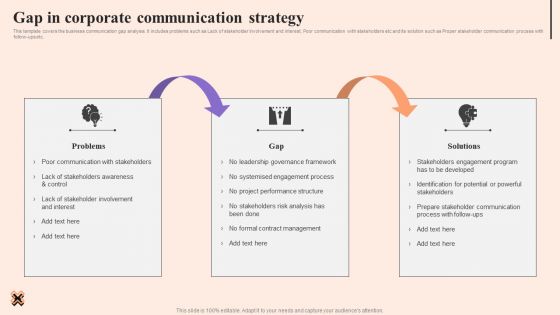
Corporate Communication Strategy Gap In Corporate Communication Strategy Information PDF
This template covers the business communication gap analysis. It includes problems such as Lack of stakeholder involvement and interest, Poor communication with stakeholders etc and its solution such as Proper stakeholder communication process with follow-ups etc. Retrieve professionally designed Corporate Communication Strategy Gap In Corporate Communication Strategy Information PDF to effectively convey your message and captivate your listeners. Save time by selecting pre-made slideshows that are appropriate for various topics, from business to educational purposes. These themes come in many different styles, from creative to corporate, and all of them are easily adjustable and can be edited quickly. Access them as PowerPoint templates or as Google Slides themes. You do not have to go on a hunt for the perfect presentation because Slidegeeks got you covered from everywhere.
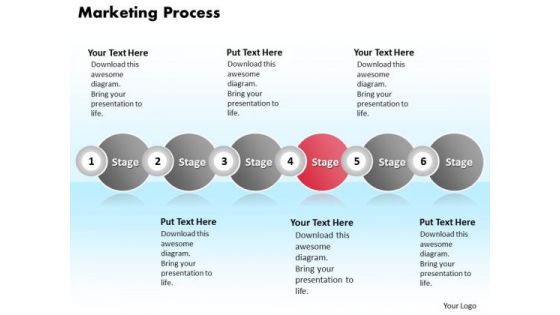
Ppt Continuous Example Of Marketing Process Using 6 Stages PowerPoint Templates
PPT continuous example of marketing process using 6 stages PowerPoint Templates-This diagram offers a great visualization tool it is a type of diagram that represents an algorithm or process, showing the steps as showing the steps as circles, and their order by connecting these with connectors. Process operations are represented in these circles, and connectors represent flow of control.-PPT continuous example of marketing process using 6 stages PowerPoint Templates-Analysis, Arrow, Background, Backlink, Circle, Code, Content, Diagram, Engine, Illustration, Keyword, Optimization, Offpage, Process, Search, Template, Tracking, Unpage, Violet, Visitor, Start the climb with our Ppt Continuous Example Of Marketing Process Using 6 Stages PowerPoint Templates. Go the full distance with ease and elan.
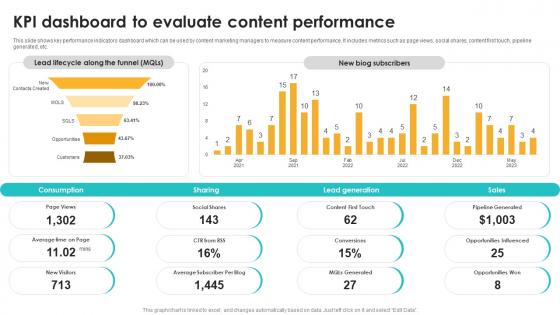
Kpi Dashboard To Evaluate Content Performance Seo Content Plan To Drive Strategy SS V
This slide shows key performance indicators dashboard which can be used by content marketing managers to measure content performance. It includes metrics such as page views, social shares, content first touch, pipeline generated, etc. This Kpi Dashboard To Evaluate Content Performance Seo Content Plan To Drive Strategy SS V is perfect for any presentation, be it in front of clients or colleagues. It is a versatile and stylish solution for organizing your meetings. The Kpi Dashboard To Evaluate Content Performance Seo Content Plan To Drive Strategy SS V features a modern design for your presentation meetings. The adjustable and customizable slides provide unlimited possibilities for acing up your presentation. Slidegeeks has done all the homework before launching the product for you. So, do not wait, grab the presentation templates today This slide shows key performance indicators dashboard which can be used by content marketing managers to measure content performance. It includes metrics such as page views, social shares, content first touch, pipeline generated, etc.
Market Overview Of Photonics Silicon Photonics SiPh It Ppt Template
This slide gives an overview of the photonics technology market. The purpose of this slide is to showcase the regional analysis, end-use segment overview, and key players. It also includes the growth drivers and challenges of the photonics market.Retrieve professionally designed Market Overview Of Photonics Silicon Photonics SiPh It Ppt Template to effectively convey your message and captivate your listeners. Save time by selecting pre-made slideshows that are appropriate for various topics, from business to educational purposes. These themes come in many different styles, from creative to corporate, and all of them are easily adjustable and can be edited quickly. Access them as PowerPoint templates or as Google Slides themes. You do not have to go on a hunt for the perfect presentation because Slidegeeks got you covered from everywhere. This slide gives an overview of the photonics technology market. The purpose of this slide is to showcase the regional analysis, end-use segment overview, and key players. It also includes the growth drivers and challenges of the photonics market.

Set Of Seven Vertical Steps Powerpoint Templates
This PowerPoint slide contains graphics of seven vertical steps. This professional slide may be used for visual explanation of data. Adjust the above diagram in your business presentations to give professional impact.
Set Of Six Vertical Steps Powerpoint Templates
This PowerPoint slide contains graphics of six vertical steps. This professional slide may be used for visual explanation of data. Adjust the above diagram in your business presentations to give professional impact.
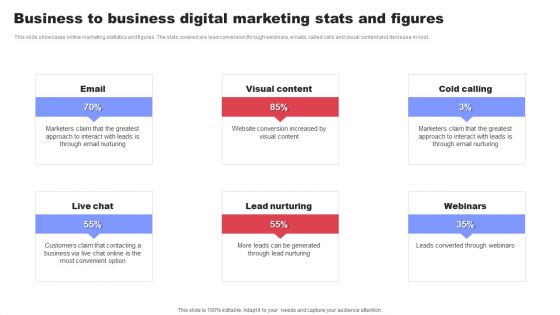
Business To Business Digital Marketing Stats And Figures Ppt Infographic Template Microsoft PDF
This slide showcases online marketing statistics and figures. The stats covered are lead conversion through webinars, emails, called calls and visual content and decrease in cost. Presenting Business To Business Digital Marketing Stats And Figures Ppt Infographic Template Microsoft PDF to dispense important information. This template comprises six stages. It also presents valuable insights into the topics including Live Chat, Lead Nurturing, Webinars, Cold Calling. This is a completely customizable PowerPoint theme that can be put to use immediately. So, download it and address the topic impactfully.
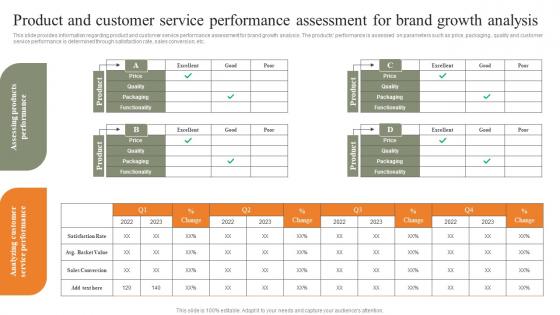
Product And Customer Service Performance Assessment Strategies For Achieving Diagrams Pdf
This slide provides information regarding product and customer service performance assessment for brand growth analysis. The products performance is assessed on parameters such as price, packaging, quality and customer service performance is determined through satisfaction rate, sales conversion, etc. Coming up with a presentation necessitates that the majority of the effort goes into the content and the message you intend to convey. The visuals of a PowerPoint presentation can only be effective if it supplements and supports the story that is being told. Keeping this in mind our experts created Product And Customer Service Performance Assessment Strategies For Achieving Diagrams Pdf to reduce the time that goes into designing the presentation. This way, you can concentrate on the message while our designers take care of providing you with the right template for the situation. This slide provides information regarding product and customer service performance assessment for brand growth analysis. The products performance is assessed on parameters such as price, packaging, quality and customer service performance is determined through satisfaction rate, sales conversion, etc.

Mapping Of DSDM Practices With Development Phases Integration Of Dynamic System To Enhance Processes Download PDF
This slide shows the mapping of DSDM practices with development phases, including planning, analysis, design, testing and deployment.Are you searching for a Mapping Of DSDM Practices With Development Phases Integration Of Dynamic System To Enhance Processes Download PDF that is uncluttered, straightforward, and original Its easy to edit, and you can change the colors to suit your personal or business branding. For a presentation that expresses how much effort you ve put in, this template is ideal With all of its features, including tables, diagrams, statistics, and lists, its perfect for a business plan presentation. Make your ideas more appealing with these professional slides. Download Mapping Of DSDM Practices With Development Phases Integration Of Dynamic System To Enhance Processes Download PDF from Slidegeeks today.
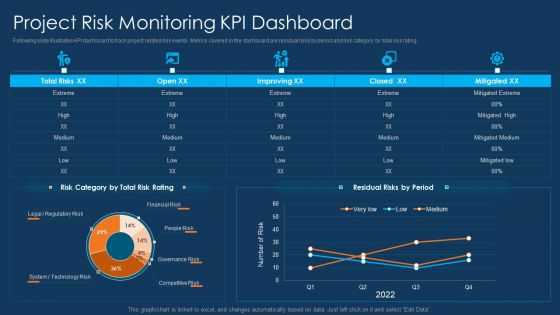
Information Technology Project Initiation Project Risk Monitoring Kpi Dashboard Background PDF
Following slide illustrates KPI dashboard to track project related risk events. Metrics covered in the dashboard are residual risks by period and risk category by total risk rating. Deliver and pitch your topic in the best possible manner with this information technology project initiation project risk monitoring kpi dashboard background pdf. Use them to share invaluable insights on project risk monitoring kpi dashboard and impress your audience. This template can be altered and modified as per your expectations. So, grab it now.
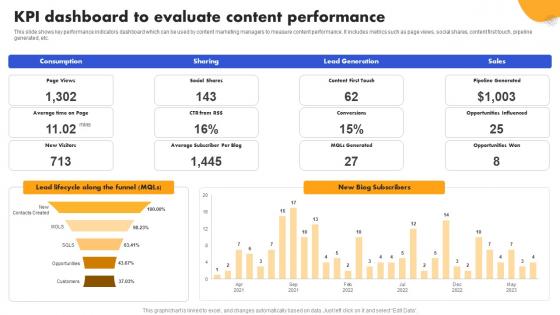
SEO Strategy To Improve ROI KPI Dashboard To Evaluate Content Strategy SS V
This slide shows key performance indicators dashboard which can be used by content marketing managers to measure content performance. It includes metrics such as page views, social shares, content first touch, pipeline generated, etc. Welcome to our selection of the SEO Strategy To Improve ROI KPI Dashboard To Evaluate Content Strategy SS V. These are designed to help you showcase your creativity and bring your sphere to life. Planning and Innovation are essential for any business that is just starting out. This collection contains the designs that you need for your everyday presentations. All of our PowerPoints are 100Percent editable, so you can customize them to suit your needs. This multi-purpose template can be used in various situations. Grab these presentation templates today. This slide shows key performance indicators dashboard which can be used by content marketing managers to measure content performance. It includes metrics such as page views, social shares, content first touch, pipeline generated, etc.
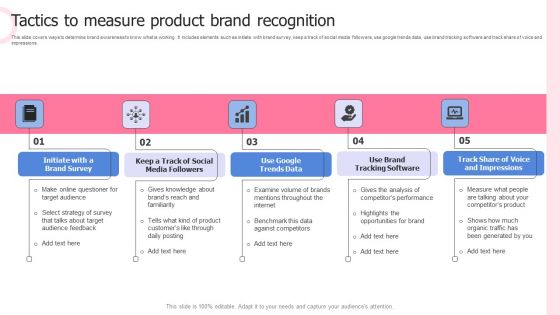
Tactics To Measure Product Brand Recognition Diagrams PDF
This slide covers ways to determine brand awareness to know what is working . It includes elements such as initiate with brand survey, keep a track of social media followers, use google trends data, use brand tracking software and track share of voice and impressions. Presenting Tactics To Measure Product Brand Recognition Diagrams PDF to dispense important information. This template comprises five stages. It also presents valuable insights into the topics including Use Google Trends Data, Use Brand Tracking Software, Brand Survey. This is a completely customizable PowerPoint theme that can be put to use immediately. So, download it and address the topic impactfully.
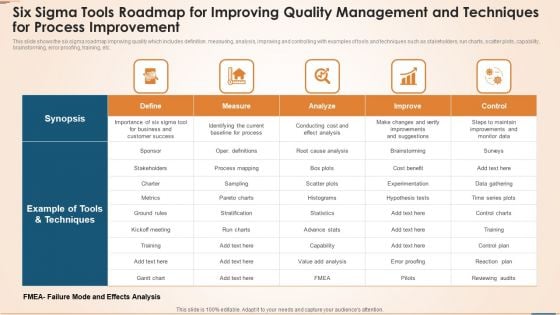
Six Sigma Tools Roadmap For Improving Quality Management And Techniques For Process Improvement Professional PDF
This slide shows the six sigma roadmap improving quality which includes definition, measuring, analysis, improving and controlling with examples of tools and techniques such as stakeholders, run charts, scatter plots, capability, brainstorming, error proofing, training, etc. Pitch your topic with ease and precision using this six sigma tools roadmap for improving quality management and techniques for process improvement professional pdf. This layout presents information on example of tools and techniques, synopsis, improve, control, analyze. It is also available for immediate download and adjustment. So, changes can be made in the color, design, graphics or any other component to create a unique layout.
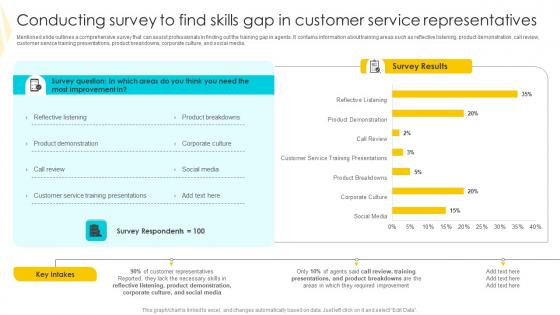
Conducting Survey To Find Skills Strategies To Mitigate Customer Churn Themes Pdf
Mentioned slide outlines a comprehensive survey that can assist professionals in finding out the training gap in agents. It contains information about training areas such as reflective listening, product demonstration, call review, customer service training presentations, product breakdowns, corporate culture, and social media. From laying roadmaps to briefing everything in detail, our templates are perfect for you. You can set the stage with your presentation slides. All you have to do is download these easy to edit and customizable templates. Conducting Survey To Find Skills Strategies To Mitigate Customer Churn Themes Pdf will help you deliver an outstanding performance that everyone would remember and praise you for. Do download this presentation today. Mentioned slide outlines a comprehensive survey that can assist professionals in finding out the training gap in agents. It contains information about training areas such as reflective listening, product demonstration, call review, customer service training presentations, product breakdowns, corporate culture, and social media.
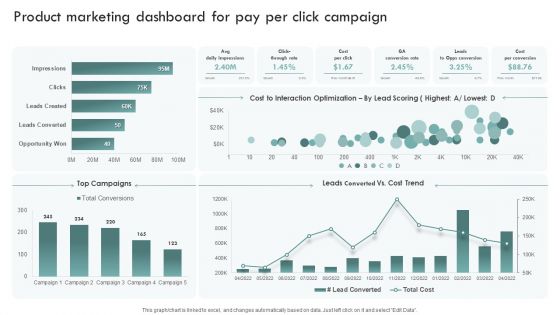
Brand Awareness Plan Product Marketing Dashboard For Pay Per Click Campaign Template PDF
This graph or chart is linked to excel, and changes automatically based on data. Just left click on it and select Edit Data. Get a simple yet stunning designed Brand Awareness Plan Product Marketing Dashboard For Pay Per Click Campaign Template PDF. It is the best one to establish the tone in your meetings. It is an excellent way to make your presentations highly effective. So, download this PPT today from Slidegeeks and see the positive impacts. Our easy-to-edit Brand Awareness Plan Product Marketing Dashboard For Pay Per Click Campaign Template PDF can be your go-to option for all upcoming conferences and meetings. So, what are you waiting for Grab this template today.
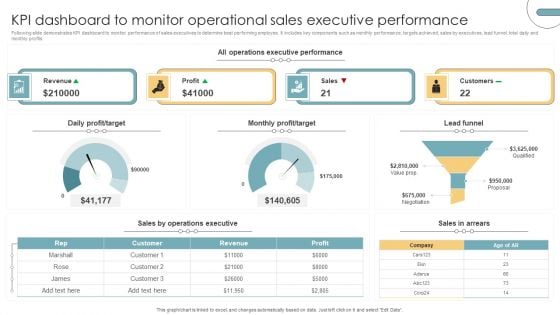
KPI Dashboard To Monitor Operational Sales Executive Performance Portrait PDF
Following slide demonstrates KPI dashboard to monitor performance of sales executives to determine best performing employee. It includes key components such as monthly performance, targets achieved, sales by executives, lead funnel, total daily and monthly profits. Pitch your topic with ease and precision using this KPI Dashboard To Monitor Operational Sales Executive Performance Portrait PDF. This layout presents information on Revenue, Profit, Sales, Customers. It is also available for immediate download and adjustment. So, changes can be made in the color, design, graphics or any other component to create a unique layout.

Ppt Horizontal PowerPoint Graphics Arrows Describing Seven Aspects Templates
PPT horizontal powerpoint graphics arrows describing seven aspects Templates-This Business Oriented Chart will definitely help you to be more Successful. Use this graphics as key element in streamlining your plans. It consists of Horizontal Arrows connected together to form a complete Process.-PPT horizontal powerpoint graphics arrows describing seven aspects Templates-analysis, arrow, background, business, chart, communication, concept, construction, delivery, design, development, engineering, fabrication, feasibiliti, generated, growth, idea, industry, making, production, products, science, sequence, shape Initiate changes with our Ppt Horizontal PowerPoint Graphics Arrows Describing Seven Aspects Templates. Download without worries with our money back guaranteee.
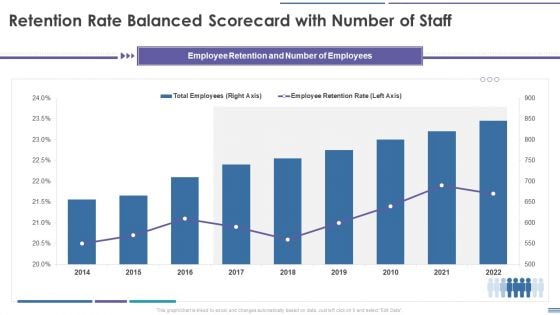
Staff Retention Balanced Scorecard Retention Rate Balanced Scorecard With Number Of Staff Diagrams PDF
This graph or chart is linked to excel, and changes automatically based on data. Just left click on it and select Edit Data. Deliver an awe inspiring pitch with this creative Staff Retention Balanced Scorecard Retention Rate Balanced Scorecard With Number Of Staff Diagrams PDF bundle. Topics like Total Employees, Employee Retention Rate, 2014 To 2022 can be discussed with this completely editable template. It is available for immediate download depending on the needs and requirements of the user.
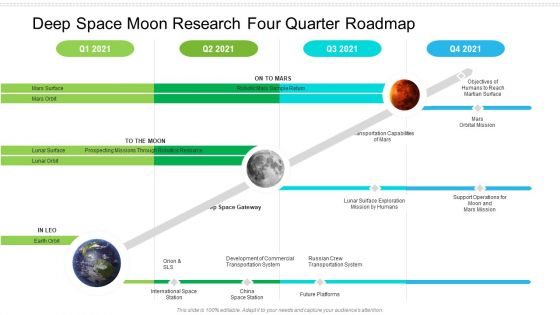
Deep Space Moon Research Four Quarter Roadmap Download
Presenting our innovatively structured deep space moon research four quarter roadmap download Template. Showcase your roadmap process in different formats like PDF, PNG, and JPG by clicking the download button below. This PPT design is available in both Standard Screen and Widescreen aspect ratios. It can also be easily personalized and presented with modified font size, font type, color, and shapes to measure your progress in a clear way.
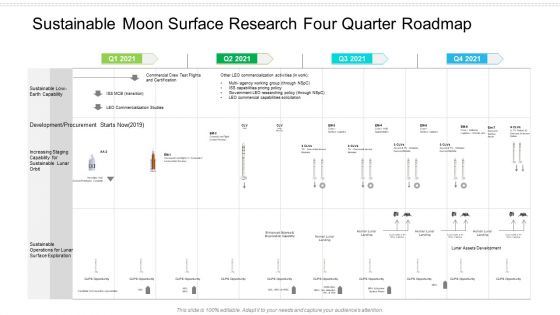
Sustainable Moon Surface Research Four Quarter Roadmap Summary
Presenting our innovatively structured sustainable moon surface research four quarter roadmap summary Template. Showcase your roadmap process in different formats like PDF, PNG, and JPG by clicking the download button below. This PPT design is available in both Standard Screen and Widescreen aspect ratios. It can also be easily personalized and presented with modified font size, font type, color, and shapes to measure your progress in a clear way.
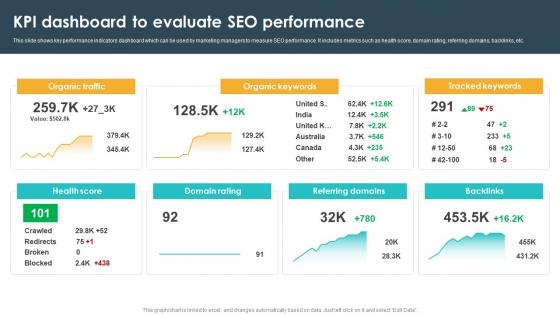
Kpi Dashboard To Evaluate Seo Performance Seo Content Plan To Drive Strategy SS V
This slide shows key performance indicators dashboard which can be used by marketing managers to measure SEO performance. It includes metrics such as health score, domain rating, referring domains, backlinks, etc. Welcome to our selection of the Kpi Dashboard To Evaluate Seo Performance Seo Content Plan To Drive Strategy SS V These are designed to help you showcase your creativity and bring your sphere to life. Planning and Innovation are essential for any business that is just starting out. This collection contains the designs that you need for your everyday presentations. All of our PowerPoints are 100Percent editable, so you can customize them to suit your needs. This multi-purpose template can be used in various situations. Grab these presentation templates today. This slide shows key performance indicators dashboard which can be used by marketing managers to measure SEO performance. It includes metrics such as health score, domain rating, referring domains, backlinks, etc.
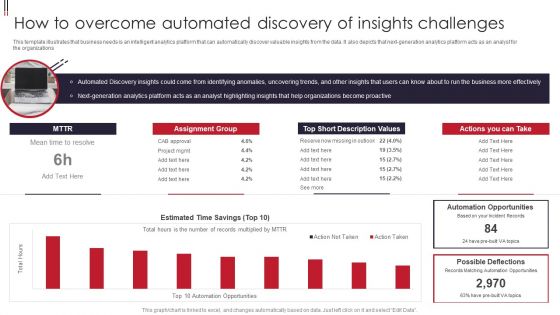
Information Visualizations Playbook How To Overcome Automated Discovery Of Insights Challenges Designs PDF
This template illustrates that business needs is an intelligent analytics platform that can automatically discover valuable insights from the data. It also depicts that next-generation analytics platform acts as an analyst for the organizations. Deliver and pitch your topic in the best possible manner with this Information Visualizations Playbook How To Overcome Automated Discovery Of Insights Challenges Designs PDF. Use them to share invaluable insights on Short Description Values, Automation Opportunities, Short Description Values, Analytics Platform and impress your audience. This template can be altered and modified as per your expectations. So, grab it now.
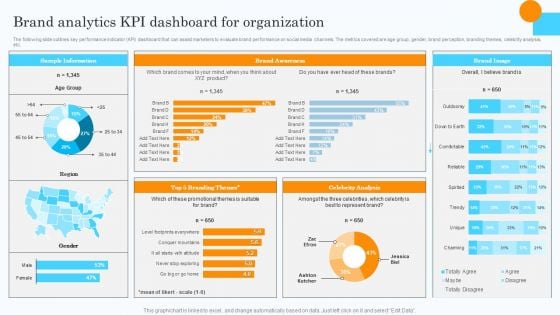
Market Research Assessment Of Target Market Requirements Brand Analytics Kpi Dashboard For Organization Clipart PDF
The following slide outlines key performance indicator KPI dashboard that can assist marketers to evaluate brand performance on social media channels. The metrics covered are age group, gender, brand perception, branding themes, celebrity analysis, etc. Do you have an important presentation coming up Are you looking for something that will make your presentation stand out from the rest Look no further than Market Research Assessment Of Target Market Requirements Brand Analytics Kpi Dashboard For Organization Clipart PDF. With our professional designs, you can trust that your presentation will pop and make delivering it a smooth process. And with Slidegeeks, you can trust that your presentation will be unique and memorable. So why wait Grab Market Research Assessment Of Target Market Requirements Brand Analytics Kpi Dashboard For Organization Clipart PDF today and make your presentation stand out from the rest.
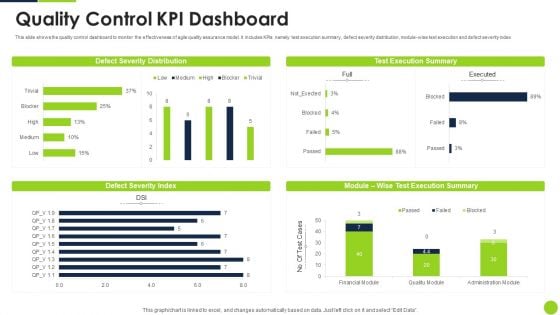
Agile Methodology Quality Control Quality Control KPI Dashboard Ppt Infographic Template Layout Ideas PDF
This slide shows the quality control dashboard to monitor the effectiveness of agile quality assurance model. It includes KPIs namely test execution summary, defect severity distribution, module-wise text execution and defect severity index Deliver an awe inspiring pitch with this creative agile methodology quality control quality control kpi dashboard ppt infographic template layout ideas pdf bundle. Topics like quality control kpi dashboard can be discussed with this completely editable template. It is available for immediate download depending on the needs and requirements of the user.
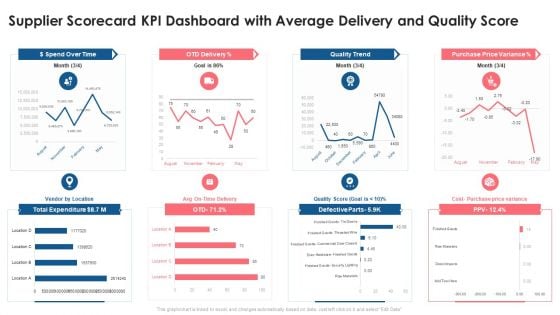
Supplier Scorecard Supplier Scorecard KPI Dashboard With Average Delivery And Quality Score Introduction PDF
This graph or chart is linked to excel, and changes automatically based on data. Just left click on it and select Edit Data. Deliver an awe inspiring pitch with this creative supplier scorecard supplier scorecard kpi dashboard with average delivery and quality score introduction pdf bundle. Topics like dollar spend over time, otd delivery, quality trend, purchase price variance, total expenditure can be discussed with this completely editable template. It is available for immediate download depending on the needs and requirements of the user.
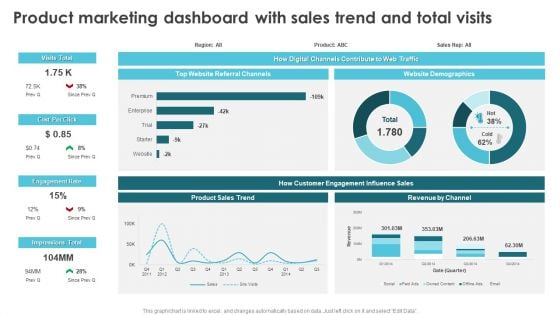
Product Marketing For Generating Product Marketing Dashboard With Sales Trend Designs PDF
This graph or chart is linked to excel, and changes automatically based on data. Just left click on it and select Edit Data. From laying roadmaps to briefing everything in detail, our templates are perfect for you. You can set the stage with your presentation slides. All you have to do is download these easy-to-edit and customizable templates. Product Marketing For Generating Product Marketing Dashboard With Sales Trend Designs PDF will help you deliver an outstanding performance that everyone would remember and praise you for. Do download this presentation today.

Steps To Effectively Conduct Market Research Brand Analytics KPI Dashboard For Organization Template PDF
The following slide outlines key performance indicator KPI dashboard that can assist marketers to evaluate brand performance on social media channels. The metrics covered are age group, gender, brand perception, branding themes, celebrity analysis, etc. Present like a pro with Steps To Effectively Conduct Market Research Brand Analytics KPI Dashboard For Organization Template PDF Create beautiful presentations together with your team, using our easy to use presentation slides. Share your ideas in real time and make changes on the fly by downloading our templates. So whether you are in the office, on the go, or in a remote location, you can stay in sync with your team and present your ideas with confidence. With Slidegeeks presentation got a whole lot easier. Grab these presentations today.
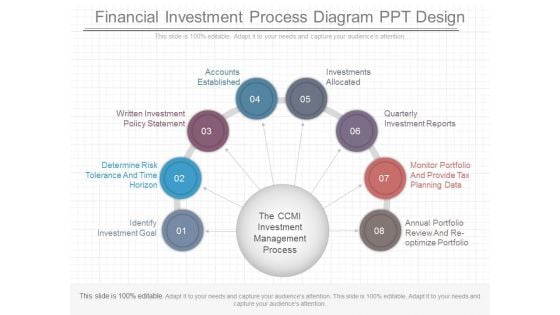
Financial Investment Process Diagram Ppt Design
This is a financial investment process diagram ppt design. This is a eight stage process. The stages in this process are identify investment goal, determine risk tolerance and time horizon, written investment policy statement, accounts established, investments allocated, quarterly investment reports, monitor portfolio and provide tax planning data, annual portfolio review and re optimize portfolio.
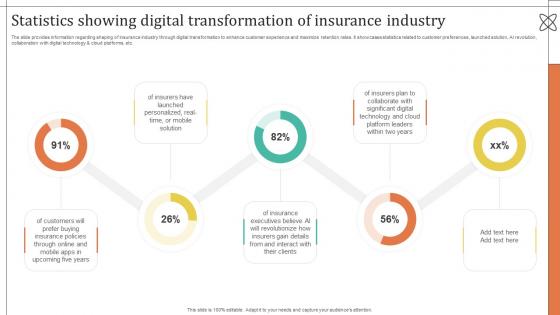
Improving Customer Satisfaction Statistics Showing Digital Transformation Of Insurance
The slide provides information regarding shaping of insurance industry through digital transformation to enhance customer experience and maximize retention rates. It showcases statistics related to customer preferences, launched solution, AI revolution, collaboration with digital technology and cloud platforms, etc. If you are looking for a format to display your unique thoughts, then the professionally designed Improving Customer Satisfaction Statistics Showing Digital Transformation Of Insurance is the one for you. You can use it as a Google Slides template or a PowerPoint template. Incorporate impressive visuals, symbols, images, and other charts. Modify or reorganize the text boxes as you desire. Experiment with shade schemes and font pairings. Alter, share or cooperate with other people on your work. Download Improving Customer Satisfaction Statistics Showing Digital Transformation Of Insurance and find out how to give a successful presentation. Present a perfect display to your team and make your presentation unforgettable. The slide provides information regarding shaping of insurance industry through digital transformation to enhance customer experience and maximize retention rates. It showcases statistics related to customer preferences, launched solution, AI revolution, collaboration with digital technology and cloud platforms, etc.
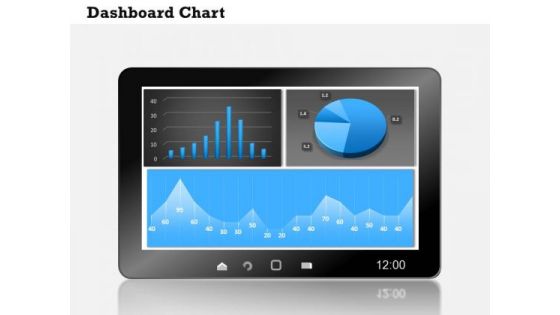
Consulting Diagram Dashboard Business Information Chart Business Diagram
Get The Domestics Right With Our Consulting Diagram Dashboard Business Information Chart Business Diagram Powerpoint Templates. Create The Base For Thoughts To Grow.

Circular Bar Graph Business Success PowerPoint Templates And PowerPoint Themes 1012
Circular Bar Graph Business Success PowerPoint Templates And PowerPoint Themes 1012-The above template displays a diagram of blue circular progress bars. This image represent the concept of business growth and success. This template imitates economy, finance, global, goal, growth, ideas, information, management, profit and statistics. This image has been conceived to enable you to emphatically communicate your ideas in your Business and Marketing PPT presentations. Use this template for financial analysis, business reviews and statistics. Go ahead and add charm to your presentations with our high quality template.-Circular Bar Graph Business Success PowerPoint Templates And PowerPoint Themes 1012-This PowerPoint template can be used for presentations relating to-Circular success graph, marketing, business, finance, success, circle charts Fashion your plans on our Circular Bar Graph Business Success PowerPoint Templates And PowerPoint Themes 1012. They will always keep you in contention.
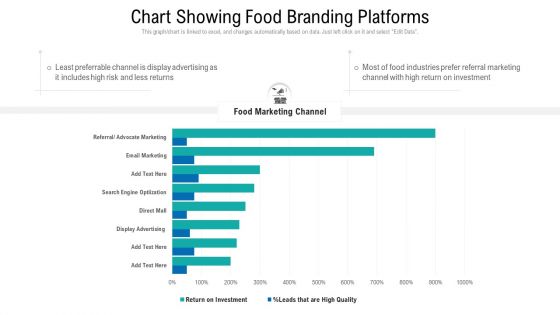
Chart Showing Food Branding Platforms Ppt Summary Gridlines PDF
This graph or chart is linked to excel, and changes automatically based on data. Just left click on it and select Edit Data. Showcasing this set of slides titled chart showing food branding platforms ppt summary gridlines pdf. The topics addressed in these templates are chart showing food branding platforms. All the content presented in this PPT design is completely editable. Download it and make adjustments in color, background, font etc. as per your unique business setting.

Busines Diagram Five Staged Test Tubes For Science Based Values Representation Ppt Template
Five staged test tubes are used to design this business diagram. This business slide contains the concept of value representation based on scientific data. Ideas are best expressed easily with the help of this diagram slide
Ppt Straight Execution Of 4 PowerPoint Slide Numbers Templates
PPT straight execution of 4 powerpoint slide numbers Templates-Visually support your ideas and emphatically define your message with our above Diagram. This Diagram is designed to help bullet-point your views and thoughts.-PPT straight execution of 4 powerpoint slide numbers Templates-3d, activity, arrow, art, artwork, box, bubble, business, chart, chat, circular, clip, collection, colorful, communication, company, concept, construction, cursor, data, decoration, design, diagram, download, glossy, graph, graphic, icon, ideas, illustration, recycle, set, shiny, sign, star, style, symbol Convert customers with our Ppt Straight Execution Of 4 PowerPoint Slide Numbers Templates. Download without worries with our money back guaranteee.
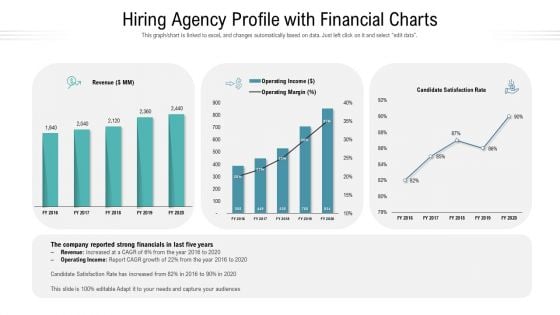
Hiring Agency Profile With Financial Charts Ppt Model Example PDF
This graph or chart is linked to excel, and changes automatically based on data. Just left click on it and select edit data. Pitch your topic with ease and precision using this hiring agency profile with financial charts ppt model example pdf. This layout presents information on revenue, operating income, operating margin, satisfaction rate. It is also available for immediate download and adjustment. So, changes can be made in the color, design, graphics or any other component to create a unique layout.
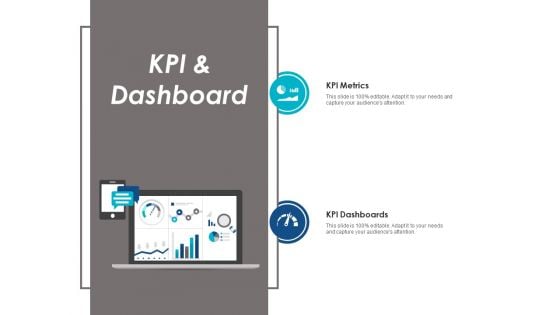
Kpi And Dashboard Ppt PowerPoint Presentation Gallery File Formats
This is a kpi and dashboard ppt powerpoint presentation gallery file formats. This is a two stage process. The stages in this process are management, technology, strategy, icons, business.
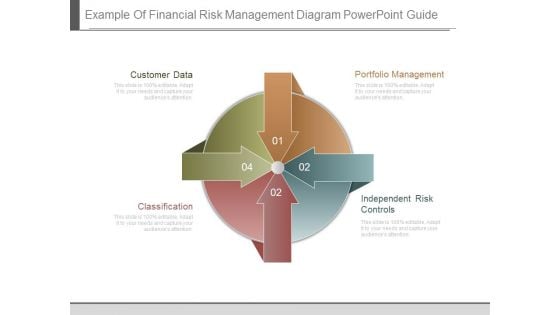
Example Of Financial Risk Management Diagram Powerpoint Guide
This is a example of financial risk management diagram powerpoint guide. This is a four stage process. The stages in this process are customer data, portfolio management, classification, independent risk controls.
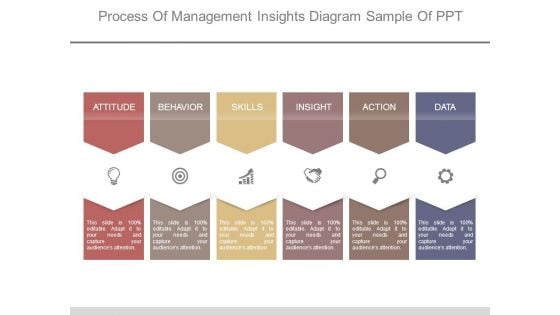
Process Of Management Insights Diagram Sample Of Ppt
This is a process of management insights diagram sample of ppt. This is a six stage process. The stages in this process are attitude, behavior, skills, insight, action, data.
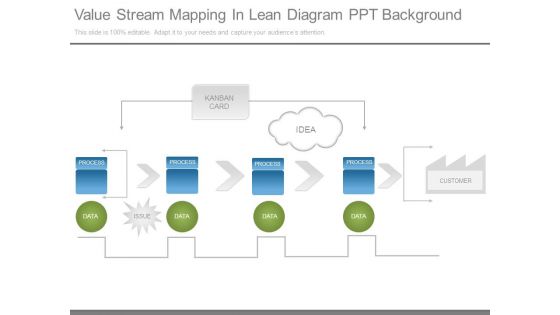
Value Stream Mapping In Lean Diagram Ppt Background
This is a value stream mapping in lean diagram ppt background. This is a four stage process. The stages in this process are kanban card, idea, process, customer, data, issue.
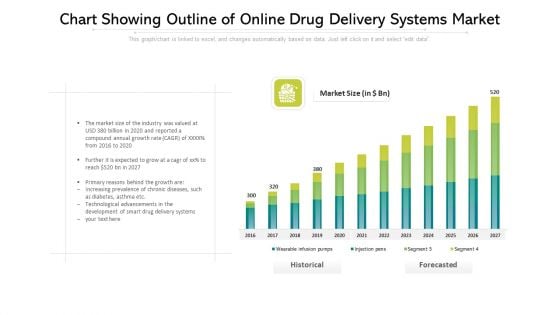
Chart Showing Outline Of Online Drug Delivery Systems Market Ppt PowerPoint Presentation File Clipart PDF
This graph or chart is linked to excel, and changes automatically based on data. Just left click on it and select edit data. Showcasing this set of slides titled chart showing outline of online drug delivery systems market ppt powerpoint presentation file clipart pdf. The topics addressed in these templates are technological, development, growth. All the content presented in this PPT design is completely editable. Download it and make adjustments in color, background, font etc. as per your unique business setting.
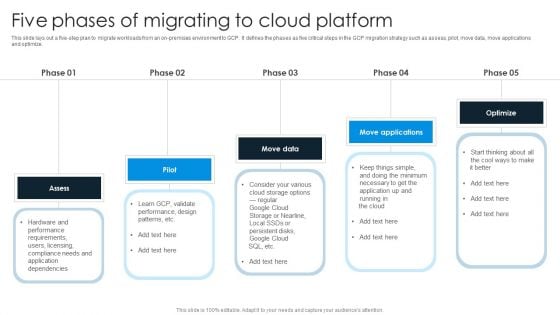
Five Phases Of Migrating To Cloud Platform Portrait PDF
This slide lays out a five-step plan to migrate workloads from an on-premises environment to GCP. It defines the phases as five critical steps in the GCP migration strategy such as assess, pilot, move data, move applications and optimize. Presenting Five Phases Of Migrating To Cloud Platform Portrait PDF to dispense important information. This template comprises five stages. It also presents valuable insights into the topics including Assess, Pilot, Move Data. This is a completely customizable PowerPoint theme that can be put to use immediately. So, download it and address the topic impactfully.
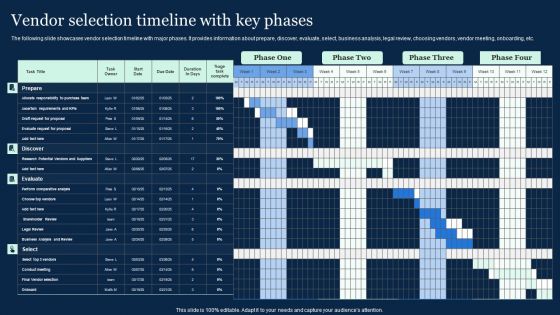
Vendor Selection Timeline With Key Phases Effective Vendor Management For Enhancing Structure PDF
The following slide showcases vendor selection timeline with major phases. It provides information about prepare, discover, evaluate, select, business analysis, legal review, choosing vendors, vendor meeting, onboarding, etc. Formulating a presentation can take up a lot of effort and time, so the content and message should always be the primary focus. The visuals of the PowerPoint can enhance the presenters message, so our Vendor Selection Timeline With Key Phases Effective Vendor Management For Enhancing Structure PDF was created to help save time. Instead of worrying about the design, the presenter can concentrate on the message while our designers work on creating the ideal templates for whatever situation is needed. Slidegeeks has experts for everything from amazing designs to valuable content, we have put everything into Vendor Selection Timeline With Key Phases Effective Vendor Management For Enhancing Structure PDF
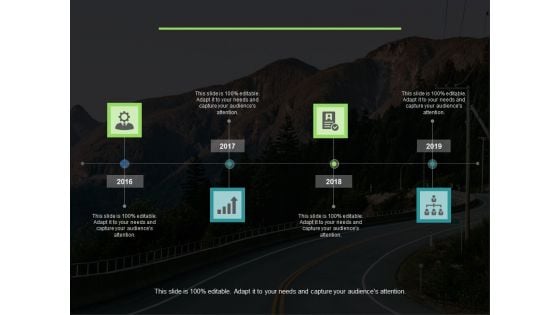
Quarterly Timeline Template Ppt PowerPoint Presentation Ideas Background Images
This is a quarterly timeline template ppt powerpoint presentation ideas background images. This is a four stage process. The stages in this process are icons, years, marketing, strategy, planning.
Key Challenges In Project Handover Procedure Designs PDF
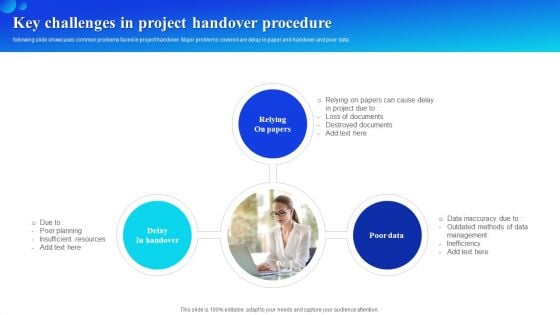
following slide showcases common problems faced in project handover. Major problems covered are delay in paper and handover and poor data. Presenting Key Challenges In Project Handover Procedure Designs PDF to dispense important information. This template comprises three stages. It also presents valuable insights into the topics including Relying On Papers, Delay In Handover, Poor Data. This is a completely customizable PowerPoint theme that can be put to use immediately. So, download it and address the topic impactfully.
Lifecycle Process Mapping For Digital And Owned Media Brochure PDF
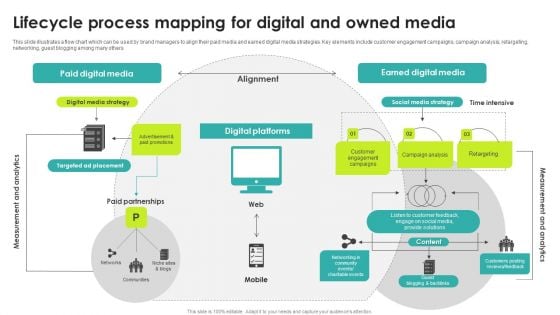
This slide illustrates a flow chart which can be used by brand managers to align their paid media and earned digital media strategies. Key elements include customer engagement campaigns, campaign analysis, retargeting, networking, guest blogging among many others Persuade your audience using this Lifecycle Process Mapping For Digital And Owned Media Brochure PDF. This PPT design covers six stages, thus making it a great tool to use. It also caters to a variety of topics including Alignment, Digital Platforms, Partnerships. Download this PPT design now to present a convincing pitch that not only emphasizes the topic but also showcases your presentation skills.
Management Report Software Features Comparison
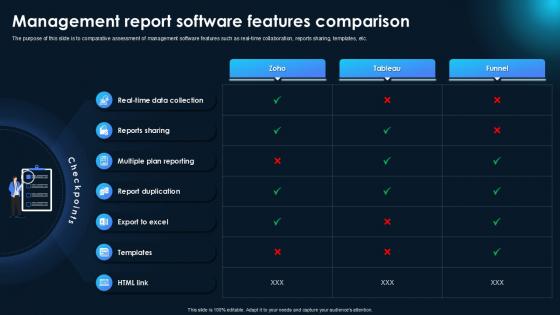
Want to ace your presentation in front of a live audience Our Management Report Software Features Comparison can help you do that by engaging all the users towards you. Slidegeeks experts have put their efforts and expertise into creating these impeccable powerpoint presentations so that you can communicate your ideas clearly. Moreover, all the templates are customizable, and easy-to-edit and downloadable. Use these for both personal and commercial use. A comprehensive template designed for evaluating and comparing software features across different management tools. It includes structured tables and charts for feature analysis, benefits assessment, and suitability for organizational needs. Perfect for IT managers, decision-makers, and consultants aiming to recommend the best software solutions.
Business Diagram Set Of Circular Pie Graphs With Percentage Values Presentation Template
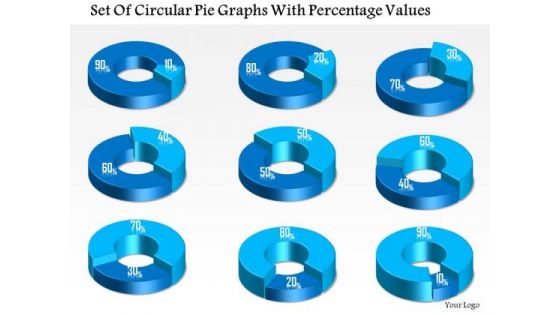
This business diagram displays set of pie charts. This Power Point template has been designed to compare and present business data. Download this diagram to represent stages of business growth.

 Home
Home