Data Analysis Icon
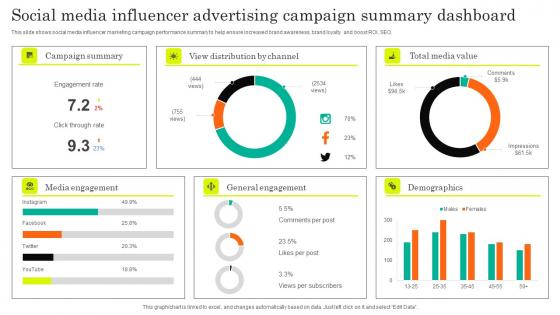
Social Media Influencer Advertising Campaign Summary Dashboard Formats Pdf
This slide shows social media influencer marketing campaign performance summary to help ensure increased brand awareness, brand loyalty and boost ROI, SEO. Showcasing this set of slides titled Social Media Influencer Advertising Campaign Summary Dashboard Formats Pdf. The topics addressed in these templates are Summary, Engagement, Demographics. All the content presented in this PPT design is completely editable. Download it and make adjustments in color, background, font etc. as per your unique business setting. This slide shows social media influencer marketing campaign performance summary to help ensure increased brand awareness, brand loyalty and boost ROI, SEO.
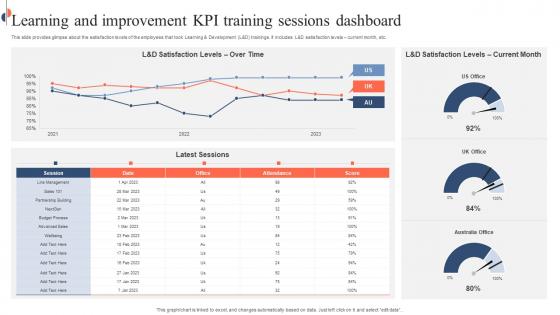
Learning And Improvement KPI Training Sessions Dashboard Mockup Pdf
This slide provides glimpse about the satisfaction levels of the employees that took Learning and Development L and D trainings. It includes L and D satisfaction levels current month, etc. Showcasing this set of slides titled Learning And Improvement KPI Training Sessions Dashboard Mockup Pdf. The topics addressed in these templates are Learning And Improvement KPI, Training Sessions Dashboard, Learning And Development. All the content presented in this PPT design is completely editable. Download it and make adjustments in color, background, font etc. as per your unique business setting. This slide provides glimpse about the satisfaction levels of the employees that took Learning and Development L and D trainings. It includes L and D satisfaction levels current month, etc.
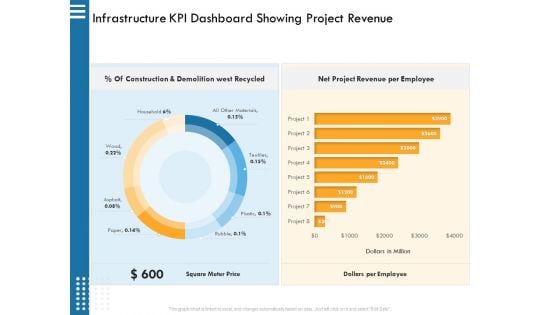
IT Infrastructure Governance Infrastructure KPI Dashboard Showing Project Revenue Ppt Infographic Template Guide PDF
Deliver and pitch your topic in the best possible manner with this it infrastructure governance infrastructure kpi dashboard showing project revenue ppt infographic template guide pdf. Use them to share invaluable insights on employee, revenue, construction, demolition, materials and impress your audience. This template can be altered and modified as per your expectations. So, grab it now.
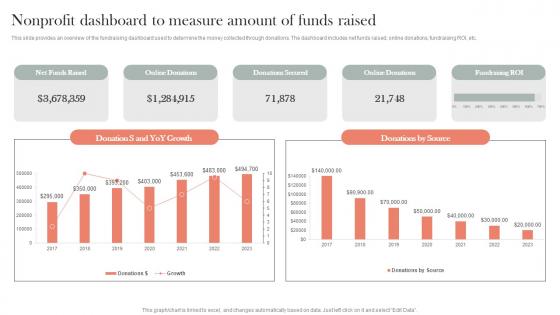
Non profit Dashboard To Measure Amount Of Funds Efficient Nonprofit Marketing Background Pdf
This slide provides an overview of the fundraising dashboard used to determine the money collected through donations. The dashboard includes net funds raised, online donations, fundraising ROI, etc.Boost your pitch with our creative Non profit Dashboard To Measure Amount Of Funds Efficient Nonprofit Marketing Background Pdf. Deliver an awe-inspiring pitch that will mesmerize everyone. Using these presentation templates you will surely catch everyones attention. You can browse the ppts collection on our website. We have researchers who are experts at creating the right content for the templates. So you do not have to invest time in any additional work. Just grab the template now and use them. This slide provides an overview of the fundraising dashboard used to determine the money collected through donations. The dashboard includes net funds raised, online donations, fundraising ROI, etc.
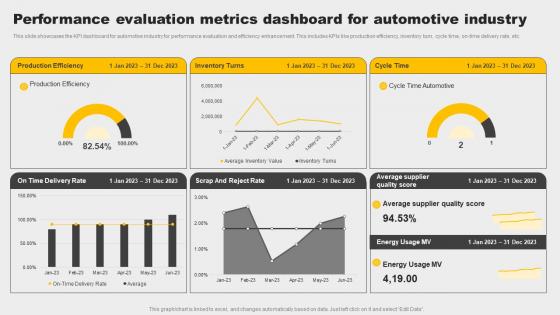
Performance Evaluation Metrics Dashboard For Automotive Industry Mockup Pdf
This slide showcases the KPI dashboard for automotive industry for performance evaluation and efficiency enhancement. This includes KPIs like production efficiency, inventory turn, cycle time, on time delivery rate, etc. Pitch your topic with ease and precision using this Performance Evaluation Metrics Dashboard For Automotive Industry Mockup Pdf. This layout presents information on Production Efficiency, Inventory Turns, Automotive Industry. It is also available for immediate download and adjustment. So, changes can be made in the color, design, graphics or any other component to create a unique layout. This slide showcases the KPI dashboard for automotive industry for performance evaluation and efficiency enhancement. This includes KPIs like production efficiency, inventory turn, cycle time, on time delivery rate, etc.
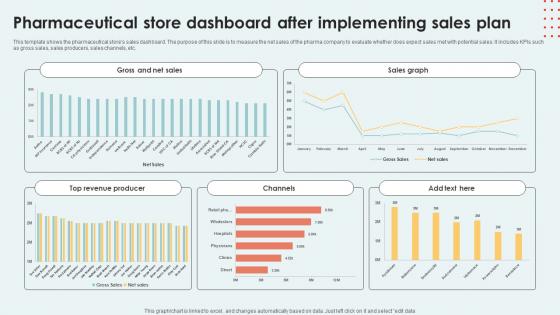
Pharmaceutical Store Dashboard After Implementing Sales Plan Inspiration Pdf
This template shows the pharmaceutical stores sales dashboard. The purpose of this slide is to measure the net sales of the pharma company to evaluate whether does expect sales met with potential sales. It includes KPIs such as gross sales, sales producers, sales channels, etc.Pitch your topic with ease and precision using this Pharmaceutical Store Dashboard After Implementing Sales Plan Inspiration Pdf This layout presents information on Gross Net Sales, Sales Graph, Top Revenue Producer It is also available for immediate download and adjustment. So, changes can be made in the color, design, graphics or any other component to create a unique layout. This template shows the pharmaceutical stores sales dashboard. The purpose of this slide is to measure the net sales of the pharma company to evaluate whether does expect sales met with potential sales. It includes KPIs such as gross sales, sales producers, sales channels, etc.
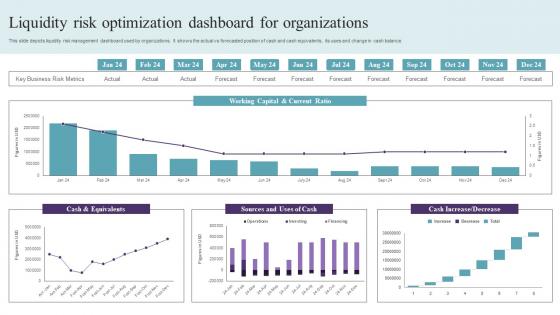
Liquidity Risk Optimization Dashboard For Organizations Graphics Pdf
This slide depicts liquidity risk management dashboard used by organizations. It shows the actual vs forecasted position of cash and cash equivalents, its uses and change in cash balance. Pitch your topic with ease and precision using this Liquidity Risk Optimization Dashboard For Organizations Graphics Pdf. This layout presents information on Cash And Equivalents, Working Capital, Current Ratio. It is also available for immediate download and adjustment. So, changes can be made in the color, design, graphics or any other component to create a unique layout. This slide depicts liquidity risk management dashboard used by organizations. It shows the actual vs forecasted position of cash and cash equivalents, its uses and change in cash balance.

Smart Home Dashboard For Appliance Monitoring Smart Grid Working
This slide represents the smart home dashboard for monitoring total electricity consumption by rooms and appliances such as lights, microwave heating, room cooling temperature, home security, television and computers. This Smart Home Dashboard For Appliance Monitoring Smart Grid Working from Slidegeeks makes it easy to present information on your topic with precision. It provides customization options, so you can make changes to the colors, design, graphics, or any other component to create a unique layout. It is also available for immediate download, so you can begin using it right away. Slidegeeks has done good research to ensure that you have everything you need to make your presentation stand out. Make a name out there for a brilliant performance. This slide represents the smart home dashboard for monitoring total electricity consumption by rooms and appliances such as lights, microwave heating, room cooling temperature, home security, television and computers.
B2B Sales Performance Tracking Dashboard B2B Digital Commerce Graphics Pdf
This slide represents metric dashboard to track sales performance on e-commerce website. It cover performance indicators such as sales breakdown, order breakdown, recurring sales etc. This B2B Sales Performance Tracking Dashboard B2B Digital Commerce Graphics Pdf from Slidegeeks makes it easy to present information on your topic with precision. It provides customization options, so you can make changes to the colors, design, graphics, or any other component to create a unique layout. It is also available for immediate download, so you can begin using it right away. Slidegeeks has done good research to ensure that you have everything you need to make your presentation stand out. Make a name out there for a brilliant performance. This slide represents metric dashboard to track sales performance on e-commerce website. It cover performance indicators such as sales breakdown, order breakdown, recurring sales etc.
Dashboard For Tracking Onboarding Email Campaign Results Designs Pdf
The purpose of this slide is to represent a dashboard for welcome email campaign result to analyse the success rate. It includes component such as click through rate, click to open ratio, soft bounce rate, unsubscribe rate, hard bounce rate etc. Pitch your topic with ease and precision using this Dashboard For Tracking Onboarding Email Campaign Results Designs Pdf. This layout presents information on Monthly Total Subscribers, Monthly Open Rate, Unsubscribe Rate . It is also available for immediate download and adjustment. So, changes can be made in the color, design, graphics or any other component to create a unique layout. The purpose of this slide is to represent a dashboard for welcome email campaign result to analyse the success rate. It includes component such as click through rate, click to open ratio, soft bounce rate, unsubscribe rate, hard bounce rate etc.
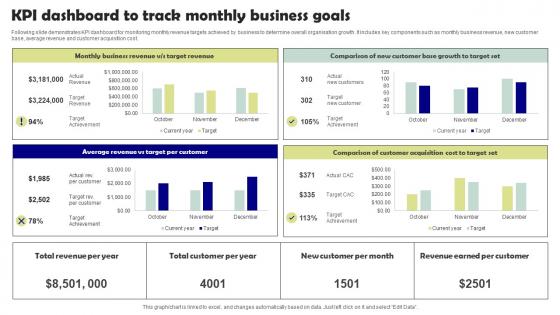
KPI Dashboard To Track Monthly Business Goals Microsoft Pdf
Following slide demonstrates KPI dashboard for monitoring monthly revenue targets achieved by business to determine overall organisation growth. It includes key components such as monthly business revenue, new customer base, average revenue and customer acquisition cost. Pitch your topic with ease and precision using this KPI Dashboard To Track Monthly Business Goals Microsoft Pdf. This layout presents information on Target Per Customer, Target Set. It is also available for immediate download and adjustment. So, changes can be made in the color, design, graphics or any other component to create a unique layout. Following slide demonstrates KPI dashboard for monitoring monthly revenue targets achieved by business to determine overall organisation growth. It includes key components such as monthly business revenue, new customer base, average revenue and customer acquisition cost.
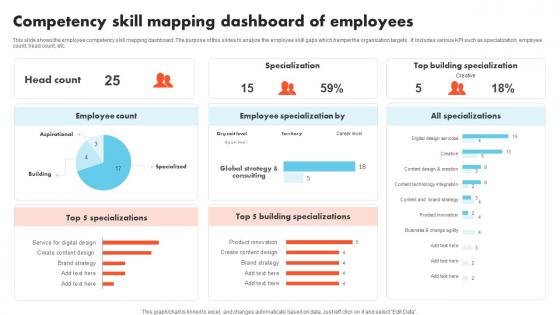
Competency Skill Mapping Dashboard Of Employees Formats Pdf
This slide shows the employee competency skill mapping dashboard .The purpose of this slides to analyze the employee skill gaps which hamper the organization targets .It includes various KPI such as specialization, employee count, head count, etc. Pitch your topic with ease and precision using this Competency Skill Mapping Dashboard Of Employees Formats Pdf This layout presents information on Employee Specialization, Building Specializations, Specialization It is also available for immediate download and adjustment. So, changes can be made in the color, design, graphics or any other component to create a unique layout. This slide shows the employee competency skill mapping dashboard .The purpose of this slides to analyze the employee skill gaps which hamper the organization targets .It includes various KPI such as specialization, employee count, head count, etc.
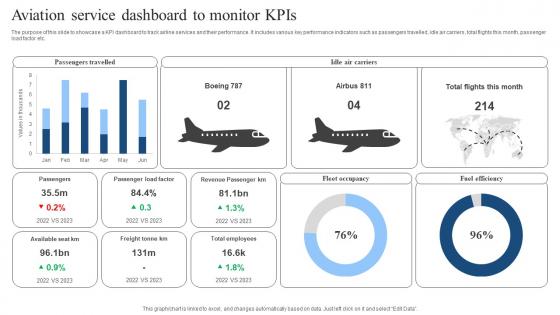
Aviation Service Dashboard To Monitor KPIs Download Pdf
The purpose of this slide to showcase a KPI dashboard to track airline services and their performance. It includes various key performance indicators such as passengers travelled, idle air carriers, total flights this month, passenger load factor etc. Pitch your topic with ease and precision using this Aviation Service Dashboard To Monitor KPIs Download Pdf. This layout presents information on Fleet Occupancy, Fuel Efficiency, Passengers Travelled. It is also available for immediate download and adjustment. So, changes can be made in the color, design, graphics or any other component to create a unique layout. The purpose of this slide to showcase a KPI dashboard to track airline services and their performance. It includes various key performance indicators such as passengers travelled, idle air carriers, total flights this month, passenger load factor etc.
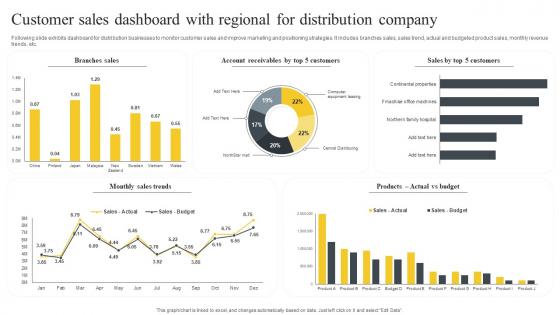
Customer Sales Dashboard With Regional For Distribution Company Brochure Pdf
Following slide exhibits dashboard for distribution businesses to monitor customer sales and improve marketing and positioning strategies. It includes branches sales, sales trend, actual and budgeted product sales, monthly revenue trends, etc. Pitch your topic with ease and precision using this Customer Sales Dashboard With Regional For Distribution Company Brochure Pdf. This layout presents information on Branches Sales, Monthly Sales Trends, Customers. It is also available for immediate download and adjustment. So, changes can be made in the color, design, graphics or any other component to create a unique layout. Following slide exhibits dashboard for distribution businesses to monitor customer sales and improve marketing and positioning strategies. It includes branches sales, sales trend, actual and budgeted product sales, monthly revenue trends, etc.
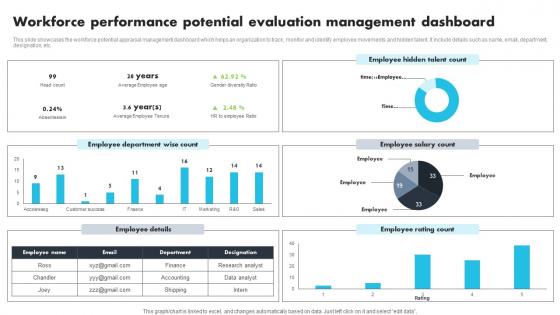
Workforce Performance Potential Evaluation Management Dashboard Clipart Pdf
This slide showcases the workforce potential appraisal management dashboard which helps an organization to track, monitor and identify employee movements and hidden talent. It include details such as name, email, department, designation, etc. Pitch your topic with ease and precision using this Workforce Performance Potential Evaluation Management Dashboard Clipart Pdf. This layout presents information on Employee Department, Employee Salary Count. It is also available for immediate download and adjustment. So, changes can be made in the color, design, graphics or any other component to create a unique layout. This slide showcases the workforce potential appraisal management dashboard which helps an organization to track, monitor and identify employee movements and hidden talent. It include details such as name, email, department, designation, etc.
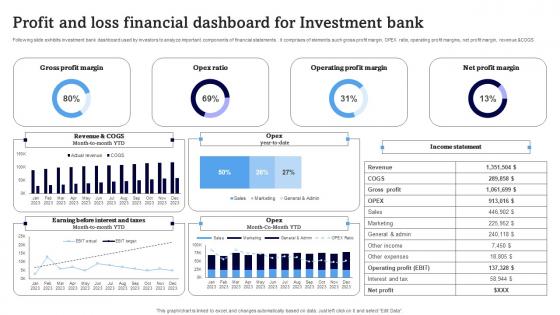
Profit And Loss Financial Dashboard For Investment Bank Download Pdf
Following slide exhibits investment bank dashboard used by investors to analyze important components of financial statements . it comprises of elements such gross profit margin, OPEX ratio, operating profit margins, net profit margin, revenue andCOGS Pitch your topic with ease and precision using this Profit And Loss Financial Dashboard For Investment Bank Download Pdf. This layout presents information on Gross Profit Margin, Opex Ratio, Operating Profit Margin. It is also available for immediate download and adjustment. So, changes can be made in the color, design, graphics or any other component to create a unique layout. Following slide exhibits investment bank dashboard used by investors to analyze important components of financial statements . it comprises of elements such gross profit margin, OPEX ratio, operating profit margins, net profit margin, revenue andCOGS
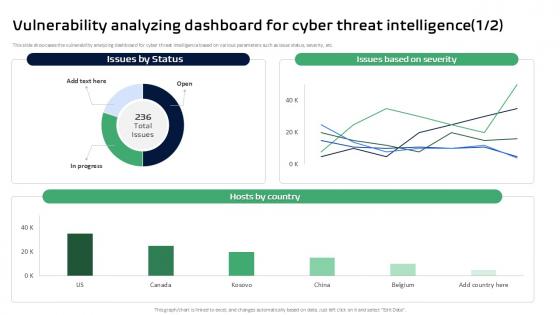
Vulnerability Analyzing Dashboard For Cyber Threat Intelligence Ppt Sample
This slide showcases the vulnerability analyzing dashboard for cyber threat intelligence based on various parameters such as issue status, severity, etc. This Vulnerability Analyzing Dashboard For Cyber Threat Intelligence Ppt Sample from Slidegeeks makes it easy to present information on your topic with precision. It provides customization options, so you can make changes to the colors, design, graphics, or any other component to create a unique layout. It is also available for immediate download, so you can begin using it right away. Slidegeeks has done good research to ensure that you have everything you need to make your presentation stand out. Make a name out there for a brilliant performance. This slide showcases the vulnerability analyzing dashboard for cyber threat intelligence based on various parameters such as issue status, severity, etc.
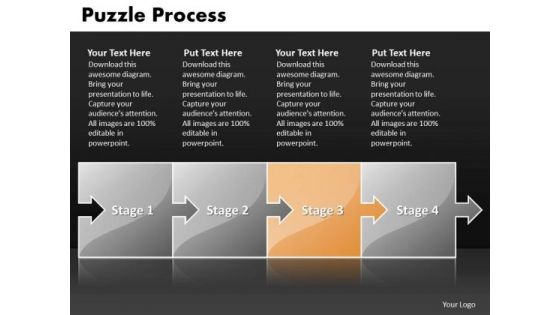
Ppt Puzzle Process Social Backgrounds Concepts PowerPoint Templates
PPT puzzle process social backgrounds concepts PowerPoint Templates-This puzzle process diagram is a wonderful graphics to focus on flow of many business processes. Display the direction of the specific activities involved and how to put these in a proper manner for achieving the desired goal.-PPT puzzle process social backgrounds concepts PowerPoint Templates-Abstract, Action, Attach, Box, Business, Center, Chain, Chart, Color, Communication, Concept, Connection, Cube, Cycle, Data, Diagram, Flow, Globe, Horizontal, Idea, Illustration, Individual, Information, Interaction, Jigsaw, Join, Link, Merge, Missing, Opportunity, Part, People, Piece, Pieces, Process, Puzzle, Relation, Relationship, Search, Shape, Silhouette, Success, Puzzle, Pieces Get executive with our Ppt Puzzle Process Social Backgrounds Concepts PowerPoint Templates. Manage assets to achieve the desired end.
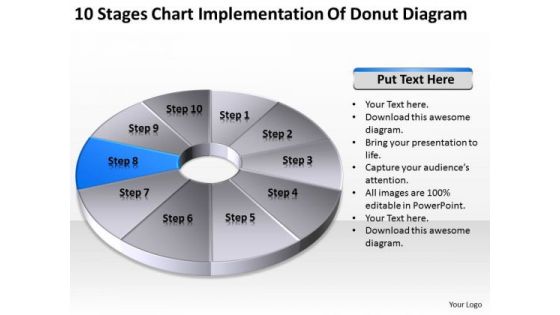
10 Stages Chart Implementation Of Donut Diagram Ppt Making Business Plan PowerPoint Template
We present our 10 stages chart implementation of donut diagram ppt making business plan PowerPoint template.Download our Circle Charts PowerPoint Templates because You should Kick up a storm with our PowerPoint Templates and Slides. The heads of your listeners will swirl with your ideas. Download our Marketing PowerPoint Templates because Our PowerPoint Templates and Slides are topically designed to provide an attractive backdrop to any subject. Present our Signs PowerPoint Templates because Our PowerPoint Templates and Slides provide you with a vast range of viable options. Select the appropriate ones and just fill in your text. Download and present our Finance PowerPoint Templates because It will mark the footprints of your journey. Illustrate how they will lead you to your desired destination. Download our Business PowerPoint Templates because our PowerPoint Templates and Slides will give your ideas the shape.Use these PowerPoint slides for presentations relating to chart, pie, graph, vector, 3d, icon, diagram, progress, business, circular, design, information, market, opinion, corporate, sign, symbol, shadow, percentage, graphic, finance, data, element, drawing, report, marketing, shape, illustration, earnings, number, strategy, money, dimensional, survey, growth, colorful, global, account, part, investment, statistic, financial, results, portion. The prominent colors used in the PowerPoint template are Blue, Gray, Black. Counsel teams with our 10 Stages Chart Implementation Of Donut Diagram Ppt Making Business Plan PowerPoint Template. Download without worries with our money back guaranteee.
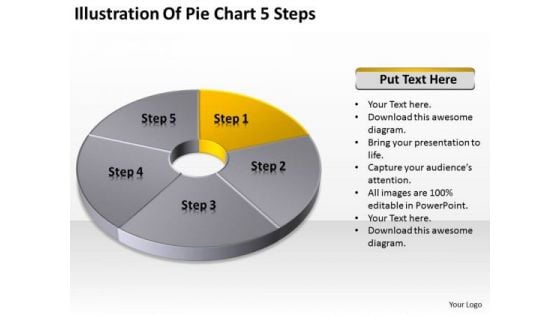
Illustration Of Pie Chart 5 Step Simple Business Plan PowerPoint Templates
We present our illustration of pie chart 5 step simple business plan PowerPoint templates.Use our Circle Charts PowerPoint Templates because Our PowerPoint Templates and Slides help you pinpoint your timelines. Highlight the reasons for your deadlines with their use. Download and present our Shapes PowerPoint Templates because Our PowerPoint Templates and Slides are topically designed to provide an attractive backdrop to any subject. Use our Success PowerPoint Templates because They will Put your wonderful verbal artistry on display. Our PowerPoint Templates and Slides will provide you the necessary glam and glitter. Use our Business PowerPoint Templates because You aspire to touch the sky with glory. Let our PowerPoint Templates and Slides provide the fuel for your ascent. Download and present our Process and Flows PowerPoint Templates because Our PowerPoint Templates and Slides come in all colours, shades and hues. They help highlight every nuance of your views.Use these PowerPoint slides for presentations relating to pie, chart, market, statistics, sales, slice, economy, display, corporate, business, concept, render, success, presentation, diagram, percentage, graphic, finance, data, bank, report, marketing, accounting, management, graph, illustration, icon, piece, strategy, money, growth, company, control, competition, progress, account, sheet, profit, part, information, investment, improvement, banking, index, financial, reflect, results, performance, exchange. The prominent colors used in the PowerPoint template are Yellow, Gray, Black. Find favour with the audience for your ideas. Our Illustration Of Pie Chart 5 Step Simple Business Plan PowerPoint Templates will extract approval.
Annual Revenue And Cost Budget Deficit KPI Dashboard Ideas PDF
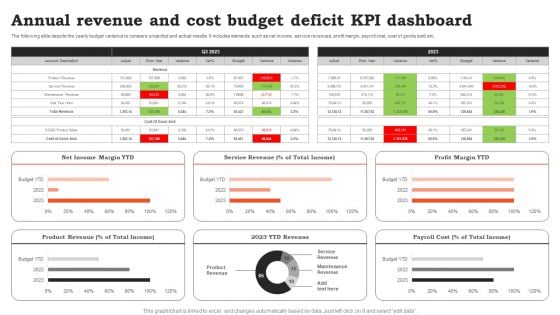
The following slide depicts the yearly budget variance to compare projected and actual results. It includes elements such as net income, service revenues, profit margin, payroll cost, cost of goods sold etc. Showcasing this set of slides titled Annual Revenue And Cost Budget Deficit KPI Dashboard Ideas PDF. The topics addressed in these templates are Cost Budget, Deficit KPI Dashboard. All the content presented in this PPT design is completely editable. Download it and make adjustments in color, background, font etc. as per your unique business setting.
Manufacturing KPI Dashboard For Process Implementing Manufacturing Strategy SS V
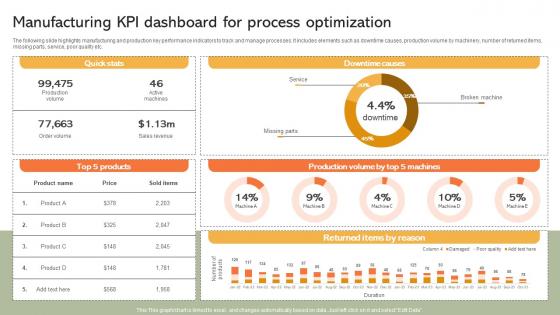
The following slide highlights manufacturing and production key performance indicators to track and manage processes. It includes elements such as downtime causes, production volume by machinery, number of returned items, missing parts, service, poor quality etc. Formulating a presentation can take up a lot of effort and time, so the content and message should always be the primary focus. The visuals of the PowerPoint can enhance the presenters message, so our Manufacturing KPI Dashboard For Process Implementing Manufacturing Strategy SS V was created to help save time. Instead of worrying about the design, the presenter can concentrate on the message while our designers work on creating the ideal templates for whatever situation is needed. Slidegeeks has experts for everything from amazing designs to valuable content, we have put everything into Manufacturing KPI Dashboard For Process Implementing Manufacturing Strategy SS V The following slide highlights manufacturing and production key performance indicators to track and manage processes. It includes elements such as downtime causes, production volume by machinery, number of returned items, missing parts, service, poor quality etc.
Work From Home Performance Management Dashboard Optimizing Staff Retention Rate Topics Pdf
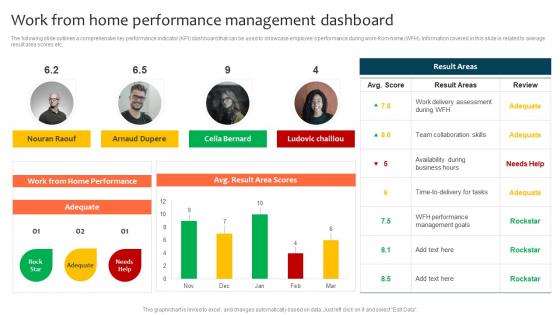
The following slide outlines a comprehensive key performance indicator KPI dashboard that can be used to showcase employees performance during work-from-home WFH. Information covered in this slide is related to average result area scores etc. This Work From Home Performance Management Dashboard Optimizing Staff Retention Rate Topics Pdf is perfect for any presentation, be it in front of clients or colleagues. It is a versatile and stylish solution for organizing your meetings. The Work From Home Performance Management Dashboard Optimizing Staff Retention Rate Topics Pdf features a modern design for your presentation meetings. The adjustable and customizable slides provide unlimited possibilities for acing up your presentation. Slidegeeks has done all the homework before launching the product for you. So, do not wait, grab the presentation templates today The following slide outlines a comprehensive key performance indicator KPI dashboard that can be used to showcase employees performance during work-from-home WFH. Information covered in this slide is related to average result area scores etc.
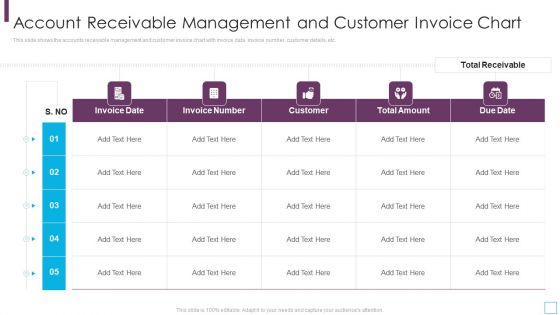
Key Strategies For Account Receivable Management And Customer Invoice Chart Elements PDF
This slide shows the accounts receivable management and customer invoice chart with invoice data, invoice number, customer details, etc.Deliver and pitch your topic in the best possible manner with this key strategies for account receivable management and customer invoice chart elements pdf Use them to share invaluable insights on account receivable management and customer invoice chart and impress your audience. This template can be altered and modified as per your expectations. So, grab it now.
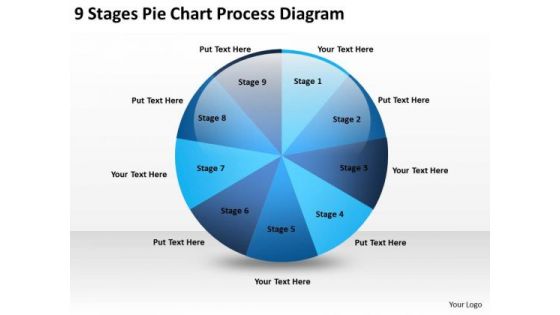
9 Stages Pie Chart Process Diagram How Do You Write Business Plan PowerPoint Slides
We present our 9 stages pie chart process diagram how do you write business plan PowerPoint Slides.Present our Process and Flows PowerPoint Templates because You can Zap them with our PowerPoint Templates and Slides. See them reel under the impact. Use our Circle Charts PowerPoint Templates because You can Create a matrix with our PowerPoint Templates and Slides. Feel the strength of your ideas click into place. Use our Business PowerPoint Templates because Our PowerPoint Templates and Slides are designed to help you succeed. They have all the ingredients you need. Present our Success PowerPoint Templates because Your audience will believe you are the cats whiskers. Download our Future PowerPoint Templates because Our PowerPoint Templates and Slides will give you great value for your money. Be assured of finding the best projection to highlight your words. Use these PowerPoint slides for presentations relating to Pie, chart, business, market, slice, isometric, display, perspective, green, corporate, blank, concept, sign, presentation, symbol, diagram,circle, graphic, finance, data, stock, element, bank, report, marketing, abstract, management, graph, modern, illustration, icon, motion, company,organization, information, environment, banking, financial. The prominent colors used in the PowerPoint template are Blue, Blue light, Blue navy. Add class with our 9 Stages Pie Chart Process Diagram How Do You Write Business Plan PowerPoint Slides. You will come out on top.
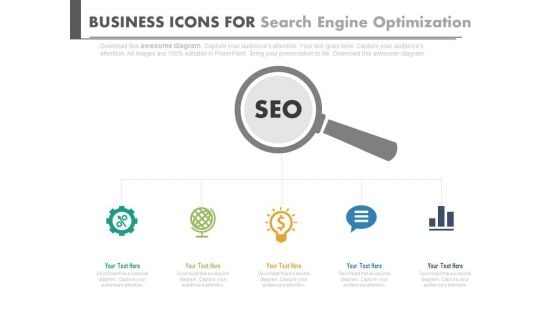
Magnifier For Search Engine Optimization Techniques Powerpoint Template
Visually support your presentation with our above template showing magnifier with SEO text and icons. This slide has been professionally designed to present SEO techniques. This template offers an excellent background to build impressive presentation.
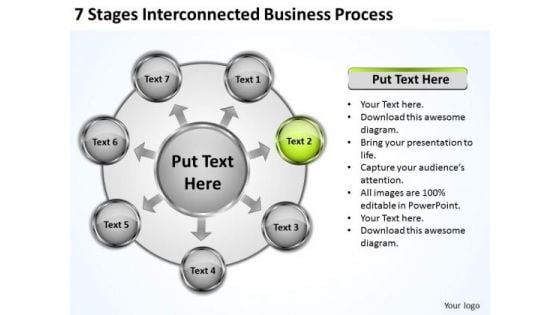
Business Strategy Consulting 7 Stage Interconnected Process PowerPoint
We present our business strategy consulting 7 stage interconnected process Powerpoint.Download our Marketing PowerPoint Templates because you can Add colour to your speech with our PowerPoint Templates and Slides. Your presentation will leave your audience speechless. Use our Business PowerPoint Templates because Our PowerPoint Templates and Slides are conceived by a dedicated team. Use them and give form to your wondrous ideas. Use our Arrows PowerPoint Templates because Our PowerPoint Templates and Slides will let you Leave a lasting impression to your audiences. They possess an inherent longstanding recall factor. Download and present our Circle Charts PowerPoint Templates because Our PowerPoint Templates and Slides will Embellish your thoughts. They will help you illustrate the brilliance of your ideas. Present our Shapes PowerPoint Templates because Timeline crunches are a fact of life. Meet all deadlines using our PowerPoint Templates and Slides.Use these PowerPoint slides for presentations relating to 3d, Analysis, Brainstorming, Business, Chart, Circle, Circular, Classroom, Concept, Conference, Curving, Cycle, Design, Diagram, Direction, Element, Financial, Flow, Flowchart, Formula, Future, Goal, Graphic, Idea, Management, Market, Marketing, Mind, Mind Map, Motion, Movement, Organization, Organize, Plan, Presentation, Process, Product, Questions, Render, Solutions, Solve, Strategy, Success, Symbol, Target. The prominent colors used in the PowerPoint template are Green, Gray, Black. Show them you are superior with our Business Strategy Consulting 7 Stage Interconnected Process PowerPoint. You'll always stay ahead of the game.
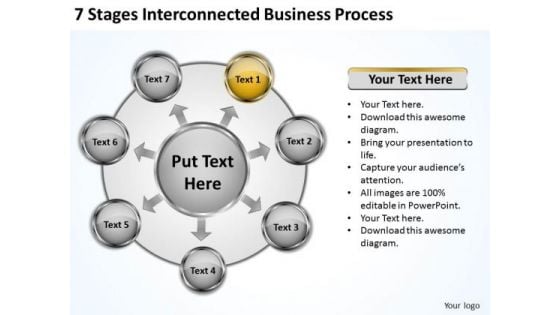
Business Strategy Consulting 7 Stages Interconnected Process PowerPoint
We present our business strategy consulting 7 stages interconnected process Powerpoint.Download and present our Marketing PowerPoint Templates because Our PowerPoint Templates and Slides will let your team Walk through your plans. See their energy levels rise as you show them the way. Use our Business PowerPoint Templates because It will Give impetus to the hopes of your colleagues. Our PowerPoint Templates and Slides will aid you in winning their trust. Present our Arrows PowerPoint Templates because Our PowerPoint Templates and Slides offer you the widest possible range of options. Present our Circle Charts PowerPoint Templates because Our PowerPoint Templates and Slides will effectively help you save your valuable time. They are readymade to fit into any presentation structure. Use our Shapes PowerPoint Templates because our PowerPoint Templates and Slides will give your ideas the shape.Use these PowerPoint slides for presentations relating to 3d, Analysis, Brainstorming, Business, Chart, Circle, Circular, Classroom, Concept, Conference, Curving, Cycle, Design, Diagram, Direction, Element, Financial, Flow, Flowchart, Formula, Future, Goal, Graphic, Idea, Management, Market, Marketing, Mind, Mind Map, Motion, Movement, Organization, Organize, Plan, Presentation, Process, Product, Questions, Render, Solutions, Solve, Strategy, Success, Symbol, Target. The prominent colors used in the PowerPoint template are Yellow, Gray, Black. Our Business Strategy Consulting 7 Stages Interconnected Process PowerPoint team do not have any fetish. They pay equal attention to every element.
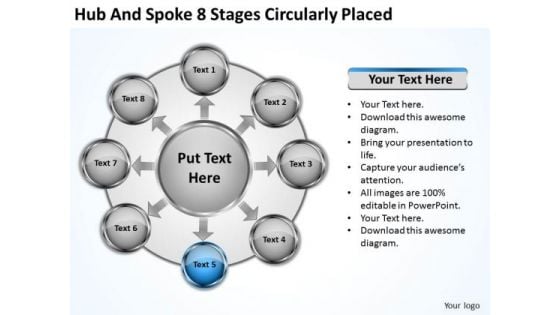
Business Strategy Formulation Spoke 8 Stages Circularly Placed Consulting
We present our business strategy formulation spoke 8 stages circularly placed consulting.Use our Marketing PowerPoint Templates because You will get more than you ever bargained for. Use our Business PowerPoint Templates because Our PowerPoint Templates and Slides will effectively help you save your valuable time. They are readymade to fit into any presentation structure. Present our Arrows PowerPoint Templates because You can Raise a toast with our PowerPoint Templates and Slides. Spread good cheer amongst your audience. Use our Circle Charts PowerPoint Templates because It can Conjure up grand ideas with our magical PowerPoint Templates and Slides. Leave everyone awestruck by the end of your presentation. Use our Shapes PowerPoint Templates because You canTake a leap off the starting blocks with our PowerPoint Templates and Slides. They will put you ahead of the competition in quick time.Use these PowerPoint slides for presentations relating to 3d, Analysis, Brainstorming, Business, Chart, Circle, Circular, Classroom, Concept, Conference, Curving, Cycle, Design, Diagram, Direction, Element, Financial, Flow, Flowchart, Formula, Future, Goal, Graphic, Idea, Management, Market, Marketing, Mind, Mind Map, Motion, Movement, Organization, Organize, Plan, Presentation, Process, Product, Questions, Render, Solutions, Solve, Strategy, Success, Symbol, Target. The prominent colors used in the PowerPoint template are Green, Gray, Black. Amuse your audience with our Business Strategy Formulation Spoke 8 Stages Circularly Placed Consulting. Some of them are designed to be far out.
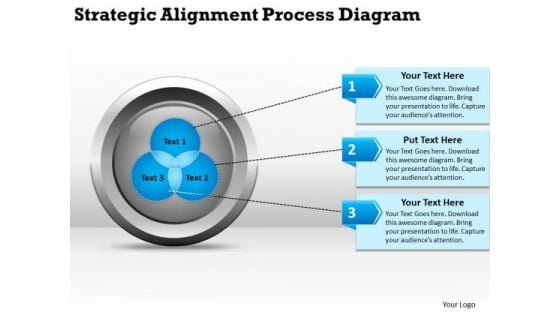
Strategic Alignment Process Diagarm Start Up Business Plan Template PowerPoint Slides
We present our strategic alignment process diagarm start up business plan template PowerPoint Slides.Download and present our Circle Charts PowerPoint Templates because Our PowerPoint Templates and Slides will let Your superior ideas hit the target always and everytime. Download our Process and Flows PowerPoint Templates because You aspire to touch the sky with glory. Let our PowerPoint Templates and Slides provide the fuel for your ascent. Present our Business PowerPoint Templates because Our PowerPoint Templates and Slides will let you Hit the right notes. Watch your audience start singing to your tune. Download our Marketing PowerPoint Templates because You can Bask in the warmth of our PowerPoint Templates and Slides. Enjoy the heartfelt glowing response of your listeners. Present our Future PowerPoint Templates because Our PowerPoint Templates and Slides has conjured up a web of all you need with the help of our great team. Use them to string together your glistening ideas.Use these PowerPoint slides for presentations relating to Organization, business, team, leadership, strategic, post, individual, white, innovation, corporate, plan, culture, success, infrastructure, diagram, pen,analysis, flowchart, drawing, people, graph, support, creativity, chart, strategy, ruler, design, alignment, paper, grid, background, ideas. The prominent colors used in the PowerPoint template are Blue, Gray, White. Our Strategic Alignment Process Diagarm Start Up Business Plan Template PowerPoint Slides make a great bait. Your ideas will hook them all.
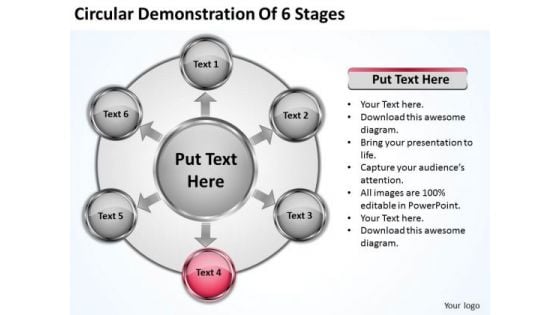
Marketing Concepts Circular Demonstration Of 6 Stages Business Expansion Strategy
We present our marketing concepts circular demonstration of 6 stages business expansion strategy.Download our Circle Charts PowerPoint Templates because Timeline crunches are a fact of life. Meet all deadlines using our PowerPoint Templates and Slides. Use our Arrows PowerPoint Templates because Our PowerPoint Templates and Slides are focused like a searchlight beam. They highlight your ideas for your target audience. Use our Business PowerPoint Templates because You canTake a leap off the starting blocks with our PowerPoint Templates and Slides. They will put you ahead of the competition in quick time. Present our Shapes PowerPoint Templates because You should Ascend the ladder of success with ease. Our PowerPoint Templates and Slides will provide strong and sturdy steps. Use our Advertising PowerPoint Templates because You can Stir your ideas in the cauldron of our PowerPoint Templates and Slides. Cast a magic spell on your audience.Use these PowerPoint slides for presentations relating to Process, Business, Link, Central, Diagram, Hexagon, Man, Hexagonal, Flow, Write, Blank, Concept, Centric, Center, Sketch, Background, Human, Seminar, Whiteboard, Teacher, Plan, Sign, Presentation, Graphic, Pen, Reverse, Analysis, Teaching, Idea, Creativity, Connection, Chart, Strategy, Person, Empty, Showing, Advice, Connect, Pointing, Meeting, Education, Draw, Manager, Analyze, Office, Reversible, Screen, Hand, Counter, Businessman. The prominent colors used in the PowerPoint template are Red, Gray, Black. Experience a defining event with our Marketing Concepts Circular Demonstration Of 6 Stages Business Expansion Strategy. Change direction for the better.
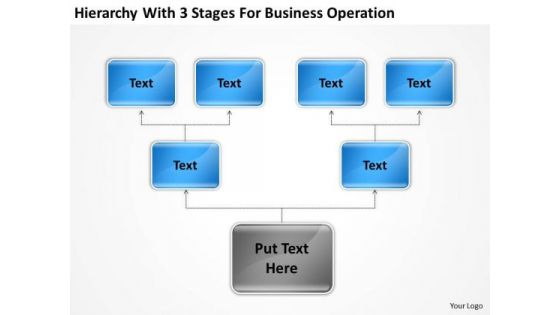
3 Stages For Business Operation Ppt Setting Up Plan PowerPoint Templates
We present our 3 stages for business operation ppt setting up plan PowerPoint templates.Download our Business PowerPoint Templates because you can Break through with our PowerPoint Templates and Slides. Bring down the mental barriers of your audience. Download our Finance PowerPoint Templates because You can Bask in the warmth of our PowerPoint Templates and Slides. Enjoy the heartfelt glowing response of your listeners. Download and present our Shapes PowerPoint Templates because They will bring a lot to the table. Their alluring flavours will make your audience salivate. Use our Flow Charts PowerPoint Templates because Our PowerPoint Templates and Slides are created with admirable insight. Use them and give your group a sense of your logical mind. Use our Process and Flows PowerPoint Templates because You can Hit the nail on the head with our PowerPoint Templates and Slides. Embed your ideas in the minds of your audience.Use these PowerPoint slides for presentations relating to Business, plan, process, chart, corporate, success, diagram, strong, finance, analysis, idea, management, start, stage, operational, strategy, develop, professional, procedure, organize, assessment, increase, implement, successful, improvement, financial, continuous. The prominent colors used in the PowerPoint template are Gray, Blue, White. With our 3 Stages For Business Operation Ppt Setting Up Plan PowerPoint Templates there is never a famine of ideas. Freshideas will keep churning out.
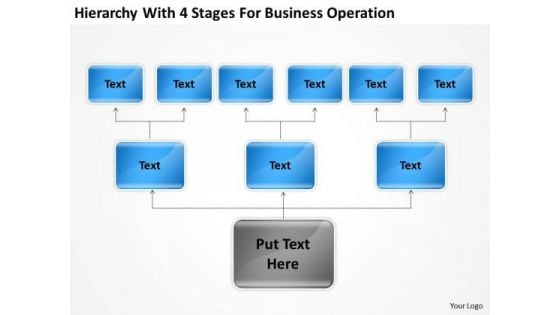
Hierarchy With 4 Stages For Business Operation Ppt Sample Small Plan PowerPoint Slides
We present our hierarchy with 4 stages for business operation ppt sample small plan PowerPoint Slides.Present our Business PowerPoint Templates because Our PowerPoint Templates and Slides come in all colours, shades and hues. They help highlight every nuance of your views. Present our Finance PowerPoint Templates because Our PowerPoint Templates and Slides will let you Hit the right notes. Watch your audience start singing to your tune. Download our Shapes PowerPoint Templates because Our PowerPoint Templates and Slides will Embellish your thoughts. They will help you illustrate the brilliance of your ideas. Use our Flow Charts PowerPoint Templates because Our PowerPoint Templates and Slides are designed to help you succeed. They have all the ingredients you need. Present our Process and Flows PowerPoint Templates because Our PowerPoint Templates and Slides are Clear and concise. Use them and dispel any doubts your team may have.Use these PowerPoint slides for presentations relating to Business, plan, process, chart, corporate, success, diagram, strong, finance, analysis, idea, management, start, stage, operational, strategy, develop, professional, procedure, organize, assessment, increase, implement, successful, improvement, financial, continuous. The prominent colors used in the PowerPoint template are Blue, Gray, Black. Connect the dots differently. Be daring with our Hierarchy With 4 Stages For Business Operation Ppt Sample Small Plan PowerPoint Slides.

Hierechy With Three Stages For Business Process Ppt Bar Plan Sample PowerPoint Slides
We present our hierechy with three stages for business process ppt bar plan sample PowerPoint Slides.Present our Business PowerPoint Templates because Our PowerPoint Templates and Slides will Embellish your thoughts. They will help you illustrate the brilliance of your ideas. Download our Finance PowerPoint Templates because It will Raise the bar of your Thoughts. They are programmed to take you to the next level. Download our Shapes PowerPoint Templates because These PowerPoint Templates and Slides will give the updraft to your ideas. See them soar to great heights with ease. Use our Flow Charts PowerPoint Templates because Our PowerPoint Templates and Slides ensures Effective communication. They help you put across your views with precision and clarity. Download our Process and Flows PowerPoint Templates because Our PowerPoint Templates and Slides will fulfill your every need. Use them and effectively satisfy the desires of your audience.Use these PowerPoint slides for presentations relating to Business, plan, process, chart, corporate, success, diagram, strong, finance, analysis, idea, management, start, stage, operational, strategy, develop, professional, procedure, organize, assessment, increase, implement, successful, improvement, financial, continuous. The prominent colors used in the PowerPoint template are Gray, Blue, Black. Add emphasis to your ideas with our Hierechy With Three Stages For Business Process Ppt Bar Plan Sample PowerPoint Slides. Lend greater credence to your expression.
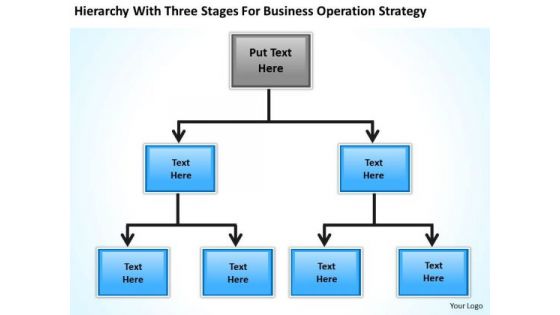
Stages For Business Operation Stretegy Ppt Continuity Plan Example PowerPoint Slides
We present our stages for business operation stretegy ppt continuity plan example PowerPoint Slides.Download our Business PowerPoint Templates because Our PowerPoint Templates and Slides will Embellish your thoughts. They will help you illustrate the brilliance of your ideas. Download and present our Finance PowerPoint Templates because It is Aesthetically crafted by artistic young minds. Our PowerPoint Templates and Slides are designed to display your dexterity. Use our Shapes PowerPoint Templates because you can Add colour to your speech with our PowerPoint Templates and Slides. Your presentation will leave your audience speechless. Download our Flow Charts PowerPoint Templates because Our PowerPoint Templates and Slides are topically designed to provide an attractive backdrop to any subject. Present our Process and Flows PowerPoint Templates because Our PowerPoint Templates and Slides ensures Effective communication. They help you put across your views with precision and clarity.Use these PowerPoint slides for presentations relating to Business, plan, process, chart, corporate, success, diagram, strong, finance, analysis, idea, management, start, stage, operational, strategy, develop, professional, procedure, organize, assessment, increase, implement, successful, improvement, financial, continuous. The prominent colors used in the PowerPoint template are Blue, Gray, Black. Call on the expertise of our Stages For Business Operation Stretegy Ppt Continuity Plan Example PowerPoint Slides team. Experience excellence in their every design.
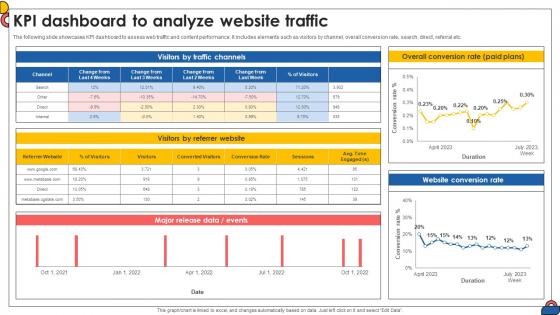
Kpi Dashboard To Analyze Website Traffic Comprehensive Guide To Implement Strategy SS V
The best PPT templates are a great way to save time, energy, and resources. Slidegeeks have 100 percent editable powerpoint slides making them incredibly versatile. With these quality presentation templates, you can create a captivating and memorable presentation by combining visually appealing slides and effectively communicating your message. Download Kpi Dashboard To Analyze Website Traffic Comprehensive Guide To Implement Strategy SS V from Slidegeeks and deliver a wonderful presentation. The following slide showcases KPI dashboard to assess web traffic and content performance. It includes elements such as visitors by channel, overall conversion rate, search, direct, referral etc.
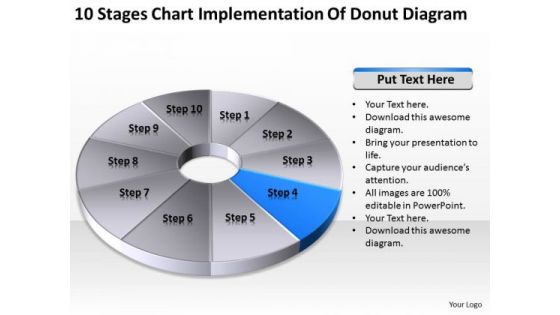
10 Stages Chart Implementation Of Donut Diagram Business Plan PowerPoint Slides
We present our 10 stages chart implementation of donut diagram business plan PowerPoint Slides.Download and present our Circle Charts PowerPoint Templates because It will get your audience in sync. Present our Marketing PowerPoint Templates because Our PowerPoint Templates and Slides will generate and maintain the level of interest you desire. They will create the impression you want to imprint on your audience. Download and present our Signs PowerPoint Templates because You can Zap them with our PowerPoint Templates and Slides. See them reel under the impact. Use our Finance PowerPoint Templates because Our PowerPoint Templates and Slides will embellish your thoughts. See them provide the desired motivation to your team. Present our Business PowerPoint Templates because You will get more than you ever bargained for. Use these PowerPoint slides for presentations relating to chart, pie, graph, vector, 3d, icon, diagram, progress, business, circular, design, information, market, opinion, corporate, sign, symbol, shadow, percentage, graphic, finance, data, element, drawing, report, marketing, shape, illustration, earnings, number, strategy, money, dimensional, survey, growth, colorful, global, account, part, investment, statistic, financial, results, portion. The prominent colors used in the PowerPoint template are Blue, Gray, Black. Get a firm handle on your discussion with our 10 Stages Chart Implementation Of Donut Diagram Business Plan PowerPoint Slides. Try us out and see what a difference our templates make.
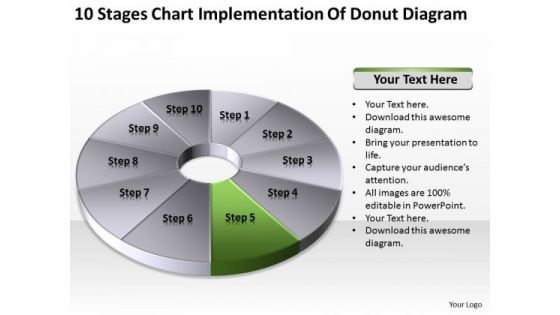
10 Stages Chart Implementation Of Donut Diagram Ppt Business Plan PowerPoint Slides
We present our 10 stages chart implementation of donut diagram ppt business plan PowerPoint Slides.Download our Circle Charts PowerPoint Templates because Our PowerPoint Templates and Slides come in all colours, shades and hues. They help highlight every nuance of your views. Download our Marketing PowerPoint Templates because Our PowerPoint Templates and Slides are like the strings of a tennis racquet. Well strung to help you serve aces. Use our Signs PowerPoint Templates because Our PowerPoint Templates and Slides are designed to help you succeed. They have all the ingredients you need. Present our Finance PowerPoint Templates because Our PowerPoint Templates and Slides will let you Hit the right notes. Watch your audience start singing to your tune. Download our Business PowerPoint Templates because These PowerPoint Templates and Slides will give the updraft to your ideas. See them soar to great heights with ease.Use these PowerPoint slides for presentations relating to chart, pie, graph, vector, 3d, icon, diagram, progress, business, circular, design, information, market, opinion, corporate, sign, symbol, shadow, percentage, graphic, finance, data, element, drawing, report, marketing, shape, illustration, earnings, number, strategy, money, dimensional, survey, growth, colorful, global, account, part, investment, statistic, financial, results, portion. The prominent colors used in the PowerPoint template are Green, Gray, Black. Embolden them with your thoughts. Our 10 Stages Chart Implementation Of Donut Diagram Ppt Business Plan PowerPoint Slides will get them all animated.
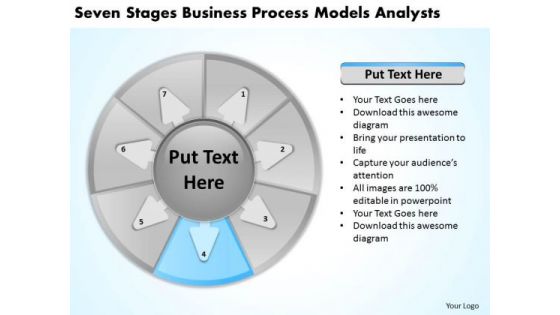
Business Process Models Analysts Plan Template PowerPoint Templates
We present our business process models analysts plan template PowerPoint templates.Present our Circle Charts PowerPoint Templates because Our PowerPoint Templates and Slides offer you the needful to organise your thoughts. Use them to list out your views in a logical sequence. Download and present our Business PowerPoint Templates because Our PowerPoint Templates and Slides will let your words and thoughts hit bullseye everytime. Present our Shapes PowerPoint Templates because Our PowerPoint Templates and Slides will let Your superior ideas hit the target always and everytime. Download and present our Success PowerPoint Templates because Our PowerPoint Templates and Slides will let you Leave a lasting impression to your audiences. They possess an inherent longstanding recall factor. Download and present our Process and Flows PowerPoint Templates because Our PowerPoint Templates and Slides are topically designed to provide an attractive backdrop to any subject.Use these PowerPoint slides for presentations relating to process, closeup, model, white, consultant, concept, arrow, scope, presentation, finger, arm, diagram, analyst, analysis, drawing, female, management, expectation, diamond, time, project, money, girl, close up, direction, woman, group, person, quality, pointing, education, virtual, manager, explanation, screen, hand. The prominent colors used in the PowerPoint template are Blue, Gray, Black. Get a grand finale feel with our Business Process Models Analysts Plan Template PowerPoint Templates. The applause will rise to a crescendo.
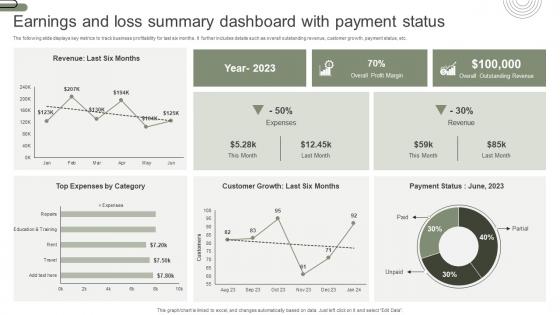
Earnings And Loss Summary Dashboard With Payment Status Elements Pdf
The following slide displays key metrics to track business profitability for last six months. It further includes details such as overall outstanding revenue, customer growth, payment status, etc. Pitch your topic with ease and precision using this Earnings And Loss Summary Dashboard With Payment Status Elements Pdf. This layout presents information on Earnings And Loss, Summary Dashboard, Payment Status. It is also available for immediate download and adjustment. So, changes can be made in the color, design, graphics or any other component to create a unique layout. The following slide displays key metrics to track business profitability for last six months. It further includes details such as overall outstanding revenue, customer growth, payment status, etc.
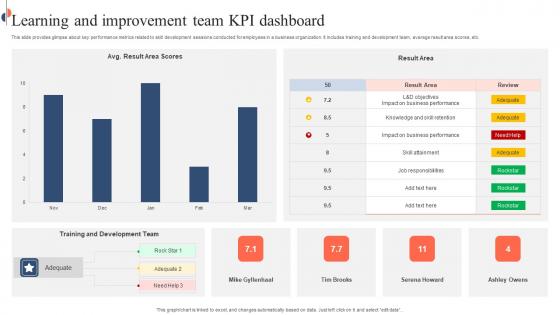
Learning And Improvement Team KPI Dashboard Slides Pdf
This slide provides glimpse about key performance metrics related to skill development sessions conducted for employees in a business organization. It includes training and development team, average result area scores, etc. Pitch your topic with ease and precision using this Learning And Improvement Team KPI Dashboard Slides Pdf. This layout presents information on Learning And Improvement Team, KPI Dashboard, Development Team. It is also available for immediate download and adjustment. So, changes can be made in the color, design, graphics or any other component to create a unique layout. This slide provides glimpse about key performance metrics related to skill development sessions conducted for employees in a business organization. It includes training and development team, average result area scores, etc.
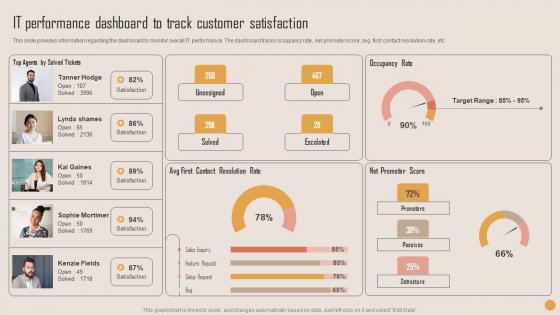
IT Performance Dashboard Playbook For Strategic Actions To Improve IT Performance Rules Pdf
This slide provides information regarding the dashboard to monitor overall IT performance. The dashboard tracks occupancy rate, net promoter score, avg. first contact resolution rate, etc. Presenting this PowerPoint presentation, titled IT Performance Dashboard Playbook For Strategic Actions To Improve IT Performance Rules Pdf, with topics curated by our researchers after extensive research. This editable presentation is available for immediate download and provides attractive features when used. Download now and captivate your audience. Presenting this IT Performance Dashboard Playbook For Strategic Actions To Improve IT Performance Rules Pdf. Our researchers have carefully researched and created these slides with all aspects taken into consideration. This is a completely customizable IT Performance Dashboard Playbook For Strategic Actions To Improve IT Performance Rules Pdf that is available for immediate downloading. Download now and make an impact on your audience. Highlight the attractive features available with our PPTs. This slide provides information regarding the dashboard to monitor overall IT performance. The dashboard tracks occupancy rate, net promoter score, avg. first contact resolution rate, etc.
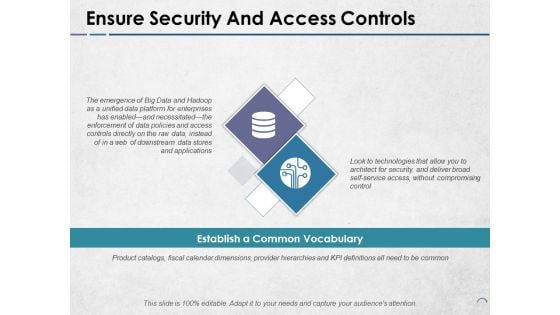
Ensure Security And Access Controls Ppt PowerPoint Presentation Portfolio Images
This is a ensure security and access controls ppt powerpoint presentation portfolio images. This is a two stage process. The stages in this process are icons, strategy, business, management, marketing.
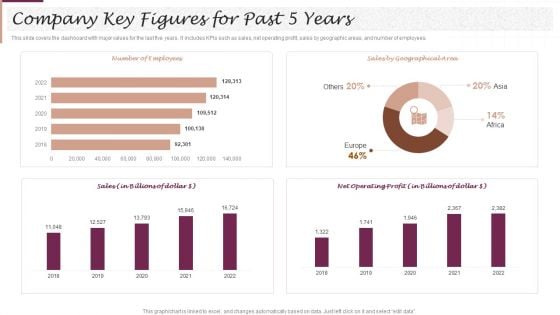
New Market Segment Entry Plan Company Key Figures For Past 5 Years Introduction PDF
This slide covers the dashboard with major values for the last five years. It includes KPIs such as sales, net operating profit, sales by geographic areas, and number of employees. Whether you have daily or monthly meetings, a brilliant presentation is necessary. New Market Segment Entry Plan Company Key Figures For Past 5 Years Introduction PDF can be your best option for delivering a presentation. Represent everything in detail using New Market Segment Entry Plan Company Key Figures For Past 5 Years Introduction PDF and make yourself stand out in meetings. The template is versatile and follows a structure that will cater to your requirements. All the templates prepared by Slidegeeks are easy to download and edit. Our research experts have taken care of the corporate themes as well. So, give it a try and see the results.
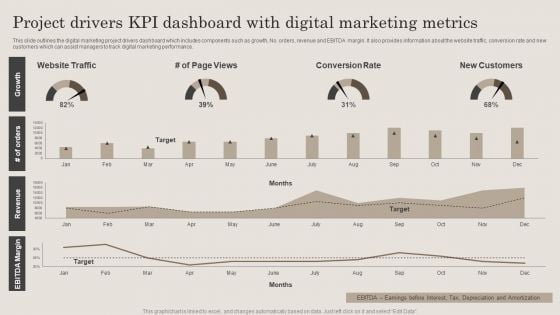
Project Drivers Kpi Dashboard With Digital Marketing Metrics Ppt PowerPoint Presentation File Clipart PDF
This slide outlines the digital marketing project drivers dashboard which includes components such as growth, No. orders, revenue and EBITDA margin. It also provides information about the website traffic, conversion rate and new customers which can assist managers to track digital marketing performance. Showcasing this set of slides titled Project Drivers Kpi Dashboard With Digital Marketing Metrics Ppt PowerPoint Presentation File Clipart PDF. The topics addressed in these templates are Website Traffic, Conversion Rate, New Customers. All the content presented in this PPT design is completely editable. Download it and make adjustments in color, background, font etc. as per your unique business setting.
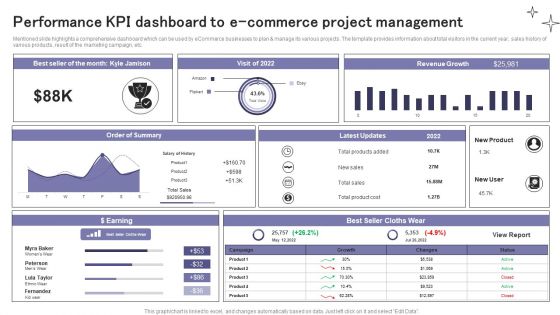
Performance KPI Dashboard To E Commerce Project Management Ppt Summary Inspiration PDF
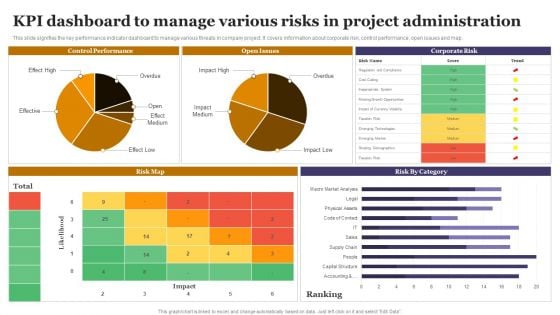
KPI Dashboard To Manage Various Risks In Project Administration Sample PDF
This slide signifies the key performance indicator dashboard to manage various threats in company project. It covers information about corporate risk, control performance, open issues and map. Showcasing this set of slides titled KPI Dashboard To Manage Various Risks In Project Administration Sample PDF. The topics addressed in these templates are Control Performance, Open Issues, Corporate Risk. All the content presented in this PPT design is completely editable. Download it and make adjustments in color, background, font etc. as per your unique business setting.
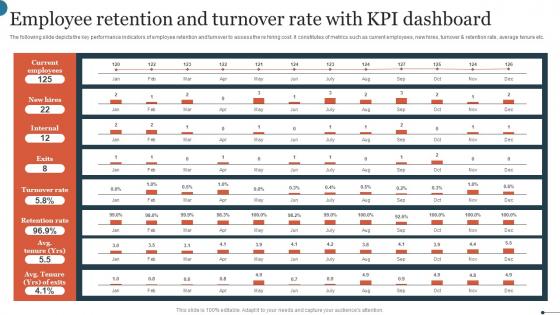
Employee Retention And Turnover Rate With KPI Dashboard Graphics Pdf
The following slide depicts the key performance indicators of employee retention and turnover to assess the re hiring cost. It constitutes of metrics such as current employees, new hires, turnover and retention rate, average tenure etc. Showcasing this set of slides titled Employee Retention And Turnover Rate With KPI Dashboard Graphics Pdf. The topics addressed in these templates are Current Employees, Turnover Rate, Retention Rate. All the content presented in this PPT design is completely editable. Download it and make adjustments in color, background, font etc. as per your unique business setting. The following slide depicts the key performance indicators of employee retention and turnover to assess the re hiring cost. It constitutes of metrics such as current employees, new hires, turnover and retention rate, average tenure etc.
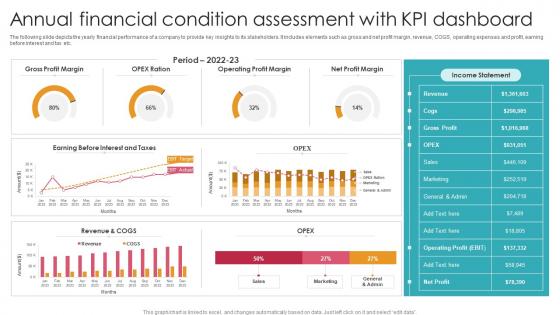
Annual Financial Condition Assessment With KPI Dashboard Ideas Pdf
The following slide depicts the yearly financial performance of a company to provide key insights to its stakeholders. It includes elements such as gross and net profit margin, revenue, COGS, operating expenses and profit, earning before interest and tax etc. Showcasing this set of slides titled Annual Financial Condition Assessment With KPI Dashboard Ideas Pdf. The topics addressed in these templates are Gross Profit Margin, Operating Profit Margin, Net Profit Margin. All the content presented in this PPT design is completely editable. Download it and make adjustments in color, background, font etc. as per your unique business setting. The following slide depicts the yearly financial performance of a company to provide key insights to its stakeholders. It includes elements such as gross and net profit margin, revenue, COGS, operating expenses and profit, earning before interest and tax etc.
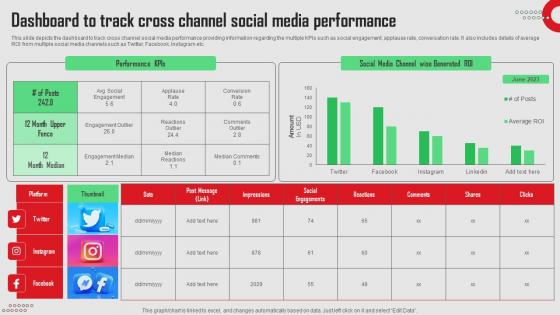
Dashboard To Track Cross Channel Social Media Platforms Performance Inspiration Pdf
This slide depicts the dashboard to track cross channel social media performance providing information regarding the multiple KPIs such as social engagement, applause rate, conversation rate. It also includes details of average ROI from multiple social media channels such as Twitter, Facebook, Instagram etc.There are so many reasons you need a Dashboard To Track Cross Channel Social Media Platforms Performance Inspiration Pdf. The first reason is you can not spend time making everything from scratch, Thus, Slidegeeks has made presentation templates for you too. You can easily download these templates from our website easily. This slide depicts the dashboard to track cross channel social media performance providing information regarding the multiple KPIs such as social engagement, applause rate, conversation rate. It also includes details of average ROI from multiple social media channels such as Twitter, Facebook, Instagram etc.
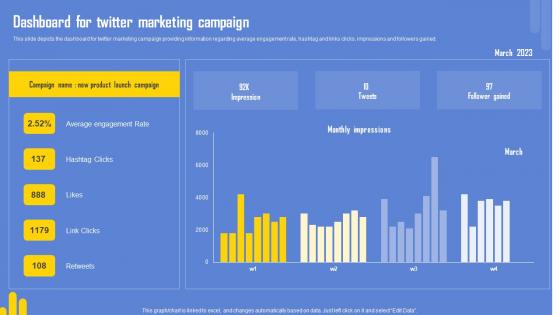
Optimizing Twitter For Online Dashboard For Twitter Marketing Campaign Download Pdf
This slide depicts the dashboard for twitter marketing campaign providing information regarding average engagement rate, hashtag and links clicks, impressions and followers gained. Present like a pro with Optimizing Twitter For Online Dashboard For Twitter Marketing Campaign Download Pdf Create beautiful presentations together with your team, using our easy-to-use presentation slides. Share your ideas in real-time and make changes on the fly by downloading our templates. So whether you are in the office, on the go, or in a remote location, you can stay in sync with your team and present your ideas with confidence. With Slidegeeks presentation got a whole lot easier. Grab these presentations today. This slide depicts the dashboard for twitter marketing campaign providing information regarding average engagement rate, hashtag and links clicks, impressions and followers gained.
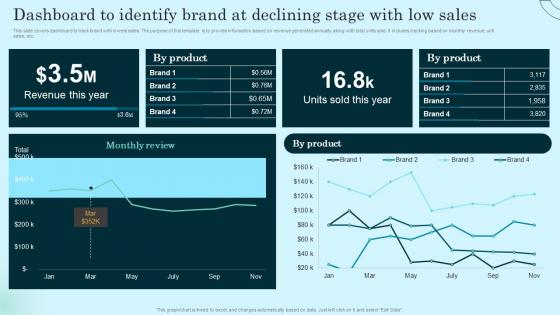
Dashboard To Identify Brand At Declining Stage Comprehensive Guide To Product Lifecycle Template Pdf
This slide covers dashboard to track brand with lowest sales. The purpose of this template is to provide information based on revenue generated annually along with total units sold. It includes tracking based on monthly revenue, unit sales, etc. From laying roadmaps to briefing everything in detail, our templates are perfect for you. You can set the stage with your presentation slides. All you have to do is download these easy to edit and customizable templates. Dashboard To Identify Brand At Declining Stage Comprehensive Guide To Product Lifecycle Template Pdf will help you deliver an outstanding performance that everyone would remember and praise you for. Do download this presentation today. This slide covers dashboard to track brand with lowest sales. The purpose of this template is to provide information based on revenue generated annually along with total units sold. It includes tracking based on monthly revenue, unit sales, etc.
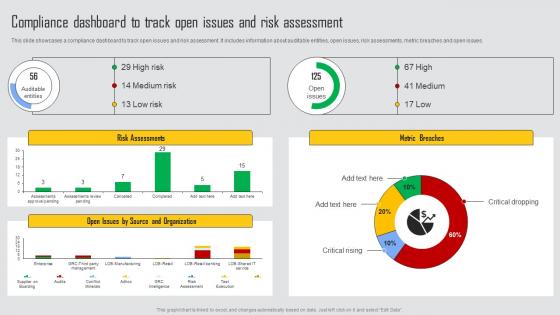
Compliance Dashboard To Track Managing Risks And Establishing Trust Through Efficient Rules Pdf
This slide showcases a compliance dashboard to track open issues and risk assessment. It includes information about auditable entities, open issues, risk assessments, metric breaches and open issues. This modern and well arranged Compliance Dashboard To Track Managing Risks And Establishing Trust Through Efficient Rules Pdf provides lots of creative possibilities. It is very simple to customize and edit with the Powerpoint Software. Just drag and drop your pictures into the shapes. All facets of this template can be edited with Powerpoint, no extra software is necessary. Add your own material, put your images in the places assigned for them, adjust the colors, and then you can show your slides to the world, with an animated slide included. This slide showcases a compliance dashboard to track open issues and risk assessment. It includes information about auditable entities, open issues, risk assessments, metric breaches and open issues.

Empowering The Future Smart Meters Dashboard For Effective Energy IoT SS V
This slide exhibits a dashboard that provides real-time energy specific information from multiple smart meters. It includes elements such as voltage, energy consumption, energy meters, alarms alert, and amperage Welcome to our selection of the Empowering The Future Smart Meters Dashboard For Effective Energy IoT SS V. These are designed to help you showcase your creativity and bring your sphere to life. Planning and Innovation are essential for any business that is just starting out. This collection contains the designs that you need for your everyday presentations. All of our PowerPoints are 100Percent editable, so you can customize them to suit your needs. This multi-purpose template can be used in various situations. Grab these presentation templates today. This slide exhibits a dashboard that provides real-time energy specific information from multiple smart meters. It includes elements such as voltage, energy consumption, energy meters, alarms alert, and amperage
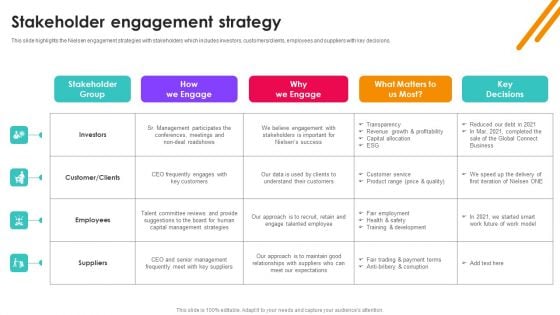
Nielsen Business Profile Stakeholder Engagement Strategy Ppt PowerPoint Presentation Diagram Graph Charts PDF
This slide highlights the Nielsen engagement strategies with stakeholders which includes investors, customers or clients, employees and suppliers with key decisions. The Nielsen Business Profile Stakeholder Engagement Strategy Ppt PowerPoint Presentation Diagram Graph Charts PDF is a compilation of the most recent design trends as a series of slides. It is suitable for any subject or industry presentation, containing attractive visuals and photo spots for businesses to clearly express their messages. This template contains a variety of slides for the user to input data, such as structures to contrast two elements, bullet points, and slides for written information. Slidegeeks is prepared to create an impression.
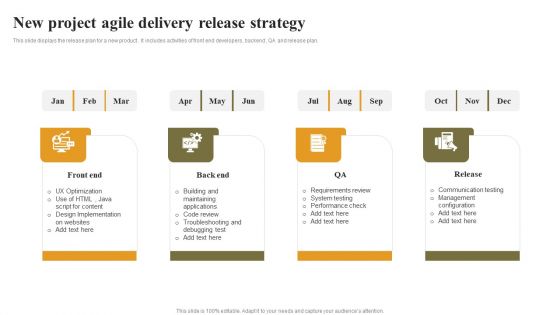
New Project Agile Delivery Release Strategy Elements PDF
This slide displays the release plan for a new product . It includes activities of front end developers, backend , QA and release plan.Presenting New Project Agile Delivery Release Strategy Elements PDF to dispense important information. This template comprises four stages. It also presents valuable insights into the topics including Design Implementation, Troubleshooting Debugging, Requirements Review. This is a completely customizable PowerPoint theme that can be put to use immediately. So, download it and address the topic impactfully.
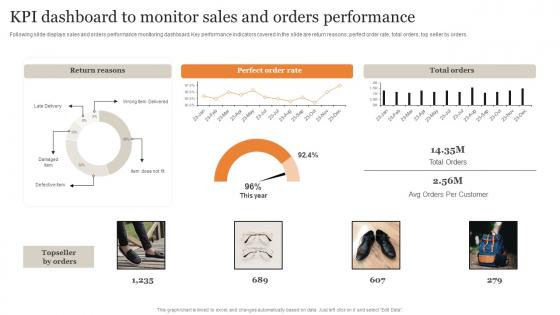
KPI Dashboard To Monitor Sales And Orders Performance Ultimate Guide Implementing Demonstration Pdf
Following slide displays sales and orders performance monitoring dashboard. Key performance indicators covered in the slide are return reasons, perfect order rate, total orders, top seller by orders. Here you can discover an assortment of the finest PowerPoint and Google Slides templates. With these templates, you can create presentations for a variety of purposes while simultaneously providing your audience with an eye-catching visual experience. Download KPI Dashboard To Monitor Sales And Orders Performance Ultimate Guide Implementing Demonstration Pdf to deliver an impeccable presentation. These templates will make your job of preparing presentations much quicker, yet still, maintain a high level of quality. Slidegeeks has experienced researchers who prepare these templates and write high-quality content for you. Later on, you can personalize the content by editing the KPI Dashboard To Monitor Sales And Orders Performance Ultimate Guide Implementing Demonstration Pdf Following slide displays sales and orders performance monitoring dashboard. Key performance indicators covered in the slide are return reasons, perfect order rate, total orders, top seller by orders.

Salon Marketing Plan To Optimize Dashboard Monitoring Sales And Revenue Strategy SS V
This slide presents a dashboard tracking revenue and sales by products and services. It includes KPIs such as revenue by service and products, units sold, monthly revenue. Formulating a presentation can take up a lot of effort and time, so the content and message should always be the primary focus. The visuals of the PowerPoint can enhance the presenters message, so our Salon Marketing Plan To Optimize Dashboard Monitoring Sales And Revenue Strategy SS V was created to help save time. Instead of worrying about the design, the presenter can concentrate on the message while our designers work on creating the ideal templates for whatever situation is needed. Slidegeeks has experts for everything from amazing designs to valuable content, we have put everything into Salon Marketing Plan To Optimize Dashboard Monitoring Sales And Revenue Strategy SS V. This slide presents a dashboard tracking revenue and sales by products and services. It includes KPIs such as revenue by service and products, units sold, monthly revenue.

Salon Marketing Plan To Optimize Website Analytics Dashboard To Monitor Strategy SS V
This slide represent a website analytics dashboard tracking online traffic and appointments. It includes KPIs such as visitors count, purchasers count, booked appointments, forecasted booking count by month, visitor-to-customer conversion trend, customer acquisition through channels and visitors count by categories. Here you can discover an assortment of the finest PowerPoint and Google Slides templates. With these templates, you can create presentations for a variety of purposes while simultaneously providing your audience with an eye-catching visual experience. Download Salon Marketing Plan To Optimize Website Analytics Dashboard To Monitor Strategy SS V to deliver an impeccable presentation. These templates will make your job of preparing presentations much quicker, yet still, maintain a high level of quality. Slidegeeks has experienced researchers who prepare these templates and write high-quality content for you. Later on, you can personalize the content by editing the Salon Marketing Plan To Optimize Website Analytics Dashboard To Monitor Strategy SS V. This slide represent a website analytics dashboard tracking online traffic and appointments. It includes KPIs such as visitors count, purchasers count, booked appointments, forecasted booking count by month, visitor-to-customer conversion trend, customer acquisition through channels and visitors count by categories.
Erp Management Dashboard For Tracking Gross Erp And Digital Transformation For Maximizing DT SS V
This slide presents a ERP integrated finance monitoring dashboard that helps in tracking gross and net profit margin of business. It monitors KPIs such as balance, quick ratio, current ratio, total income, total expenses, accounts payable.Here you can discover an assortment of the finest PowerPoint and Google Slides templates. With these templates, you can create presentations for a variety of purposes while simultaneously providing your audience with an eye-catching visual experience. Download Erp Management Dashboard For Tracking Gross Erp And Digital Transformation For Maximizing DT SS V to deliver an impeccable presentation. These templates will make your job of preparing presentations much quicker, yet still, maintain a high level of quality. Slidegeeks has experienced researchers who prepare these templates and write high-quality content for you. Later on, you can personalize the content by editing the Erp Management Dashboard For Tracking Gross Erp And Digital Transformation For Maximizing DT SS V. This slide presents a ERP integrated finance monitoring dashboard that helps in tracking gross and net profit margin of business. It monitors KPIs such as balance, quick ratio, current ratio, total income, total expenses, accounts payable.

 Home
Home