Data Analysis Icon
Data Analysis Programs 3d Bar Chart To Put Information PowerPoint Templates
Draw Up Your Agenda On Our data analysis programs 3d bar chart to put information Powerpoint Templates . Coax Your Audience Into Acceptance.
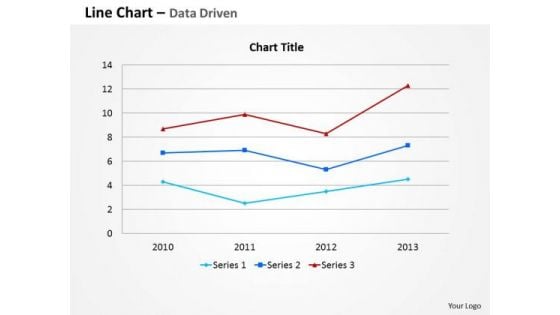
Data Analysis Template Driven Line Chart For Business Information PowerPoint Slides Templates
Your Thoughts Are Dripping With Wisdom. Lace It With Our data analysis template driven line chart for business information powerpoint slides Templates .
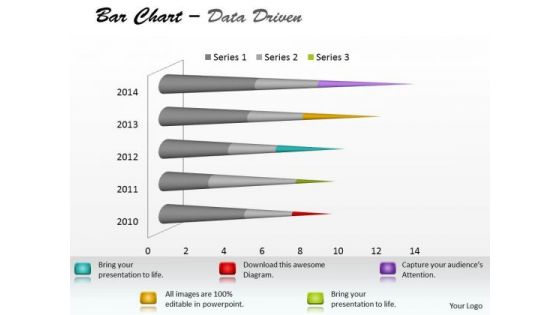
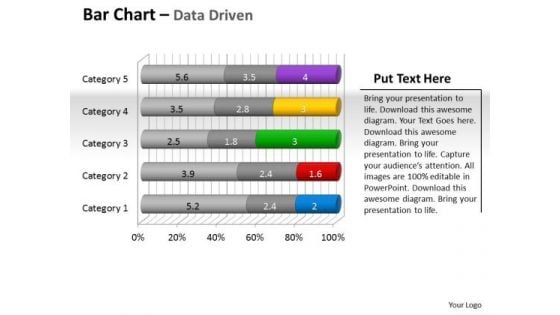
Microsoft Excel Data Analysis Bar Chart To Communicate Information PowerPoint Templates
With Our microsoft excel data analysis bar chart to communicate information Powerpoint Templates You Will Be Doubly Sure. They Possess That Stamp Of Authority.

Data Analysis Excel 3d Pie Chart For Marketing Process PowerPoint Templates
Our data analysis excel 3d pie chart for marketing process Powerpoint Templates Team Are A Dogged Lot. They Keep At It Till They Get It Right.
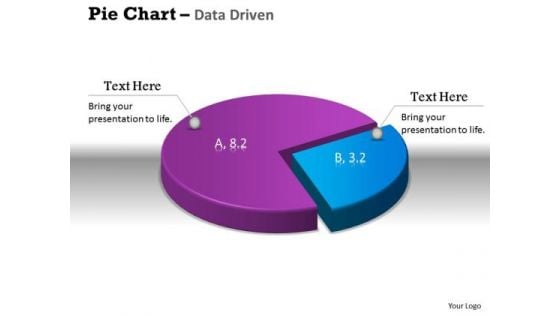
Data Analysis Excel 3d Pie Chart Shows Relative Size Of PowerPoint Templates
Get The Doers Into Action. Activate Them With Our data analysis excel 3d pie chart shows relative size of Powerpoint Templates.
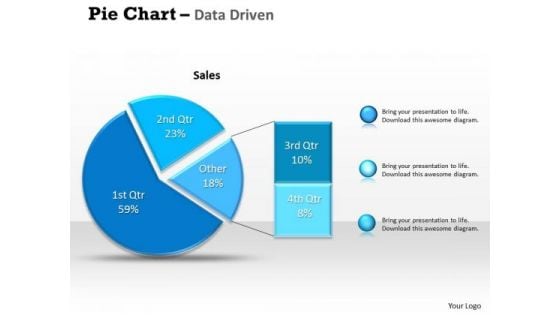
Data Analysis Excel Driven Percentage Breakdown Pie Chart PowerPoint Slides Templates
Be A Donor Of Great Ideas. Display Your Charity On Our data analysis excel driven percentage breakdown pie chart powerpoint slides Templates.
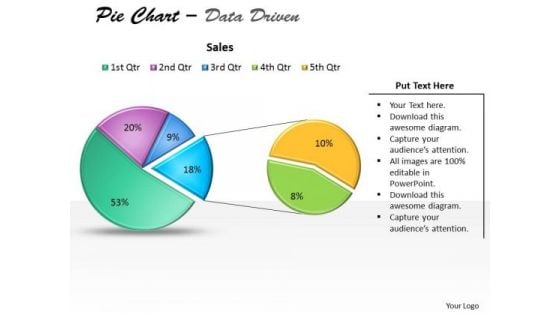
Data Analysis Excel Driven Pie Chart For Business Stratregy PowerPoint Slides Templates
Open Up Doors That Lead To Success. Our data analysis excel driven pie chart for business stratregy powerpoint slides Templates Provide The Handles.

Data Analysis Excel Driven Pie Chart For Easy Comparison PowerPoint Slides Templates
Our data analysis excel driven pie chart for easy comparison powerpoint slides Templates Abhor Doodling. They Never Let The Interest Flag.
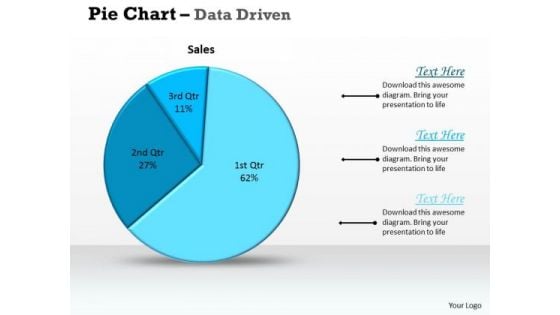
Data Analysis Excel Driven Pie Chart For Sales Process PowerPoint Slides Templates
Deliver The Right Dose With Our data analysis excel driven pie chart for sales process powerpoint slides Templates . Your Ideas Will Get The Correct Illumination.
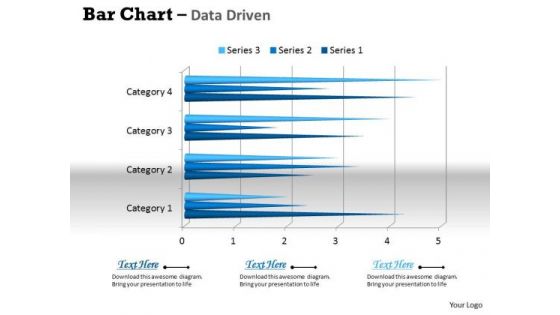
Data Analysis In Excel 3d Bar Chart For Business Trends PowerPoint Templates
Connect The Dots With Our data analysis in excel 3d bar chart for business trends Powerpoint Templates . Watch The Whole Picture Clearly Emerge.
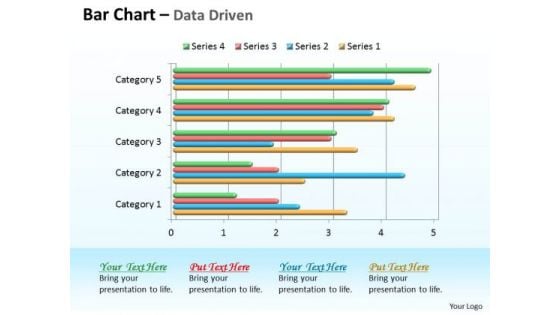
Data Analysis In Excel 3d Bar Chart For Comparison Of Time Series PowerPoint Templates
Double Your Chances With Our data analysis in excel 3d bar chart for comparison of time series Powerpoint Templates . The Value Of Your Thoughts Will Increase Two-Fold.
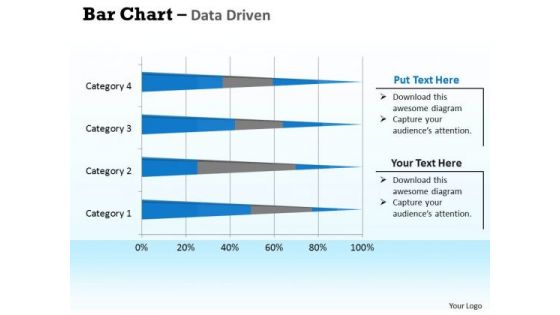
Data Analysis In Excel 3d Bar Chart For Interpretation PowerPoint Templates
Double Up Our data analysis in excel 3d bar chart for interpretation Powerpoint Templates With Your Thoughts. They Will Make An Awesome Pair.
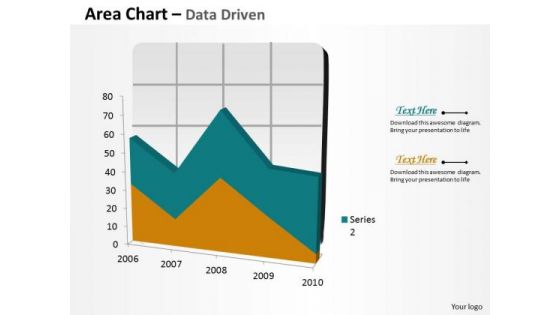
Data Analysis In Excel Area Chart For Business Process PowerPoint Templates
Your Grasp Of Economics Is Well Known. Help Your Audience Comprehend Issues With Our data analysis in excel area chart for business process Powerpoint Templates .
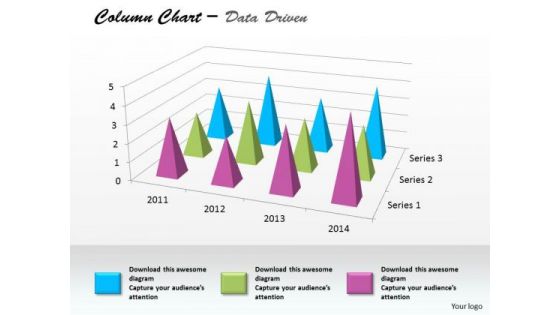
Data Analysis In Excel Column Chart For Business Project PowerPoint Templates
Edit Your Work With Our data analysis in excel column chart for business project Powerpoint Templates . They Will Help You Give The Final Form.
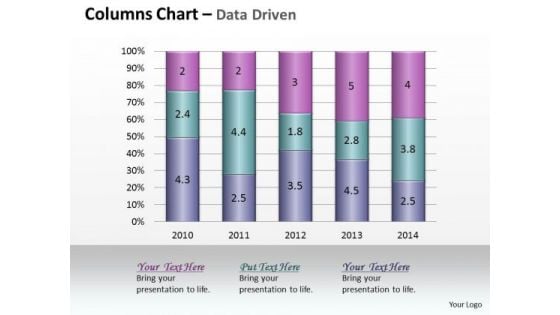
Data Analysis In Excel Column Chart Of Various Fields PowerPoint Templates
Land The Idea With Our data analysis in excel column chart of various fields Powerpoint Templates . Help It Grow With Your Thoughts.
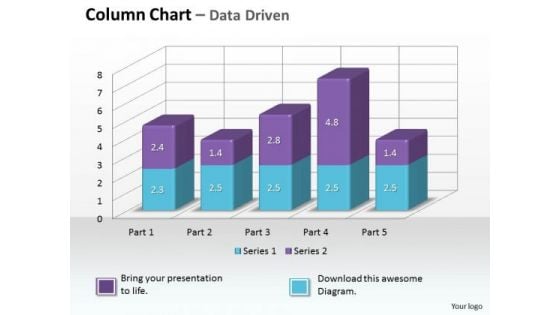
Data Analysis On Excel 3d Chart To Monitor Business Process PowerPoint Templates
Make Some Dough With Our data analysis on excel 3d chart to monitor business process Powerpoint Templates . Your Assets Will Rise Significantly.
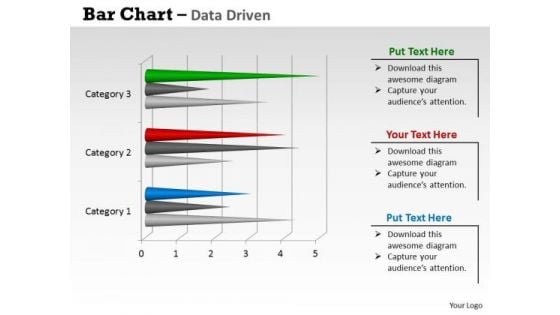
Data Analysis On Excel 3d Chart With Sets Of PowerPoint Templates
Reduce The Drag With Our data analysis on excel 3d chart with sets of Powerpoint Templates . Give More Lift To Your Thoughts.
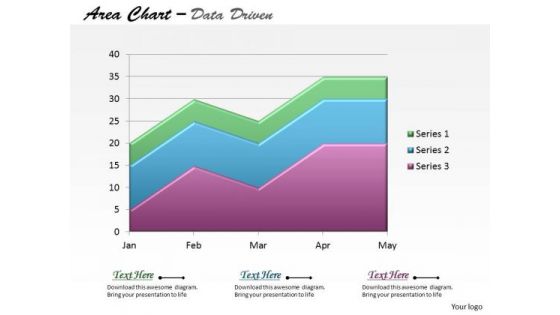
Data Analysis On Excel Driven Stacked Area Chart PowerPoint Slides Templates
Be The Dramatist With Our data analysis on excel driven stacked area chart powerpoint slides Templates . Script Out The Play Of Words.
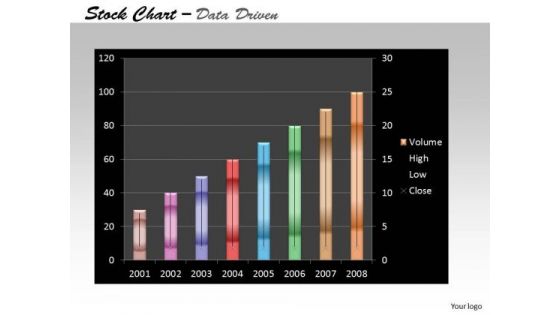
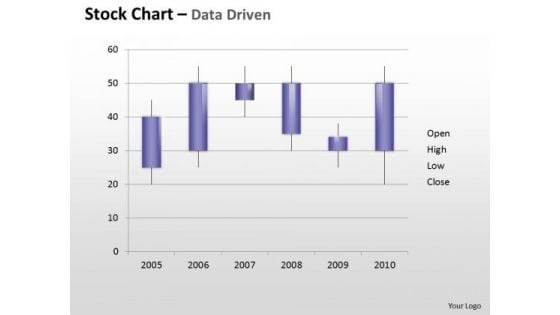
Data Analysis On Excel Driven Stock Chart For Business Growth PowerPoint Slides Templates
Add Some Dramatization To Your Thoughts. Our data analysis on excel driven stock chart for business growth powerpoint slides Templates Make Useful Props.
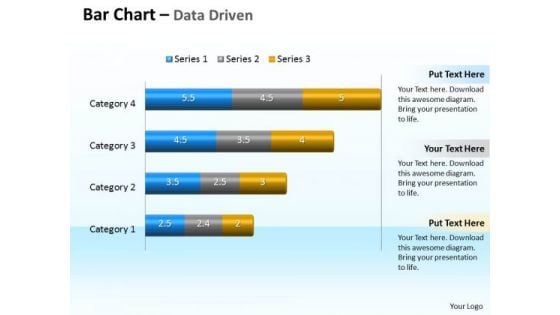
Data Analysis Programs 3d Bar Chart To Compare Categories PowerPoint Templates
Discover Decisive Moments With Our data analysis programs 3d bar chart to compare categories Powerpoint Templates . They Help Make That Crucial Difference.

Data Analysis Template Driven Express Business Facts Pie Chart PowerPoint Slides Templates
Display Your Drive On Our data analysis template driven express business facts pie chart powerpoint slides Templates . Invigorate The Audience With Your Fervor.
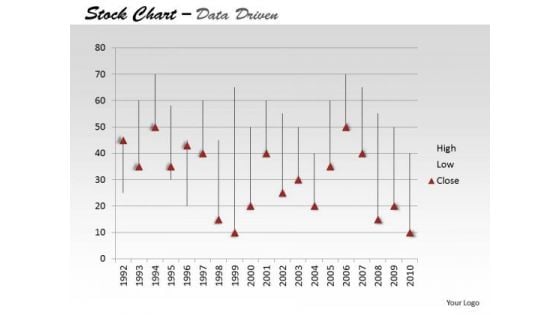
Data Analysis Template Driven Ineract With Stock Chart PowerPoint Slides Templates
Drive Your Passion With Our data analysis template driven ineract with stock chart powerpoint slides Templates . Steer Yourself To Achieve Your Aims.
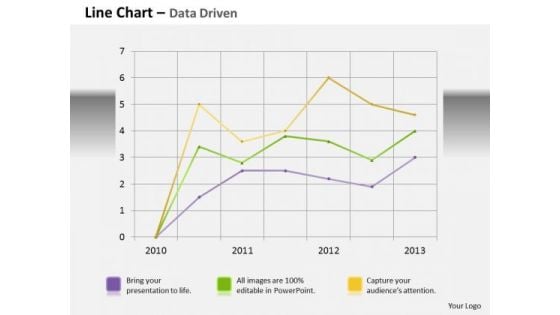
Data Analysis Template Driven Line Chart Business Graph PowerPoint Slides Templates
Bottle Your Thoughts In Our data analysis template driven line chart business graph powerpoint slides Templates . Pass It Around For Your Audience To Sip.
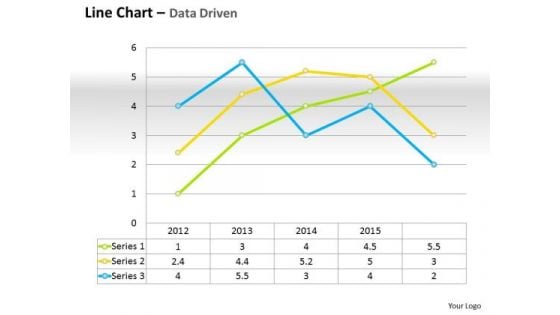
Data Analysis Template Driven Line Chart For Business Performance PowerPoint Slides Templates
Do Not Allow Things To Drift. Ring In Changes With Our data analysis template driven line chart for business performance powerpoint slides Templates .
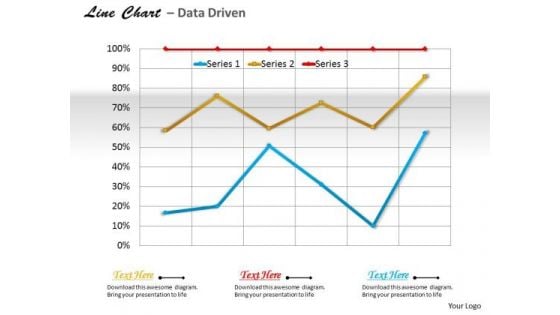
Data Analysis Template Driven Line Chart For Business Trends PowerPoint Slides Templates
Use Our data analysis template driven line chart for business trends powerpoint slides Templates As The Bit. Drill Your Thoughts Into Their Minds.
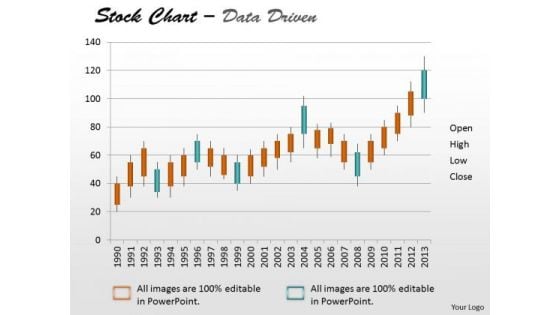
Data Analysis Template Driven Stock Chart For Market Trends PowerPoint Slides Templates
Drive Your Team Along The Road To Success. Take The Wheel With Our data analysis template driven stock chart for market trends powerpoint slides Templates .
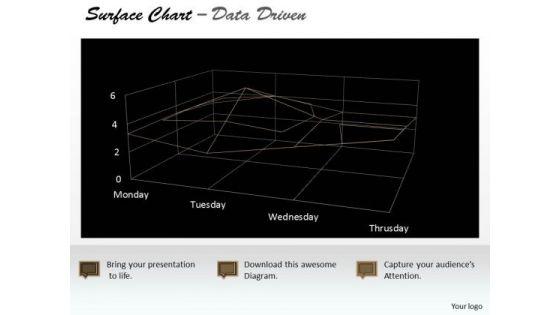
Data Analysis Template Driven Surface Chart Indicating Areas PowerPoint Slides Templates
Highlight Your Drive With Our data analysis template driven surface chart indicating areas powerpoint slides Templates . Prove The Fact That You Have Control.
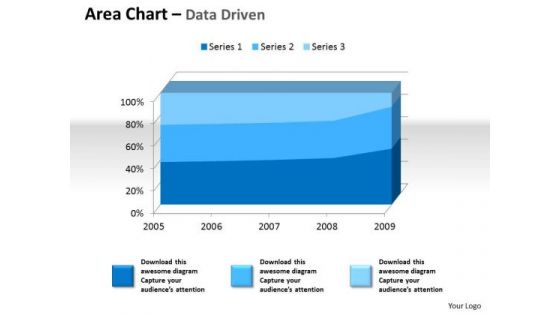
Examples Of Data Analysis Market 3d Area Chart For Quantiative PowerPoint Templates
Drum It Up With Our examples of data analysis market 3d area chart for quantiative Powerpoint Templates . Your Thoughts Will Raise The Tempo.
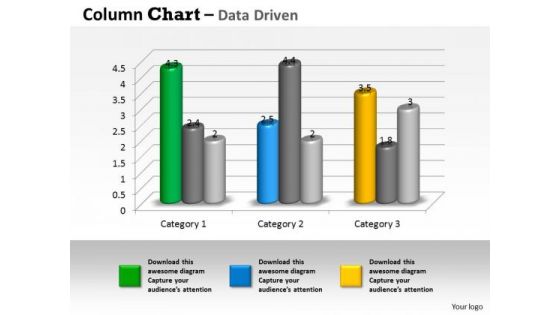
Examples Of Data Analysis Market 3d Business Trend Series Chart PowerPoint Templates
Duct It Through With Our examples of data analysis market 3d business trend series chart Powerpoint Templates . Your Ideas Will Reach Into Their Minds Intact.
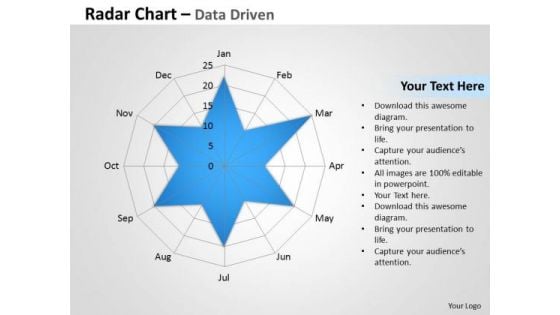
Examples Of Data Analysis Market Driven Radar Chart To Compare PowerPoint Slides Templates
Rely On Our examples of data analysis market driven radar chart to compare powerpoint slides Templates In Any Duel. They Will Drive Home Your Point.
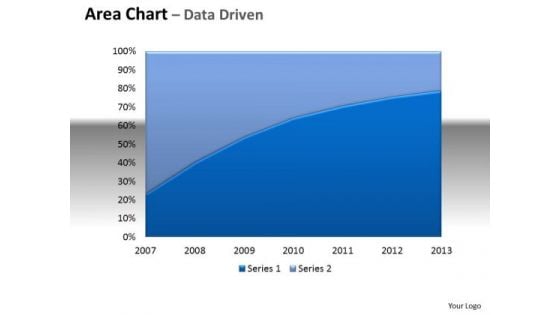
Financial Data Analysis Area Chart With Plotted Line Center PowerPoint Templates
Be The Doer With Our financial data analysis area chart with plotted line center Powerpoint Templates . Put Your Thoughts Into Practice.
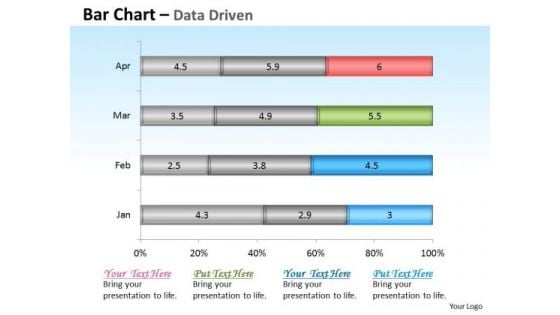
Financial Data Analysis Driven Base Bar Chart Design PowerPoint Slides Templates
Get The Domestics Right With Our financial data analysis driven base bar chart design powerpoint slides Templates . Create The Base For Thoughts To Grow.
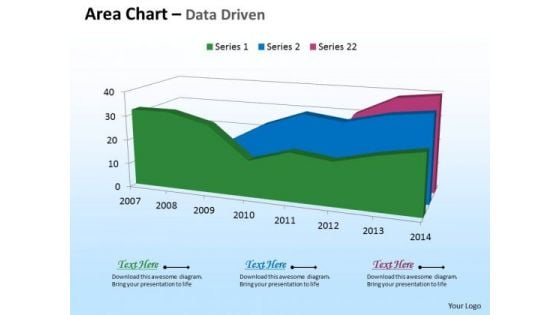
Microsoft Excel Data Analysis 3d Area Chart For Time Based PowerPoint Templates
Deliver The Right Dose With Our microsoft excel data analysis 3d area chart for time based Powerpoint Templates . Your Ideas Will Get The Correct Illumination.
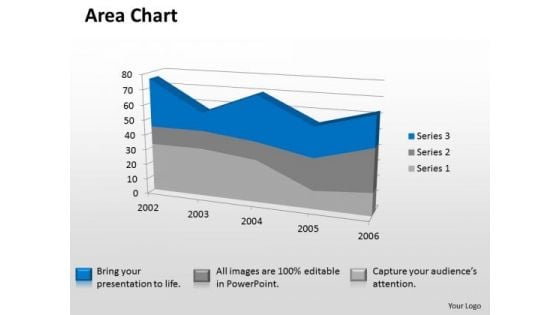
Microsoft Excel Data Analysis 3d Area Chart Showimg Change In Values PowerPoint Templates
Our microsoft excel data analysis 3d area chart showimg change in values Powerpoint Templates Deliver At Your Doorstep. Let Them In For A Wonderful Experience.
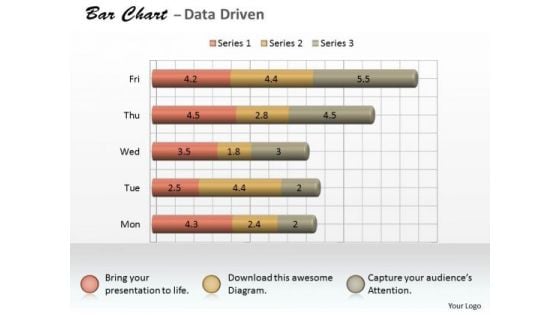
Microsoft Excel Data Analysis 3d Bar Chart As Research Tool PowerPoint Templates
Knock On The Door To Success With Our microsoft excel data analysis 3d bar chart as research tool Powerpoint Templates . Be Assured Of Gaining Entry.
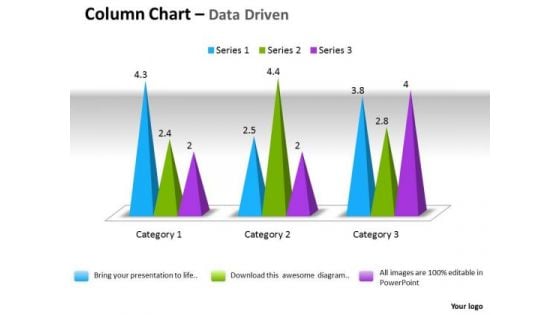
Microsoft Excel Data Analysis 3d Change In Business Process Chart PowerPoint Templates
Double Your Chances With Our microsoft excel data analysis 3d change in business process chart Powerpoint Templates . The Value Of Your Thoughts Will Increase Two-Fold.
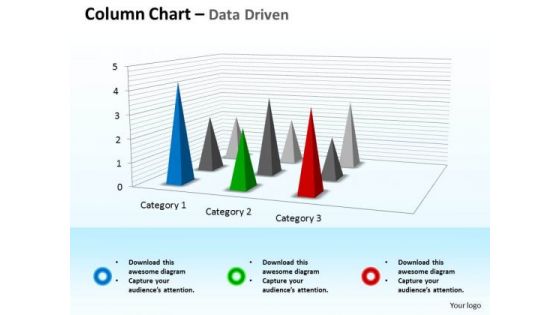
Microsoft Excel Data Analysis 3d Chart For Business Observation PowerPoint Templates
Double Up Our microsoft excel data analysis 3d chart for business observation Powerpoint Templates With Your Thoughts. They Will Make An Awesome Pair.
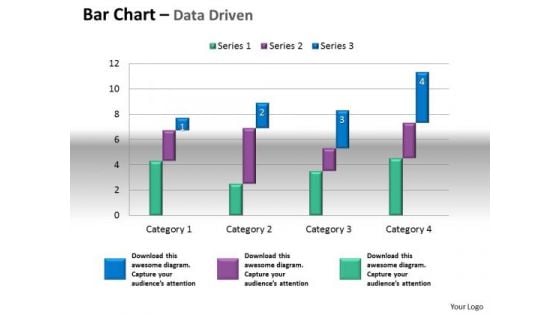
Microsoft Excel Data Analysis Bar Chart To Compare Quantities PowerPoint Templates
Our microsoft excel data analysis bar chart to compare quantities Powerpoint Templates Leave No One In Doubt. Provide A Certainty To Your Views.
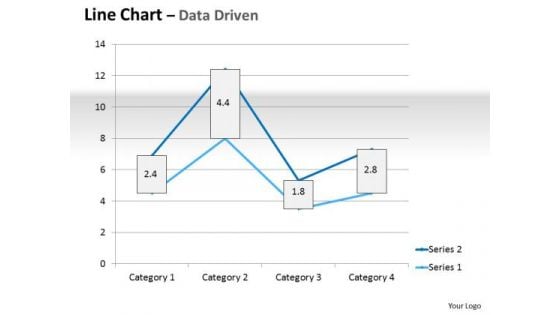
Multivariate Data Analysis Driven Line Chart Market Graph PowerPoint Slides Templates
Plan For All Contingencies With Our multivariate data analysis driven line chart market graph powerpoint slides Templates . Douse The Fire Before It Catches.
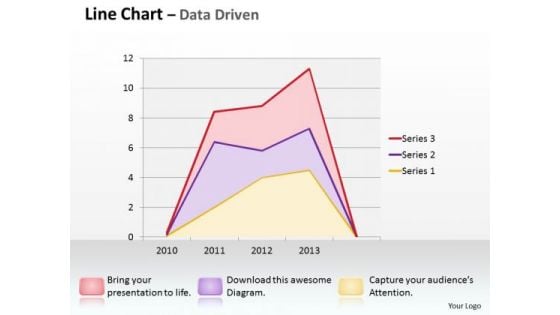
Multivariate Data Analysis Driven Line Chart Shows Revenue Trends PowerPoint Slides Templates
Good Camaraderie Is A Key To Teamwork. Our multivariate data analysis driven line chart shows revenue trends powerpoint slides Templates Can Be A Cementing Force.
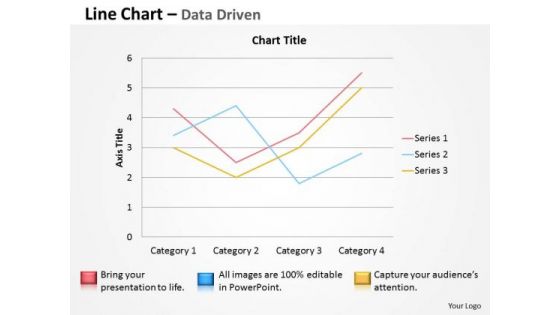
Multivariate Data Analysis Driven Line Chart To Demonstrate PowerPoint Slides Templates
Brace Yourself, Arm Your Thoughts. Prepare For The Hustle With Our multivariate data analysis driven line chart to demonstrate powerpoint slides Templates .

Data Analysis On Excel Driven Sets Of Business Information PowerPoint Slides Templates
Break The Deadlock With Our data analysis on excel driven sets of business information powerpoint slides Templates . Let The Words Start To Flow.
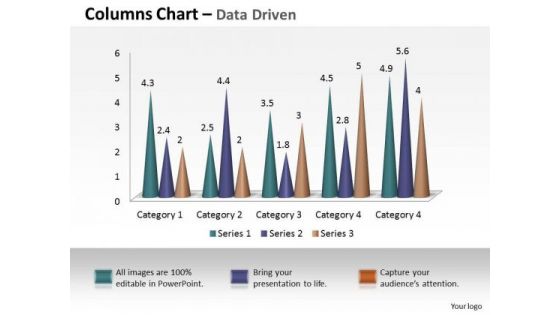
Examples Of Data Analysis Market 3d Business Intelligence And PowerPoint Templates
Our examples of data analysis market 3d business intelligence and Powerpoint Templates Are Dual Purpose. They Help Instruct And Inform At The Same Time.
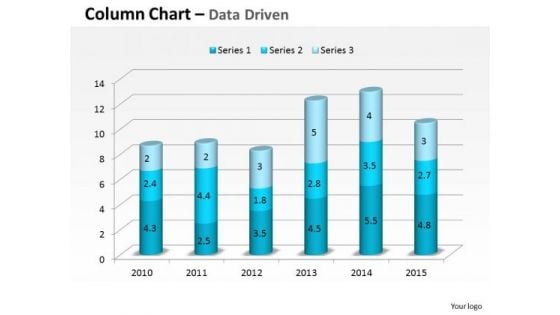
Data Analysis In Excel 3d Compare Yearly Business Performance PowerPoint Templates
Plan For All Contingencies With Our data analysis in excel 3d compare yearly business performance Powerpoint Templates . Douse The Fire Before It Catches.
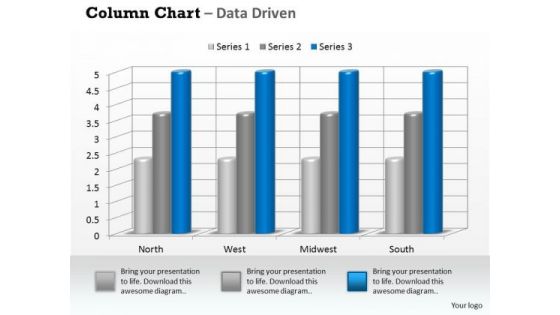
Examples Of Data Analysis Market 3d Business On Regular Intervals PowerPoint Templates
Drum It Out Loud And Clear On Our examples of data analysis market 3d business on regular intervals Powerpoint Templates . Your Words Will Ring In Their Ears.
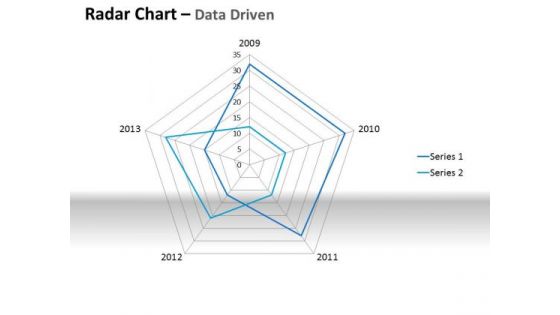
Examples Of Data Analysis Market Driven Plotting The Business Values PowerPoint Slides Templates
Ring The Duck With Our examples of data analysis market driven plotting the business values powerpoint slides Templates . Acquire The Points With Your Ideas.
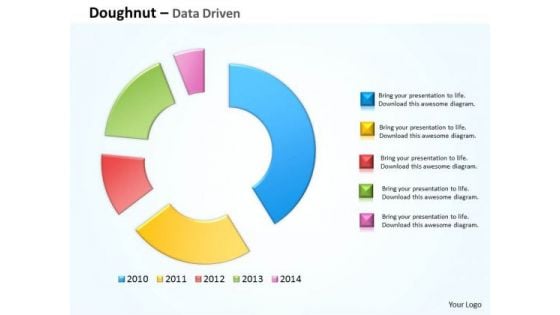
Financial Data Analysis Driven Compare Market Share Of Brand PowerPoint Templates
Doll Up Your Thoughts With Our financial data analysis driven compare market share of brand Powerpoint Templates . They Will Make A Pretty Picture.
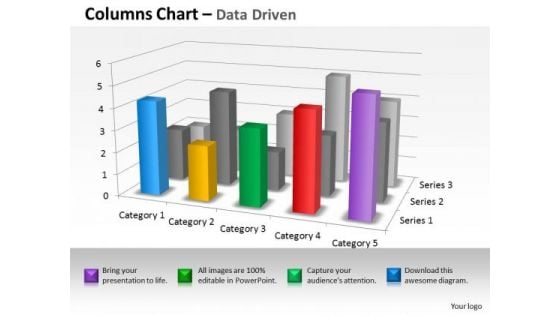
Quantitative Data Analysis 3d Interpretation Of Statistical Quality Control PowerPoint Templates
Land The Idea With Our quantitative data analysis 3d interpretation of statistical quality control Powerpoint Templates . Help It Grow With Your Thoughts.
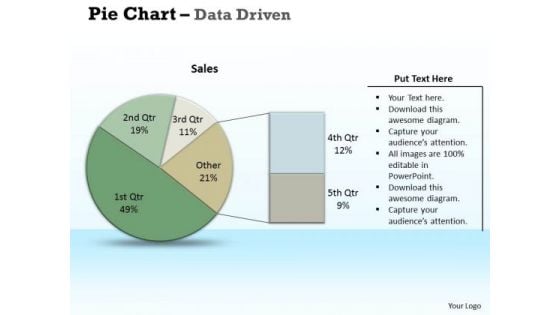
Examples Of Data Analysis Market Driven Pie Chart Research PowerPoint Slides Templates
Chalk It Up With Our examples of data analysis market driven pie chart research powerpoint slides Templates . Add To The Credits Of Your Ideas.
Merchandising Industry Analysis Icons Slide Themes PDF
Presenting our innovatively structured merchandising industry analysis icons slide themes pdf set of slides. The slides contain a hundred percent editable icons. You can replace these icons without any inconvenience. Therefore, pick this set of slides and create a striking presentation.
Retirement Income Analysis Icons Slide Pictures PDF
Introducing our well designed retirement income analysis icons slide pictures pdf set of slides. The slide displays editable icons to enhance your visual presentation. The icons can be edited easily. So customize according to your business to achieve a creative edge. Download and share it with your audience.
Icons Business Analysis Modification Toolkit Formats PDF
Introducing our well designed Icons Business Analysis Modification Toolkit Formats PDF set of slides. The slide displays editable icons to enhance your visual presentation. The icons can be edited easily. So customize according to your business to achieve a creative edge. Download and share it with your audience.
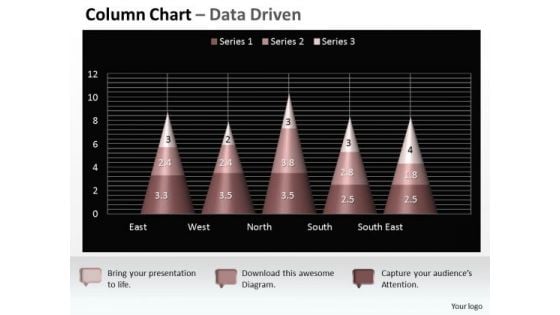
Data Analysis On Excel 3d Chart Shows Interrelated Sets Of PowerPoint Templates
Put Them On The Same Page With Our data analysis on excel 3d chart shows interrelated sets of Powerpoint Templates . Your Team Will Sing From The Same Sheet.
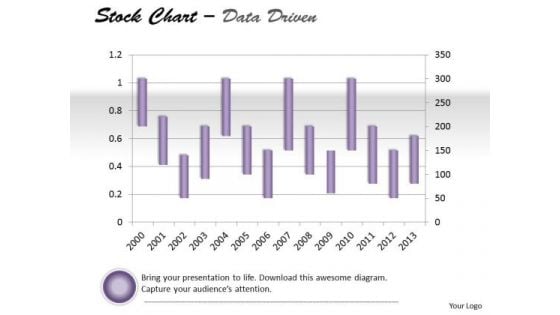
Data Analysis On Excel Driven Stock Chart For Market History PowerPoint Slides Templates
Draw Out The Best In You With Our data analysis on excel driven stock chart for market history powerpoint slides Templates . Let Your Inner Brilliance Come To The Surface.
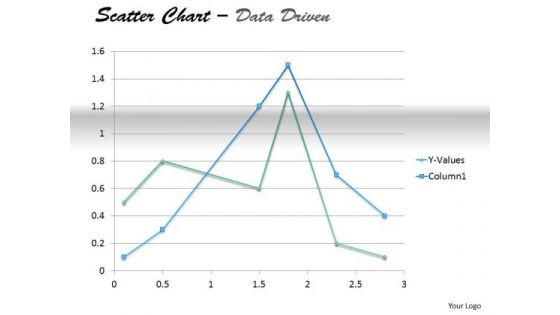
Examples Of Data Analysis Market Driven Present In Scatter Chart PowerPoint Slides Templates
Your Thoughts Will Take To Our examples of data analysis market driven present in scatter chart powerpoint slides Templates Like A Duck To Water. They Develop A Binding Affinity.
SWOT Analysis Successful Rebranding Guide Icons PDF
Crafting an eye-catching presentation has never been more straightforward. Let your presentation shine with this tasteful yet straightforward SWOT Analysis Successful Rebranding Guide Icons PDF template. It offers a minimalistic and classy look that is great for making a statement. The colors have been employed intelligently to add a bit of playfulness while still remaining professional. Construct the ideal Swot Analysis Successful Rebranding Guide Icons PDF that effortlessly grabs the attention of your audience Begin now and be certain to wow your customers.
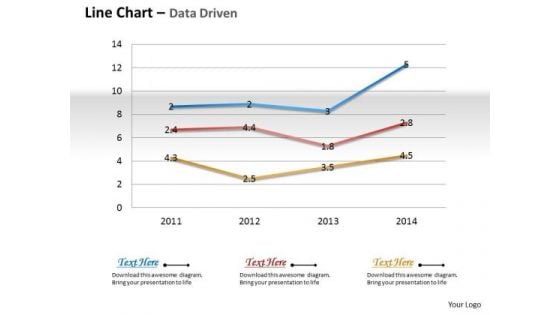
Business Data Analysis Chart Shows Changes Over The Time PowerPoint Templates
Document The Process On Our business data analysis chart shows changes over the time Powerpoint Templates. Make A Record Of Every Detail.
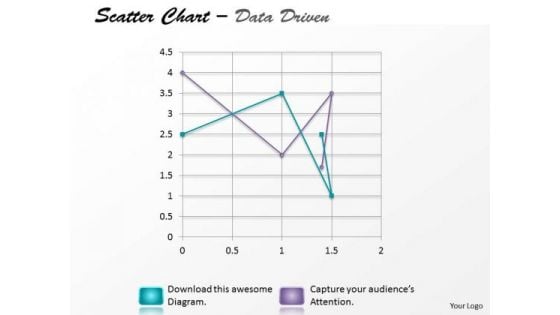
Data Analysis Excel Driven Multiple Series Scatter Chart PowerPoint Slides Templates
Your Listeners Will Never Doodle. Our data analysis excel driven multiple series scatter chart powerpoint slides Templates Will Hold Their Concentration.
Cost Analysis Ppt PowerPoint Presentation Summary Icons
This is a cost analysis ppt powerpoint presentation summary icons. This is a three stage process. The stages in this process are marketing and launch cost analysis, business and financial analysis, cost analysis.
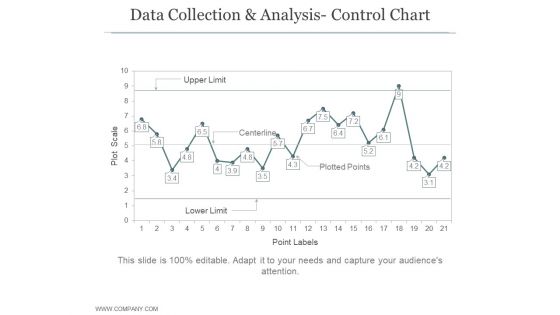
Data Collection And Analysis Control Chart Ppt PowerPoint Presentation Example File
This is a data collection and analysis control chart ppt powerpoint presentation example file. This is a four stage process. The stages in this process are business, strategy, marketing, bar graph, growth strategy.
External Marketing Environment Pestel Analysis Icons Pdf
This slide shows PESTEL approach to understand external factors that impact the decision making of organization. It includes elements such as political, legal, economic, social, environment and technology. Showcasing this set of slides titled External Marketing Environment Pestel Analysis Icons Pdf. The topics addressed in these templates are Political, Economic, Social. All the content presented in this PPT design is completely editable. Download it and make adjustments in color, background, font etc. as per your unique business setting. This slide shows PESTEL approach to understand external factors that impact the decision making of organization. It includes elements such as political, legal, economic, social, environment and technology.

Business Diagram Data Driven Bar Graph And Pie Chart For Analysis PowerPoint Slide
This PowerPoint template displays technology gadgets with various business charts. Use this diagram slide, in your presentations to make business reports for statistical analysis. You may use this diagram to impart professional appearance to your presentations.
Lean Manufacturing Kanban Tool Analysis Icons PDF
This slide shows covers Kanban tools analysis which involves elements like requirements, methods like visual workflow, benefits and risk. Presenting lean manufacturing kanban tool analysis icons pdf to dispense important information. This template comprises four stages. It also presents valuable insights into the topics including methods, requirements, benefits. This is a completely customizable PowerPoint theme that can be put to use immediately. So, download it and address the topic impactfully.

Business Diagram Four Pie Chart For Data Driven Result Analysis Of Business PowerPoint Slide
This business diagram displays graphic of pie charts in shape of flasks. This business slide is suitable to present and compare business data. Use this diagram to build professional presentations for your viewers.
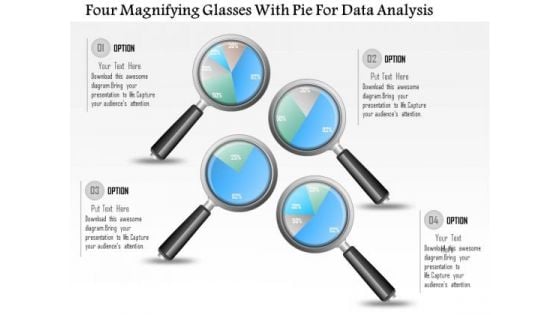
Business Diagram Four Magnifying Glasses With Pie For Data Analysis PowerPoint Slide
This business diagram displays graphic of pie charts in shape of magnifying glasses This business slide is suitable to present and compare business data. Use this diagram to build professional presentations for your viewers.
Comprehensive Solution Analysis Circular Process Icons PDF
This is a comprehensive solution analysis circular process icons pdf template with various stages. Focus and dispense information on six stages using this creative set, that comes with editable features. It contains large content boxes to add your information on topics like circular process. You can also showcase facts, figures, and other relevant content using this PPT layout. Grab it now.
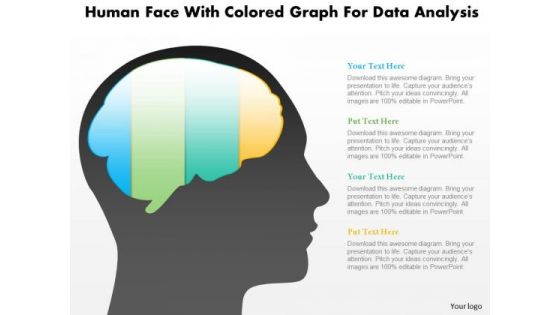
Business Diagram Human Face With Colored Graph For Data Analysis PowerPoint Slide
This diagram displays human face graphic with colored graph. This diagram can be used to represent strategy, planning, thinking of business plan. Display business options in your presentations by using this creative diagram.
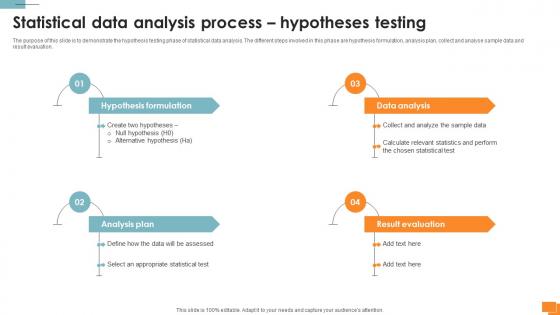
A134 Statistical Tools For Evidence Statistical Data Analysis Process Hypotheses Testing
The purpose of this slide is to demonstrate the hypothesis testing phase of statistical data analysis. The different steps involved in this phase are hypothesis formulation, analysis plan, collect and analyse sample data and result evaluation. Create an editable A134 Statistical Tools For Evidence Statistical Data Analysis Process Hypotheses Testing that communicates your idea and engages your audience. Whether you are presenting a business or an educational presentation, pre-designed presentation templates help save time. A134 Statistical Tools For Evidence Statistical Data Analysis Process Hypotheses Testing is highly customizable and very easy to edit, covering many different styles from creative to business presentations. Slidegeeks has creative team members who have crafted amazing templates. So, go and get them without any delay. The purpose of this slide is to demonstrate the hypothesis testing phase of statistical data analysis. The different steps involved in this phase are hypothesis formulation, analysis plan, collect and analyse sample data and result evaluation.
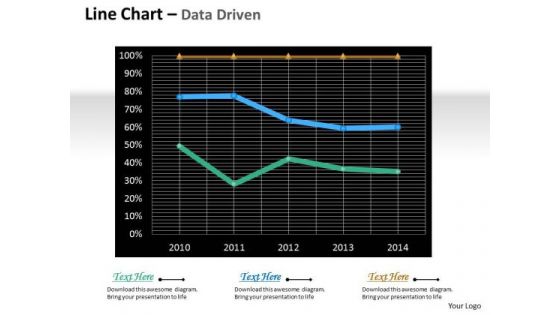
Multivariate Data Analysis Driven Line Chart For Market Survey PowerPoint Slides Templates
Rake In The Dough With

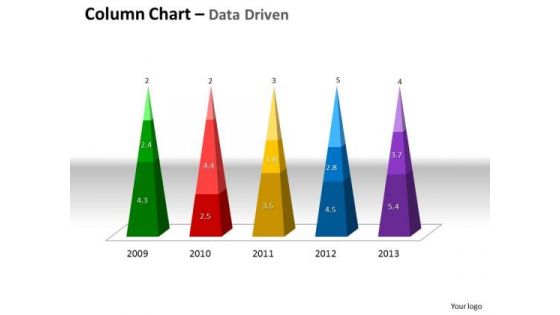
Data Analysis In Excel 3d Column Chart To Represent Information PowerPoint Templates
Rake In The Dough With
Competitor Analysis Ppt PowerPoint Presentation Ideas Icons
This is a competitor analysis ppt powerpoint presentation ideas icons. This is a seven stage process. The stages in this process are revenue, profit, market share, main activity, number of employee.
Quarterly Commodity Research And Analysis Roadmap Icons
Presenting our innovatively-structured quarterly commodity research and analysis roadmap icons Template. Showcase your roadmap process in different formats like PDF, PNG, and JPG by clicking the download button below. This PPT design is available in both Standard Screen and Widescreen aspect ratios. It can also be easily personalized and presented with modified font size, font type, color, and shapes to measure your progress in a clear way.
SWOT Analysis Of The Company Icons PDF
This slide shows companys SWOT strengths, weaknesses, opportunities, and threats analysis of the company. In this slides, the company internal operation and financials and external Political, Economic, Social, Technological, Environmental and Legal factors factors are analyzed. Deliver and pitch your topic in the best possible manner with this swot analysis of the company icons pdf. Use them to share invaluable insights on opportunities, weaknesses, strengths, threats and impress your audience. This template can be altered and modified as per your expectations. So, grab it now.
Companys Social Media Visibility Analysis Icons PDF
The slide carries the analysis of companys presence on various social media channels such as Twitter, Instagram, Facebook, LinkedIn and YouTube. It indicates presence on the basis of followers, posts, likes and videos Pitch your topic with ease and precision using this Companys Social Media Visibility Analysis Icons PDF. This layout presents information on Twitter, Views, Subscribers. It is also available for immediate download and adjustment. So, changes can be made in the color, design, graphics or any other component to create a unique layout.
Change Management Readiness Analysis Checklist Icons PDF
This slide outlines a checklist for change management readiness assessment to recognise areas challenging change implementation and devise potential solutions. It covers tasks to be covered and progress mechanism. Pitch your topic with ease and precision using this Change Management Readiness Analysis Checklist Icons PDF. This layout presents information on Budget For Change Initiative, Timelines And Milestones, Benefit Analysis. It is also available for immediate download and adjustment. So, changes can be made in the color, design, graphics or any other component to create a unique layout.
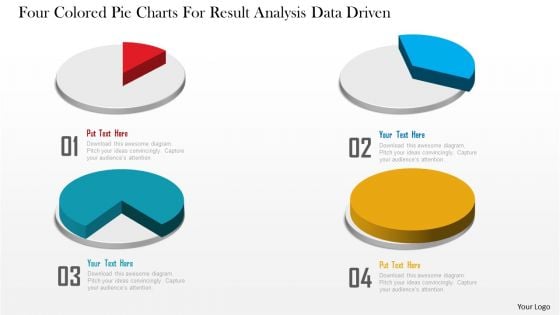
Business Diagram Four Colored Pie Charts For Result Analysis Data Driven PowerPoint Slide
This business diagram displays graphic of pie charts. This business slide is suitable to present and compare business data. Use this diagram to build professional presentations for your viewers.
SMA Practices For Business Analysis Icon Information PDF
Showcasing this set of slides titled SMA Practices For Business Analysis Icon Information PDF. The topics addressed in these templates are SMA Practices, Data Icon. All the content presented in this PPT design is completely editable. Download it and make adjustments in color, background, font etc. as per your unique business setting.
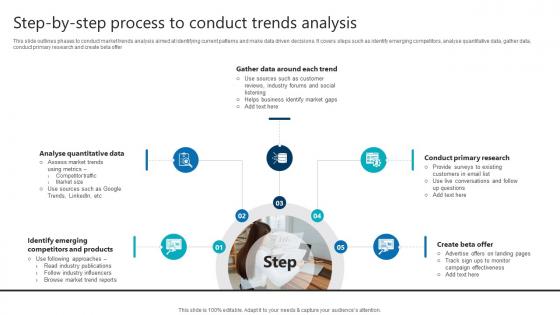
Step By Step Process To Conduct Trends Analysis Product Analytics Implementation Data Analytics V
This slide outlines phases to conduct market trends analysis aimed at identifying current patterns and make data driven decisions. It covers steps such as identify emerging competitors, analyse quantitative data, gather data, conduct primary research and create beta offerComing up with a presentation necessitates that the majority of the effort goes into the content and the message you intend to convey. The visuals of a PowerPoint presentation can only be effective if it supplements and supports the story that is being told. Keeping this in mind our experts created Step By Step Process To Conduct Trends Analysis Product Analytics Implementation Data Analytics V to reduce the time that goes into designing the presentation. This way, you can concentrate on the message while our designers take care of providing you with the right template for the situation. This slide outlines phases to conduct market trends analysis aimed at identifying current patterns and make data driven decisions. It covers steps such as identify emerging competitors, analyse quantitative data, gather data, conduct primary research and create beta offer
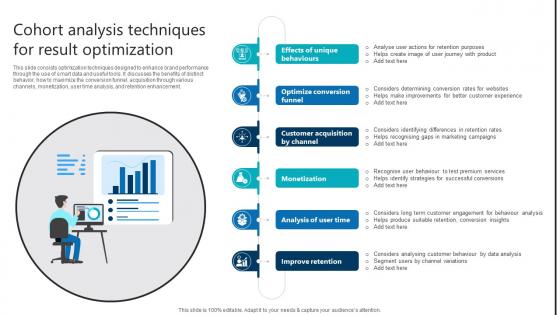
Cohort Analysis Techniques For Result Optimization Product Analytics Implementation Data Analytics V
This slide consists optimization techniques designed to enhance brand performance through the use of smart data and useful tools. It discusses the benefits of distinct behavior, how to maximize the conversion funnel, acquisition through various channels, monetization, user time analysis, and retention enhancement. Whether you have daily or monthly meetings, a brilliant presentation is necessary. Cohort Analysis Techniques For Result Optimization Product Analytics Implementation Data Analytics V can be your best option for delivering a presentation. Represent everything in detail using Cohort Analysis Techniques For Result Optimization Product Analytics Implementation Data Analytics V and make yourself stand out in meetings. The template is versatile and follows a structure that will cater to your requirements. All the templates prepared by Slidegeeks are easy to download and edit. Our research experts have taken care of the corporate themes as well. So, give it a try and see the results. This slide consists optimization techniques designed to enhance brand performance through the use of smart data and useful tools. It discusses the benefits of distinct behavior, how to maximize the conversion funnel, acquisition through various channels, monetization, user time analysis, and retention enhancement.
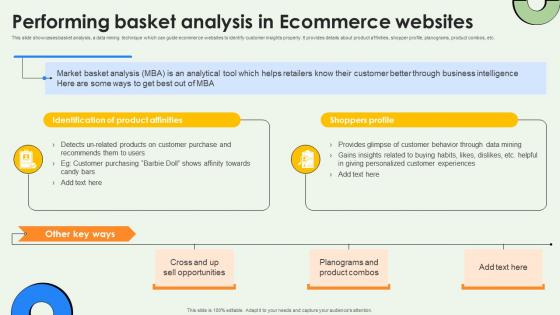
Data Warehousing And Performing Basket Analysis In Ecommerce Websites AI SS V
This slide showcases basket analysis, a data mining technique which can guide ecommerce websites to identify customer insights properly. It provides details about product affinities, shopper profile, planograms, product combos, etc. If you are looking for a format to display your unique thoughts, then the professionally designed Data Warehousing And Performing Basket Analysis In Ecommerce Websites AI SS V is the one for you. You can use it as a Google Slides template or a PowerPoint template. Incorporate impressive visuals, symbols, images, and other charts. Modify or reorganize the text boxes as you desire. Experiment with shade schemes and font pairings. Alter, share or cooperate with other people on your work. Download Data Warehousing And Performing Basket Analysis In Ecommerce Websites AI SS V and find out how to give a successful presentation. Present a perfect display to your team and make your presentation unforgettable. This slide showcases basket analysis, a data mining technique which can guide ecommerce websites to identify customer insights properly. It provides details about product affinities, shopper profile, planograms, product combos, etc.
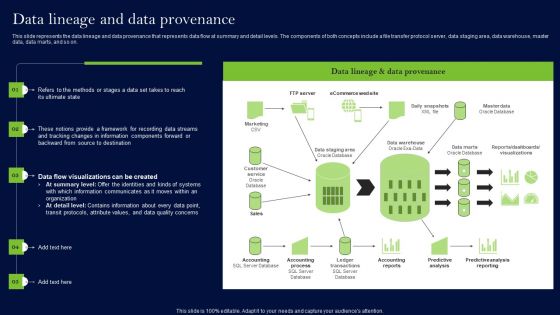
Data Lineage Methods Data Lineage And Data Provenance Download PDF
This slide represents the data lineage and data provenance that represents data flow at summary and detail levels. The components of both concepts include a file transfer protocol server, data staging area, data warehouse, master data, data marts, and so on. Are you searching for a Data Lineage Methods Data Lineage And Data Provenance Download PDF that is uncluttered, straightforward, and original Its easy to edit, and you can change the colors to suit your personal or business branding. For a presentation that expresses how much effort you have put in, this template is ideal With all of its features, including tables, diagrams, statistics, and lists, its perfect for a business plan presentation. Make your ideas more appealing with these professional slides. Download Data Lineage Methods Data Lineage And Data Provenance Download PDF from Slidegeeks today.
Swot Analysis Diagram With Icons Powerpoint Slides
This PowerPoint template has been designed with circular diagram of SWOT analysis. This PPT slide displays infographic diagram of SWOT analysis. Present your opinions in impressive manner using this professional template.
Hexagon With Marketing Analysis Icons Powerpoint Template
Our above PPT slide contains diagram of hexagonal infographic. This infographic diagram helps to exhibit marketing analysis. Enlighten others on the process with this innovative PowerPoint template.
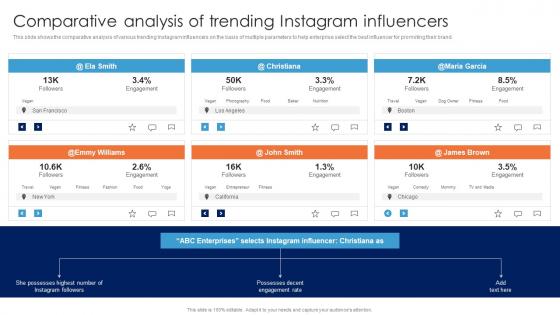
Comparative Analysis Of Trending Instagram Guide For Data Driven Advertising Themes Pdf
This slide shows the comparative analysis of various trending Instagram influencers on the basis of multiple parameters to help enterprise select the best influencer for promoting their brand.This modern and well-arranged Comparative Analysis Of Trending Instagram Guide For Data Driven Advertising Themes Pdf provides lots of creative possibilities. It is very simple to customize and edit with the Powerpoint Software. Just drag and drop your pictures into the shapes. All facets of this template can be edited with Powerpoint no extra software is necessary. Add your own material, put your images in the places assigned for them, adjust the colors, and then you can show your slides to the world, with an animated slide included. This slide shows the comparative analysis of various trending Instagram influencers on the basis of multiple parameters to help enterprise select the best influencer for promoting their brand.
Analysis For Strategic Account Plan Icon Ppt Example SS
This slide mentions key features and advantages of using power bi tool. The purpose of this slide is to transform the business data into meaningful data in form of interactive charts, graphs, reports and dashboards. It helps organization to find insights and embed them in the application or website for accessing data on go. Boost your pitch with our creative Analysis For Strategic Account Plan Icon Ppt Example SS Deliver an awe-inspiring pitch that will mesmerize everyone. Using these presentation templates you will surely catch everyones attention. You can browse the ppts collection on our website. We have researchers who are experts at creating the right content for the templates. So you do not have to invest time in any additional work. Just grab the template now and use them. This slide mentions key features and advantages of using power bi tool. The purpose of this slide is to transform the business data into meaningful data in form of interactive charts, graphs, reports and dashboards. It helps organization to find insights and embed them in the application or website for accessing data on go.
IT Robotic Process Automation Software Analysis Checklist Icon Themes PDF
This slide outlines robotic process automation business cases aimed at making supply chain processes more efficient by utilizing technological elements. It covers three cases integrated data transmission, order management with returns and after sales handling Presenting IT Robotic Process Automation Software Analysis Checklist Icon Themes PDF to dispense important information. This template comprises three stages. It also presents valuable insights into the topics including Integrated Data Transmission, Order Management, Returns After Sales Handling . This is a completely customizable PowerPoint theme that can be put to use immediately. So, download it and address the topic impactfully.
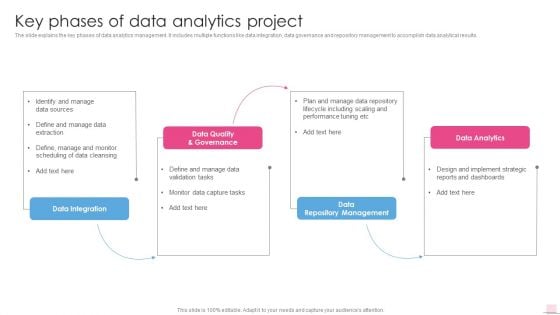
Key Phases Of Data Analytics Project Business Analysis Modification Toolkit Diagrams PDF
The slide explains the key phases of data analytics management. It includes multiple functions like data integration, data governance and repository management to accomplish data analytical results.Deliver and pitch your topic in the best possible manner with this Key Phases Of Data Analytics Project Business Analysis Modification Toolkit Diagrams PDF. Use them to share invaluable insights on Data Quality Governance, Performance Tuning, Including Scaling and impress your audience. This template can be altered and modified as per your expectations. So, grab it now.
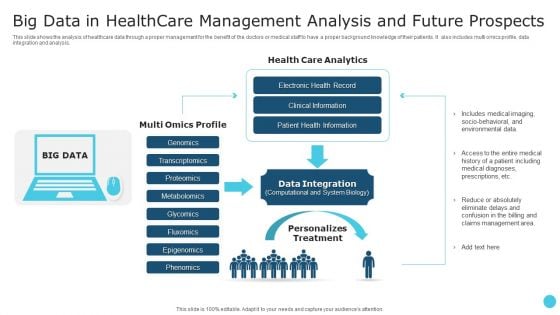
Big Data In Healthcare Management Analysis And Future Prospects Themes PDF
This slide shows the analysis of healthcare data through a proper management for the benefit of the doctors or medical staff to have a proper background knowledge of their patients. It also includes multi omics profile, data integration and analysis. Showcasing this set of slides titled Big Data In Healthcare Management Analysis And Future Prospects Themes PDF. The topics addressed in these templates are Electronic Health Record, Data Integration, Environmental Data. All the content presented in this PPT design is completely editable. Download it and make adjustments in color, background, font etc. as per your unique business setting.
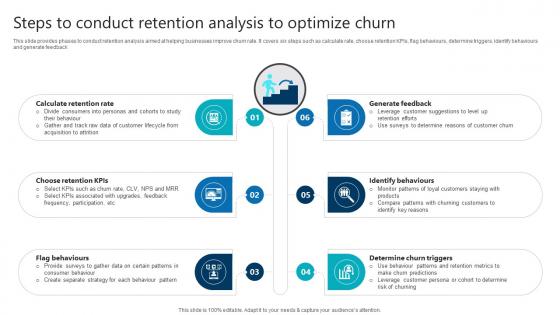
Steps To Conduct Retention Analysis To Optimize Churn Product Analytics Implementation Data Analytics V
This slide provides phases to conduct retention analysis aimed at helping businesses improve churn rate. It covers six steps such as calculate rate, choose retention KPIs, flag behaviours, determine triggers, identify behaviours and generate feedback This Steps To Conduct Retention Analysis To Optimize Churn Product Analytics Implementation Data Analytics V is perfect for any presentation, be it in front of clients or colleagues. It is a versatile and stylish solution for organizing your meetings. The Steps To Conduct Retention Analysis To Optimize Churn Product Analytics Implementation Data Analytics V features a modern design for your presentation meetings. The adjustable and customizable slides provide unlimited possibilities for acing up your presentation. Slidegeeks has done all the homework before launching the product for you. So, do not wait, grab the presentation templates today This slide provides phases to conduct retention analysis aimed at helping businesses improve churn rate. It covers six steps such as calculate rate, choose retention KPIs, flag behaviours, determine triggers, identify behaviours and generate feedback
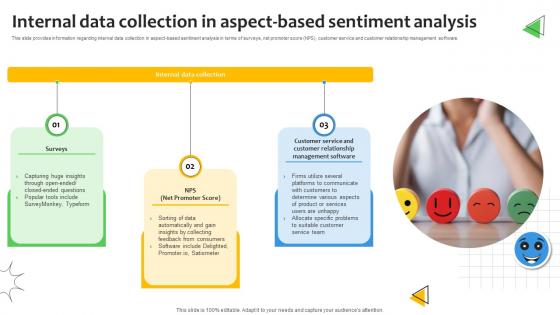
Internal Data Collection In Aspect Based Sentiment Analysis Demystified Understanding AI SS V
This slide provides information regarding internal data collection in aspect-based sentiment analysis in terms of surveys, net promoter score NPS, customer service and customer relationship management software. Presenting this PowerPoint presentation, titled Icons Slide Sentiment Analysis Demystified Understanding Textual Emotions And Opinions AI SS V, with topics curated by our researchers after extensive research. This editable presentation is available for immediate download and provides attractive features when used. Download now and captivate your audience. Presenting this Icons Slide Sentiment Analysis Demystified Understanding Textual Emotions And Opinions AI SS V. Our researchers have carefully researched and created these slides with all aspects taken into consideration. This is a completely customizable Icons Slide Sentiment Analysis Demystified Understanding Textual Emotions And Opinions AI SS V that is available for immediate downloading. Download now and make an impact on your audience. Highlight the attractive features available with our PPTs. This slide provides information regarding internal data collection in aspect-based sentiment analysis in terms of surveys, net promoter score NPS, customer service and customer relationship management software.
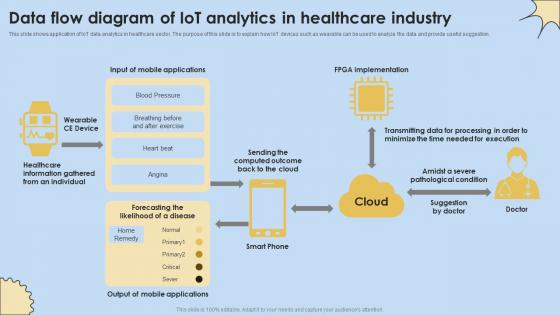
Data Flow Diagram Of IoT Analytics In Healthcare Industry Internet Of Things Analysis Clipart Pdf
This slide shows application of IoT data analytics in healthcare sector. The purpose of this slide is to explain how IoT devices such as wearable can be used to analyze the data and provide useful suggestion. If you are looking for a format to display your unique thoughts, then the professionally designed Data Flow Diagram Of IoT Analytics In Healthcare Industry Internet Of Things Analysis Clipart Pdf is the one for you. You can use it as a Google Slides template or a PowerPoint template. Incorporate impressive visuals, symbols, images, and other charts. Modify or reorganize the text boxes as you desire. Experiment with shade schemes and font pairings. Alter, share or cooperate with other people on your work. Download Data Flow Diagram Of IoT Analytics In Healthcare Industry Internet Of Things Analysis Clipart Pdf and find out how to give a successful presentation. Present a perfect display to your team and make your presentation unforgettable. This slide shows application of IoT data analytics in healthcare sector. The purpose of this slide is to explain how IoT devices such as wearable can be used to analyze the data and provide useful suggestion.
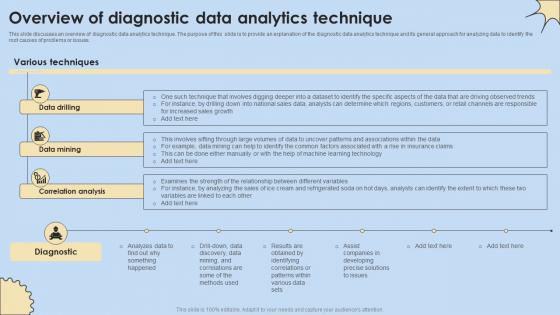
Overview Of Diagnostic Data Analytics Technique Internet Of Things Analysis Introduction Pdf
This slide discusses an overview of diagnostic data analytics technique. The purpose of this slide is to provide an explanation of the diagnostic data analytics technique and its general approach for analyzing data to identify the root causes of problems or issues. Are you searching for a Overview Of Diagnostic Data Analytics Technique Internet Of Things Analysis Introduction Pdf that is uncluttered, straightforward, and original It is easy to edit, and you can change the colors to suit your personal or business branding. For a presentation that expresses how much effort you have put in, this template is ideal With all of its features, including tables, diagrams, statistics, and lists, it is perfect for a business plan presentation. Make your ideas more appealing with these professional slides. Download Overview Of Diagnostic Data Analytics Technique Internet Of Things Analysis Introduction Pdf from Slidegeeks today. This slide discusses an overview of diagnostic data analytics technique. The purpose of this slide is to provide an explanation of the diagnostic data analytics technique and its general approach for analyzing data to identify the root causes of problems or issues.
Data Analysis Reports Under Magnifying Glass Ppt Powerpoint Presentation Summary Slideshow
This is a data analysis reports under magnifying glass ppt powerpoint presentation summary slideshow. This is a three stage process. The stages in this process are data visualization icon, data management icon.
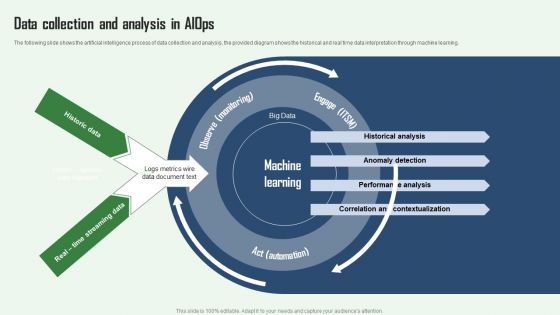
Aiops Integration Summary Report Data Collection And Analysis In Aiops Slides PDF
The following slide shows the artificial intelligence process of data collection and analysis, the provided diagram shows the historical and real time data interpretation through machine learning. Want to ace your presentation in front of a live audience Our Aiops Integration Summary Report Data Collection And Analysis In Aiops Slides PDF can help you do that by engaging all the users towards you. Slidegeeks experts have put their efforts and expertise into creating these impeccable powerpoint presentations so that you can communicate your ideas clearly. Moreover, all the templates are customizable, and easy to edit and downloadable. Use these for both personal and commercial use.
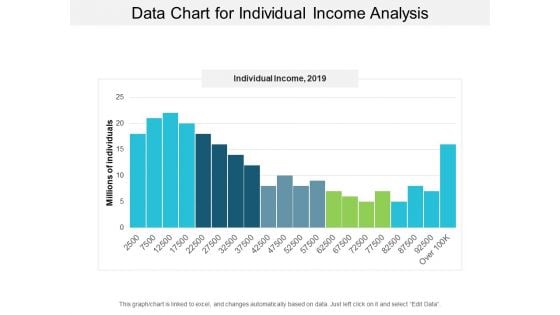
Data Chart For Individual Income Analysis Ppt PowerPoint Presentation Layouts Visual Aids
This is a data chart for individual income analysis ppt powerpoint presentation layouts visual aids. This is a five stage process. The stages in this process are financial analysis, quantitative, statistical modelling.
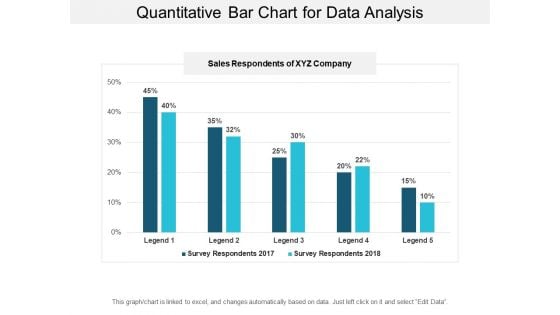
Quantitative Bar Chart For Data Analysis Ppt PowerPoint Presentation Model Graphic Tips
This is a quantitative bar chart for data analysis ppt powerpoint presentation model graphic tips. This is a two stage process. The stages in this process are financial analysis, quantitative, statistical modelling.
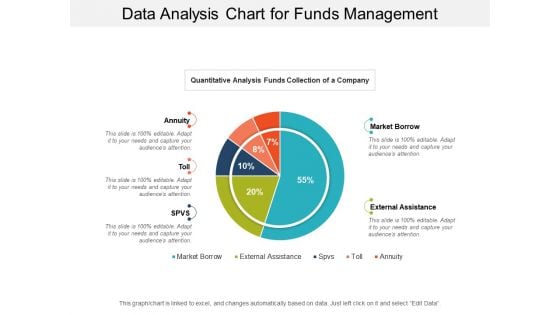
Data Analysis Chart For Funds Management Ppt PowerPoint Presentation Infographic Template Files
This is a data analysis chart for funds management ppt powerpoint presentation infographic template files. This is a five stage process. The stages in this process are financial analysis, quantitative, statistical modelling.
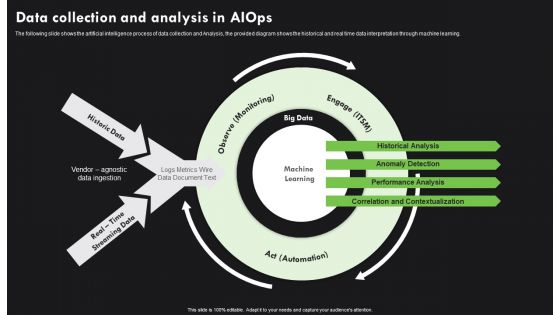
AI Deployment In IT Process Data Collection And Analysis In Aiops Introduction PDF
The following slide shows the artificial intelligence process of data collection and Analysis, the provided diagram shows the historical and real time data interpretation through machine learning. The best PPT templates are a great way to save time, energy, and resources. Slidegeeks have 100 percent editable powerpoint slides making them incredibly versatile. With these quality presentation templates, you can create a captivating and memorable presentation by combining visually appealing slides and effectively communicating your message. Download AI Deployment In IT Process Data Collection And Analysis In Aiops Introduction PDF from Slidegeeks and deliver a wonderful presentation.
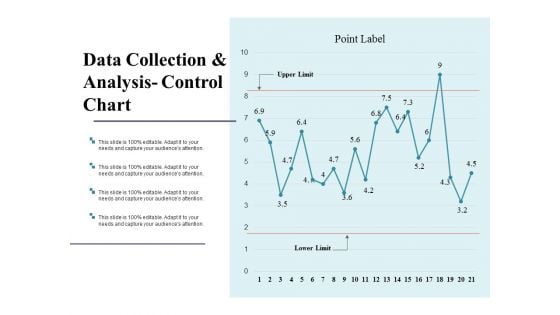
Data Collection And Analysis Control Chart Ppt PowerPoint Presentation Model Backgrounds
This is a data collection and analysis control chart ppt powerpoint presentation model backgrounds. This is a two stage process. The stages in this process are business, marketing, strategy, finance, analysis.
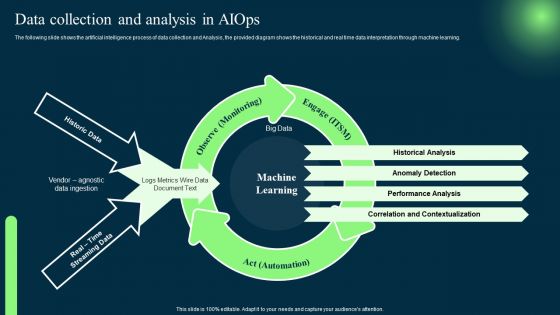
Introduction To Artificial Intelligence In Operation Management Industry Data Collection And Analysis In AIOPS Summary PDF
The following slide shows the artificial intelligence process of data collection and Analysis, the provided diagram shows the historical and real time data interpretation through machine learning. Do you have an important presentation coming up. Are you looking for something that will make your presentation stand out from the rest. Look no further than Introduction To Artificial Intelligence In Operation Management Industry Data Collection And Analysis In AIOPS Summary PDF. With our professional designs, you can trust that your presentation will pop and make delivering it a smooth process. And with Slidegeeks, you can trust that your presentation will be unique and memorable. So why wait. Grab Introduction To Artificial Intelligence In Operation Management Industry Data Collection And Analysis In AIOPS Summary PDF today and make your presentation stand out from the rest.
Data Interpretation And Analysis Playbook Ppt PowerPoint Presentation Complete Deck With Slides
This complete deck acts as a great communication tool. It helps you in conveying your business message with personalized sets of graphics, icons etc. Comprising a set of thirty nine slides, this complete deck can help you persuade your audience. It also induces strategic thinking as it has been thoroughly researched and put together by our experts. Not only is it easily downloadable but also editable. The color, graphics, theme any component can be altered to fit your individual needs. So grab it now.
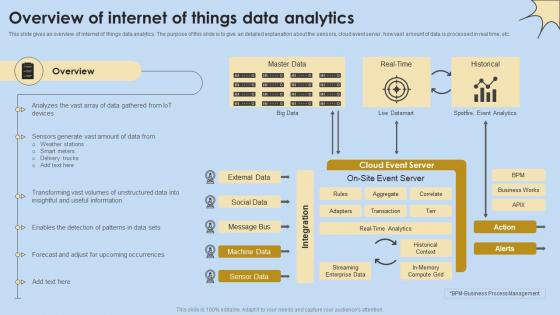
Overview Of Internet Of Things Data Analytics Internet Of Things Analysis Clipart Pdf
This slide gives an overview of internet of things data analytics. The purpose of this slide is to give an detailed explanation about the sensors, cloud event server, how vast amount of data is processed in real time, etc. Retrieve professionally designed Overview Of Internet Of Things Data Analytics Internet Of Things Analysis Clipart Pdf to effectively convey your message and captivate your listeners. Save time by selecting pre-made slideshows that are appropriate for various topics, from business to educational purposes. These themes come in many different styles, from creative to corporate, and all of them are easily adjustable and can be edited quickly. Access them as PowerPoint templates or as Google Slides themes. You do not have to go on a hunt for the perfect presentation because Slidegeeks got you covered from everywhere. This slide gives an overview of internet of things data analytics. The purpose of this slide is to give an detailed explanation about the sensors, cloud event server, how vast amount of data is processed in real time, etc.
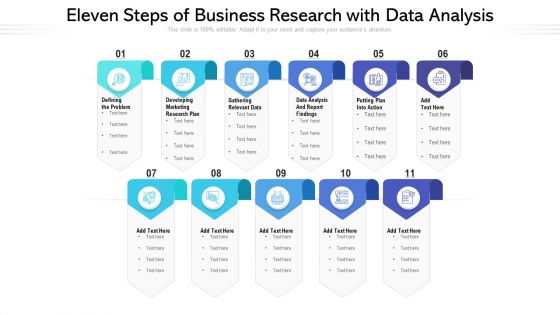
Eleven Steps Of Business Research With Data Analysis Ppt PowerPoint Presentation File Structure PDF
Presenting eleven steps of business research with data analysis ppt powerpoint presentation file structure pdf to dispense important information. This template comprises eleven stages. It also presents valuable insights into the topics including marketing, data analysis, developing. This is a completely customizable PowerPoint theme that can be put to use immediately. So, download it and address the topic impactfully.
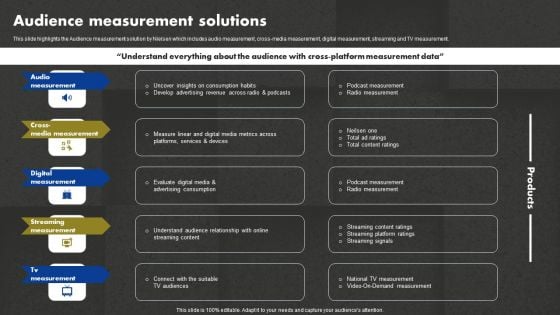
Data And Customer Analysis Company Outline Audience Measurement Solutions Graphics PDF
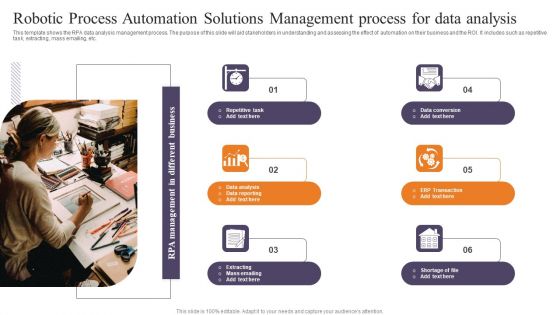
Robotic Process Automation Solutions Management Process For Data Analysis Clipart PDF
This template shows the RPA data analysis management process. The purpose of this slide will aid stakeholders in understanding and assessing the effect of automation on their business and the ROI. It includes such as repetitive task, extracting, mass emailing, etc. Presenting Robotic Process Automation Solutions Management Process For Data Analysis Clipart PDF to dispense important information. This template comprises six stages. It also presents valuable insights into the topics including Robotic Process Automation, Solutions Management, Process For Data Analysis. This is a completely customizable PowerPoint theme that can be put to use immediately. So, download it and address the topic impactfully.
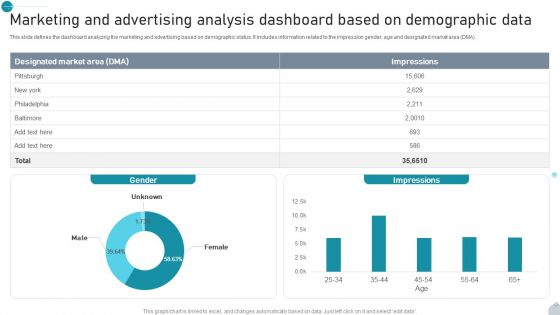
Marketing And Advertising Analysis Dashboard Based On Demographic Data Demonstration PDF
This slide defines the dashboard analyzing the marketing and advertising based on demographic status. It includes information related to the impression gender, age and designated market area DMA. Showcasing this set of slides titled Marketing And Advertising Analysis Dashboard Based On Demographic Data Demonstration PDF. The topics addressed in these templates are Gender, Impressions, Demographic Data All the content presented in this PPT design is completely editable. Download it and make adjustments in color, background, font etc. as per your unique business setting.
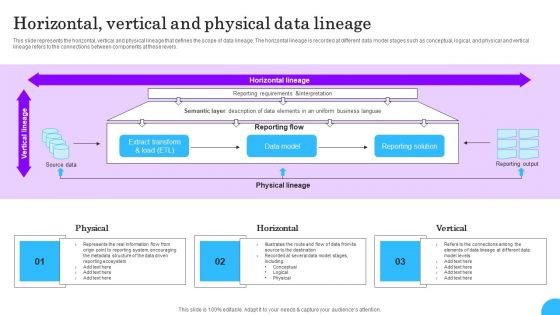
Comprehensive Analysis Of Different Data Lineage Classification Horizontal Vertical And Physical Demonstration PDF
This slide represents the horizontal, vertical and physical lineage that defines the scope of data lineage. The horizontal lineage is recorded at different data model stages such as conceptual, logical, and physical and vertical lineage refers to the connections between components at these levels. Retrieve professionally designed Comprehensive Analysis Of Different Data Lineage Classification Horizontal Vertical And Physical Demonstration PDF to effectively convey your message and captivate your listeners. Save time by selecting pre-made slideshows that are appropriate for various topics, from business to educational purposes. These themes come in many different styles, from creative to corporate, and all of them are easily adjustable and can be edited quickly. Access them as PowerPoint templates or as Google Slides themes. You do not have to go on a hunt for the perfect presentation because Slidegeeks got you covered from everywhere.

Current Scenario Analysis Of Big Data Revolutionizing Production IoT Ppt Slide
The following slide showcases current scenario analysis of big data management to assess scope of improvement. It includes KPIs such as data accuracy, downtime reduction, etc. Whether you have daily or monthly meetings, a brilliant presentation is necessary. Current Scenario Analysis Of Big Data Revolutionizing Production IoT Ppt Slide can be your best option for delivering a presentation. Represent everything in detail using Current Scenario Analysis Of Big Data Revolutionizing Production IoT Ppt Slide and make yourself stand out in meetings. The template is versatile and follows a structure that will cater to your requirements. All the templates prepared by Slidegeeks are easy to download and edit. Our research experts have taken care of the corporate themes as well. So, give it a try and see the results. The following slide showcases current scenario analysis of big data management to assess scope of improvement. It includes KPIs such as data accuracy, downtime reduction, etc.
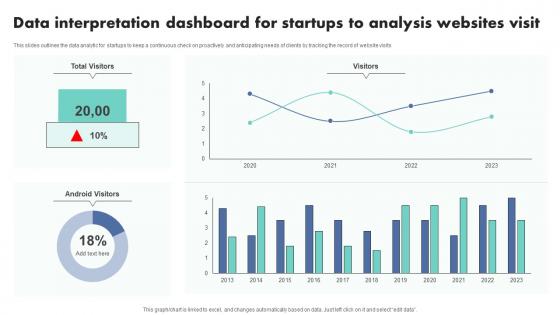
Data Interpretation Dashboard For Startups To Analysis Websites Visit Themes Pdf
This slides outlines the data analytic for startups to keep a continuous check on proactively and anticipating needs of clients by tracking the record of website visits.Showcasing this set of slides titled Data Interpretation Dashboard For Startups To Analysis Websites Visit Themes Pdf The topics addressed in these templates are Data Interpretation, Dashboard Startups, Analysis Websites Visit All the content presented in this PPT design is completely editable. Download it and make adjustments in color, background, font etc. as per your unique business setting. This slides outlines the data analytic for startups to keep a continuous check on proactively and anticipating needs of clients by tracking the record of website visits.
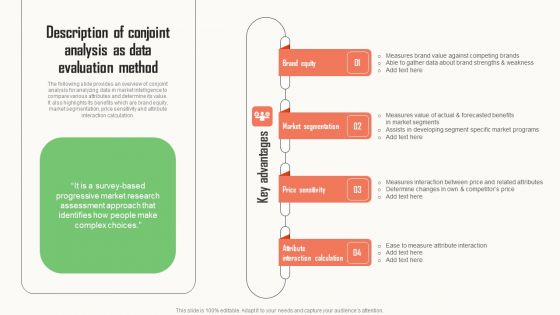
Strategic Market Insight Implementation Guide Description Of Conjoint Analysis As Data Evaluation Method Graphics PDF
The following slide provides an overview of conjoint analysis for analyzing data in market intelligence to compare various attributes and determine its value. It also highlights its benefits which are brand equity, market segmentation, price sensitivity and attribute interaction calculation. Whether you have daily or monthly meetings, a brilliant presentation is necessary. Strategic Market Insight Implementation Guide Description Of Conjoint Analysis As Data Evaluation Method Graphics PDF can be your best option for delivering a presentation. Represent everything in detail using Strategic Market Insight Implementation Guide Description Of Conjoint Analysis As Data Evaluation Method Graphics PDF and make yourself stand out in meetings. The template is versatile and follows a structure that will cater to your requirements. All the templates prepared by Slidegeeks are easy to download and edit. Our research experts have taken care of the corporate themes as well. So, give it a try and see the results.
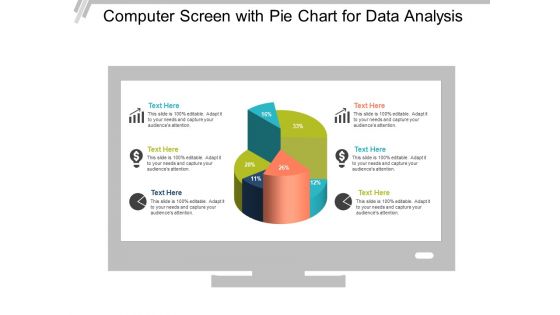
Computer Screen With Pie Chart For Data Analysis Ppt PowerPoint Presentation Show Picture
This is a computer screen with pie chart for data analysis ppt powerpoint presentation show picture. This is a six stage process. The stages in this process are computer icon, desktop icon, laptop screen icon.
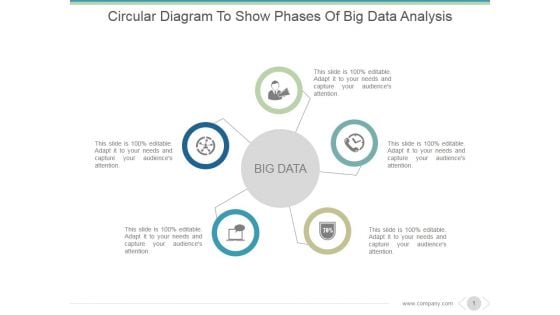
Circular Diagram To Show Phases Of Big Data Analysis Ppt PowerPoint Presentation Infographic Template
This is a circular diagram to show phases of big data analysis ppt powerpoint presentation infographic template. This is a five stage process. The stages in this process are big data, icons, management, strategy, business.
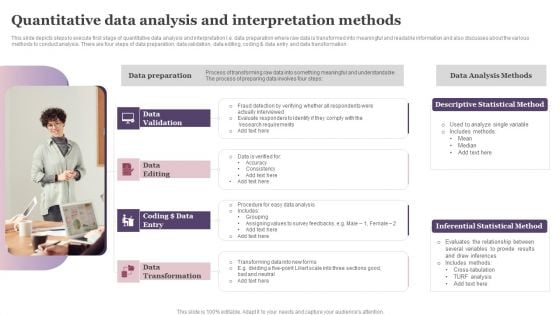
Quantitative Data Analysis And Interpretation Methods Ppt Ideas Graphics Tutorials PDF
This slide depicts steps to execute first stage of quantitative data analysis and interpretation I.e. data preparation where raw data is transformed into meaningful and readable information and also discusses about the various methods to conduct analysis. There are four steps of data preparation data validation, data editing, coding and data entry and data transformation. Presenting Quantitative Data Analysis And Interpretation Methods Ppt Ideas Graphics Tutorials PDF to dispense important information. This template comprises four stages. It also presents valuable insights into the topics including Data Validation, Data Editing, Data Preparation. This is a completely customizable PowerPoint theme that can be put to use immediately. So, download it and address the topic impactfully.
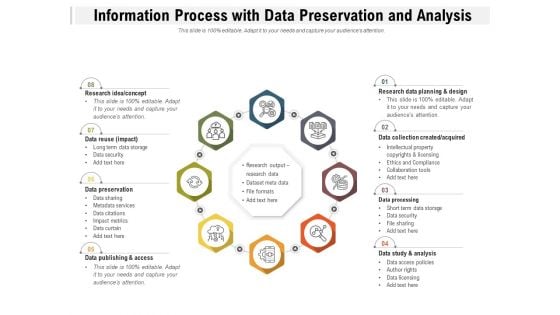
Information Process With Data Preservation And Analysis Ppt PowerPoint Presentation Styles Graphics Tutorials PDF
Presenting information process with data preservation and analysis ppt powerpoint presentation styles graphics tutorials pdf to dispense important information. This template comprises eight stages. It also presents valuable insights into the topics including research idea, concept, data reuse, data preservation, data publishing and access, research data planning and design, data collection created, acquired, data processing, data study and analysis. This is a completely customizable PowerPoint theme that can be put to use immediately. So, download it and address the topic impactfully.
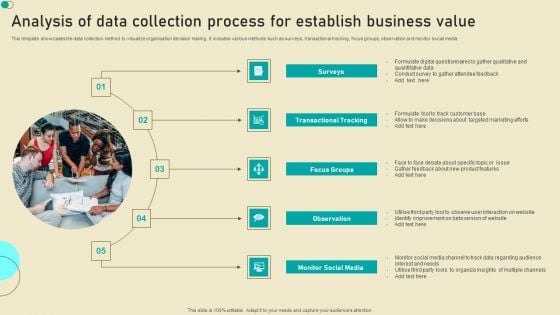
Analysis Of Data Collection Process For Establish Business Value Formats PDF
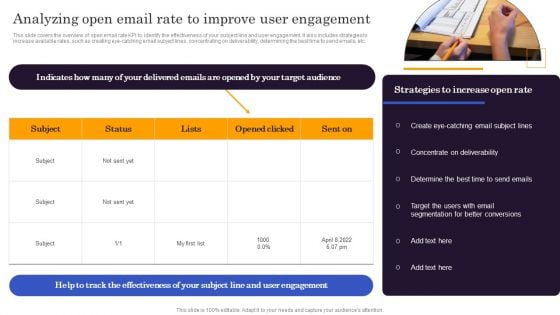
Marketers Guide To Data Analysis Optimization Analyzing Open Email Rate To Improve User Engagement Sample PDF
This slide covers the overview of open email rate KPI to identify the effectiveness of your subject line and user engagement. It also includes strategies to increase available rates, such as creating eye-catching email subject lines, concentrating on deliverability, determining the best time to send emails, etc. Whether you have daily or monthly meetings, a brilliant presentation is necessary. Marketers Guide To Data Analysis Optimization Analyzing Open Email Rate To Improve User Engagement Sample PDF can be your best option for delivering a presentation. Represent everything in detail using Marketers Guide To Data Analysis Optimization Analyzing Open Email Rate To Improve User Engagement Sample PDF and make yourself stand out in meetings. The template is versatile and follows a structure that will cater to your requirements. All the templates prepared by Slidegeeks are easy to download and edit. Our research experts have taken care of the corporate themes as well. So, give it a try and see the results.
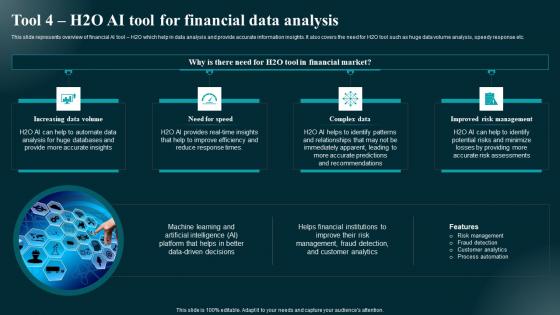
Tool 4 H2o AI Tool For Financial Data Analysis Applications And Impact Structure Pdf
This slide represents overview of financial AI tool H2O which help in data analysis and provide accurate information insights. It also covers the need for H2O tool such as huge data volume analysis, speedy response etc. Are you searching for a Tool 4 H2o AI Tool For Financial Data Analysis Applications And Impact Structure Pdf that is uncluttered, straightforward, and original Its easy to edit, and you can change the colors to suit your personal or business branding. For a presentation that expresses how much effort you have put in, this template is ideal With all of its features, including tables, diagrams, statistics, and lists, its perfect for a business plan presentation. Make your ideas more appealing with these professional slides. Download Tool 4 H2o AI Tool For Financial Data Analysis Applications And Impact Structure Pdf from Slidegeeks today. This slide represents overview of financial AI tool H2O which help in data analysis and provide accurate information insights. It also covers the need for H2O tool such as huge data volume analysis, speedy response etc.
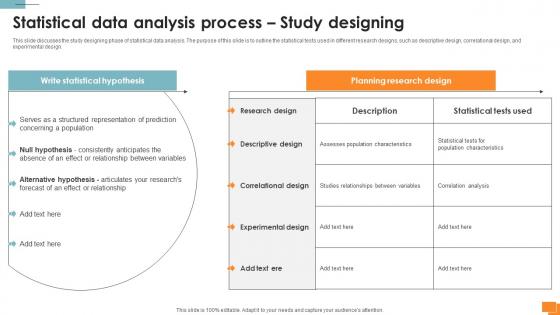
A135 Statistical Tools For Evidence Statistical Data Analysis Process Study Designing
This slide discusses the study designing phase of statistical data analysis. The purpose of this slide is to outline the statistical tests used in different research designs, such as descriptive design, correlational design, and experimental design. Slidegeeks is one of the best resources for PowerPoint templates. You can download easily and regulate A135 Statistical Tools For Evidence Statistical Data Analysis Process Study Designing for your personal presentations from our wonderful collection. A few clicks is all it takes to discover and get the most relevant and appropriate templates. Use our Templates to add a unique zing and appeal to your presentation and meetings. All the slides are easy to edit and you can use them even for advertisement purposes. This slide discusses the study designing phase of statistical data analysis. The purpose of this slide is to outline the statistical tests used in different research designs, such as descriptive design, correlational design, and experimental design.

 Home
Home