Data Analysis Icon

Profit And Loss Account Statement Summary Of Revenue Cost Lawn Care BP SS V
The slides provide a glimpse of the projected profit and loss statement to visualize the platforms financial performance for the next five years. The key components are total revenue from operations, gross profit, EBITDA, etc. The Profit And Loss Account Statement Summary Of Revenue Cost Lawn Care BP SS V is a compilation of the most recent design trends as a series of slides. It is suitable for any subject or industry presentation, containing attractive visuals and photo spots for businesses to clearly express their messages. This template contains a variety of slides for the user to input data, such as structures to contrast two elements, bullet points, and slides for written information. Slidegeeks is prepared to create an impression. The slides provide a glimpse of the projected profit and loss statement to visualize the platforms financial performance for the next five years. The key components are total revenue from operations, gross profit, EBITDA, etc.

Sample Trugreen Business Plan Profit And Loss Account Statement Summary Of Revenue BP SS V
The slides provide a glimpse of the projected profit and loss statement to visualize the platforms financial performance for the next five years. The key components are total revenue from operations, gross profit, EBITDA, etc. The Sample Trugreen Business Plan Profit And Loss Account Statement Summary Of Revenue BP SS V is a compilation of the most recent design trends as a series of slides. It is suitable for any subject or industry presentation, containing attractive visuals and photo spots for businesses to clearly express their messages. This template contains a variety of slides for the user to input data, such as structures to contrast two elements, bullet points, and slides for written information. Slidegeeks is prepared to create an impression. The slides provide a glimpse of the projected profit and loss statement to visualize the platforms financial performance for the next five years. The key components are total revenue from operations, gross profit, EBITDA, etc.
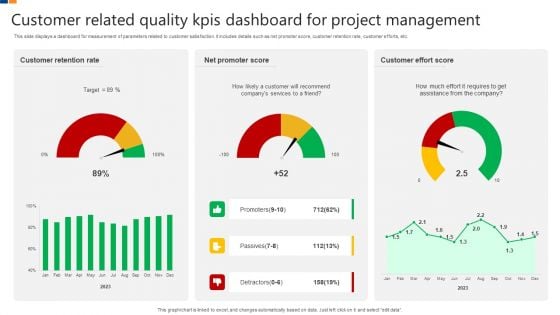
Customer Related Quality Kpis Dashboard For Project Management Brochure PDF
This slide displays a dashboard for measurement of parameters related to customer satisfaction. It includes details such as net promoter score, customer retention rate, customer efforts, etc. Showcasing this set of slides titled Customer Related Quality Kpis Dashboard For Project Management Brochure PDF. The topics addressed in these templates are Customer Retention Rate, Net Promoter Score, Customer Effort Score. All the content presented in this PPT design is completely editable. Download it and make adjustments in color, background, font etc. as per your unique business setting.
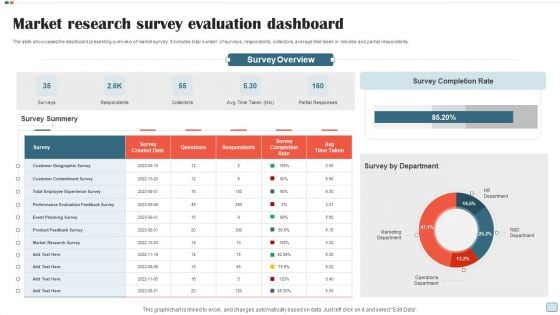
Market Research Survey Evaluation Dashboard Graphics PDF
The slide showcases the dashboard presenting overview of market survey. It includes total number of surveys, respondents, collectors, average time taken in minutes and partial respondents. Showcasing this set of slides titled Market Research Survey Evaluation Dashboard Graphics PDF. The topics addressed in these templates are Surveys, Respondents, Collectors, Partial Responses. All the content presented in this PPT design is completely editable. Download it and make adjustments in color, background, font etc. as per your unique business setting.
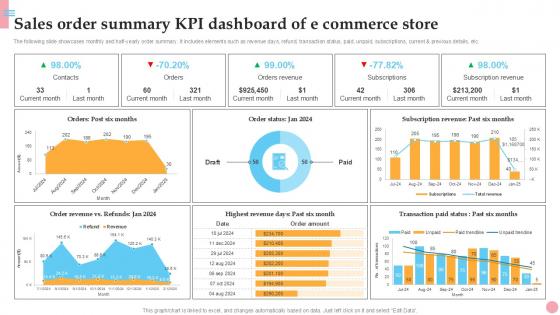
Sales Order Summary KPI Dashboard How To Improve Company PPT Sample Strategy SS V
The following slide showcases monthly and half-yearly order summary. It includes elements such as revenue days, refund, transaction status, paid, unpaid, subscriptions, current and previous details, etc. Do you know about Slidesgeeks Sales Order Summary KPI Dashboard How To Improve Company PPT Sample Strategy SS V These are perfect for delivering any kind od presentation. Using it, create PowerPoint presentations that communicate your ideas and engage audiences. Save time and effort by using our pre-designed presentation templates that are perfect for a wide range of topic. Our vast selection of designs covers a range of styles, from creative to business, and are all highly customizable and easy to edit. Download as a PowerPoint template or use them as Google Slides themes. The following slide showcases monthly and half-yearly order summary. It includes elements such as revenue days, refund, transaction status, paid, unpaid, subscriptions, current and previous details, etc.
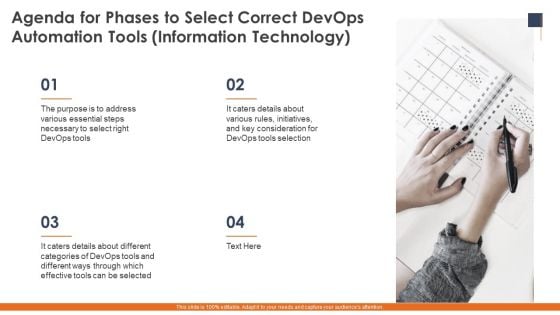
Agenda For Phases To Select Correct Devops Automation Tools Information Technology Topics PDF
This is a agenda for phases to select correct devops automation tools information technology topics pdf template with various stages. Focus and dispense information on four stages using this creative set, that comes with editable features. It contains large content boxes to add your information on topics like agenda for phases to select correct devops automation tools information technology. You can also showcase facts, figures, and other relevant content using this PPT layout. Grab it now.
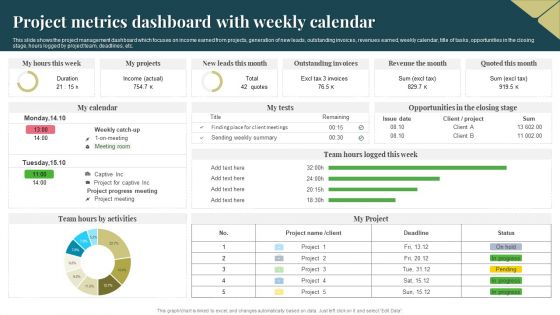
Project Metrics Dashboard With Weekly Calendar Download PDF
This slide shows the project management dashboard which focuses on income earned from projects, generation of new leads, outstanding invoices, revenues earned, weekly calendar, title of tasks, opportunities in the closing stage, hours logged by project team, deadlines, etc. Pitch your topic with ease and precision using this Project Metrics Dashboard With Weekly Calendar Download PDF. This layout presents information on Income, Revenue, Project. It is also available for immediate download and adjustment. So, changes can be made in the color, design, graphics or any other component to create a unique layout.
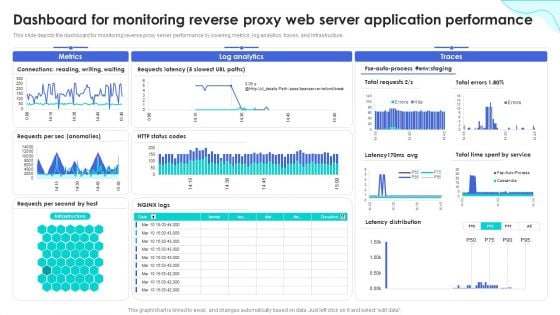
Reverse Proxy Web Server Dashboard For Monitoring Reverse Proxy Web Server Guidelines PDF
This slide depicts the dashboard for monitoring reverse proxy server performance by covering metrics, log analytics, traces, and infrastructure. Find highly impressive Reverse Proxy Web Server Dashboard For Monitoring Reverse Proxy Web Server Guidelines PDF on Slidegeeks to deliver a meaningful presentation. You can save an ample amount of time using these presentation templates. No need to worry to prepare everything from scratch because Slidegeeks experts have already done a huge research and work for you. You need to download Reverse Proxy Web Server Dashboard For Monitoring Reverse Proxy Web Server Guidelines PDF for your upcoming presentation. All the presentation templates are 100 percent editable and you can change the color and personalize the content accordingly. Download now.
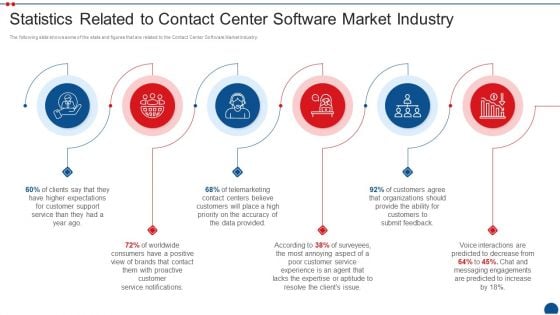
Call Center Application Market Industry Statistics Related To Contact Center Software Market Industry Themes PDF
The following slide shows some of the stats and figures that are related to the Contact Center Software Market Industry. This is a call center application market industry statistics related to contact center software market industry themes pdf template with various stages. Focus and dispense information on six stages using this creative set, that comes with editable features. It contains large content boxes to add your information on topics like statistics related to contact center software market industry. You can also showcase facts, figures, and other relevant content using this PPT layout. Grab it now.
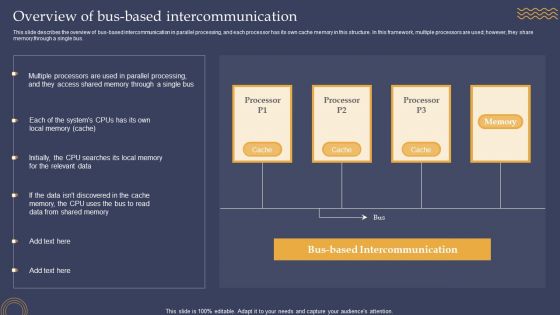
Overview Of Bus Based Intercommunication Ppt PowerPoint Presentation Diagram Images PDF
This slide describes the overview of bus based intercommunication in parallel processing, and each processor has its own cache memory in this structure. In this framework, multiple processors are used however, they share memory through a single bus. The Overview Of Bus Based Intercommunication Ppt PowerPoint Presentation Diagram Images PDF is a compilation of the most recent design trends as a series of slides. It is suitable for any subject or industry presentation, containing attractive visuals and photo spots for businesses to clearly express their messages. This template contains a variety of slides for the user to input data, such as structures to contrast two elements, bullet points, and slides for written information. Slidegeeks is prepared to create an impression.
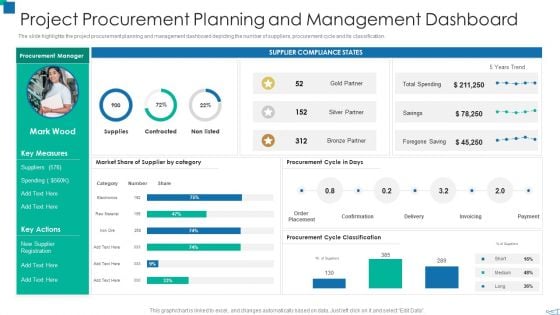
Project Procurement Planning And Management Dashboard Designs PDF
Pitch your topic with ease and precision using this project procurement planning and management dashboard designs pdf. This layout presents information on suppliers, market share, procurement. It is also available for immediate download and adjustment. So, changes can be made in the color, design, graphics or any other component to create a unique layout.
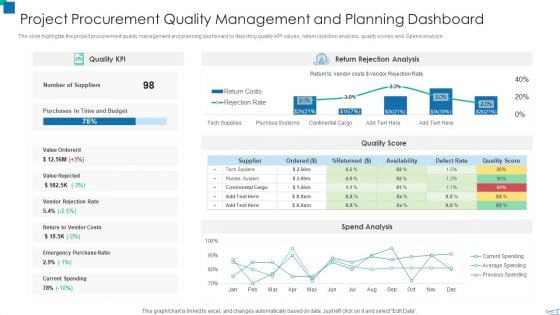
Project Procurement Quality Management And Planning Dashboard Slides PDF
Pitch your topic with ease and precision using this project procurement quality management and planning dashboard slides pdf. This layout presents information on budget, purchases, suppliers. It is also available for immediate download and adjustment. So, changes can be made in the color, design, graphics or any other component to create a unique layout.

IT Project Expenses Dashboard With Return On Investment Topics PDF
Pitch your topic with ease and precision using this IT Project Expenses Dashboard With Return On Investment Topics PDF. This layout presents information on Revenue, Costs, Budget. It is also available for immediate download and adjustment. So, changes can be made in the color, design, graphics or any other component to create a unique layout.
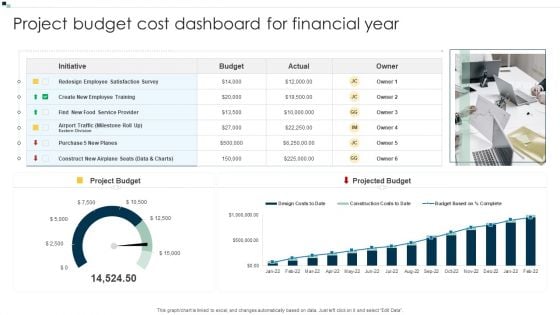
Project Budget Cost Dashboard For Financial Year Ideas PDF
Pitch your topic with ease and precision using this Project Budget Cost Dashboard For Financial Year Ideas PDF. This layout presents information on Budget, Service Provider, Redesign Employee. It is also available for immediate download and adjustment. So, changes can be made in the color, design, graphics or any other component to create a unique layout.
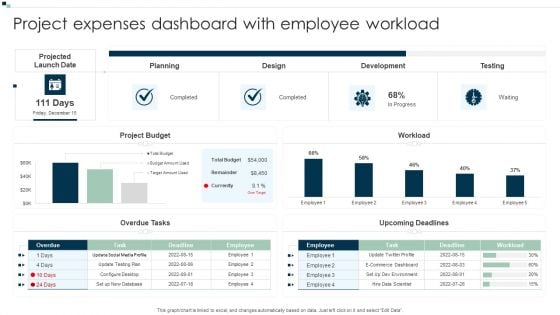
Project Expenses Dashboard With Employee Workload Background PDF
Pitch your topic with ease and precision using this Project Expenses Dashboard With Employee Workload Background PDF. This layout presents information on Planning, Design, Development. It is also available for immediate download and adjustment. So, changes can be made in the color, design, graphics or any other component to create a unique layout.

Project Expenses Saving And Avoidance Dashboard Guidelines PDF
Pitch your topic with ease and precision using this Project Expenses Saving And Avoidance Dashboard Guidelines PDF. This layout presents information on Procurement Roi, Supplier By Cost Reduction, Cost Of Purchase Order. It is also available for immediate download and adjustment. So, changes can be made in the color, design, graphics or any other component to create a unique layout.
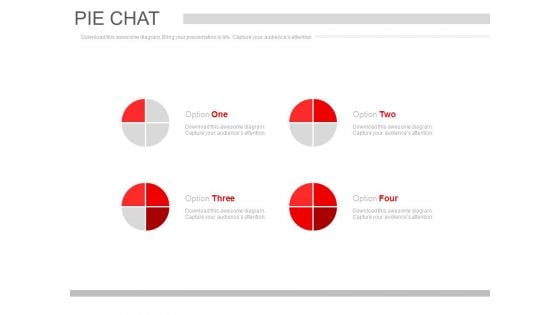
Pie Charts For Market Segmentation Powerpoint Slides
This PowerPoint contains graphics of pie charts. Download this diagram slide to display market segmentations. This template is editable, You can edit text, color, shade and style of this diagram as per you need.

Globe Connected With Computer Vector Ppt PowerPoint Presentation File Structure
Presenting this set of slides with name globe connected with computer vector ppt powerpoint presentation file structure. This is a one stage process. The stages in this process are internet icon, globe connected, technology vector. This is a completely editable PowerPoint presentation and is available for immediate download. Download now and impress your audience.
Globe Connected With Mouse Vector Ppt PowerPoint Presentation Summary Show
Presenting this set of slides with name globe connected with mouse vector ppt powerpoint presentation summary show. This is a one stage process. The stages in this process are internet icon, globe connected, technology vector. This is a completely editable PowerPoint presentation and is available for immediate download. Download now and impress your audience.
Lobe With Reload Arrows Vector Ppt PowerPoint Presentation Pictures Slides
Presenting this set of slides with name lobe with reload arrows vector ppt powerpoint presentation pictures slides. This is a one stage process. The stages in this process are internet icon, globe connected, technology vector. This is a completely editable PowerPoint presentation and is available for immediate download. Download now and impress your audience.
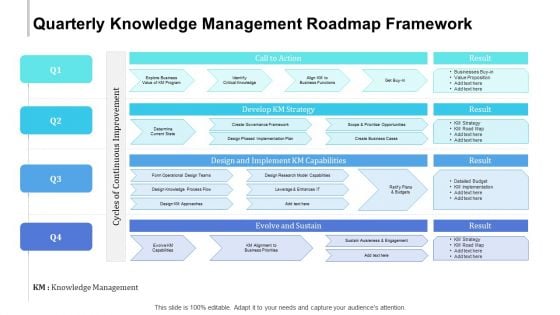
Quarterly Knowledge Management Roadmap Framework Clipart
We present our quarterly knowledge management roadmap framework clipart. This PowerPoint layout is easy to edit so you can change the font size, font type, color, and shape conveniently. In addition to this, the PowerPoint layout is Google Slides compatible, so you can share it with your audience and give them access to edit it. Therefore, download and save this well researched quarterly knowledge management roadmap framework clipart in different formats like PDF, PNG, and JPG to smoothly execute your business plan.
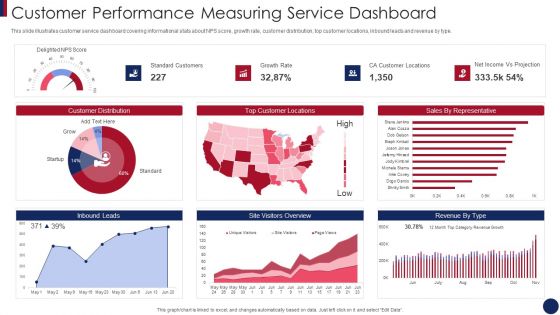
Post Merger Information Technology Service Delivery Amalgamation Customer Performance Measuring Themes PDF
This slide illustrates customer service dashboard covering informational stats about NPS score, growth rate, customer distribution, top customer locations, inbound leads and revenue by type. Deliver an awe inspiring pitch with this creative post merger information technology service delivery amalgamation customer performance measuring themes pdf bundle. Topics like customer performance measuring service dashboard can be discussed with this completely editable template. It is available for immediate download depending on the needs and requirements of the user.

Project Metrics Dashboard With Average Margin Sample PDF
This slide focuses on project management dashboard which covers number of active projects, average margin, revenues, costs, tasks status, resources with planned and actual efforts, available hours, tasks assignments with project deadlines, client, etc. Pitch your topic with ease and precision using this Project Metrics Dashboard With Average Margin Sample PDF. This layout presents information on Average Margin, Revenue, Cost. It is also available for immediate download and adjustment. So, changes can be made in the color, design, graphics or any other component to create a unique layout.
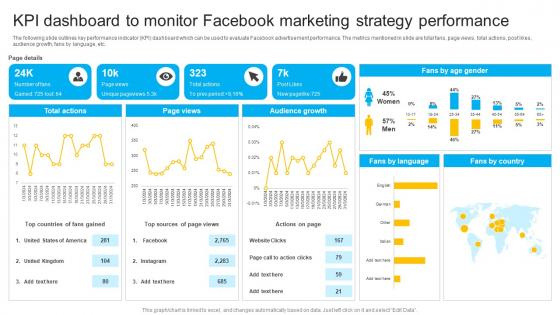
How To Create Cost Effective KPI Dashboard To Monitor Facebook Marketing Strategy SS V
The following slide outlines key performance indicator KPI dashboard which can be used to evaluate Facebook advertisement performance. The metrics mentioned in slide are total fans, page views, total actions, post likes, audience growth, fans by language, etc. Do you know about Slidesgeeks How To Create Cost Effective KPI Dashboard To Monitor Facebook Marketing Strategy SS V These are perfect for delivering any kind od presentation. Using it, create PowerPoint presentations that communicate your ideas and engage audiences. Save time and effort by using our pre-designed presentation templates that are perfect for a wide range of topic. Our vast selection of designs covers a range of styles, from creative to business, and are all highly customizable and easy to edit. Download as a PowerPoint template or use them as Google Slides themes. The following slide outlines key performance indicator KPI dashboard which can be used to evaluate Facebook advertisement performance. The metrics mentioned in slide are total fans, page views, total actions, post likes, audience growth, fans by language, etc.
Professional Scrum Master Certification Software Development Progress Tracking Dashboard Inspiration PDF
This slide portrays software development project management dashboard with KPIs namely status of planning, design, development, testing project launch date, project budget, overdue tasks, workload and upcoming deadlines. Deliver an awe inspiring pitch with this creative professional scrum master certification software development progress tracking dashboard inspiration pdf bundle. Topics like project budget, planning, development, testing, projected launch date can be discussed with this completely editable template. It is available for immediate download depending on the needs and requirements of the user.
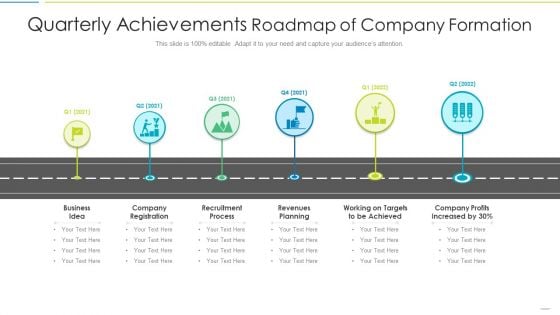
Quarterly Achievements Roadmap Of Company Formation Diagrams PDF
Presenting quarterly achievements roadmap of company formation diagrams pdf to dispense important information. This template comprises six stages. It also presents valuable insights into the topics including business idea, company registration, recruitment process, revenues planning, working on targets to be achieved. This is a completely customizable PowerPoint theme that can be put to use immediately. So, download it and address the topic impactfully.
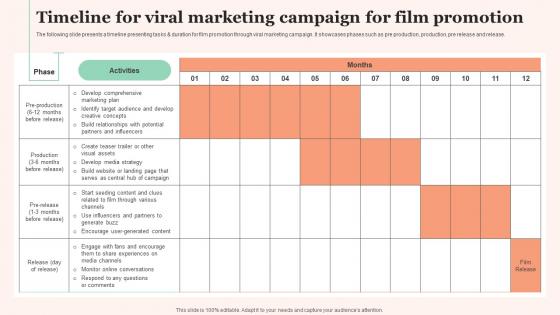
Timeline For Viral Marketing Film Promotional Techniques To Increase Box Office Collection Introduction Pdf
The following slide presents a timeline presenting tasks and duration for film promotion through viral marketing campaign. It showcases phases such as pre production, production, pre release and release. Slidegeeks is one of the best resources for PowerPoint templates. You can download easily and regulate Timeline For Viral Marketing Film Promotional Techniques To Increase Box Office Collection Introduction Pdf for your personal presentations from our wonderful collection. A few clicks is all it takes to discover and get the most relevant and appropriate templates. Use our Templates to add a unique zing and appeal to your presentation and meetings. All the slides are easy to edit and you can use them even for advertisement purposes. The following slide presents a timeline presenting tasks and duration for film promotion through viral marketing campaign. It showcases phases such as pre production, production, pre release and release.
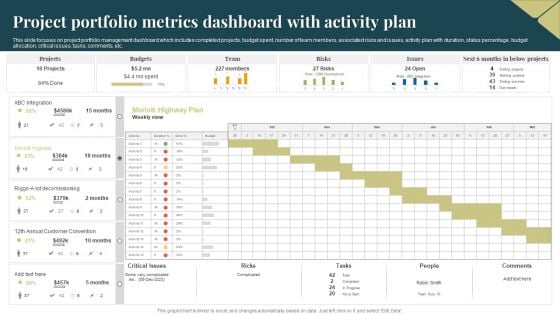
Project Portfolio Metrics Dashboard With Activity Plan Clipart PDF
This slide focuses on project portfolio management dashboard which includes completed projects, budget spent, number of team members, associated risks and issues, activity plan with duration, status percentage, budget allocation, critical issues, tasks, comments, etc. Pitch your topic with ease and precision using this Project Portfolio Metrics Dashboard With Activity Plan Clipart PDF. This layout presents information on Budgets, Team, Risks. It is also available for immediate download and adjustment. So, changes can be made in the color, design, graphics or any other component to create a unique layout.
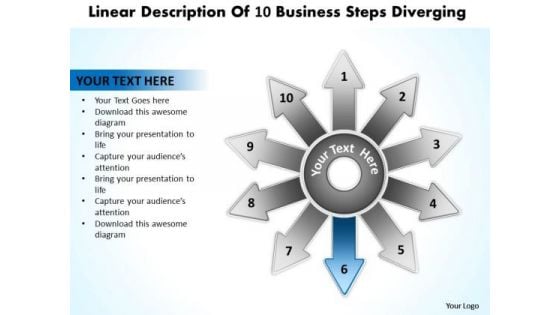
Linear Description Of 10 Business Steps Diverging Circular Motion Process PowerPoint Slides
We present our linear description of 10 business steps diverging Circular Motion Process PowerPoint Slides.Download our Communication PowerPoint Templates because the Gear train is a basic element of living and daily business. Download and present our Business PowerPoint Templates because you have analysed many global markets and come up with possibilities. Highlight the pros and cons of other likely business oppurtunities. Use our Arrows PowerPoint Templates because you can Churn the wheels of the brains of your colleagues. Download and present our Symbol PowerPoint Templates because it depicts Rolling along while gathering profits along the way is the aim. Use our Process and Flows PowerPoint Templates because this PPt slide helps you to measure key aspects of the current process and collect relevant data.Use these PowerPoint slides for presentations relating to Abstract, Arrow, Background, Buttons, Circle, Clean, Communication, Concept, Conceptual, Design, Diagram, Direction, Elements, Exchange, Flow, Flowchart, Graph, Graphic, Icon, Illustration, Internet, Precise, Process, Red, Sign, Symbol, Template. The prominent colors used in the PowerPoint template are Blue, Gray, Black. Use our linear description of 10 business steps diverging Circular Motion Process PowerPoint Slides will help them to explain complicated concepts. We assure you our Conceptual PowerPoint templates and PPT Slides effectively help you save your valuable time. People tell us our linear description of 10 business steps diverging Circular Motion Process PowerPoint Slides are Nostalgic. PowerPoint presentation experts tell us our Clean PowerPoint templates and PPT Slides are Elevated. PowerPoint presentation experts tell us our linear description of 10 business steps diverging Circular Motion Process PowerPoint Slides are Multicolored. Use our Clean PowerPoint templates and PPT Slides are Nifty. Our Linear Description Of 10 Business Steps Diverging Circular Motion Process PowerPoint Slides are exemplary contributors. They go all out to achieve the common goal.
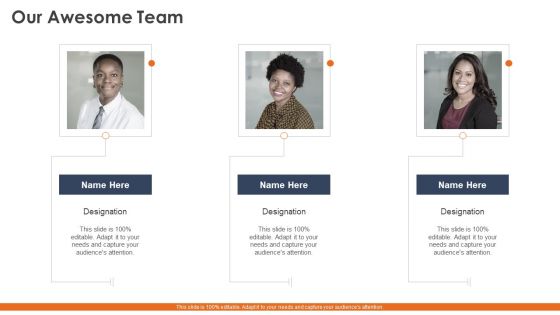
Phases To Select Correct Devops Automation Tools Information Technology Our Awesome Team Brochure PDF
This is a phases to select correct devops automation tools information technology our awesome team brochure pdf template with various stages. Focus and dispense information on three stages using this creative set, that comes with editable features. It contains large content boxes to add your information on topics like our awesome team. You can also showcase facts, figures, and other relevant content using this PPT layout. Grab it now.
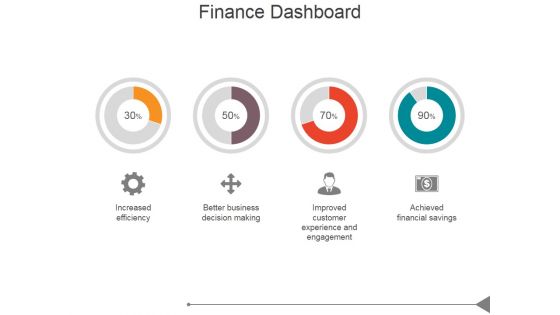
Finance Dashboard Ppt PowerPoint Presentation Diagrams
This is a finance dashboard ppt powerpoint presentation diagrams. This is a four stage process. The stages in this process are increased efficiency, better business decision making, improved customer experience and engagement, achieved financial savings.
Major Techniques For Project Safety IT Project Management Activities Tracking Dashboard Mockup PDF
This slide provides information regarding the dashboard which will help team in managing different activities associated to projects and keep track on the time, cost spent. Deliver an awe inspiring pitch with this creative major techniques for project safety it project management activities tracking dashboard mockup pdf bundle. Topics like cost, team cost breakdown, workload, tasks, spent time on projects can be discussed with this completely editable template. It is available for immediate download depending on the needs and requirements of the user.
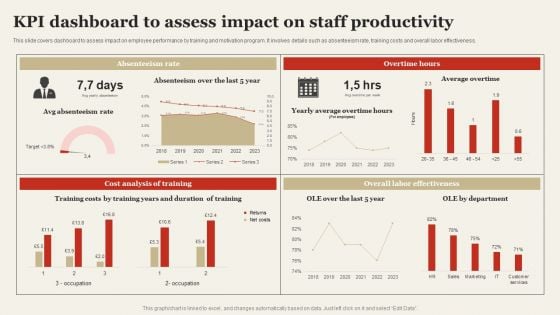
KPI Dashboard To Assess Impact On Staff Productivity Infographics PDF
This slide covers dashboard to assess impact on employee performance by training and motivation program. It involves details such as absenteeism rate, training costs and overall labor effectiveness. Make sure to capture your audiences attention in your business displays with our gratis customizable KPI Dashboard To Assess Impact On Staff Productivity Infographics PDF. These are great for business strategies, office conferences, capital raising or task suggestions. If you desire to acquire more customers for your tech business and ensure they stay satisfied, create your own sales presentation with these plain slides.
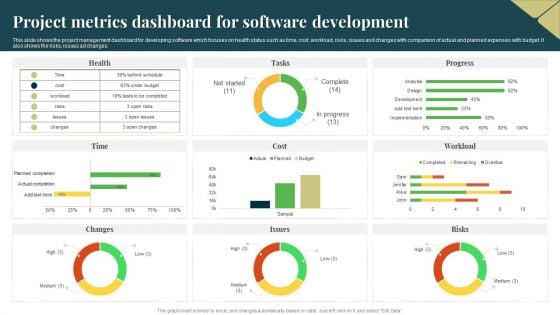
Project Metrics Dashboard For Software Development Designs PDF
This slide shows the project management dashboard for developing software which focuses on health status such as time, cost, workload, risks, issues and changes with comparison of actual and planned expenses with budget. It also shows the risks, issues ad changes. Pitch your topic with ease and precision using this Project Metrics Dashboard For Software Development Designs PDF. This layout presents information on Risks, Budget, Cost. It is also available for immediate download and adjustment. So, changes can be made in the color, design, graphics or any other component to create a unique layout.
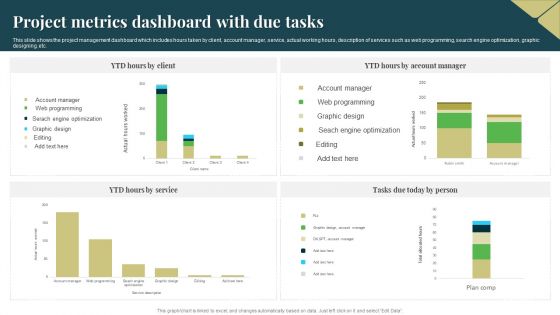
Project Metrics Dashboard With Due Tasks Microsoft PDF
This slide shows the project management dashboard which includes hours taken by client, account manager, service, actual working hours, description of services such as web programming, search engine optimization, graphic designing, etc. Pitch your topic with ease and precision using this Project Metrics Dashboard With Due Tasks Microsoft PDF. This layout presents information on Service, Optimization, Graphic Design. It is also available for immediate download and adjustment. So, changes can be made in the color, design, graphics or any other component to create a unique layout.
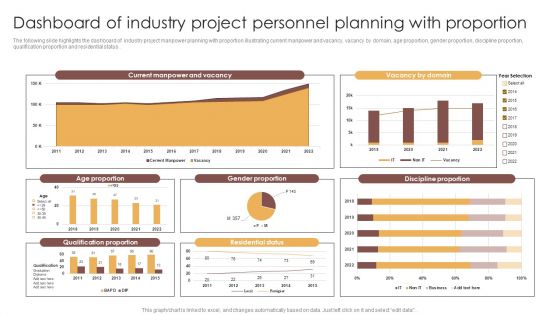
Dashboard Of Industry Project Personnel Planning With Proportion Professional PDF
The following slide highlights the dashboard of industry project manpower planning with proportion illustrating current manpower and vacancy, vacancy by domain, age proportion, gender proportion, discipline proportion, qualification proportion and residential status. Pitch your topic with ease and precision using this Dashboard Of Industry Project Personnel Planning With Proportion Professional PDF. This layout presents information on Current Manpower And Vacancy, Gender Proportion, Qualification Proportion. It is also available for immediate download and adjustment. So, changes can be made in the color, design, graphics or any other component to create a unique layout.
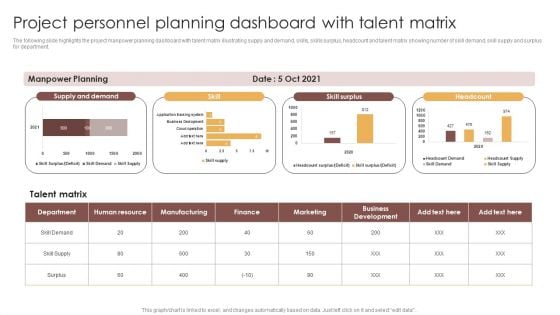
Project Personnel Planning Dashboard With Talent Matrix Demonstration Structure PDF
The following slide highlights the project manpower planning dashboard with talent matrix illustrating supply and demand, skills, skills surplus, headcount and talent matrix showing number of skill demand, skill supply and surplus for department. Pitch your topic with ease and precision using this Project Personnel Planning Dashboard With Talent Matrix Demonstration Structure PDF. This layout presents information on Supply And Demand, Skill Surplus, Headcount. It is also available for immediate download and adjustment. So, changes can be made in the color, design, graphics or any other component to create a unique layout.
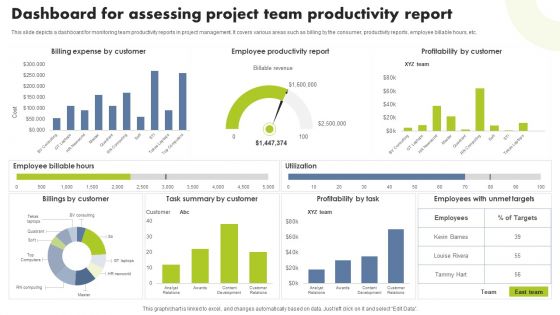
Dashboard For Assessing Project Team Productivity Report Mockup PDF
This slide depicts a dashboard for monitoring team productivity reports in project management. It covers various areas such as billing by the consumer, productivity reports, employee billable hours, etc. Pitch your topic with ease and precision using this Dashboard For Assessing Project Team Productivity Report Mockup PDF. This layout presents information on Billing Expense Customer, Employee Productivity Report, Profitability Customer. It is also available for immediate download and adjustment. So, changes can be made in the color, design, graphics or any other component to create a unique layout.
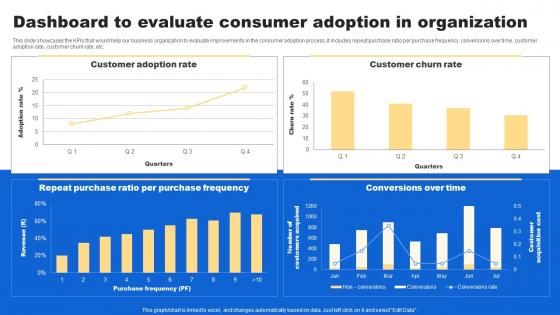
Dashboard To Evaluate Consumer Analyzing Customer Buying Behavior Enhance Conversion Inspiration Pdf
This slide showcases the KPIs that would help our business organization to evaluate improvements in the consumer adoption process. It includes repeat purchase ratio per purchase frequency, conversions over time, customer adoption rate, customer churn rate, etc. Whether you have daily or monthly meetings, a brilliant presentation is necessary. Dashboard To Evaluate Consumer Analyzing Customer Buying Behavior Enhance Conversion Inspiration Pdf can be your best option for delivering a presentation. Represent everything in detail using Dashboard To Evaluate Consumer Analyzing Customer Buying Behavior Enhance Conversion Inspiration Pdf and make yourself stand out in meetings. The template is versatile and follows a structure that will cater to your requirements. All the templates prepared by Slidegeeks are easy to download and edit. Our research experts have taken care of the corporate themes as well. So, give it a try and see the results. This slide showcases the KPIs that would help our business organization to evaluate improvements in the consumer adoption process. It includes repeat purchase ratio per purchase frequency, conversions over time, customer adoption rate, customer churn rate, etc.
Dashboard For Tracking Viral Implementing Social Media Tactics For Boosting WOM Professional Pdf
This slide showcases the parameters for business organizations to evaluate viral marketing performance. It includes KPIs such as user metrics, campaign metrics, social metrics, engagement rate, viral sign ups, etc. Whether you have daily or monthly meetings, a brilliant presentation is necessary. Dashboard For Tracking Viral Implementing Social Media Tactics For Boosting WOM Professional Pdf can be your best option for delivering a presentation. Represent everything in detail using Dashboard For Tracking Viral Implementing Social Media Tactics For Boosting WOM Professional Pdf and make yourself stand out in meetings. The template is versatile and follows a structure that will cater to your requirements. All the templates prepared by Slidegeeks are easy to download and edit. Our research experts have taken care of the corporate themes as well. So, give it a try and see the results. This slide showcases the parameters for business organizations to evaluate viral marketing performance. It includes KPIs such as user metrics, campaign metrics, social metrics, engagement rate, viral sign ups, etc.
Website Leads Tracking Dashboard With Traffic Sources Infographics PDF
This slide showcases dashboard for lead generation that can help organziation to identify the traffic sources plus visitors and make changes in SEO of website. It also showcases key metrics that are bounce rate by week, visitors by user type, top channels by conversion, top campaign by conversion and top pages by conversion. Pitch your topic with ease and precision using this Website Leads Tracking Dashboard With Traffic Sources Infographics PDF. This layout presents information on Visitors User Type, Traffic Sources, Bounce Rate Week. It is also available for immediate download and adjustment. So, changes can be made in the color, design, graphics or any other component to create a unique layout.
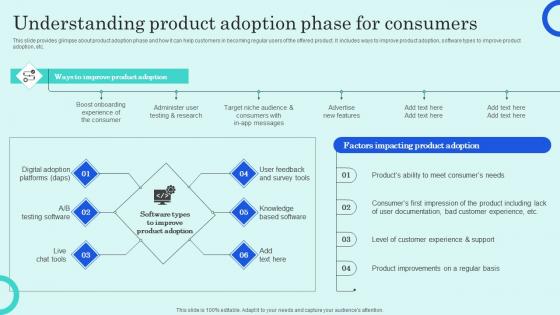
Understanding Product Adoption Phase For Consumers Overview Of Customer Adoption Process Background Pdf
This slide provides glimpse about product adoption phase and how it can help customers in becoming regular users of the offered product. It includes ways to improve product adoption, software types to improve product adoption, etc. Slidegeeks has constructed Understanding Product Adoption Phase For Consumers Overview Of Customer Adoption Process Background Pdf after conducting extensive research and examination. These presentation templates are constantly being generated and modified based on user preferences and critiques from editors. Here, you will find the most attractive templates for a range of purposes while taking into account ratings and remarks from users regarding the content. This is an excellent jumping off point to explore our content and will give new users an insight into our top notch PowerPoint Templates. This slide provides glimpse about product adoption phase and how it can help customers in becoming regular users of the offered product. It includes ways to improve product adoption, software types to improve product adoption, etc.

Zero Trust Network Access Main Pillars Of Zero Network Trust Access
This slide outlines the critical pillars of the zero network trust access model. The purpose of this slide is to showcase the primary pillars of ZTNA, including users, devices, networks, infrastructure, applications, data, visibility and analytics, and orchestration and automation. Do you know about Slidesgeeks Zero Trust Network Access Main Pillars Of Zero Network Trust Access These are perfect for delivering any kind od presentation. Using it, create PowerPoint presentations that communicate your ideas and engage audiences. Save time and effort by using our pre-designed presentation templates that are perfect for a wide range of topic. Our vast selection of designs covers a range of styles, from creative to business, and are all highly customizable and easy to edit. Download as a PowerPoint template or use them as Google Slides themes. This slide outlines the critical pillars of the zero network trust access model. The purpose of this slide is to showcase the primary pillars of ZTNA, including users, devices, networks, infrastructure, applications, data, visibility and analytics, and orchestration and automation.
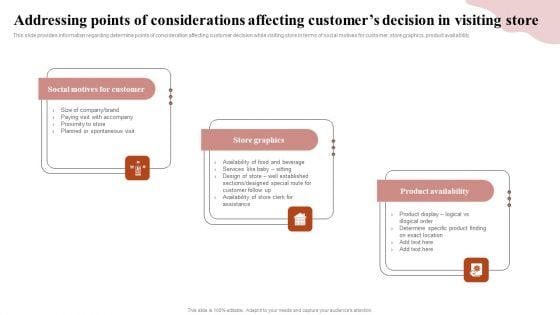
Remodeling Experiential Departmental Store Ecosystem Addressing Points Considerations Affecting Themes PDF
This slide provides information regarding determine points of consideration affecting customer decision while visiting store in terms of social motives for customer, store graphics, product availability. The This slide provides information regarding various factors influencing customer decision in visiting stores such as retail factors, transport, customer, and product and design factors. is a compilation of the most recent design trends as a series of slides. It is suitable for any subject or industry presentation, containing attractive visuals and photo spots for businesses to clearly express their messages. This template contains a variety of slides for the user to input data, such as structures to contrast two elements, bullet points, and slides for written information. Slidegeeks is prepared to create an impression.
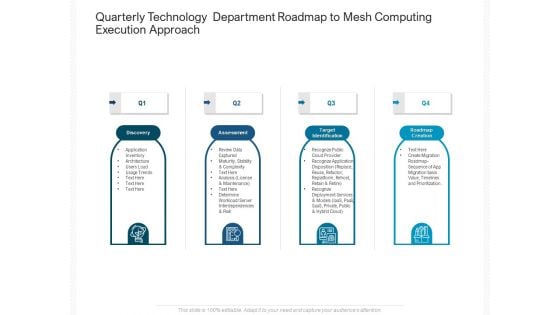
Quarterly Technology Department Roadmap To Mesh Computing Execution Approach Download
Presenting our jaw-dropping quarterly technology department roadmap to mesh computing execution approach download. You can alternate the color, font size, font type, and shapes of this PPT layout according to your strategic process. This PPT presentation is compatible with Google Slides and is available in both standard screen and widescreen aspect ratios. You can also download this well-researched PowerPoint template design in different formats like PDF, JPG, and PNG. So utilize this visually-appealing design by clicking the download button given below.
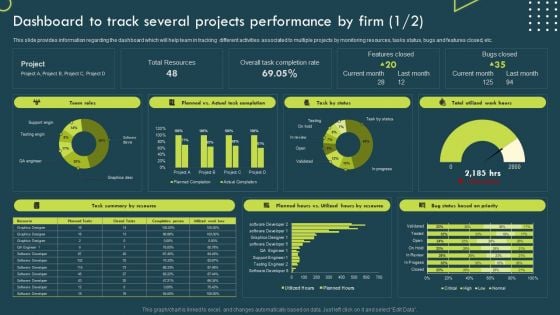
Dashboard To Track Several Projects Performance By Firm Template PDF
This slide provides information regarding the dashboard which will help team in tracking different activities associated to multiple projects by monitoring resources, tasks status, bugs and features closed, etc. Do you have an important presentation coming up Are you looking for something that will make your presentation stand out from the rest Look no further than Dashboard To Track Several Projects Performance By Firm Template PDF. With our professional designs, you can trust that your presentation will pop and make delivering it a smooth process. And with Slidegeeks, you can trust that your presentation will be unique and memorable. So why wait Grab Dashboard To Track Several Projects Performance By Firm Template PDF today and make your presentation stand out from the rest.
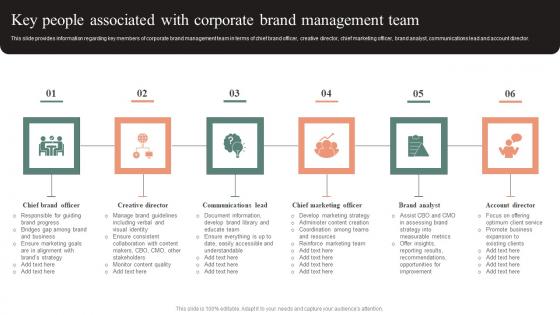
Key People Associated With Corporate Brand Management Team Effective Brand Maintenance Themes Pdf
This slide provides information regarding key members of corporate brand management team in terms of chief brand officer, creative director, chief marketing officer, brand analyst, communications lead and account director. The Key People Associated With Corporate Brand Management Team Effective Brand Maintenance Themes Pdf is a compilation of the most recent design trends as a series of slides. It is suitable for any subject or industry presentation, containing attractive visuals and photo spots for businesses to clearly express their messages. This template contains a variety of slides for the user to input data, such as structures to contrast two elements, bullet points, and slides for written information. Slidegeeks is prepared to create an impression. This slide provides information regarding key members of corporate brand management team in terms of chief brand officer, creative director, chief marketing officer, brand analyst, communications lead and account director.
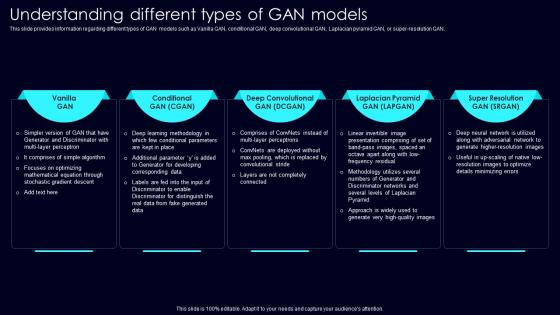
Understanding Different Types Exploring Rise Of Generative AI In Artificial Intelligence Themes Pdf
This slide provides information regarding different types of GAN models such as Vanilla GAN, conditional GAN, deep convolutional GAN, Laplacian pyramid GAN, or super resolution GAN. The Understanding Different Types Exploring Rise Of Generative AI In Artificial Intelligence Themes Pdf is a compilation of the most recent design trends as a series of slides. It is suitable for any subject or industry presentation, containing attractive visuals and photo spots for businesses to clearly express their messages. This template contains a variety of slides for the user to input data, such as structures to contrast two elements, bullet points, and slides for written information. Slidegeeks is prepared to create an impression. This slide provides information regarding different types of GAN models such as Vanilla GAN, conditional GAN, deep convolutional GAN, Laplacian pyramid GAN, or super resolution GAN.
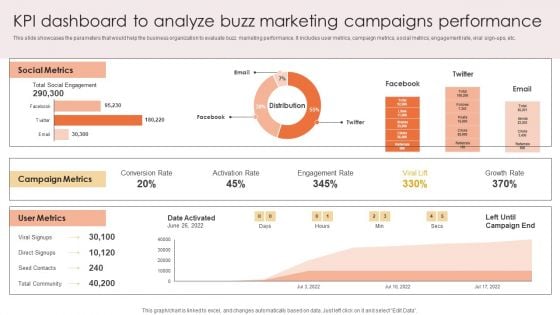
Kpi Dashboard To Analyze Buzz Marketing Campaigns Performance Download PDF
This slide showcases the parameters that would help the business organization to evaluate buzz marketing performance. It includes user metrics, campaign metrics, social metrics, engagement rate, viral sign-ups, etc. Take your projects to the next level with our ultimate collection of Kpi Dashboard To Analyze Buzz Marketing Campaigns Performance Download PDF. Slidegeeks has designed a range of layouts that are perfect for representing task or activity duration, keeping track of all your deadlines at a glance. Tailor these designs to your exact needs and give them a truly corporate look with your own brand colors they will make your projects stand out from the rest.
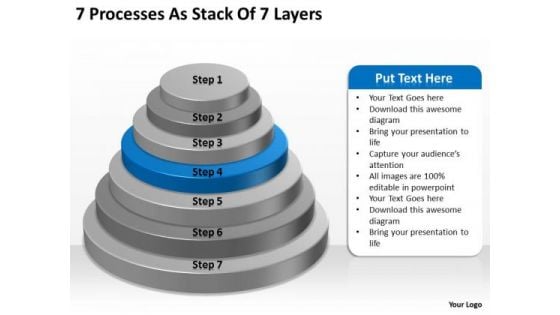
7 Processess As Stack Of Layers Ppt Business Plan Free PowerPoint Templates
We present our 7 processess as stack of layers ppt business plan free PowerPoint templates.Present our Communication PowerPoint Templates because They will Put the wind in your sails. Skim smoothly over the choppy waters of the market. Present our Success PowerPoint Templates because You can Be the puppeteer with our PowerPoint Templates and Slides as your strings. Lead your team through the steps of your script. Download our Layers PowerPoint Templates because Our PowerPoint Templates and Slides has conjured up a web of all you need with the help of our great team. Use them to string together your glistening ideas. Use our Business PowerPoint Templates because Your ideas provide food for thought. Our PowerPoint Templates and Slides will help you create a dish to tickle the most discerning palate. Download our Shapes PowerPoint Templates because You should Bet on your luck with our PowerPoint Templates and Slides. Be assured that you will hit the jackpot.Use these PowerPoint slides for presentations relating to Layered, Layer, 3d, Cone, Object, Item, Segment, White, Business, Concept, Hierarchy, Success, Presentation, Bright, Symbol, Diagram, Cooperation, Data, Bond, Level, Top, Shape, Abstract, Graph, Arrangement, Support, Illustration, Icon, Stage, Chart, System, Strategy, Complex, Contact, Design, Cylinder, Color, Growth, Blue, Pyramid, Empty, Company, Global, Progress, Background, Construction, Structure, Rank, Performance, Communication. The prominent colors used in the PowerPoint template are Blue, Gray, Black. Give the gift of career growth with our 7 Processess As Stack Of Layers Ppt Business Plan Free PowerPoint Templates. Dont waste time struggling with PowerPoint. Let us do it for you.
Technology Upgradation Action Plan Dashboard For Issues Tracking Ppt Portfolio Graphics Pictures PDF
This slide shows the issues tracking the dashboard for the business transition project. It provides details of multiple issues faced by users to keep records for effective management of the project. Deliver an awe inspiring pitch with this creative Technology Upgradation Action Plan Dashboard For Issues Tracking Ppt Portfolio Graphics Pictures PDF bundle. Topics like Issues Failed Verification, Immediate Issues, High Churn Issues, Suspect Requirements, Failed Test Runs can be discussed with this completely editable template. It is available for immediate download depending on the needs and requirements of the user.
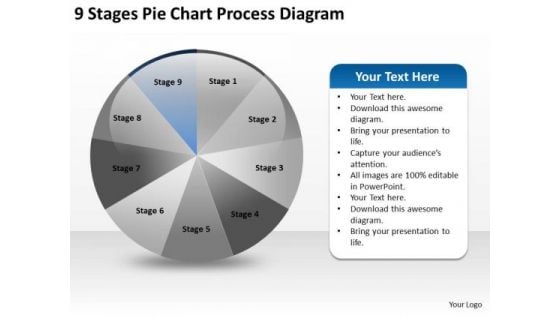
9 Stages Pie Chart Process Diagram Ppt Google Business Plan PowerPoint Templates
We present our 9 stages pie chart process diagram ppt google business plan PowerPoint templates.Download and present our Marketing PowerPoint Templates because It will get your audience in sync. Present our Finance PowerPoint Templates because You can Double your output with our PowerPoint Templates and Slides. They make beating deadlines a piece of cake. Present our Arrows PowerPoint Templates because Our PowerPoint Templates and Slides will let your team Walk through your plans. See their energy levels rise as you show them the way. Download and present our Circle Charts PowerPoint Templates because You can Be the star of the show with our PowerPoint Templates and Slides. Rock the stage with your ideas. Download and present our Shapes PowerPoint Templates because Our PowerPoint Templates and Slides are effectively colour coded to prioritise your plans They automatically highlight the sequence of events you desire.Use these PowerPoint slides for presentations relating to Diagram, business, chart, market, website, network, statistics, model, document, junction, plan, vector, presentation, template, circle, brochure, data, stock, process, marketing, management, graph, wheel, box, pie, options, catalog, direction, design, company, navigation, financial, structure, multiple, button, goals, results. The prominent colors used in the PowerPoint template are Blue, Gray, Black. Our 9 Stages Pie Chart Process Diagram Ppt Google Business Plan PowerPoint Templates will exhibit your ability. Demonstrate your talent to one and all.
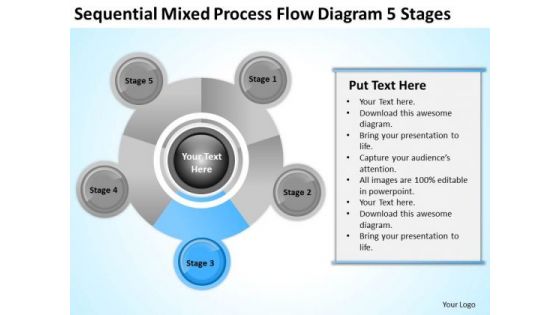
Business Organizational Chart Examples Mixed Process Flow Diagram 5 Stages PowerPoint Slide
We present our business organizational chart examples mixed process flow diagram 5 stages PowerPoint Slide.Download our Construction PowerPoint Templates because You can Hit the nail on the head with our PowerPoint Templates and Slides. Embed your ideas in the minds of your audience. Use our Advertising PowerPoint Templates because Our PowerPoint Templates and Slides are conceived by a dedicated team. Use them and give form to your wondrous ideas. Use our Circle Charts PowerPoint Templates because You can Be the puppeteer with our PowerPoint Templates and Slides as your strings. Lead your team through the steps of your script. Use our Business PowerPoint Templates because You can Channelise the thoughts of your team with our PowerPoint Templates and Slides. Urge them to focus on the goals you have set. Download our Shapes PowerPoint Templates because Our PowerPoint Templates and Slides have the Brilliant backdrops. Guaranteed to illuminate the minds of your audience.Use these PowerPoint slides for presentations relating to Development, diagram, life, test, process, chart, concept, vector, stage, project, business, workflow, team, design, phase, product, model, schema, corporate, implementation, tag, plan, engineering, success, symbol, stack, circle, graphic, data, shape, management, cycle, steps, illustration, system, strategy, waterfall, colors, objects, lifecycle, professional, quality, organization, implement, background, image, detail, software, structure, ideas. The prominent colors used in the PowerPoint template are Blue, Gray, Black. Our Business Organizational Chart Examples Mixed Process Flow Diagram 5 Stages PowerPoint Slide are really enterprising. They dig out ways to convey your ideas.
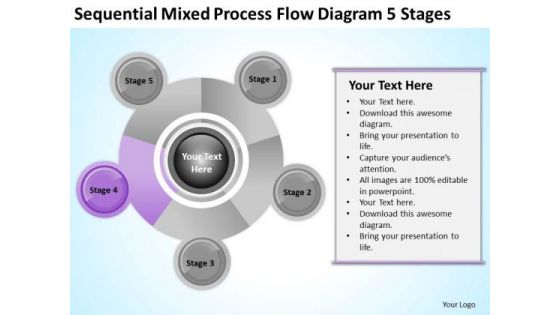
Business Organizational Chart Examples Mixed Process Flow Diagram 5 Stages Ppt PowerPoint Slide
We present our business organizational chart examples mixed process flow diagram 5 stages ppt PowerPoint Slide.Present our Construction PowerPoint Templates because Our PowerPoint Templates and Slides will definately Enhance the stature of your presentation. Adorn the beauty of your thoughts with their colourful backgrounds. Use our Advertising PowerPoint Templates because Your ideas provide food for thought. Our PowerPoint Templates and Slides will help you create a dish to tickle the most discerning palate. Download and present our Circle Charts PowerPoint Templates because Our PowerPoint Templates and Slides will let you meet your Deadlines. Download and present our Business PowerPoint Templates because It can be used to Set your controls for the heart of the sun. Our PowerPoint Templates and Slides will be the propellant to get you there. Present our Shapes PowerPoint Templates because You should Throw the gauntlet with our PowerPoint Templates and Slides. They are created to take up any challenge.Use these PowerPoint slides for presentations relating to Development, diagram, life, test, process, chart, concept, vector, stage, project, business, workflow, team, design, phase, product, model, schema, corporate, implementation, tag, plan, engineering, success, symbol, stack, circle, graphic, data, shape, management, cycle, steps, illustration, system, strategy, waterfall, colors, objects, lifecycle, professional, quality, organization, implement, background, image, detail, software, structure, ideas. The prominent colors used in the PowerPoint template are Purple, Gray, Black. Our Business Organizational Chart Examples Mixed Process Flow Diagram 5 Stages Ppt PowerPoint Slide make a great bait. Your ideas will hook them all.
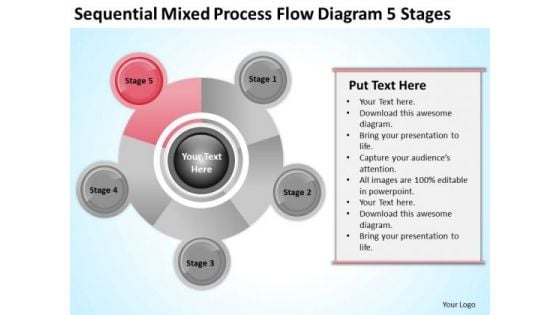
Business Organizational Chart Examples Mixed Process Flow Diagram 5 Stages Ppt PowerPoint Slides
We present our business organizational chart examples mixed process flow diagram 5 stages ppt PowerPoint Slides.Download and present our Construction PowerPoint Templates because Our PowerPoint Templates and Slides are created with admirable insight. Use them and give your group a sense of your logical mind. Download our Advertising PowerPoint Templates because These PowerPoint Templates and Slides will give the updraft to your ideas. See them soar to great heights with ease. Download and present our Circle Charts PowerPoint Templates because They will bring a lot to the table. Their alluring flavours will make your audience salivate. Use our Business PowerPoint Templates because Our PowerPoint Templates and Slides will effectively help you save your valuable time. They are readymade to fit into any presentation structure. Download and present our Shapes PowerPoint Templates because Our PowerPoint Templates and Slides will let you Hit the right notes. Watch your audience start singing to your tune.Use these PowerPoint slides for presentations relating to Development, diagram, life, test, process, chart, concept, vector, stage, project, business, workflow, team, design, phase, product, model, schema, corporate, implementation, tag, plan, engineering, success, symbol, stack, circle, graphic, data, shape, management, cycle, steps, illustration, system, strategy, waterfall, colors, objects, lifecycle, professional, quality, organization, implement, background, image, detail, software, structure, ideas. The prominent colors used in the PowerPoint template are Red, Gray, Black. Let your ideas explode on the scene. Trigger the fuse with our Business Organizational Chart Examples Mixed Process Flow Diagram 5 Stages Ppt PowerPoint Slides.
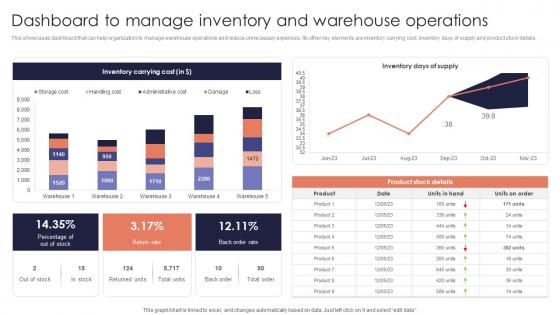
Dashboard Manage Inventory Minimizing Inventory Wastage Through Warehouse Microsoft Pdf
This showcases dashboard that can help organization to manage warehouse operations and reduce unnecessary expenses. Its other key elements are inventory carrying cost, inventory days of supply and product stock details. There are so many reasons you need a Dashboard Manage Inventory Minimizing Inventory Wastage Through Warehouse Microsoft Pdf. The first reason is you can not spend time making everything from scratch, Thus, Slidegeeks has made presentation templates for you too. You can easily download these templates from our website easily. This showcases dashboard that can help organization to manage warehouse operations and reduce unnecessary expenses. Its other key elements are inventory carrying cost, inventory days of supply and product stock details.
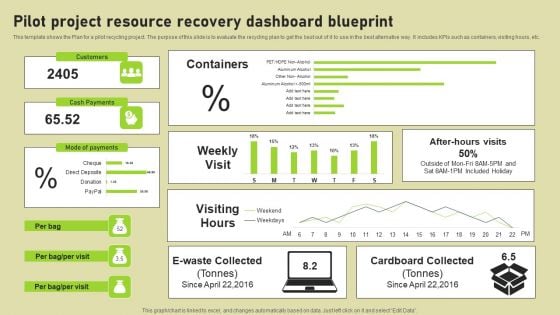
Pilot Project Resource Recovery Dashboard Blueprint Microsoft PDF
This template shows the Plan for a pilot recycling project. The purpose of this slide is to evaluate the recycling plan to get the best out of it to use in the best alternative way. It includes KPIs such as containers, visiting hours, etc. Showcasing this set of slides titled Pilot Project Resource Recovery Dashboard Blueprint Microsoft PDF. The topics addressed in these templates are Mode Of Payments, Cash Payments, Customers. All the content presented in this PPT design is completely editable. Download it and make adjustments in color, background, font etc. as per your unique business setting.
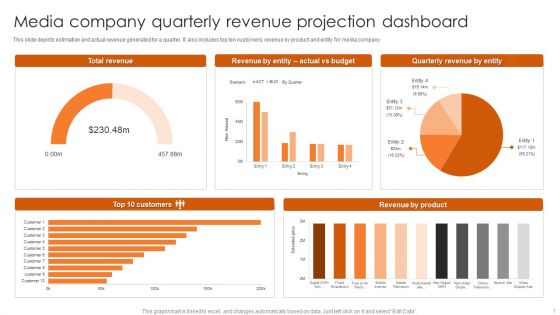
Media Company Quarterly Revenue Projection Dashboard Mockup PDF
This slide depicts estimation and actual revenue generated for a quarter. It also includes top ten customers, revenue by product and entity for media company. Pitch your topic with ease and precision using this Media Company Quarterly Revenue Projection Dashboard Mockup PDF. This layout presents information on Total Revenue, Quarterly Revenue Entity, Top 10 Customers. It is also available for immediate download and adjustment. So, changes can be made in the color, design, graphics or any other component to create a unique layout.
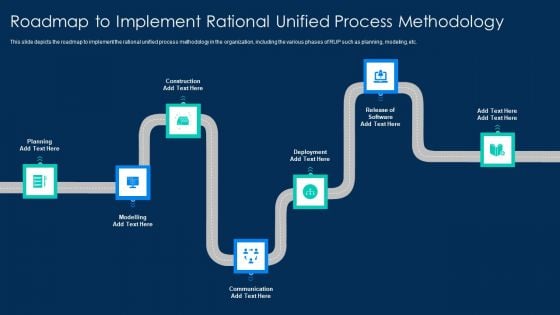
Roadmap To Implement Rational Unified Process Methodology Introduction PDF
This slide depicts the roadmap to implement the rational unified process methodology in the organization, including the various phases of RUP such as planning, modeling, etc.This is a Roadmap To Implement Rational Unified Process Methodology Introduction PDF template with various stages. Focus and dispense information on seven stages using this creative set, that comes with editable features. It contains large content boxes to add your information on topics like Release Of Software, Communication, Deployment You can also showcase facts, figures, and other relevant content using this PPT layout. Grab it now.

Road Passed Under The Bridge Ppt PowerPoint Presentation Inspiration Influencers
Presenting this set of slides with name road passed under the bridge ppt powerpoint presentation inspiration influencers. This is a three stage process. The stages in this process are infrastructure icon, infrastructure development, maintenance. This is a completely editable PowerPoint presentation and is available for immediate download. Download now and impress your audience.

 Home
Home