Data Analysis Icon
Business Strategy Formulation Complex Flow Process Diagram 10 Stages
We present our business strategy formulation complex flow process diagram 10 stages.Download and present our Communication PowerPoint Templates because You can Raise a toast with our PowerPoint Templates and Slides. Spread good cheer amongst your audience. Present our Business PowerPoint Templates because Our PowerPoint Templates and Slides are topically designed to provide an attractive backdrop to any subject. Present our Boxes PowerPoint Templates because It will let you Set new benchmarks with our PowerPoint Templates and Slides. They will keep your prospects well above par. Present our Arrows PowerPoint Templates because Our PowerPoint Templates and Slides ensures Effective communication. They help you put across your views with precision and clarity. Download and present our Shapes PowerPoint Templates because Our PowerPoint Templates and Slides offer you the widest possible range of options.Use these PowerPoint slides for presentations relating to Arrow, Banner, Boxes, Brochure, Business, Catalog, Chart, Circle, Communication, Company, Connection, Corporate, Data, Diagram, Different, Graph, Illustration, Information, Item, Junction, Management, Marketing, Menu, Modern, Multicolored, Navigation, Network, Note, Options, Parts, Pie, Plan, Presentation, Process, Report, Schematic, Segments, Sphere, Spherical, Statistics, Strategy, Structure, Tab, Template. The prominent colors used in the PowerPoint template are Blue, Gray, White. Our Business Strategy Formulation Complex Flow Process Diagram 10 Stages make excellent accessories. Your thoughts will don that designer look.
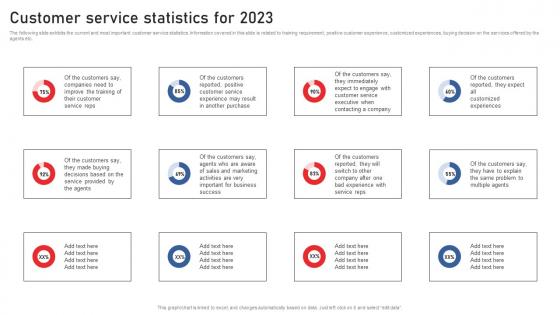
Customer Service Statistics For 2023 Using Red Ocean Strategies Professional Pdf
The following slide exhibits the current and most important customer service statistics. Information covered in this slide is related to training requirement, positive customer experience, customized experiences, buying decision on the services offered by the agents etc. Slidegeeks is here to make your presentations a breeze with Customer Service Statistics For 2023 Using Red Ocean Strategies Professional Pdf With our easy-to-use and customizable templates, you can focus on delivering your ideas rather than worrying about formatting. With a variety of designs to choose from, you are sure to find one that suits your needs. And with animations and unique photos, illustrations, and fonts, you can make your presentation pop. So whether you are giving a sales pitch or presenting to the board, make sure to check out Slidegeeks first The following slide exhibits the current and most important customer service statistics. Information covered in this slide is related to training requirement, positive customer experience, customized experiences, buying decision on the services offered by the agents etc.
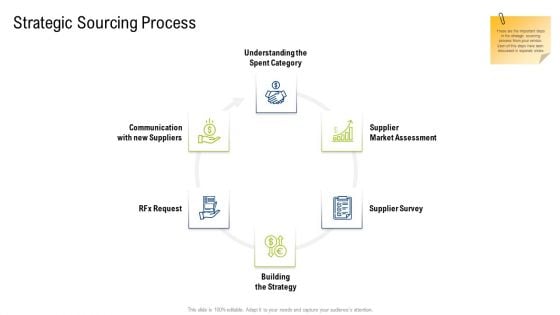
Multiple Phases For Supply Chain Management Strategic Sourcing Process Information PDF
This is a multiple phases for supply chain management strategic sourcing process information pdf template with various stages. Focus and dispense information on six stages using this creative set, that comes with editable features. It contains large content boxes to add your information on topics like communication with new suppliers, rfx request, supplier survey, supplier, market assessment, building the strategy. You can also showcase facts, figures, and other relevant content using this PPT layout. Grab it now.
Corporate Financial Performance Tracking Dashboard Diagrams PDF
This slide provides information regarding dashboard utilized by firm to monitor financial performance. The performance is tracked through revenues generated, vendors associated, profit generated, etc. If you are looking for a format to display your unique thoughts, then the professionally designed Corporate Financial Performance Tracking Dashboard Diagrams PDF is the one for you. You can use it as a Google Slides template or a PowerPoint template. Incorporate impressive visuals, symbols, images, and other charts. Modify or reorganize the text boxes as you desire. Experiment with shade schemes and font pairings. Alter, share or cooperate with other people on your work. Download Corporate Financial Performance Tracking Dashboard Diagrams PDF and find out how to give a successful presentation. Present a perfect display to your team and make your presentation unforgettable.

Getting Started With Hyperautomation Hyperautomation Software Solutions IT Inspiration PDF
This slide represents the steps to get started with hyper-automation, covering collecting information about business processes, tasks, and environments, deciding structured and unstructured data, selecting an automation platform, and so on.If you are looking for a format to display your unique thoughts, then the professionally designed Getting Started With Hyperautomation Hyperautomation Software Solutions IT Inspiration PDF is the one for you. You can use it as a Google Slides template or a PowerPoint template. Incorporate impressive visuals, symbols, images, and other charts. Modify or reorganize the text boxes as you desire. Experiment with shade schemes and font pairings. Alter, share or cooperate with other people on your work. Download Getting Started With Hyperautomation Hyperautomation Software Solutions IT Inspiration PDF and find out how to give a successful presentation. Present a perfect display to your team and make your presentation unforgettable.
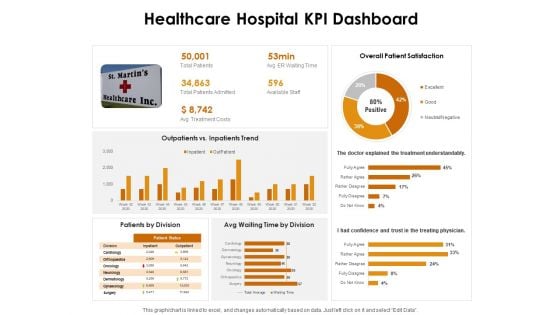
KPI Dashboards Per Industry Healthcare Hospital KPI Dashboard Ppt PowerPoint Presentation Show Infographics PDF
Deliver an awe-inspiring pitch with this creative kpi dashboards per industry healthcare hospital kpi dashboard ppt powerpoint presentation show infographics pdf bundle. Topics like overall patient satisfaction, outpatients vs. inpatients trend, doctor explained the treatment understandably can be discussed with this completely editable template. It is available for immediate download depending on the needs and requirements of the user.

Agile Approach In Information Technology Projects Problems Faced By The Company Sample PDF
This slide covers the problems that company is currently facing in agile project methodologies while using traditional software development methods like waterfall model, V model and Rational unified process.Are you searching for a Agile Approach In Information Technology Projects Problems Faced By The Company Sample PDF that is uncluttered, straightforward, and original Its easy to edit, and you can change the colors to suit your personal or business branding. For a presentation that expresses how much effort you have put in, this template is ideal With all of its features, including tables, diagrams, statistics, and lists, its perfect for a business plan presentation. Make your ideas more appealing with these professional slides. Download Agile Approach In Information Technology Projects Problems Faced By The Company Sample PDF from Slidegeeks today.
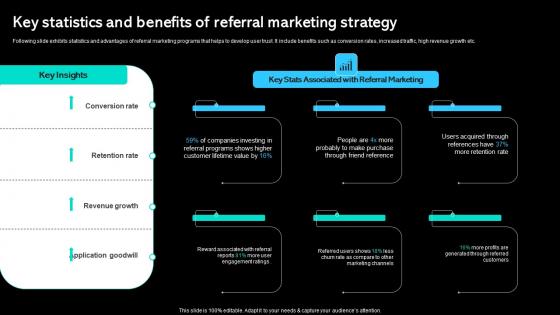
Key Statistics And Benefits Of Referral Marketing Strategy Paid Marketing Approach Rules Pdf
Following slide exhibits statistics and advantages of referral marketing programs that helps to develop user trust. It include benefits such as conversion rates, increased traffic, high revenue growth etc. Retrieve professionally designed Key Statistics And Benefits Of Referral Marketing Strategy Paid Marketing Approach Rules Pdf to effectively convey your message and captivate your listeners. Save time by selecting pre-made slideshows that are appropriate for various topics, from business to educational purposes. These themes come in many different styles, from creative to corporate, and all of them are easily adjustable and can be edited quickly. Access them as PowerPoint templates or as Google Slides themes. You do not have to go on a hunt for the perfect presentation because Slidegeeks got you covered from everywhere. Following slide exhibits statistics and advantages of referral marketing programs that helps to develop user trust. It include benefits such as conversion rates, increased traffic, high revenue growth etc.
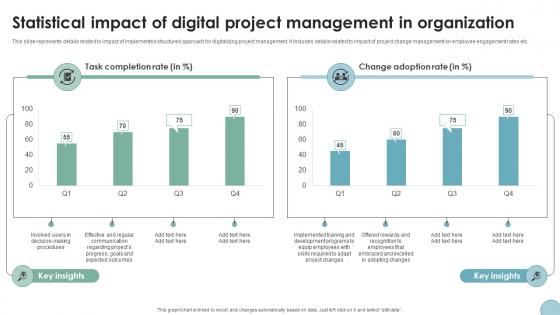
Statistical Impact Of Digital Project Management Digital Transformation In Project Management
This slide represents details related to impact of implemented structured approach for digitalizing project management. It includes details related to impact of project change management on employee engagement rates etc. Coming up with a presentation necessitates that the majority of the effort goes into the content and the message you intend to convey. The visuals of a PowerPoint presentation can only be effective if it supplements and supports the story that is being told. Keeping this in mind our experts created Statistical Impact Of Digital Project Management Digital Transformation In Project Management to reduce the time that goes into designing the presentation. This way, you can concentrate on the message while our designers take care of providing you with the right template for the situation. This slide represents details related to impact of implemented structured approach for digitalizing project management. It includes details related to impact of project change management on employee engagement rates etc.
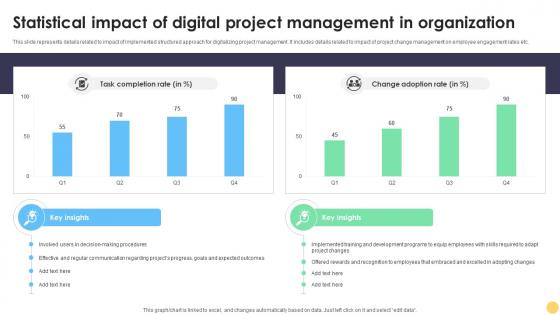
Digital Project Management Strategies Statistical Impact Of Digital Project Management Strategies
This slide represents details related to impact of implemented structured approach for digitalizing project management. It includes details related to impact of project change management on employee engagement rates etc. Boost your pitch with our creative Digital Project Management Strategies Statistical Impact Of Digital Project Management Strategies. Deliver an awe-inspiring pitch that will mesmerize everyone. Using these presentation templates you will surely catch everyones attention. You can browse the ppts collection on our website. We have researchers who are experts at creating the right content for the templates. So you do not have to invest time in any additional work. Just grab the template now and use them. This slide represents details related to impact of implemented structured approach for digitalizing project management. It includes details related to impact of project change management on employee engagement rates etc.
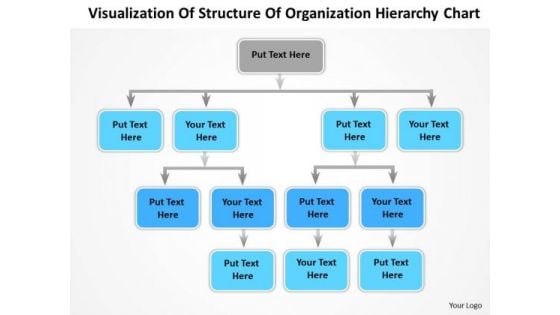
Structure Organization Hierarchy Chart Ppt Standard Business Plan PowerPoint Templates
We present our structure organization hierarchy chart ppt standard business plan PowerPoint templates.Download and present our Business PowerPoint Templates because You are well armed with penetrative ideas. Our PowerPoint Templates and Slides will provide the gunpowder you need. Download and present our Marketing PowerPoint Templates because You are working at that stage with an air of royalty. Let our PowerPoint Templates and Slides be the jewels in your crown. Download and present our Flow Charts PowerPoint Templates because It will mark the footprints of your journey. Illustrate how they will lead you to your desired destination. Use our Shapes PowerPoint Templates because Our PowerPoint Templates and Slides ensures Effective communication. They help you put across your views with precision and clarity. Use our Process and Flows PowerPoint Templates because Our PowerPoint Templates and Slides will help you be quick off the draw. Just enter your specific text and see your points hit home.Use these PowerPoint slides for presentations relating to 3d, chart, flow, organization, rectangle, layout, corporate, business, plan, concept, arrow, hierarchy, teamwork, diagram, graphical, data, site-builder, process, visualize, flowchart, supervisor, graph, box, steps, glassy, connection, workgroups, group, organize, office, financial, structure. The prominent colors used in the PowerPoint template are Blue, White, Gray. Retrieve your thoughts with our Structure Organization Hierarchy Chart Ppt Standard Business Plan PowerPoint Templates. Download without worries with our money back guaranteee.
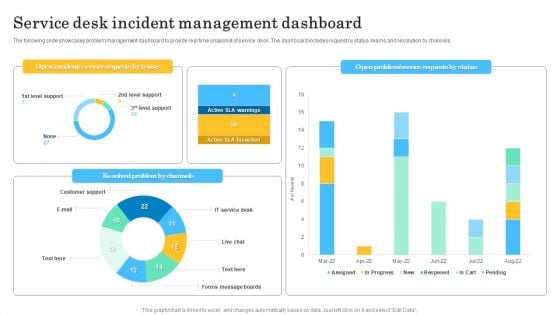
Service Desk Incident Management Dashboard Summary PDF
The following slide showcases problem management dashboard to provide real time snapshot of service desk. The dashboard includes request by status, teams and resolution by channels. Showcasing this set of slides titled Service Desk Incident Management Dashboard Summary PDF. The topics addressed in these templates are Open Incidents Service, Requests By Teams. All the content presented in this PPT design is completely editable. Download it and make adjustments in color, background, font etc. as per your unique business setting.
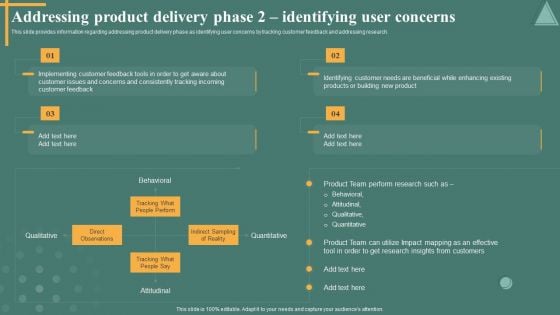
Managing Product Discovery Process And Techniques Addressing Product Delivery Phase 2 Identifying User Concerns Themes PDF
This slide provides information regarding addressing product delivery phase as identifying user concerns by tracking customer feedback and addressing research. There are so many reasons you need a Managing Product Discovery Process And Techniques Addressing Product Delivery Phase 2 Identifying User Concerns Themes PDF. The first reason is you can not spend time making everything from scratch, Thus, Slidegeeks has made presentation templates for you too. You can easily download these templates from our website easily.
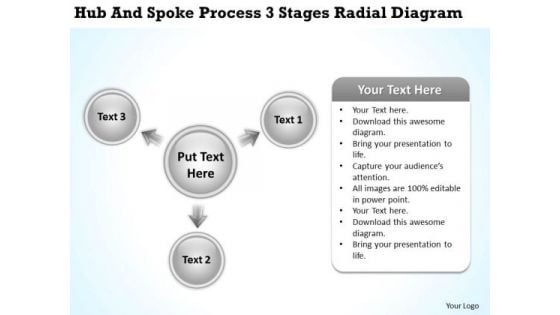
Business Analyst Diagrams Radial PowerPoint Templates Backgrounds For Slides
We present our business analyst diagrams radial PowerPoint templates backgrounds for slides.Present our Arrow PowerPoint Templates because Our PowerPoint Templates and Slides offer you the widest possible range of options. Download and present our Radial Charts PowerPoint Templates because Our PowerPoint Templates and Slides are Clear and concise. Use them and dispel any doubts your team may have. Download our Flow Charts PowerPoint Templates because These PowerPoint Templates and Slides will give the updraft to your ideas. See them soar to great heights with ease. Present our Business PowerPoint Templates because It will Strengthen your hand with your thoughts. They have all the aces you need to win the day. Present our Process and Flows PowerPoint Templates because Our PowerPoint Templates and Slides will steer your racing mind. Hit the right buttons and spur on your audience.Use these PowerPoint slides for presentations relating to Arrow, box, business, chart, circle, color, concept, connect, connection, connectivity, corporate, data, design, diagram, financial, flow, flowchart, glassy, glossy, graph, graphical, group, illustration, organize, plan, process, set, steps, teamwork, vector. The prominent colors used in the PowerPoint template are White, Gray, Black. Integrate teams with our Business Analyst Diagrams Radial PowerPoint Templates Backgrounds For Slides. Download without worries with our money back guaranteee.
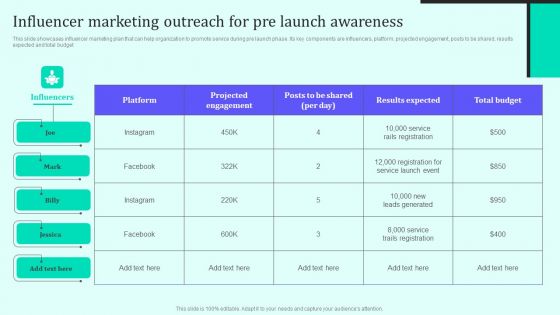
Influencer Marketing Outreach For Pre Launch Awareness Brochure PDF
This slide showcases influencer marketing plan that can help organization to promote service during pre launch phase. Its key components are influencers, platform, projected engagement, posts to be shared, results expected and total budget. The Influencer Marketing Outreach For Pre Launch Awareness Brochure PDF is a compilation of the most recent design trends as a series of slides. It is suitable for any subject or industry presentation, containing attractive visuals and photo spots for businesses to clearly express their messages. This template contains a variety of slides for the user to input data, such as structures to contrast two elements, bullet points, and slides for written information. Slidegeeks is prepared to create an impression.
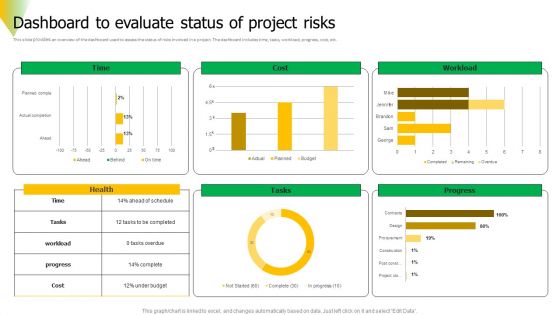
Risk Assessment Dashboard To Evaluate Status Of Project Risks Diagrams PDF
This slide provides an overview of the dashboard used to assess the status of risks involved in a project. The dashboard includes time, tasks, workload, progress, cost, etc. Get a simple yet stunning designed Risk Assessment Dashboard To Evaluate Status Of Project Risks Diagrams PDF. It is the best one to establish the tone in your meetings. It is an excellent way to make your presentations highly effective. So, download this PPT today from Slidegeeks and see the positive impacts. Our easy to edit Risk Assessment Dashboard To Evaluate Status Of Project Risks Diagrams PDF can be your go to option for all upcoming conferences and meetings. So, what are you waiting for Grab this template today.
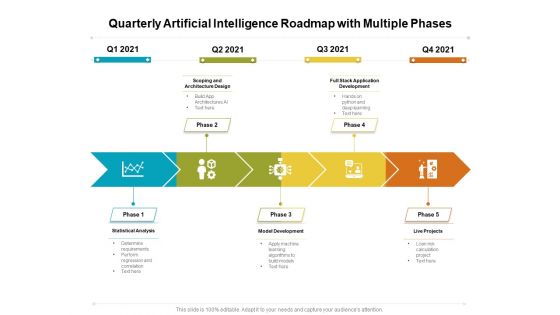
Quarterly Artificial Intelligence Roadmap With Multiple Phases Portrait
Presenting our jaw dropping quarterly artificial intelligence roadmap with multiple phases portrait. You can alternate the color, font size, font type, and shapes of this PPT layout according to your strategic process. This PPT presentation is compatible with Google Slides and is available in both standard screen and widescreen aspect ratios. You can also download this well researched PowerPoint template design in different formats like PDF, JPG, and PNG. So utilize this visually appealing design by clicking the download button given below.
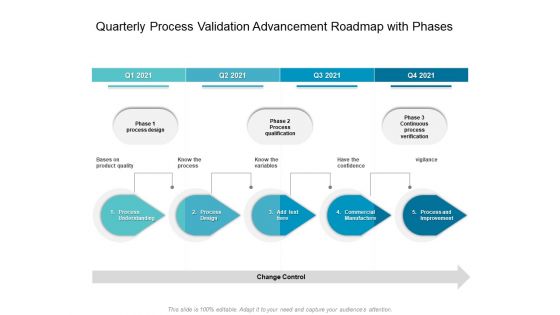
Quarterly Process Validation Advancement Roadmap With Phases Mockup
Introducing our quarterly process validation advancement roadmap with phases mockup. This PPT presentation is Google Slides compatible, therefore, you can share it easily with the collaborators for measuring the progress. Also, the presentation is available in both standard screen and widescreen aspect ratios. So edit the template design by modifying the font size, font type, color, and shapes as per your requirements. As this PPT design is fully editable it can be presented in PDF, JPG and PNG formats.
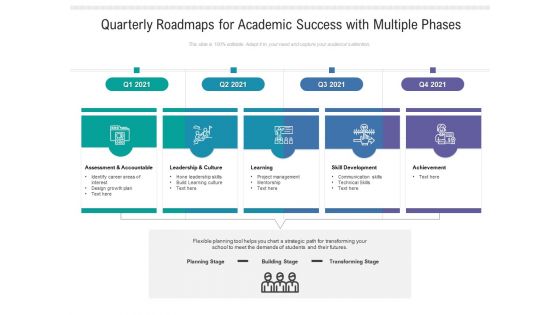
Quarterly Roadmaps For Academic Success With Multiple Phases Inspiration
Presenting our jaw dropping quarterly roadmaps for academic success with multiple phases inspiration. You can alternate the color, font size, font type, and shapes of this PPT layout according to your strategic process. This PPT presentation is compatible with Google Slides and is available in both standard screen and widescreen aspect ratios. You can also download this well researched PowerPoint template design in different formats like PDF, JPG, and PNG. So utilize this visually appealing design by clicking the download button given below.
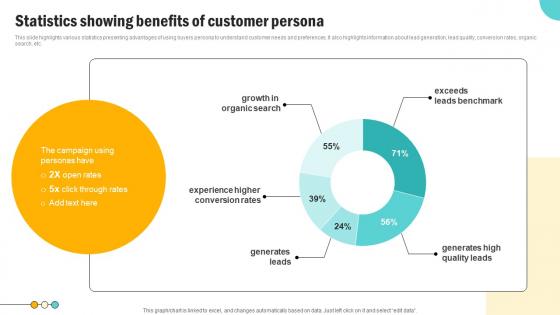
Statistics Showing Benefits Of Consumer Persona Development Strategy Pictures Pdf
This slide highlights various statistics presenting advantages of using buyers persona to understand customer needs and preferences. It also highlights information about lead generation, lead quality, conversion rates, organic search, etc. If your project calls for a presentation, then Slidegeeks is your go to partner because we have professionally designed, easy to edit templates that are perfect for any presentation. After downloading, you can easily edit Statistics Showing Benefits Of Consumer Persona Development Strategy Pictures Pdf and make the changes accordingly. You can rearrange slides or fill them with different images. Check out all the handy templates This slide highlights various statistics presenting advantages of using buyers persona to understand customer needs and preferences. It also highlights information about lead generation, lead quality, conversion rates, organic search, etc.

Introduction To Mobile SEM KPI Metrics Dashboard To Monitor Mobile SEO Performance Diagrams PDF
The purpose of this slide is to outline key performance indicator KPI dashboard which will assist the marketer to analyze mobile search engine optimization SEO performance. The key metrics mentioned in the slide are total sessions, search engine rankings etc. Take your projects to the next level with our ultimate collection of Introduction To Mobile SEM KPI Metrics Dashboard To Monitor Mobile SEO Performance Diagrams PDF. Slidegeeks has designed a range of layouts that are perfect for representing task or activity duration, keeping track of all your deadlines at a glance. Tailor these designs to your exact needs and give them a truly corporate look with your own brand colors they will make your projects stand out from the rest.
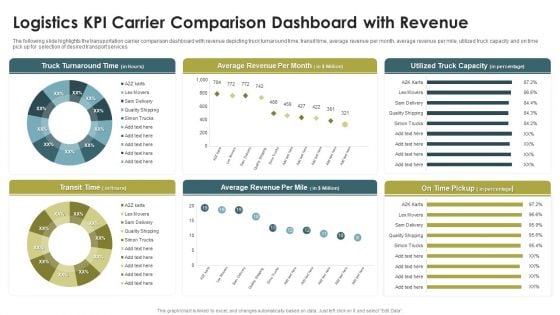
Logistics KPI Carrier Comparison Dashboard With Revenue Ppt Infographics Portfolio PDF
The following slide highlights the transportation carrier comparison dashboard with revenue depicting truck turnaround time, transit time, average revenue per month, average revenue per mile, utilized truck capacity and on time pick up for selection of desired transport services. Pitch your topic with ease and precision using this Logistics KPI Carrier Comparison Dashboard With Revenue Ppt Infographics Portfolio PDF. This layout presents information on Truck Turnaround Time, Average Revenue, Per Month, Transit Time. It is also available for immediate download and adjustment. So, changes can be made in the color, design, graphics or any other component to create a unique layout.
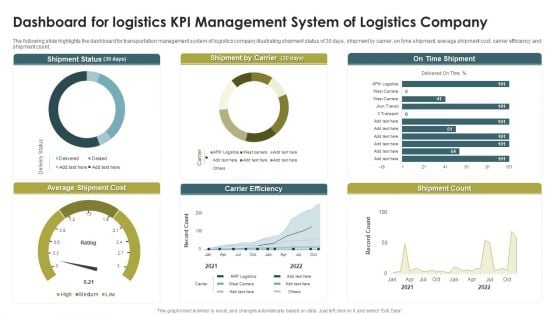
Dashboard For Logistics KPI Management System Of Logistics Company Infographics PDF
The following slide highlights the dashboard for transportation management system of logistics company illustrating shipment status of 30 days, shipment by carrier, on time shipment, average shipment cost, carrier efficiency and shipment count. Pitch your topic with ease and precision using this Dashboard For Logistics KPI Management System Of Logistics Company Infographics PDF. This layout presents information on Shipment Status, Shipment By Carrier, On Time Shipment. It is also available for immediate download and adjustment. So, changes can be made in the color, design, graphics or any other component to create a unique layout.
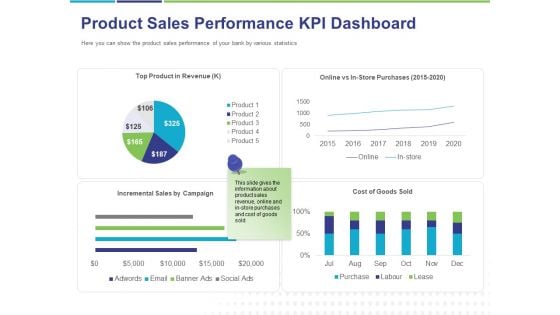
Commodity Up Selling Product Sales Performance KPI Dashboard Ppt Infographic Template Background PDF
Presenting this set of slides with name commodity up selling product sales performance kpi dashboard ppt infographic template background pdf. The topics discussed in these slides are incremental sales by campaign, cost of goods sold, top product in revenue, online vs in store purchases. This is a completely editable PowerPoint presentation and is available for immediate download. Download now and impress your audience.
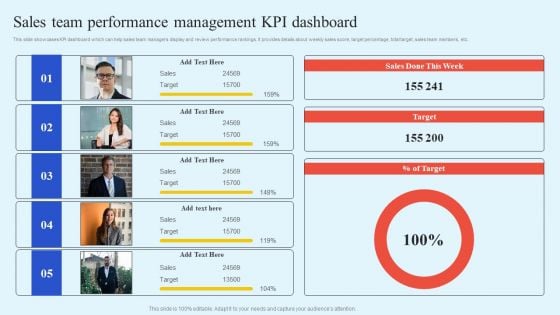
How Leaders Can Improve Team Effectiveness Sales Team Performance Management KPI Dashboard Infographics PDF
This slide showcases KPI dashboard which can help sales team managers display and review performance rankings. It provides details about weekly sales score, target percentage, total target, sales team members, etc. Unleash your creativity with our How Leaders Can Improve Team Effectiveness Sales Team Performance Management KPI Dashboard Infographics PDF single-slide PPT template. Whether you are a seasoned presenter or a newbie, our editable and visually-stunning template will make your presentations shine. This template is versatile and easy to use. Make your presentations unforgettable with our premium template and leave a lasting impression on your audience.
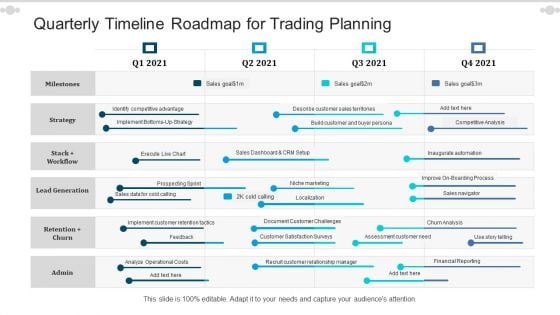
Quarterly Timeline Roadmap For Trading Planning Background
We present our quarterly timeline roadmap for trading planning background. This PowerPoint layout is easy to edit so you can change the font size, font type, color, and shape conveniently. In addition to this, the PowerPoint layout is Google Slides compatible, so you can share it with your audience and give them access to edit it. Therefore, download and save this well researched quarterly timeline roadmap for trading planning background in different formats like PDF, PNG, and JPG to smoothly execute your business plan.
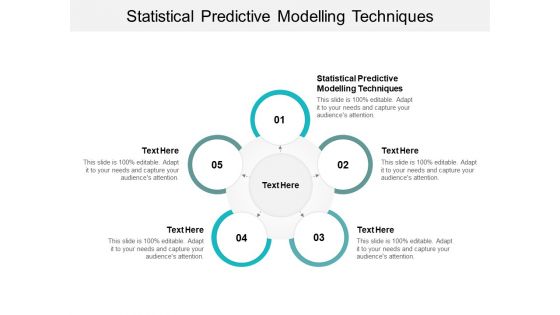
Statistical Predictive Modelling Techniques Ppt PowerPoint Presentation Gallery Themes Cpb
Presenting this set of slides with name statistical predictive modelling techniques ppt powerpoint presentation gallery themes cpb. This is an editable Powerpoint five stages graphic that deals with topics like statistical predictive modelling techniques to help convey your message better graphically. This product is a premium product available for immediate download and is 100 percent editable in Powerpoint. Download this now and use it in your presentations to impress your audience.
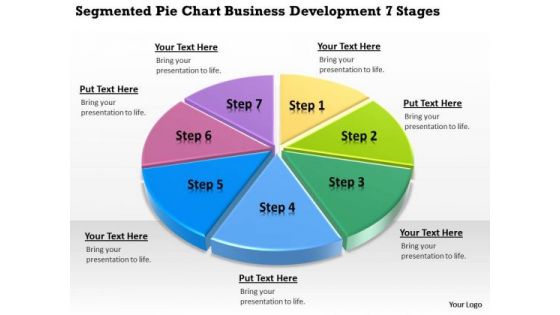
Development 7 Stages How To Write Business Plan For Small PowerPoint Templates
We present our development 7 stages how to write business plan for small PowerPoint templates.Download and present our Communication PowerPoint Templates because It will mark the footprints of your journey. Illustrate how they will lead you to your desired destination. Present our Marketing PowerPoint Templates because You are an avid believer in ethical practices. Highlight the benefits that accrue with our PowerPoint Templates and Slides. Use our Circle Charts PowerPoint Templates because You can Zap them with our PowerPoint Templates and Slides. See them reel under the impact. Present our Business PowerPoint Templates because Our PowerPoint Templates and Slides are conceived by a dedicated team. Use them and give form to your wondrous ideas. Download and present our Arrows PowerPoint Templates because Our PowerPoint Templates and Slides will Embellish your thoughts. They will help you illustrate the brilliance of your ideas.Use these PowerPoint slides for presentations relating to Charts, marketing, isolated, statistics, sales, realistic looking, nobody, pie chart, cut out, achievement, business, concept, presentation, symbol, diagram, finance, data, report, accounting, people, growth, copy space, accounts, investment, no person, office, banking, graphs, communication. The prominent colors used in the PowerPoint template are Green, Yellow, Purple. The audience will erupt in applause. Touch their hearts with our Development 7 Stages How To Write Business Plan For Small PowerPoint Templates.
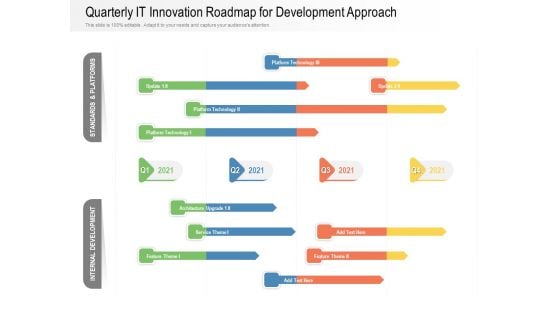
Quarterly IT Innovation Roadmap For Development Approach Inspiration
Presenting our innovatively structured quarterly it innovation roadmap for development approach inspiration Template. Showcase your roadmap process in different formats like PDF, PNG, and JPG by clicking the download button below. This PPT design is available in both Standard Screen and Widescreen aspect ratios. It can also be easily personalized and presented with modified font size, font type, color, and shapes to measure your progress in a clear way.
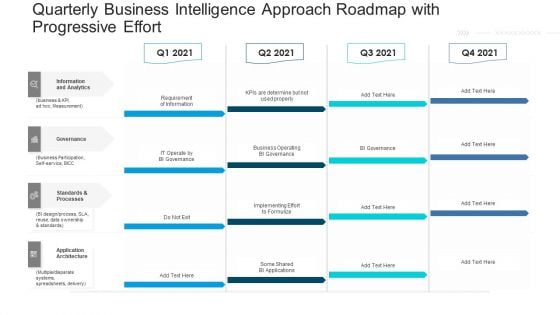
Quarterly Business Intelligence Approach Roadmap With Progressive Effort Portrait
Presenting our jaw dropping quarterly business intelligence approach roadmap with progressive effort portrait. You can alternate the color, font size, font type, and shapes of this PPT layout according to your strategic process. This PPT presentation is compatible with Google Slides and is available in both standard screen and widescreen aspect ratios. You can also download this well researched PowerPoint template design in different formats like PDF, JPG, and PNG. So utilize this visually appealing design by clicking the download button given below.
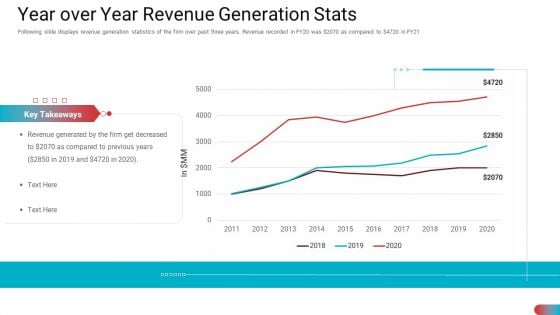
Benchmarking Vendor Operation Control Procedure Year Over Year Revenue Generation Stats Designs PDF
Following slide displays revenue generation statistics of the firm over past three years. Revenue recorded in FY20 was 2070 as compared to 4720 in FY21. Deliver an awe-inspiring pitch with this creative benchmarking vendor operation control procedure inventory turnover tracking dashboard pictures pdf. bundle. Topics like year over year revenue generation stats can be discussed with this completely editable template. It is available for immediate download depending on the needs and requirements of the user.
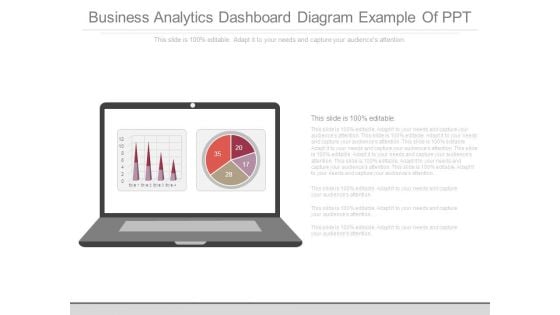
Business Analytics Dashboard Diagram Example Of Ppt
This is a business analytics dashboard diagram example of ppt. This is a one stage process. The stages in this process are business, management, strategy, pie, presentation.
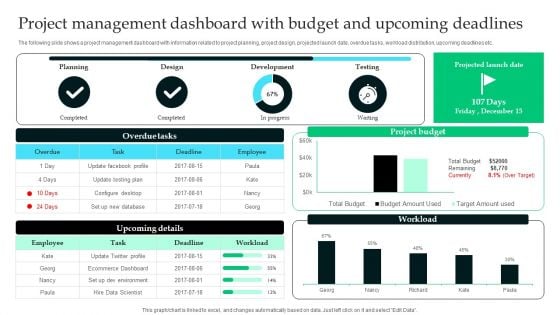
Analyzing The Economic Project Management Dashboard With Budget And Upcoming Graphics PDF
The following slide shows a project management dashboard with information related to project planning, project design, projected launch date, overdue tasks, workload distribution, upcoming deadlines etc. If you are looking for a format to display your unique thoughts, then the professionally designed Analyzing The Economic Project Management Dashboard With Budget And Upcoming Graphics PDF is the one for you. You can use it as a Google Slides template or a PowerPoint template. Incorporate impressive visuals, symbols, images, and other charts. Modify or reorganize the text boxes as you desire. Experiment with shade schemes and font pairings. Alter, share or cooperate with other people on your work. Download Analyzing The Economic Project Management Dashboard With Budget And Upcoming Graphics PDF and find out how to give a successful presentation. Present a perfect display to your team and make your presentation unforgettable.
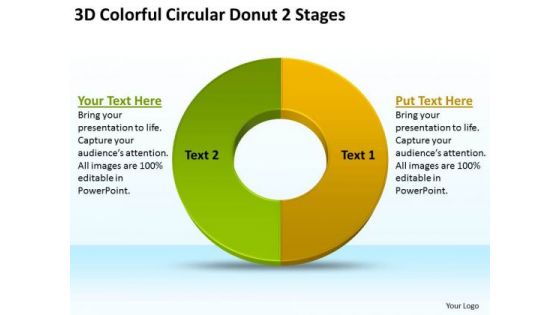
3d Colorful Circular Donut 2 Stages Buy Business Plan PowerPoint Templates
We present our 3d colorful circular donut 2 stages buy business plan PowerPoint templates.Download our Ring Charts PowerPoint Templates because Our PowerPoint Templates and Slides are a sure bet. Gauranteed to win against all odds. Present our Process and Flows PowerPoint Templates because Our PowerPoint Templates and Slides are innately eco-friendly. Their high recall value negate the need for paper handouts. Present our Marketing PowerPoint Templates because You should Kick up a storm with our PowerPoint Templates and Slides. The heads of your listeners will swirl with your ideas. Download our Flow Charts PowerPoint Templates because Our PowerPoint Templates and Slides will bullet point your ideas. See them fall into place one by one. Download our Business PowerPoint Templates because Our PowerPoint Templates and Slides are endowed to endure. Ideas conveyed through them will pass the test of time.Use these PowerPoint slides for presentations relating to Abstract, background, bar, bright, business, button, chart, circle, clean, colorful, company, data, demographics, design, diagram, document, economy, environment,finance, financial, glossy, graph, graphic, growth, illustration, info, infographic, information, management, market, marketing, minimal, modern, network, people,percent, pie, presentation, report, shape, sign, statistic, web. The prominent colors used in the PowerPoint template are Green lime, Yellow, Black. Our 3d Colorful Circular Donut 2 Stages Buy Business Plan PowerPoint Templates are committed to benefit you. They ensure your thoughts get the credit.
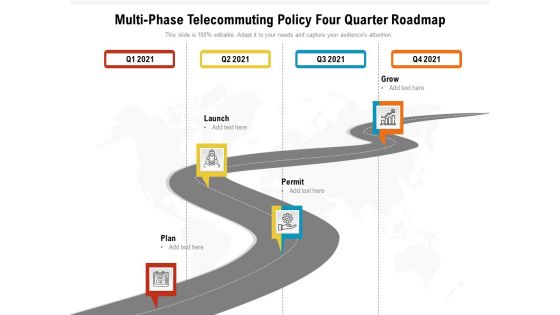
Multi Phase Telecommuting Policy Four Quarter Roadmap Introduction
Presenting the multi phase telecommuting policy four quarter roadmap introduction. The template includes a roadmap that can be used to initiate a strategic plan. Not only this, the PowerPoint slideshow is completely editable and you can effortlessly modify the font size, font type, and shapes according to your needs. This PPT slide can be easily reached in standard screen and widescreen aspect ratios. The set is also available in various formats like PDF, PNG, and JPG. So download and use it multiple times as per your knowledge.
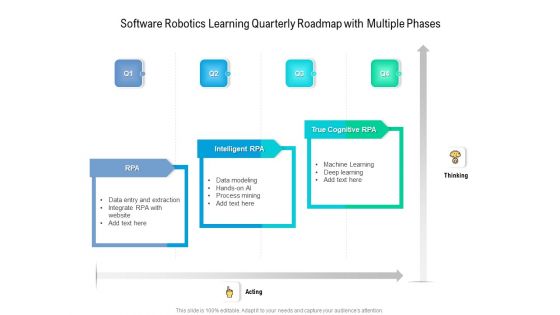
Software Robotics Learning Quarterly Roadmap With Multiple Phases Pictures
Presenting the software robotics learning quarterly roadmap with multiple phases pictures. The template includes a roadmap that can be used to initiate a strategic plan. Not only this, the PowerPoint slideshow is completely editable and you can effortlessly modify the font size, font type, and shapes according to your needs. This PPT slide can be easily reached in standard screen and widescreen aspect ratios. The set is also available in various formats like PDF, PNG, and JPG. So download and use it multiple times as per your knowledge.
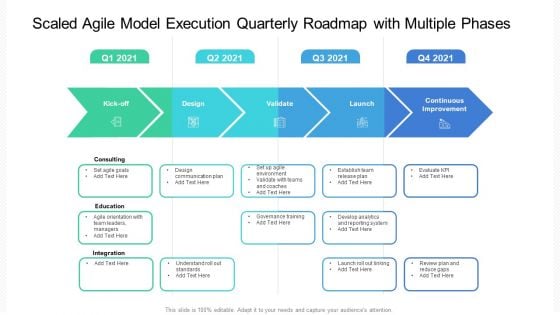
Scaled Agile Model Execution Quarterly Roadmap With Multiple Phases Formats
Presenting the scaled agile model execution quarterly roadmap with multiple phases formats. The template includes a roadmap that can be used to initiate a strategic plan. Not only this, the PowerPoint slideshow is completely editable and you can effortlessly modify the font size, font type, and shapes according to your needs. This PPT slide can be easily reached in standard screen and widescreen aspect ratios. The set is also available in various formats like PDF, PNG, and JPG. So download and use it multiple times as per your knowledge.
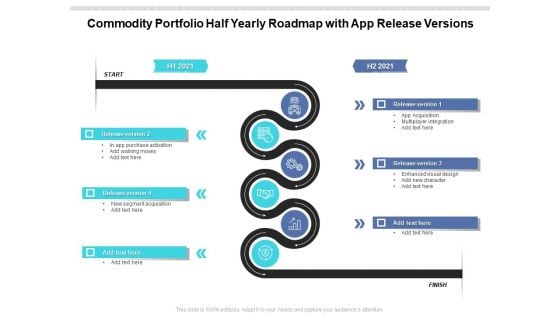
Commodity Portfolio Half Yearly Roadmap With App Release Versions Portrait
We present our commodity portfolio half yearly roadmap with app release versions portrait. This PowerPoint layout is easy-to-edit so you can change the font size, font type, color, and shape conveniently. In addition to this, the PowerPoint layout is Google Slides compatible, so you can share it with your audience and give them access to edit it. Therefore, download and save this well-researched commodity portfolio half yearly roadmap with app release versions portrait in different formats like PDF, PNG, and JPG to smoothly execute your business plan.
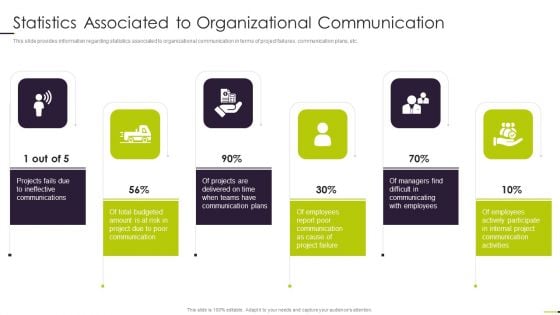
Managing Project Communication Statistics Associated To Organizational Communication Themes PDF
This slide provides information regarding statistics associated to organizational communication in terms of project failures, communication plans, etc. Presenting Managing Project Communication Statistics Associated To Organizational Communication Themes PDF to provide visual cues and insights. Share and navigate important information on six stages that need your due attention. This template can be used to pitch topics like Communication Plans, Internal Project, Organizational Communication. In addtion, this PPT design contains high resolution images, graphics, etc, that are easily editable and available for immediate download.
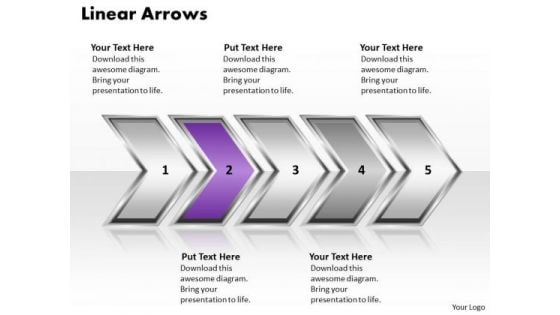
Ppt Linear Demonstration Of Arrows Diagram PowerPoint Slide Text Templates
PPT linear demonstration of arrows diagram powerpoint slide text Templates-This disarm can be used to organize information so that it can be accessed more easily. Pin-point the manner and processes for your team to follow an order. Step by step develop the entire picture and project it onto their minds-PPT linear demonstration of arrows diagram powerpoint slide text Templates-Aim, Arrow, Arrowheads, Badge, Border, Click, Connection, Curve, Design, Direction, Download, Element, Fuchsia, Icon, Illustration, Indicator, Internet, Magenta, Mark, Object, Orientation, Pointer, Shadow, Shape, Sign Search everywhere but find it here. Our Ppt Linear Demonstration Of Arrows Diagram PowerPoint Slide Text Templates catalogue will have it right there.
Product Information Management Ppt Diagrams
This is a product information management ppt diagrams. This is a one stage process. The stages in this process are management, success, strategy, marketing, business.
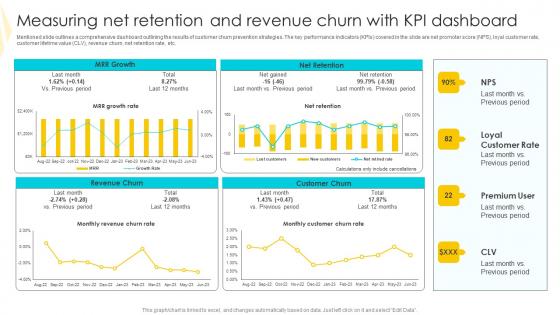
Measuring Net Retention And Strategies To Mitigate Customer Churn Elements Pdf
Mentioned slide outlines a comprehensive dashboard outlining the results of customer churn prevention strategies. The key performance indicators KPIs covered in the slide are net promoter score NPS, loyal customer rate, customer lifetime value CLV, revenue churn, net retention rate, etc. The Measuring Net Retention And Strategies To Mitigate Customer Churn Elements Pdf is a compilation of the most recent design trends as a series of slides. It is suitable for any subject or industry presentation, containing attractive visuals and photo spots for businesses to clearly express their messages. This template contains a variety of slides for the user to input data, such as structures to contrast two elements, bullet points, and slides for written information. Slidegeeks is prepared to create an impression. Mentioned slide outlines a comprehensive dashboard outlining the results of customer churn prevention strategies. The key performance indicators KPIs covered in the slide are net promoter score NPS, loyal customer rate, customer lifetime value CLV, revenue churn, net retention rate, etc.
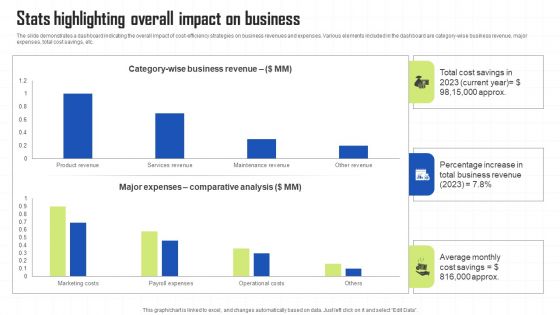
Key Techniques To Enhance Cost Efficiency Stats Highlighting Overall Impact On Business Background PDF
The slide demonstrates a dashboard indicating the overall impact of cost efficiency strategies on business revenues and expenses. Various elements included in the dashboard are category wise business revenue, major expenses, total cost savings, etc. Find a pre designed and impeccable Key Techniques To Enhance Cost Efficiency Stats Highlighting Overall Impact On Business Background PDF. The templates can ace your presentation without additional effort. You can download these easy to edit presentation templates to make your presentation stand out from others. So, what are you waiting for Download the template from Slidegeeks today and give a unique touch to your presentation.
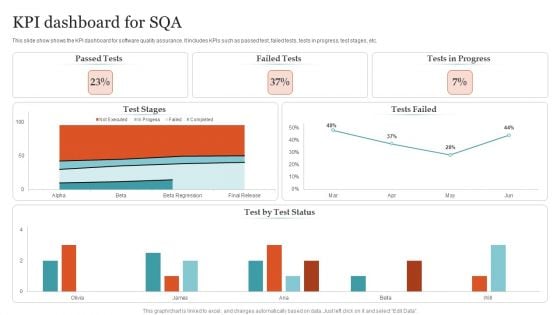
KPI Dashboard For SQA Ppt PowerPoint Presentation Gallery Structure PDF
This slide show shows the KPI dashboard for software quality assurance. It includes KPIs such as passed test, failed tests, tests in progress, test stages, etc. Pitch your topic with ease and precision using this KPI Dashboard For SQA Ppt PowerPoint Presentation Gallery Structure PDF. This layout presents information on Passed Tests, Failed Tests, Tests Progress . It is also available for immediate download and adjustment. So, changes can be made in the color, design, graphics or any other component to create a unique layout.
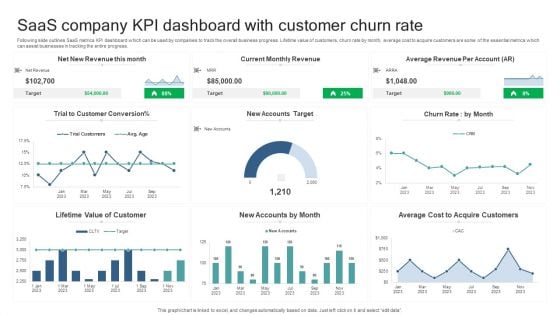
Saas Company KPI Dashboard With Customer Churn Rate Microsoft PDF
Following slide outlines SaaS metrics KPI dashboard which can be used by companies to track the overall business progress. Lifetime value of customers, churn rate by month, average cost to acquire customers are some of the essential metrics which can assist businesses in tracking the entire progress. Pitch your topic with ease and precision using this Saas Company KPI Dashboard With Customer Churn Rate Microsoft PDF. This layout presents information on Lifetime Value Of Customer, New Accounts By Month, Average Cost Acquire Customers. It is also available for immediate download and adjustment. So, changes can be made in the color, design, graphics or any other component to create a unique layout.
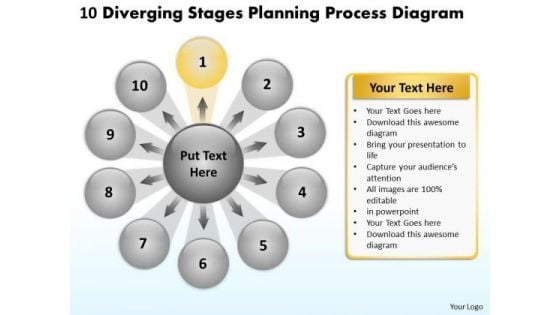
10 Diverging Stages Planning Process Diagram Radial Chart PowerPoint Templates
We present our 10 diverging stages planning process diagram Radial Chart PowerPoint templates.Present our Arrows PowerPoint Templates because you can Show them how to churn out fresh ideas. Present our Flow charts PowerPoint Templates because you can see In any endeavour people matter most. Download our Business PowerPoint Templates because this template helps you to grab the attention of your listeners. Use our Process and Flows PowerPoint Templates because you can enlighten your skills with the help of our topical templates. Download and present our Circle charts PowerPoint Templates because you have the plans ready for them to absorb and understand.Use these PowerPoint slides for presentations relating to Business, chart, circle, colors, concept, corporate, cycle, data, design, detail, development, diagram, engineering, graphic, ideas, illustration, image, implement, implementation, life, lifecycle, management, model, objects, organization, plan, process, product, professional, project, quality, schema, shape, stack, stage, steps, strategy, structure, success, symbol. The prominent colors used in the PowerPoint template are Purple, Black, Gray. You can be sure our 10 diverging stages planning process diagram Radial Chart PowerPoint templates are Efficacious. Presenters tell us our corporate PowerPoint templates and PPT Slides are Dazzling. We assure you our 10 diverging stages planning process diagram Radial Chart PowerPoint templates help you meet deadlines which are an element of today's workplace. Just browse and pick the slides that appeal to your intuitive senses. Customers tell us our circle PowerPoint templates and PPT Slides are Nifty. Presenters tell us our 10 diverging stages planning process diagram Radial Chart PowerPoint templates are Beautiful. You can be sure our corporate PowerPoint templates and PPT Slides are Attractive. Conduct meetings with our 10 Diverging Stages Planning Process Diagram Radial Chart PowerPoint Templates. Download without worries with our money back guaranteee.
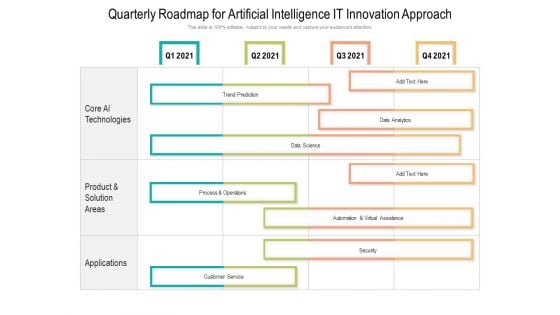
Quarterly Roadmap For Artificial Intelligence IT Innovation Approach Introduction
Presenting the quarterly roadmap for artificial intelligence it innovation approach introduction. The template includes a roadmap that can be used to initiate a strategic plan. Not only this, the PowerPoint slideshow is completely editable and you can effortlessly modify the font size, font type, and shapes according to your needs. This PPT slide can be easily reached in standard screen and widescreen aspect ratios. The set is also available in various formats like PDF, PNG, and JPG. So download and use it multiple times as per your knowledge.
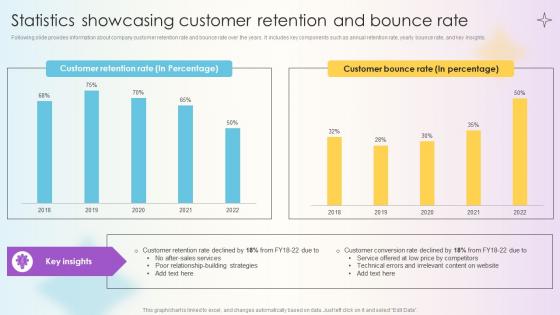
Managing Technical And Non Technical Statistics Showcasing Customer Retention
Following slide provides information about company customer retention rate and bounce rate over the years. It includes key components such as annual retention rate, yearly bounce rate, and key insights. If your project calls for a presentation, then Slidegeeks is your go-to partner because we have professionally designed, easy-to-edit templates that are perfect for any presentation. After downloading, you can easily edit Managing Technical And Non Technical Statistics Showcasing Customer Retention and make the changes accordingly. You can rearrange slides or fill them with different images. Check out all the handy templates Following slide provides information about company customer retention rate and bounce rate over the years. It includes key components such as annual retention rate, yearly bounce rate, and key insights.
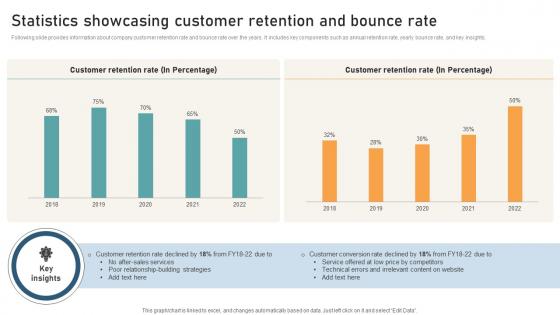
Comprehensive Guide For Website Statistics Showcasing Customer Retention And Bounce
Following slide provides information about company customer retention rate and bounce rate over the years. It includes key components such as annual retention rate, yearly bounce rate, and key insights. If your project calls for a presentation, then Slidegeeks is your go-to partner because we have professionally designed, easy-to-edit templates that are perfect for any presentation. After downloading, you can easily edit Comprehensive Guide For Website Statistics Showcasing Customer Retention And Bounce and make the changes accordingly. You can rearrange slides or fill them with different images. Check out all the handy templates Following slide provides information about company customer retention rate and bounce rate over the years. It includes key components such as annual retention rate, yearly bounce rate, and key insights.
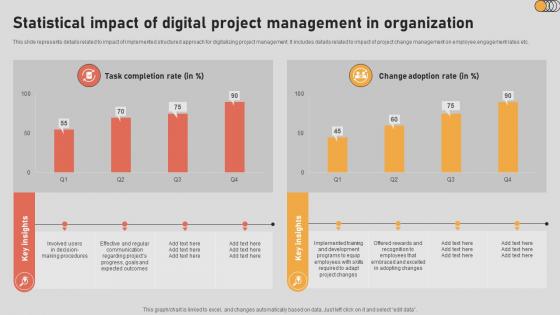
The Digital Project Managers Statistical Impact Of Digital Project Management In Organization
This slide represents details related to impact of implemented structured approach for digitalizing project management. It includes details related to impact of project change management on employee engagement rates etc. Do you have to make sure that everyone on your team knows about any specific topic I yes, then you should give The Digital Project Managers Statistical Impact Of Digital Project Management In Organization a try. Our experts have put a lot of knowledge and effort into creating this impeccable The Digital Project Managers Statistical Impact Of Digital Project Management In Organization. You can use this template for your upcoming presentations, as the slides are perfect to represent even the tiniest detail. You can download these templates from the Slidegeeks website and these are easy to edit. So grab these today This slide represents details related to impact of implemented structured approach for digitalizing project management. It includes details related to impact of project change management on employee engagement rates etc.
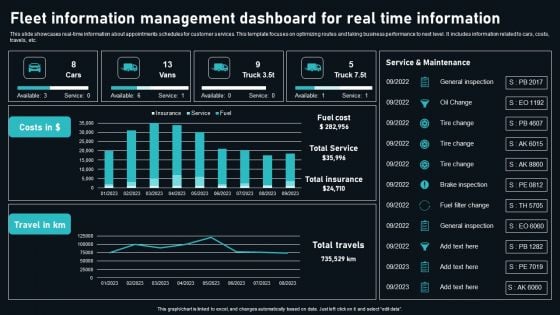
Fleet Information Management Dashboard For Real Time Information Graphics PDF
This slide showcases real time information about appointments schedules for customer services. This template focuses on optimizing routes and taking business performance to next level. It includes information related to cars, costs, travels, etc. Pitch your topic with ease and precision using this Fleet Information Management Dashboard For Real Time Information Graphics PDF. This layout presents information on General Inspection, Oil Change, Tire Change. It is also available for immediate download and adjustment. So, changes can be made in the color, design, graphics or any other component to create a unique layout.
Cloud Dashboard For Tracking Project Sprints Ppt PowerPoint Presentation File Layouts PDF
The following slide depicts cloud dashboard for monitoring project sprints. It provides information about sprint blockers, resolved issues, under performers, sprint health, releases, sprint burndown, etc. If you are looking for a format to display your unique thoughts, then the professionally designed Cloud Dashboard For Tracking Project Sprints Ppt PowerPoint Presentation File Layouts PDF is the one for you. You can use it as a Google Slides template or a PowerPoint template. Incorporate impressive visuals, symbols, images, and other charts. Modify or reorganize the text boxes as you desire. Experiment with shade schemes and font pairings. Alter, share or cooperate with other people on your work. Download Cloud Dashboard For Tracking Project Sprints Ppt PowerPoint Presentation File Layouts PDF and find out how to give a successful presentation. Present a perfect display to your team and make your presentation unforgettable.
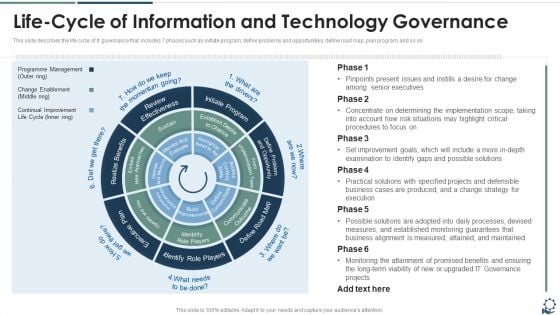
Life Cycle Of Information And Technology Governance Portrait PDF
This slide describes the life cycle of It governance that includes 7 phases such as initiate program, define problems and opportunities, define road map, plan program, and so on.This is a Life Cycle Of Information And Technology Governance Portrait PDF template with various stages. Focus and dispense information on one stage using this creative set, that comes with editable features. It contains large content boxes to add your information on topics like Pinpoints Present, Senior Executives, Concentrate On Determining. You can also showcase facts, figures, and other relevant content using this PPT layout. Grab it now.
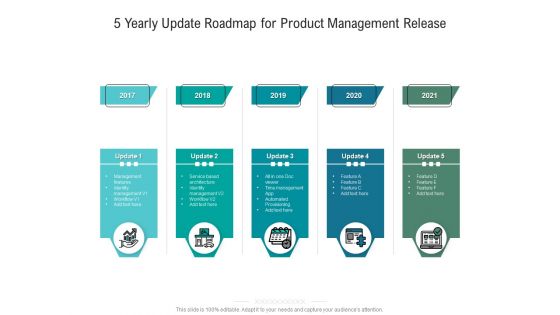
5 Yearly Update Roadmap For Product Management Release Designs
Presenting our innovatively-structured 5 yearly update roadmap for product management release designs Template. Showcase your roadmap process in different formats like PDF, PNG, and JPG by clicking the download button below. This PPT design is available in both Standard Screen and Widescreen aspect ratios. It can also be easily personalized and presented with modified font size, font type, color, and shapes to measure your progress in a clear way.
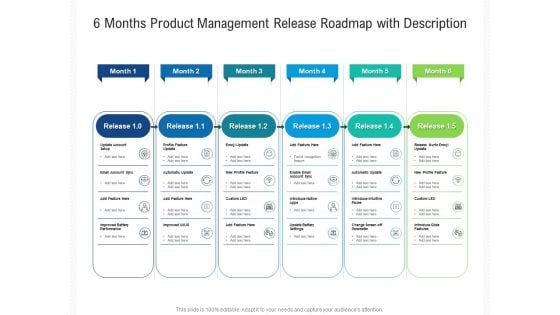
6 Months Product Management Release Roadmap With Description Graphics
Presenting our innovatively-structured 6 months product management release roadmap with description graphics Template. Showcase your roadmap process in different formats like PDF, PNG, and JPG by clicking the download button below. This PPT design is available in both Standard Screen and Widescreen aspect ratios. It can also be easily personalized and presented with modified font size, font type, color, and shapes to measure your progress in a clear way.
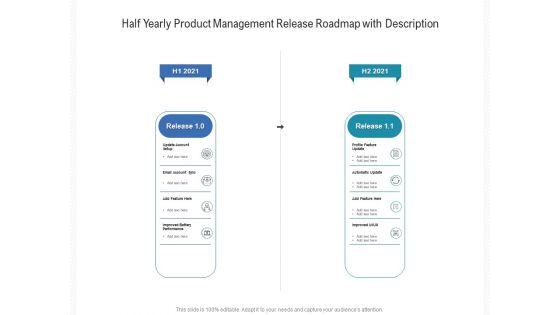
Half Yearly Product Management Release Roadmap With Description Elements
Presenting our innovatively-structured half yearly product management release roadmap with description elements Template. Showcase your roadmap process in different formats like PDF, PNG, and JPG by clicking the download button below. This PPT design is available in both Standard Screen and Widescreen aspect ratios. It can also be easily personalized and presented with modified font size, font type, color, and shapes to measure your progress in a clear way.

Quarterly Roadmap For Business Trademarking Timeline Slides
Presenting our innovatively-structured quarterly roadmap for business trademarking timeline slides Template. Showcase your roadmap process in different formats like PDF, PNG, and JPG by clicking the download button below. This PPT design is available in both Standard Screen and Widescreen aspect ratios. It can also be easily personalized and presented with modified font size, font type, color, and shapes to measure your progress in a clear way.
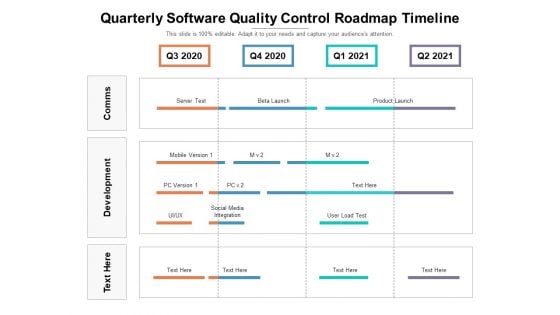
Quarterly Software Quality Control Roadmap Timeline Elements
Presenting our jaw dropping quarterly software quality control roadmap timeline elements. You can alternate the color, font size, font type, and shapes of this PPT layout according to your strategic process. This PPT presentation is compatible with Google Slides and is available in both standard screen and widescreen aspect ratios. You can also download this well researched PowerPoint template design in different formats like PDF, JPG, and PNG. So utilize this visually appealing design by clicking the download button given below.
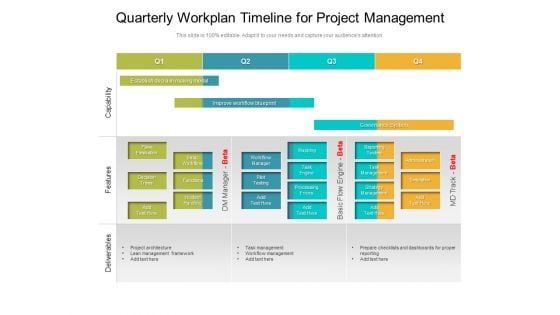
Quarterly Workplan Timeline For Project Management Rules
Presenting our jaw-dropping quarterly workplan timeline for project management rules. You can alternate the color, font size, font type, and shapes of this PPT layout according to your strategic process. This PPT presentation is compatible with Google Slides and is available in both standard screen and widescreen aspect ratios. You can also download this well-researched PowerPoint template design in different formats like PDF, JPG, and PNG. So utilize this visually-appealing design by clicking the download button given below.
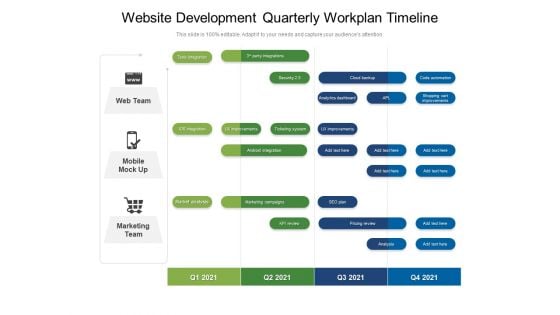
Website Development Quarterly Workplan Timeline Clipart
Presenting our jaw-dropping website development quarterly workplan timeline clipart. You can alternate the color, font size, font type, and shapes of this PPT layout according to your strategic process. This PPT presentation is compatible with Google Slides and is available in both standard screen and widescreen aspect ratios. You can also download this well-researched PowerPoint template design in different formats like PDF, JPG, and PNG. So utilize this visually-appealing design by clicking the download button given below.

 Home
Home