Data Analysis Icon
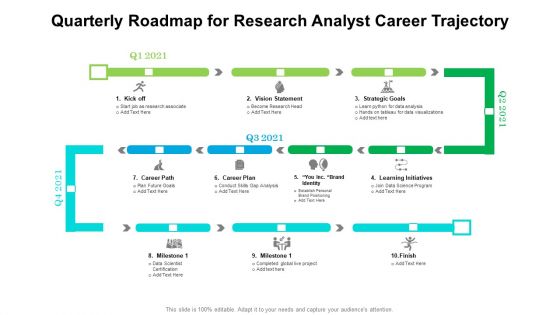
Quarterly Roadmap For Research Analyst Career Trajectory Designs
We present our quarterly roadmap for research analyst career trajectory designs. This PowerPoint layout is easy-to-edit so you can change the font size, font type, color, and shape conveniently. In addition to this, the PowerPoint layout is Google Slides compatible, so you can share it with your audience and give them access to edit it. Therefore, download and save this well-researched quarterly roadmap for research analyst career trajectory designs in different formats like PDF, PNG, and JPG to smoothly execute your business plan.
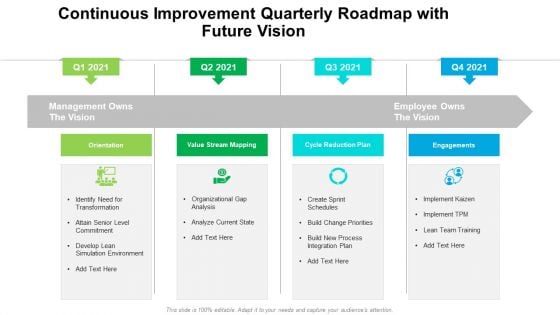
Continuous Improvement Quarterly Roadmap With Future Vision Inspiration
We present our continuous improvement quarterly roadmap with future vision inspiration. This PowerPoint layout is easy-to-edit so you can change the font size, font type, color, and shape conveniently. In addition to this, the PowerPoint layout is Google Slides compatible, so you can share it with your audience and give them access to edit it. Therefore, download and save this well-researched continuous improvement quarterly roadmap with future vision inspiration in different formats like PDF, PNG, and JPG to smoothly execute your business plan.
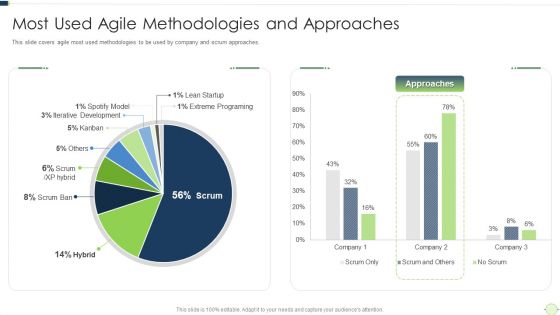
Agile Software Programming Module For Information Technology Most Used Agile Methodologies Download PDF
This slide covers agile most used methodologies to be used by company and scrum approaches. Deliver an awe inspiring pitch with this creative agile software programming module for information technology most used agile methodologies download pdf bundle. Topics like st used agile methodologies and approaches can be discussed with this completely editable template. It is available for immediate download depending on the needs and requirements of the user.
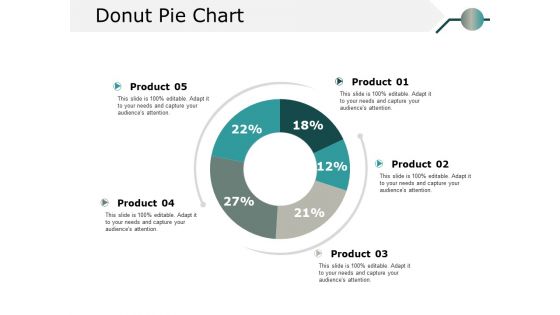
Donut Pie Chart Ppt PowerPoint Presentation Model Information
This is a donut pie chart ppt powerpoint presentation model information. This is a five stage process. The stages in this process are percentage, product, business.
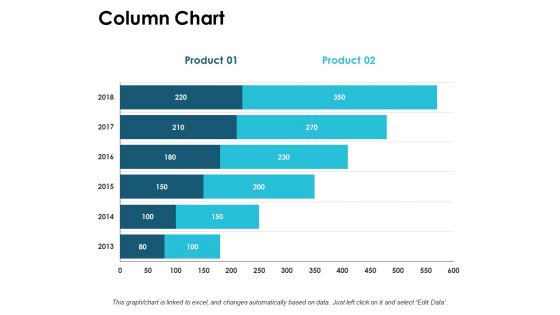
Column Chart Graph Ppt PowerPoint Presentation Outline Information
This is a column chart graph ppt powerpoint presentation outline information. This is a three stage process. The stages in this process are compare, marketing, business, management, planning.
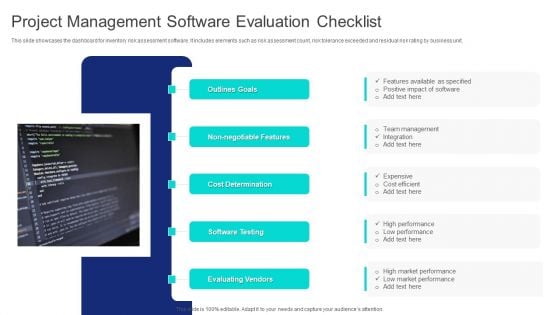
Project Management Software Evaluation Checklist Ppt PowerPoint Presentation File Pictures PDF
This slide showcases the dashboard for inventory risk assessment software. It includes elements such as risk assessment count, risk tolerance exceeded and residual risk rating by business unit. Presenting Project Management Software Evaluation Checklist Ppt PowerPoint Presentation File Pictures PDF to dispense important information. This template comprises one stages. It also presents valuable insights into the topics including Outlines Goals, Cost Determination, Software Testing, Evaluating Vendors. This is a completely customizable PowerPoint theme that can be put to use immediately. So, download it and address the topic impactfully.
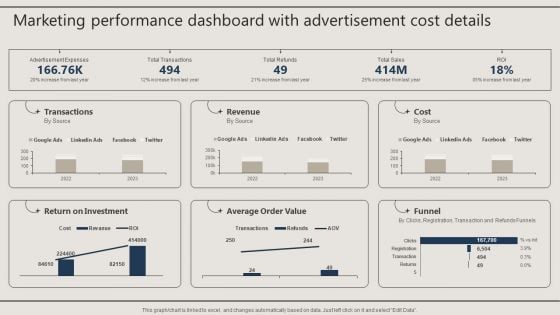
Marketing Performance Dashboard With Advertisement Cost Details Download PDF
Here you can discover an assortment of the finest PowerPoint and Google Slides templates. With these templates, you can create presentations for a variety of purposes while simultaneously providing your audience with an eye catching visual experience. Download Marketing Performance Dashboard With Advertisement Cost Details Download PDF to deliver an impeccable presentation. These templates will make your job of preparing presentations much quicker, yet still, maintain a high level of quality. Slidegeeks has experienced researchers who prepare these templates and write high quality content for you. Later on, you can personalize the content by editing the Marketing Performance Dashboard With Advertisement Cost Details Download PDF.
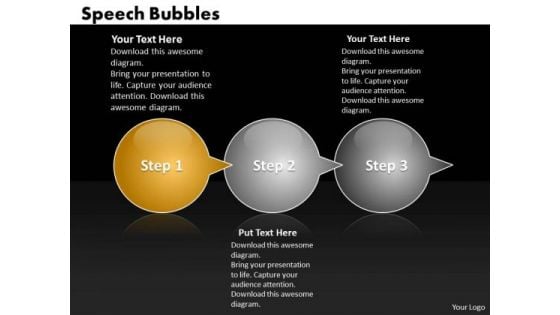
Ppt Circular Process Bubbles Horizontal 3 Practice The PowerPoint Macro Steps Templates
PPT circular process bubbles horizontal 3 practice the powerpoint macro steps Templates-Use this circular arrow speech bubbles diagram to show a series of events or timeline information. Use it to show sequence or steps in a task, process, or workflow. It is Illustrating the first concept included in the process.-PPT circular process bubbles horizontal 3 practice the powerpoint macro steps Templates-Add, Aqua, Arrows, Badges, Bar, Blend, Blue, Bright, Bubbles, Buttons, Caution, Circle, Drop, Elements, Glossy, Glowing, Graphic, Heart, Help, Icons, Idea, Illustration, Navigation, Oblong, Plus, Round, Service, Shadow, Shiny, Sign, Speech, Squares Ditch the blues with our Ppt Circular Process Bubbles Horizontal 3 Practice The PowerPoint Macro Steps Templates. Your thoughts will find joy.
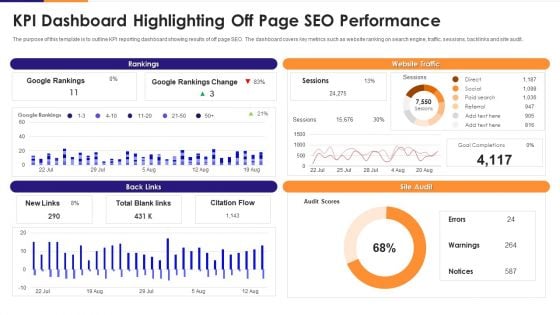
KPI Dashboard Highlighting Off Page Seo Performance Rules PDF
The purpose of this template is to outline KPI reporting dashboard showing results of off page SEO. The dashboard covers key metrics such as website ranking on search engine, traffic, sessions, backlinks and site audit. Showcasing this set of slides titled kpi dashboard highlighting off page seo performance rules pdf. The topics addressed in these templates are kpi dashboard highlighting off page seo performance. All the content presented in this PPT design is completely editable. Download it and make adjustments in color, background, font etc. as per your unique business setting.
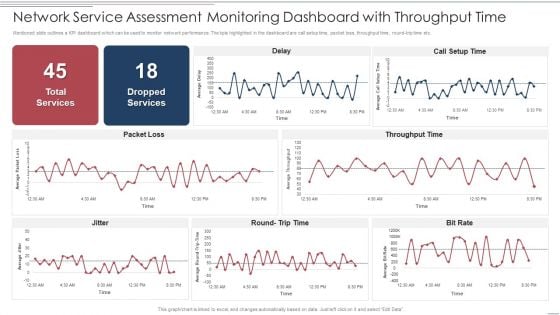
Network Service Assessment Monitoring Dashboard With Throughput Time Structure PDF
Mentioned slide outlines a KPI dashboard which can be used to monitor network performance. The kpis highlighted in the dashboard are call setup time, packet loss, throughput time, round trip time etc. Showcasing this set of slides titled Network Service Assessment Monitoring Dashboard With Throughput Time Structure PDF. The topics addressed in these templates are Network Service Assessment Monitoring Dashboard With Throughput Time. All the content presented in this PPT design is completely editable. Download it and make adjustments in color, background, font etc. as per your unique business setting.
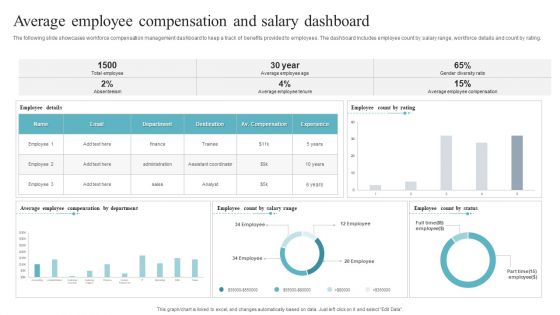
Average Employee Compensation And Salary Dashboard Download PDF
The following slide showcases workforce compensation management dashboard to keep a track of benefits provided to employees. The dashboard includes employee count by salary range, workforce details and count by rating. Showcasing this set of slides titled Average Employee Compensation And Salary Dashboard Download PDF. The topics addressed in these templates are Average Employee Compensation, Salary Dashboard. All the content presented in this PPT design is completely editable. Download it and make adjustments in color, background, font etc. as per your unique business setting.
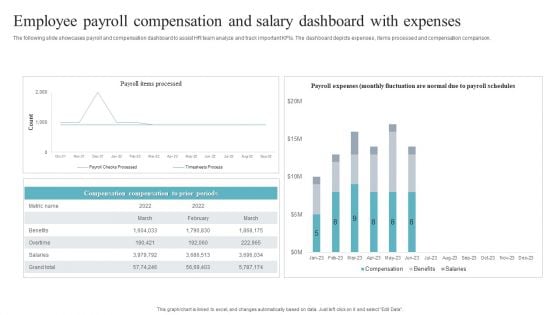
Employee Payroll Compensation And Salary Dashboard With Expenses Professional PDF
The following slide showcases payroll and compensation dashboard to assist HR team analyze and track important KPIs. The dashboard depicts expenses , items processed and compensation comparison. Showcasing this set of slides titled Employee Payroll Compensation And Salary Dashboard With Expenses Professional PDF. The topics addressed in these templates are Employee Payroll Compensation, Salary Dashboard With Expenses. All the content presented in this PPT design is completely editable. Download it and make adjustments in color, background, font etc. as per your unique business setting.
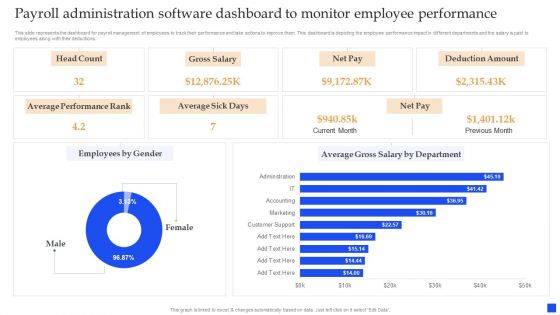
Payroll Administration Software Dashboard To Monitor Employee Performance Summary PDF
This slide represents the dashboard for payroll management of employees to track their performance and take actions to improve them. This dashboard is depicting the employee performance impact in different departments and the salary is paid to employees along with their deductions. Showcasing this set of slides titled Payroll Administration Software Dashboard To Monitor Employee Performance Summary PDF. The topics addressed in these templates are Payroll Administration Software Dashboard, Monitor Employee Performance. All the content presented in this PPT design is completely editable. Download it and make adjustments in color, background, font etc. as per your unique business setting.
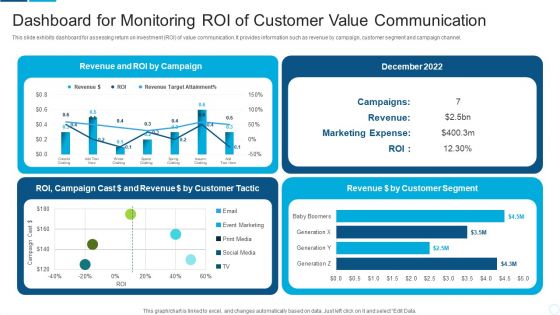
Dashboard For Monitoring Roi Of Customer Value Communication Portrait PDF
This slide exhibits dashboard for assessing return on investment ROI of value communication. It provides information such as revenue by campaign, customer segment and campaign channel. Pitch your topic with ease and precision using this dashboard for monitoring roi of customer value communication portrait pdf. This layout presents information on customer, revenue, marketing expense. It is also available for immediate download and adjustment. So, changes can be made in the color, design, graphics or any other component to create a unique layout.
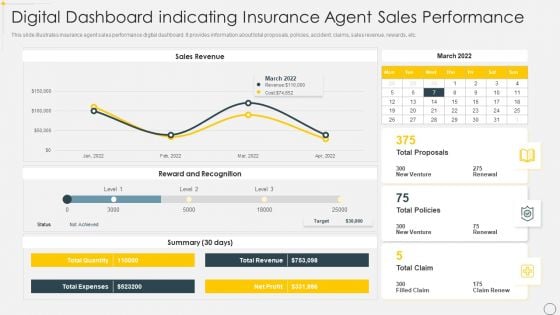
Digital Dashboard Indicating Insurance Agent Sales Performance Portrait PDF
This slide illustrates insurance agent sales performance digital dashboard. It provides information about total proposals, policies, accident, claims, sales revenue, rewards, etc. Pitch your topic with ease and precision using this Digital Dashboard Indicating Insurance Agent Sales Performance Portrait PDF. This layout presents information on Sales Revenue, Reward And Recognition. It is also available for immediate download and adjustment. So, changes can be made in the color, design, graphics or any other component to create a unique layout.
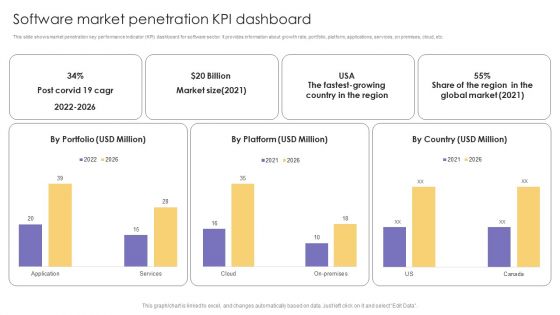
Software Market Penetration KPI Dashboard Ppt Outline Aids PDF
This slide shows market penetration key performance indicator KPI dashboard for software sector. It provides information about growth rate, portfolio, platform, applications, services, on premises, cloud, etc. Pitch your topic with ease and precision using this Software Market Penetration KPI Dashboard Ppt Outline Aids PDF. This layout presents information on Market Size, Global Market, Cloud. It is also available for immediate download and adjustment. So, changes can be made in the color, design, graphics or any other component to create a unique layout.
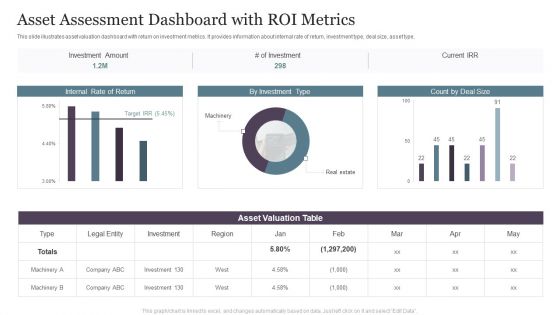
Asset Assessment Dashboard With ROI Metrics Topics PDF
This slide illustrates asset valuation dashboard with return on investment metrics. It provides information about internal rate of return, investment type, deal size, asset type, Pitch your topic with ease and precision using this Asset Assessment Dashboard With ROI Metrics Topics PDF. This layout presents information on Investment Amount, Asset Valuation, Internal Return. It is also available for immediate download and adjustment. So, changes can be made in the color, design, graphics or any other component to create a unique layout.
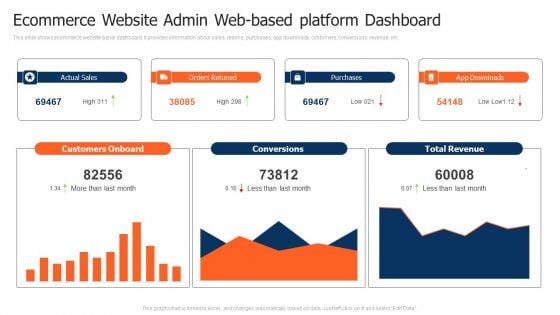
Ecommerce Website Admin Web Based Platform Dashboard Pictures PDF
This slide shows ecommerce website panel dashboard. It provides information about sales, returns, purchases, app downloads, customers, conversions, revenue, etc. Pitch your topic with ease and precision using this Ecommerce Website Admin Web Based Platform Dashboard Pictures PDF. This layout presents information on Customers Onboard, Purchases, Total Revenue. It is also available for immediate download and adjustment. So, changes can be made in the color, design, graphics or any other component to create a unique layout.
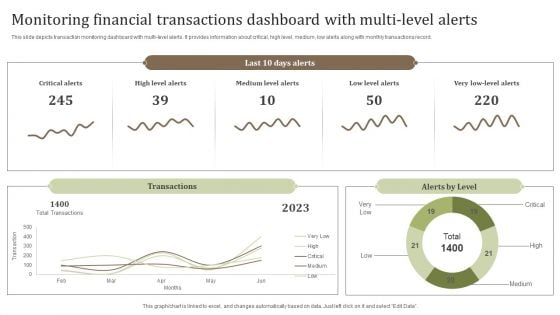
Monitoring Financial Transactions Dashboard With Multi Level Alerts Background PDF
This slide depicts transaction monitoring dashboard with multi-level alerts. It provides information about critical, high level, medium, low alerts along with monthly transactions record. Pitch your topic with ease and precision using this Monitoring Financial Transactions Dashboard With Multi Level Alerts Background PDF. This layout presents information on Critical Alerts, Medium Level Alerts, Total Transactions. It is also available for immediate download and adjustment. So, changes can be made in the color, design, graphics or any other component to create a unique layout.

Weekly Sales Performance KPI Dashboard For Revenue Generation Brochure PDF
The following slide exhibits dashboard to maintain revenue and management under control. It presents information related to profits, cross selling, costs, etc. Pitch your topic with ease and precision using this Weekly Sales Performance KPI Dashboard For Revenue Generation Brochure PDF. This layout presents information on Total Sales, Revenue, Profit, Cost. It is also available for immediate download and adjustment. So, changes can be made in the color, design, graphics or any other component to create a unique layout.
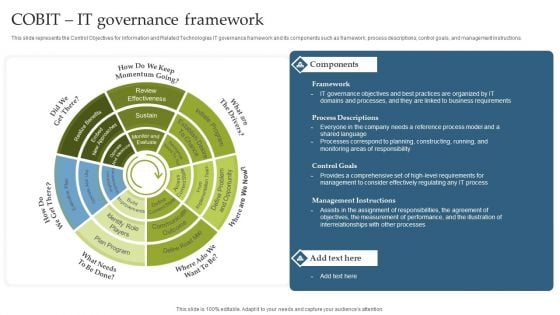
Deploying EGIT To Ensure Optimum Risk Management COBIT IT Governance Framework Themes PDF
This slide represents the Control Objectives for Information and Related Technologies IT governance framework and its components such as framework, process descriptions, control goals, and management instructions. Are you in need of a template that can accommodate all of your creative concepts This one is crafted professionally and can be altered to fit any style. Use it with Google Slides or PowerPoint. Include striking photographs, symbols, depictions, and other visuals. Fill, move around, or remove text boxes as desired. Test out color palettes and font mixtures. Edit and save your work, or work with colleagues. Download Deploying EGIT To Ensure Optimum Risk Management COBIT IT Governance Framework Themes PDF and observe how to make your presentation outstanding. Give an impeccable presentation to your group and make your presentation unforgettable.
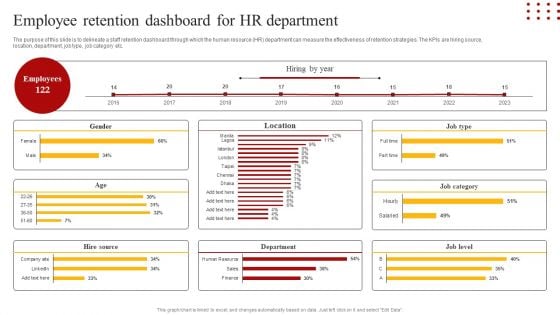
Staff Retention Techniques To Minimize Hiring Expenses Employee Retention Dashboard For Hr Department Infographics PDF
The purpose of this slide is to delineate a staff retention dashboard through which the human resource HR department can measure the effectiveness of retention strategies. The KPIs are hiring source, location, department, job type, job category etc. Boost your pitch with our creative Staff Retention Techniques To Minimize Hiring Expenses Employee Retention Dashboard For Hr Department Infographics PDF. Deliver an awe-inspiring pitch that will mesmerize everyone. Using these presentation templates you will surely catch everyones attention. You can browse the ppts collection on our website. We have researchers who are experts at creating the right content for the templates. So you do not have to invest time in any additional work. Just grab the template now and use them.
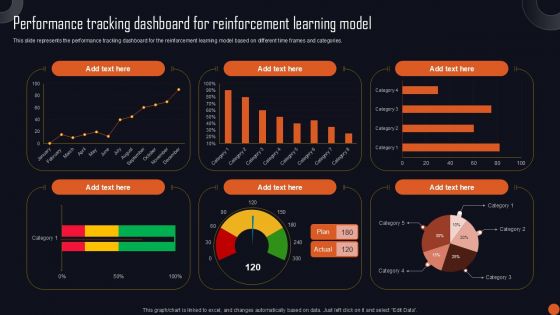
Reinforcement Learning Principles And Techniques Performance Tracking Dashboard Reinforcement Learning Mockup PDF
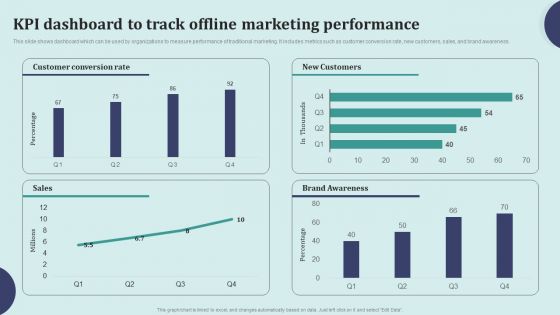
Offline Marketing Techniques To Elevate Brand Visibility KPI Dashboard To Track Offline Formats PDF
This slide shows dashboard which can be used by organizations to measure performance of traditional marketing. It includes metrics such as customer conversion rate, new customers, sales, and brand awareness. Coming up with a presentation necessitates that the majority of the effort goes into the content and the message you intend to convey. The visuals of a PowerPoint presentation can only be effective if it supplements and supports the story that is being told. Keeping this in mind our experts created Offline Marketing Techniques To Elevate Brand Visibility KPI Dashboard To Track Offline Formats PDF to reduce the time that goes into designing the presentation. This way, you can concentrate on the message while our designers take care of providing you with the right template for the situation.

Summary Of Cloud ERP System Framework ERP System Framework Dashboard With Total Visits And Bounce Rate Themes PDF
Deliver and pitch your topic in the best possible manner with this Summary Of Cloud ERP System Framework ERP System Framework Dashboard With Total Visits And Bounce Rate Themes PDF Use them to share invaluable insights on ERP System Framework Dashboard With Total Visits And Bounce Rate and impress your audience. This template can be altered and modified as per your expectations. So, grab it now.
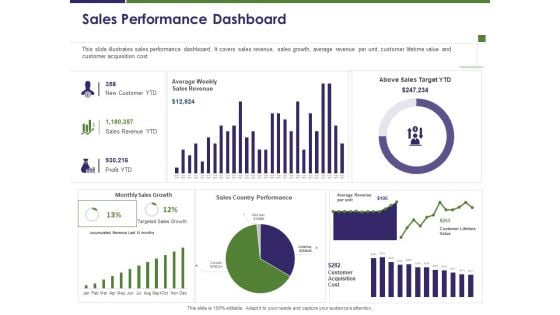
Business Intelligence Report Sales Performance Dashboard Ppt Infographic Template Examples PDF
Presenting this set of slides with name business intelligence report sales performance dashboard ppt infographic template examples pdf. The topics discussed in these slides are new customer, sales revenue, profit, sales target, targeted sales growth. This is a completely editable PowerPoint presentation and is available for immediate download. Download now and impress your audience.
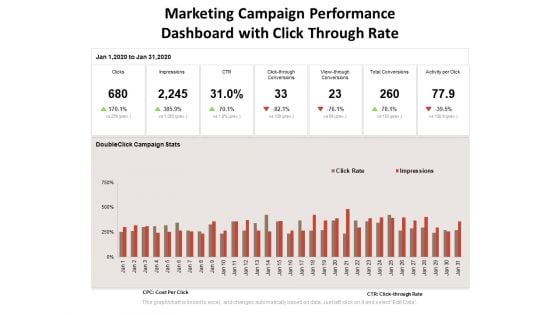
Marketing Campaign Performance Dashboard With Click Through Rate Ppt PowerPoint Presentation Infographics Example File PDF
Presenting this set of slides with name marketing campaign performance dashboard with click through rate ppt powerpoint presentation infographics example file pdf. The topics discussed in these slides are clicks, impressions, ctr, click through, conversions, view through, conversions, total conversions, activity per click. This is a completely editable PowerPoint presentation and is available for immediate download. Download now and impress your audience.
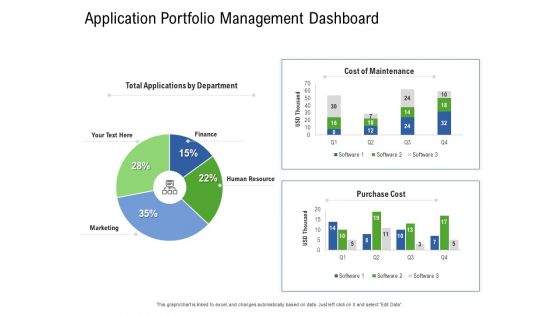
Application Performance Management Application Portfolio Management Dashboard Ppt Infographics Model PDF
Deliver an awe inspiring pitch with this creative application performance management application portfolio management dashboard ppt infographics model pdf bundle. Topics like finance, human resource, cost, maintenance can be discussed with this completely editable template. It is available for immediate download depending on the needs and requirements of the user.
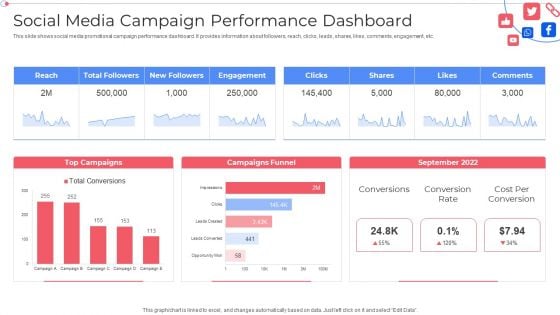
Social Media Campaign Performance Dashboard Customer Group Engagement Through Social Media Channels Infographics PDF
Deliver and pitch your topic in the best possible manner with this Social Media Campaign Performance Dashboard Customer Group Engagement Through Social Media Channels Infographics PDF . Use them to share invaluable insights on Cost Per Conversion, Campaigns Funnel and impress your audience. This template can be altered and modified as per your expectations. So, grab it now.
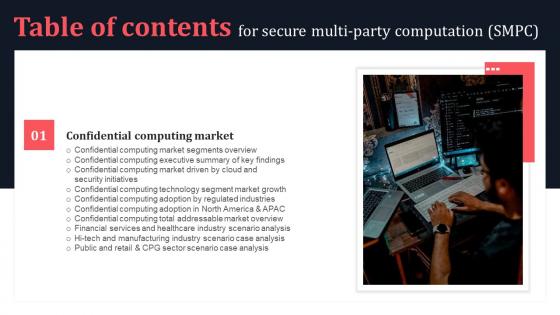
For Secure Multi Party Computation SMPC Table Of Contents Diagrams Pdf
Are you searching for a For Secure Multi Party Computation SMPC Table Of Contents Diagrams Pdf that is uncluttered, straightforward, and original It is easy to edit, and you can change the colors to suit your personal or business branding. For a presentation that expresses how much effort you have put in, this template is ideal With all of its features, including tables, diagrams, statistics, and lists, it is perfect for a business plan presentation. Make your ideas more appealing with these professional slides. Download For Secure Multi Party Computation SMPC Table Of Contents Diagrams Pdf from Slidegeeks today. Our For Secure Multi Party Computation SMPC Table Of Contents Diagrams Pdf are topically designed to provide an attractive backdrop to any subject. Use them to look like a presentation pro.

Sales Team Performance Meter Ppt PowerPoint Presentation Diagrams
This is a sales team performance meter ppt powerpoint presentation diagrams. This is a five stage process. The stages in this process are business, meter, speed, time, sales.
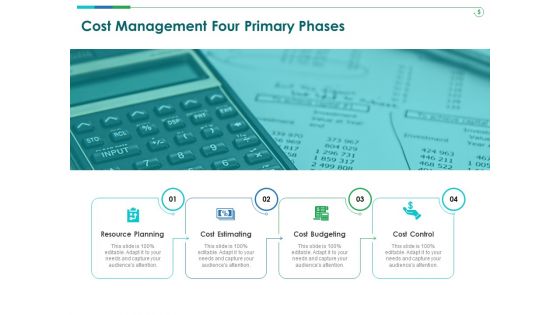
TCM Cost Management Four Primary Phases Ppt Infographic Template Information PDF
Presenting this set of slides with name tcm cost management four primary phases ppt infographic template information pdf. This is a four stage process. The stages in this process are resource planning, cost estimating, cost budgeting, cost control. This is a completely editable PowerPoint presentation and is available for immediate download. Download now and impress your audience.
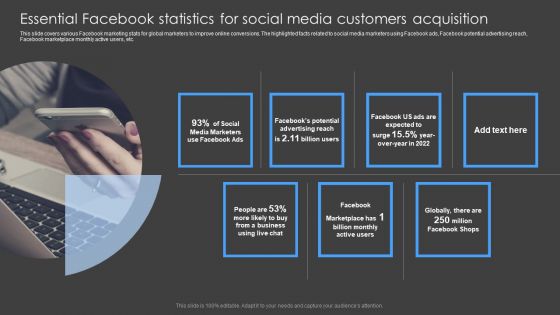
Essential Facebook Statistics For Social Media Customers Acquisition Microsoft PDF
This slide covers various Facebook marketing stats for global marketers to improve online conversions. The highlighted facts related to social media marketers using Facebook ads, Facebook potential advertising reach, Facebook marketplace monthly active users, etc. If you are looking for a format to display your unique thoughts, then the professionally designed Essential Facebook Statistics For Social Media Customers Acquisition Microsoft PDF is the one for you. You can use it as a Google Slides template or a PowerPoint template. Incorporate impressive visuals, symbols, images, and other charts. Modify or reorganize the text boxes as you desire. Experiment with shade schemes and font pairings. Alter, share or cooperate with other people on your work. Download Essential Facebook Statistics For Social Media Customers Acquisition Microsoft PDF and find out how to give a successful presentation. Present a perfect display to your team and make your presentation unforgettable.
Reverse Proxy Web Server Dashboard For Reverse Proxy Performance Tracking Elements PDF
This slide represents the dashboard for reverse proxy performance tracking by covering details of CPU load, available memory, and connections. If your project calls for a presentation, then Slidegeeks is your go-to partner because we have professionally designed, easy-to-edit templates that are perfect for any presentation. After downloading, you can easily edit Reverse Proxy Web Server Dashboard For Reverse Proxy Performance Tracking Elements PDF and make the changes accordingly. You can rearrange slides or fill them with different images. Check out all the handy templates
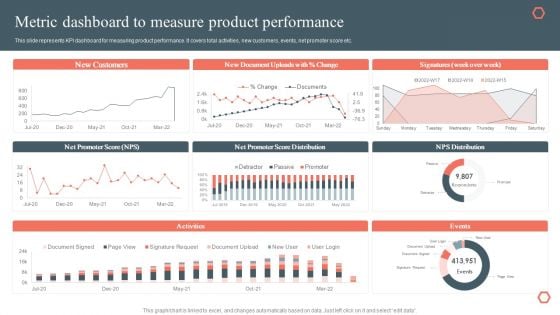
Metric Dashboard To Measure Product Performance Product Development And Management Plan Demonstration PDF
This slide represents dashboard for tracking product success. It covers new customer, total sessions, purchase, total inquires, total crashes etc.If your project calls for a presentation, then Slidegeeks is your go to partner because we have professionally designed, easy to edit templates that are perfect for any presentation. After downloading, you can easily edit Metric Dashboard To Measure Product Performance Product Development And Management Plan Demonstration PDF and make the changes accordingly. You can rearrange slides or fill them with different images. Check out all the handy templates.
Robotic Process Automation Shipping And Logistics Tracking Dashboard With Shipments Clipart PDF
This slide covers Key performance indicators to track the automation system of the company. This dashboard includes Logistics Efficiency Status, delivery time accuracy etc. If your project calls for a presentation, then Slidegeeks is your go-to partner because we have professionally designed, easy-to-edit templates that are perfect for any presentation. After downloading, you can easily edit Robotic Process Automation Shipping And Logistics Tracking Dashboard With Shipments Clipart PDF and make the changes accordingly. You can rearrange slides or fill them with different images. Check out all the handy templates
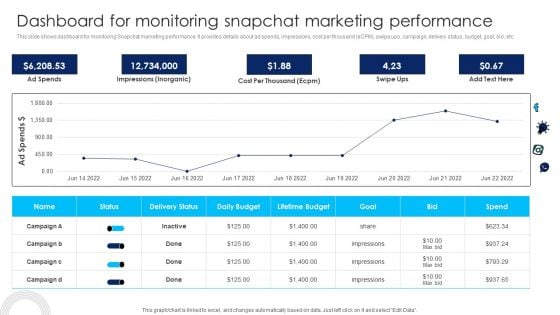
Using Social Media Platforms To Enhance Dashboard For Monitoring Snapchat Marketing Introduction PDF
This slide shows dashboard for monitoring Snapchat marketing performance. It provides details about ad spends, impressions, cost per thousand eCPM, swipe ups, campaign, delivery status, budget, goal, bid, etc. If your project calls for a presentation, then Slidegeeks is your go-to partner because we have professionally designed, easy-to-edit templates that are perfect for any presentation. After downloading, you can easily edit Using Social Media Platforms To Enhance Dashboard For Monitoring Snapchat Marketing Introduction PDF and make the changes accordingly. You can rearrange slides or fill them with different images. Check out all the handy templates
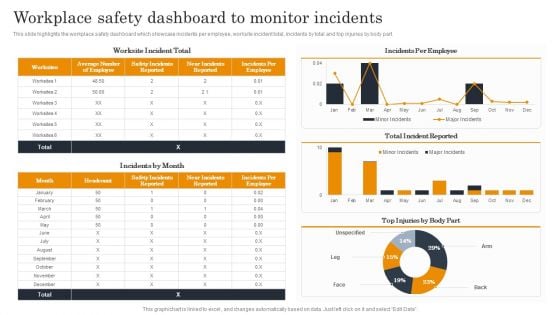
Employee Health And Safety Workplace Safety Dashboard To Monitor Incidents Ideas PDF
This slide highlights the workplace safety dashboard which showcase incidents per employee, worksite incident total, incidents by total and top injuries by body part. If your project calls for a presentation, then Slidegeeks is your go-to partner because we have professionally designed, easy-to-edit templates that are perfect for any presentation. After downloading, you can easily edit Employee Health And Safety Workplace Safety Dashboard To Monitor Incidents Ideas PDF and make the changes accordingly. You can rearrange slides or fill them with different images. Check out all the handy templates.
Critical Measures For Ensuring Threats Handling Activities Tracking Dashboard Summary PDF
This slide provides details regarding various threats management activities tracking dashboard in terms of breach risk trends, risk issues by owner, breach likelihood, etc. If your project calls for a presentation, then Slidegeeks is your go-to partner because we have professionally designed, easy-to-edit templates that are perfect for any presentation. After downloading, you can easily edit Critical Measures For Ensuring Threats Handling Activities Tracking Dashboard Summary PDF and make the changes accordingly. You can rearrange slides or fill them with different images. Check out all the handy templates.
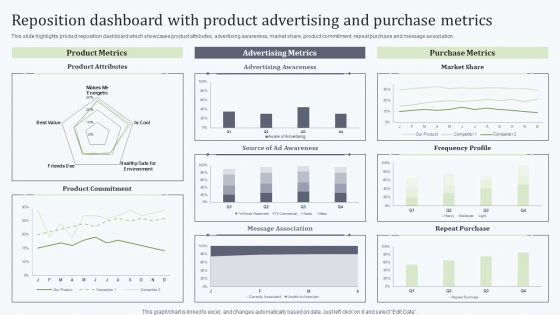
Deploying Revitalization Strategy Enhance Product And Service Sales Reposition Dashboard With Product Slides PDF
This slide highlights product reposition dashboard which showcases product attributes, advertising awareness, market share, product commitment, repeat purchase and message association. If your project calls for a presentation, then Slidegeeks is your go to partner because we have professionally designed, easy to edit templates that are perfect for any presentation. After downloading, you can easily edit Deploying Revitalization Strategy Enhance Product And Service Sales Reposition Dashboard With Product Slides PDF and make the changes accordingly. You can rearrange slides or fill them with different images. Check out all the handy templates
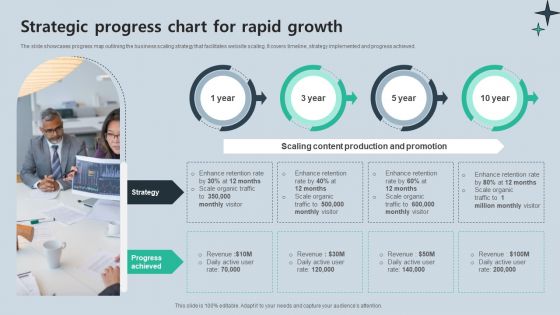
Strategic Progress Chart For Rapid Growth Information PDF
The slide showcases progress map outlining the business scaling strategy that facilitates website scaling. It covers timeline, strategy implemented and progress achieved. Persuade your audience using this Strategic Progress Chart For Rapid Growth Information PDF. This PPT design covers four stages, thus making it a great tool to use. It also caters to a variety of topics including Strategy, Scale Organic, Revenue. Download this PPT design now to present a convincing pitch that not only emphasizes the topic but also showcases your presentation skills.
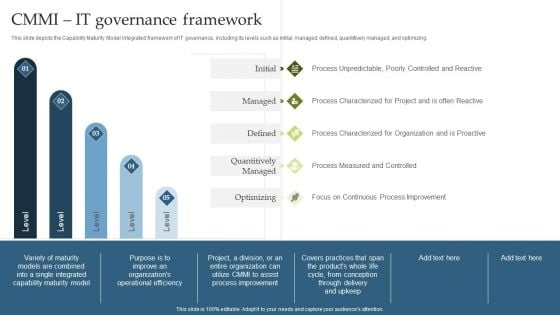
Deploying EGIT To Ensure Optimum Risk Management CMMI IT Governance Framework Diagrams PDF
This slide depicts the Capability Maturity Model Integrated framework of IT governance, including its levels such as initial, managed, defined, quantitively managed, and optimizing. If you are looking for a format to display your unique thoughts, then the professionally designed Deploying EGIT To Ensure Optimum Risk Management CMMI IT Governance Framework Diagrams PDF is the one for you. You can use it as a Google Slides template or a PowerPoint template. Incorporate impressive visuals, symbols, images, and other charts. Modify or reorganize the text boxes as you desire. Experiment with shade schemes and font pairings. Alter, share or cooperate with other people on your work. Download Deploying EGIT To Ensure Optimum Risk Management CMMI IT Governance Framework Diagrams PDF and find out how to give a successful presentation. Present a perfect display to your team and make your presentation unforgettable.
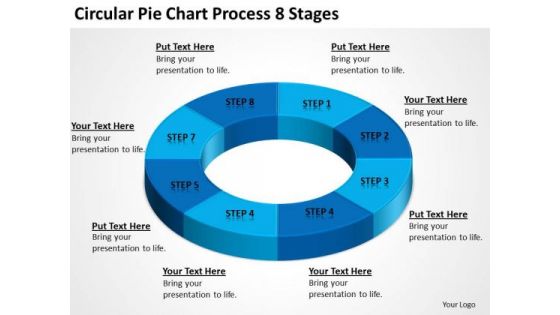
Circular Pie Chart Process 8 Stages Online Business Plan PowerPoint Templates
We present our circular pie chart process 8 stages online business plan PowerPoint templates.Use our Circle Charts PowerPoint Templates because Our PowerPoint Templates and Slides will let you meet your Deadlines. Download our Ring Charts PowerPoint Templates because Our PowerPoint Templates and Slides come in all colours, shades and hues. They help highlight every nuance of your views. Present our Shapes PowerPoint Templates because Our PowerPoint Templates and Slides are aesthetically designed to attract attention. We gaurantee that they will grab all the eyeballs you need. Download and present our Process and Flows PowerPoint Templates because Our PowerPoint Templates and Slides will let you meet your Deadlines. Use our Business PowerPoint Templates because It will mark the footprints of your journey. Illustrate how they will lead you to your desired destination.Use these PowerPoint slides for presentations relating to direction, market, percent, forward, target, achievement, flow, business, process diagram, concept, arrow, sign, success, symbol, percentage sign, arrow circle, diagram, value, percentage, finance, process, element, goal, marketing, green energy, development, price, abstract, team, management, graph, cycle, icon, chart, project, up, growth, motion, moving, company, competition, progress, profit, increase, investment, aim, financial, upwards, communication. The prominent colors used in the PowerPoint template are Blue, Blue navy, Black. Our Circular Pie Chart Process 8 Stages Online Business Plan PowerPoint Templates will be a charming discovery. They are both colorful and cute.
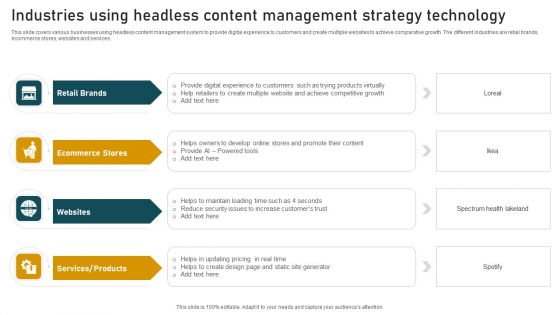
Industries Using Headless Content Management Strategy Technology Pictures PDF
This slide covers various businesses using headless content management system to provide digital experience to customers and create multiple websites to achieve comparative growth. The different industries are retail brands, ecommerce stores, websites and services. Presenting Industries Using Headless Content Management Strategy Technology Pictures PDF to dispense important information. This template comprises four stages. It also presents valuable insights into the topics including Retail Brands, Ecommerce Stores, Websites. This is a completely customizable PowerPoint theme that can be put to use immediately. So, download it and address the topic impactfully.
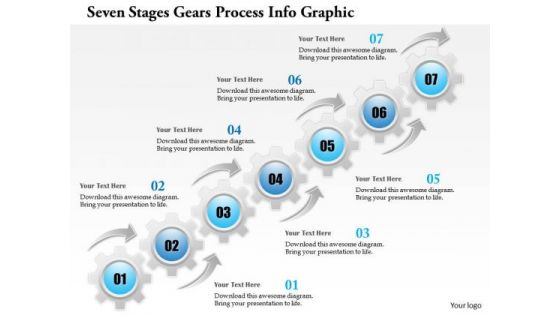
Business Diagram Seven Stages Gears Process Info Graphic Presentation Template
Seven staged gear process info graphics has been used to design this power point template. This PPT contains the concept of information sharing and communication. Use this PPT and build presentations for business and communication related topics.
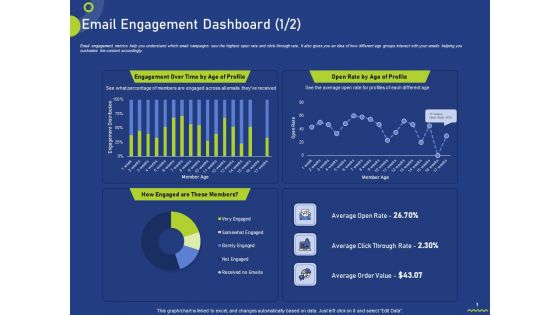
Email Engagement Dashboard Profile Ppt Infographics Images PDF
Email engagement metrics help you understand which email campaigns saw the highest open rate and click-through rate. It also gives you an idea of how different age groups interact with your emails helping you customize the content accordingly. Deliver an awe-inspiring pitch with this creative email engagement dashboard profile ppt infographics images pdf bundle. Topics like email engagement dashboard can be discussed with this completely editable template. It is available for immediate download depending on the needs and requirements of the user.
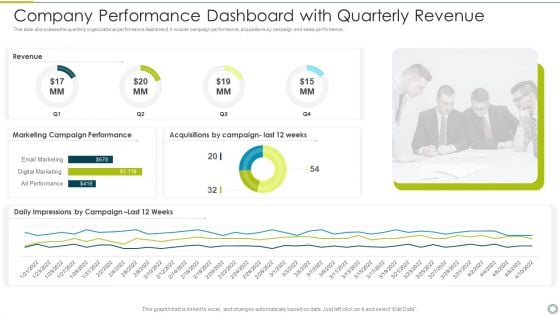
Company Performance Dashboard With Quarterly Revenue Download PDF
This slide showcases the quarterly organizational performance dashboard. It include campaign performance, acquisitions by campaign and sales performance. Showcasing this set of slides titled company performance dashboard with quarterly revenue download pdf. The topics addressed in these templates are marketing, performance. All the content presented in this PPT design is completely editable. Download it and make adjustments in color, background, font etc. as per your unique business setting.
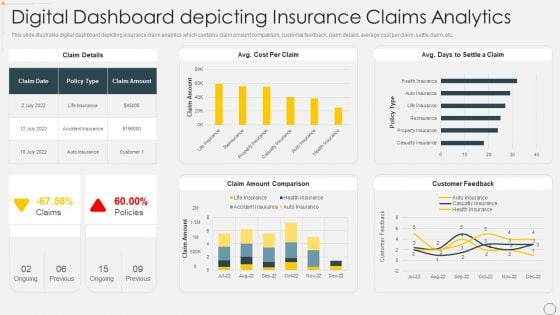
Digital Dashboard Depicting Insurance Claims Analytics Pictures PDF
This slide illustrates digital dashboard depicting insurance claim analytics which contains claim amount comparison, customer feedback, claim details, average cost per claim, settle claim, etc. Showcasing this set of slides titled Digital Dashboard Depicting Insurance Claims Analytics Pictures PDF. The topics addressed in these templates are Policy, Cost, Comparison. All the content presented in this PPT design is completely editable. Download it and make adjustments in color, background, font etc. as per your unique business setting.
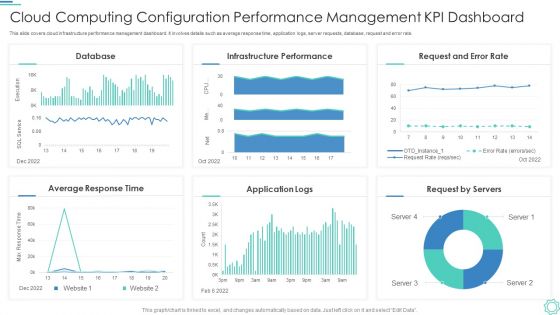
Cloud Computing Configuration Performance Management Kpi Dashboard Formats PDF
This slide covers cloud infrastructure performance management dashboard. It involves details such as average response time, application logs, server requests, database, request and error rate.Showcasing this set of slides titled Cloud Computing Configuration Performance Management Kpi Dashboard Formats PDF. The topics addressed in these templates are Database, Application Logs, Average Response Time. All the content presented in this PPT design is completely editable. Download it and make adjustments in color, background, font etc. as per your unique business setting.
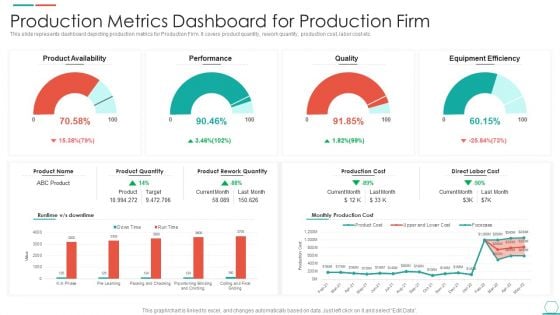
Production Metrics Dashboard For Production Firm Rules PDF
This slide represents dashboard depicting production metrics for Production Firm. It covers product quantity, rework quantity, production cost, labor cost etc. Showcasing this set of slides titled Production Metrics Dashboard For Production Firm Rules PDF. The topics addressed in these templates are Equipment Efficiency, Product Availability, Production Cost. All the content presented in this PPT design is completely editable. Download it and make adjustments in color, background, font etc. as per your unique business setting.
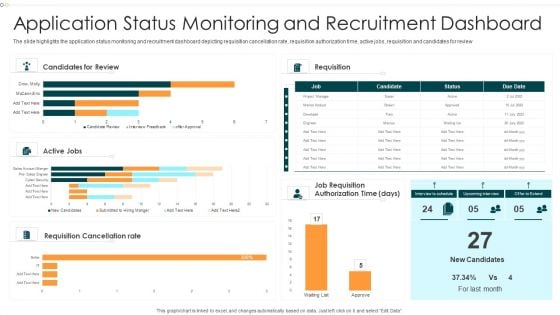
Application Status Monitoring And Recruitment Dashboard Professional PDF
The slide highlights the application status monitoring and recruitment dashboard depicting requisition cancellation rate, requisition authorization time, active jobs, requisition and candidates for review.Showcasing this set of slides titled Application Status Monitoring And Recruitment Dashboard Professional PDF The topics addressed in these templates are Requisition Cancellation, Requisition Authorization, Candidates Review All the content presented in this PPT design is completely editable. Download it and make adjustments in color, background, font etc. as per your unique business setting.
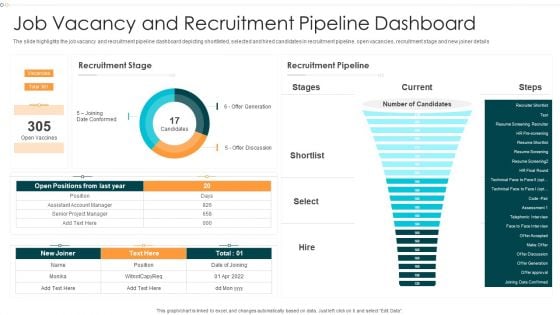
Job Vacancy And Recruitment Pipeline Dashboard Demonstration PDF
The slide highlights the job vacancy and recruitment pipeline dashboard depicting shortlisted, selected and hired candidates in recruitment pipeline, open vacancies, recruitment stage and new joiner details.Showcasing this set of slides titled Job Vacancy And Recruitment Pipeline Dashboard Demonstration PDF The topics addressed in these templates are Recruitment Stage, Recruitment Pipeline, Assistant Account All the content presented in this PPT design is completely editable. Download it and make adjustments in color, background, font etc. as per your unique business setting.
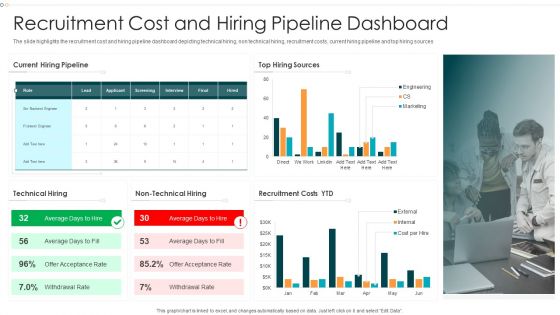
Recruitment Cost And Hiring Pipeline Dashboard Slides PDF
The slide highlights the recruitment cost and hiring pipeline dashboard depicting technical hiring, non technical hiring, recruitment costs, current hiring pipeline and top hiring sources.Showcasing this set of slides titled Recruitment Cost And Hiring Pipeline Dashboard Slides PDF The topics addressed in these templates are Technical Hiring, Recruitment Costs, Current Hiring All the content presented in this PPT design is completely editable. Download it and make adjustments in color, background, font etc. as per your unique business setting.
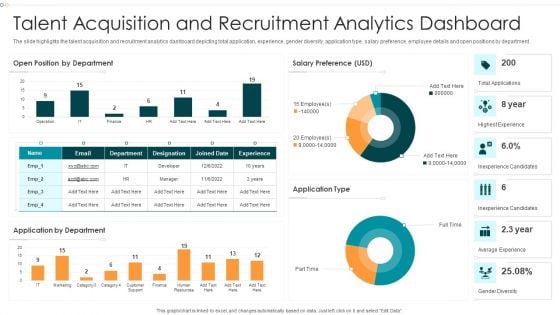
Talent Acquisition And Recruitment Analytics Dashboard Microsoft PDF
The slide highlights the talent acquisition and recruitment analytics dashboard depicting total application, experience, gender diversity, application type, salary preference, employee details and open positions by department.Showcasing this set of slides titled Talent Acquisition And Recruitment Analytics Dashboard Microsoft PDF The topics addressed in these templates are Highest Experience, Inexperience Candidates, Inexperience Candidates All the content presented in this PPT design is completely editable. Download it and make adjustments in color, background, font etc. as per your unique business setting.
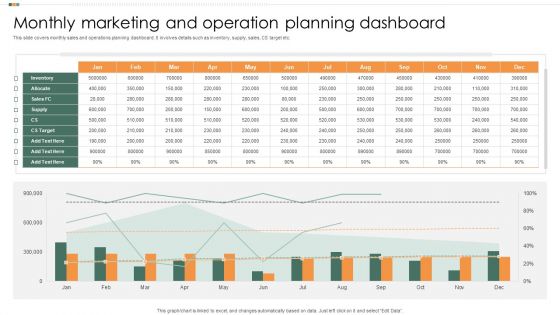
Monthly Marketing And Operation Planning Dashboard Rules PDF
This slide covers monthly sales and operations planning dashboard. It involves details such as inventory, supply, sales, CS target etc. Showcasing this set of slides titled Monthly Marketing And Operation Planning Dashboard Rules PDF. The topics addressed in these templates are Target, Sales, Supply. All the content presented in this PPT design is completely editable. Download it and make adjustments in color, background, font etc. as per your unique business setting.
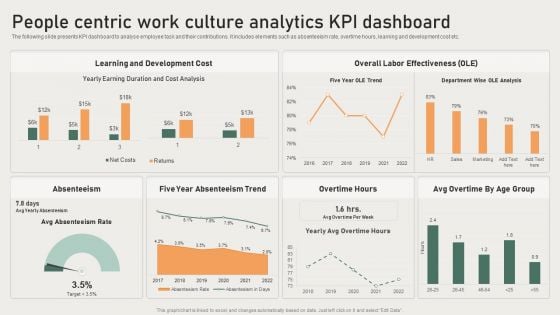
People Centric Work Cuture Analytics Kpi Dashboard Brochure PDF
The following slide presents KPI dashboard to analyse employee task and their contributions. It includes elements such as absenteeism rate, overtime hours, learning and development cost etc. Showcasing this set of slides titled People Centric Work Cuture Analytics Kpi Dashboard Brochure PDF. The topics addressed in these templates are Development Cost, Overall Labor Effectiveness, Absenteeism. All the content presented in this PPT design is completely editable. Download it and make adjustments in color, background, font etc. as per your unique business setting.
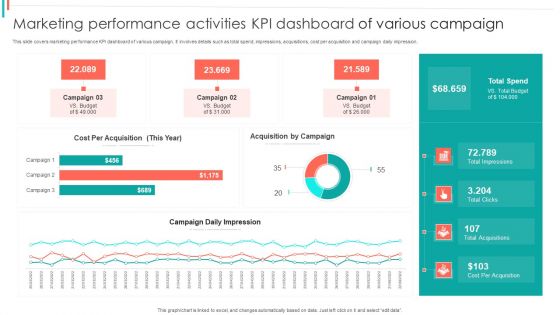
Marketing Performance Activities KPI Dashboard Of Various Campaign Microsoft PDF
This slide covers marketing performance KPI dashboard of various campaign. It involves details such as total spend, impressions, acquisitions, cost per acquisition and campaign daily impression.Showcasing this set of slides titled Marketing Performance Activities KPI Dashboard Of Various Campaign Microsoft PDF. The topics addressed in these templates are Acquisition Campaign, Campaign Impression, Total Impressions. All the content presented in this PPT design is completely editable. Download it and make adjustments in color, background, font etc. as per your unique business setting.
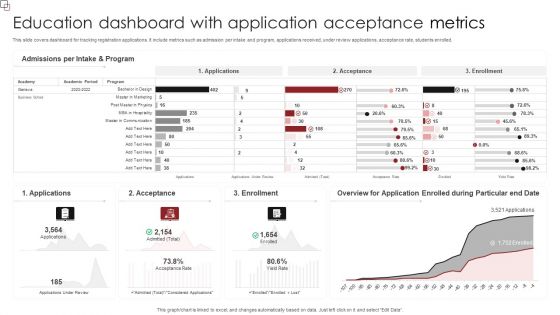
Education Dashboard With Application Acceptance Metrics Clipart PDF
This slide covers dashboard for tracking registration applications. It include metrics such as admission per intake and program, applications received, under review applications, acceptance rate, students enrolled. Showcasing this set of slides titled Education Dashboard With Application Acceptance Metrics Clipart PDF. The topics addressed in these templates are Admissions Per, Intake And Program, Enrollment. All the content presented in this PPT design is completely editable. Download it and make adjustments in color, background, font etc. as per your unique business setting.
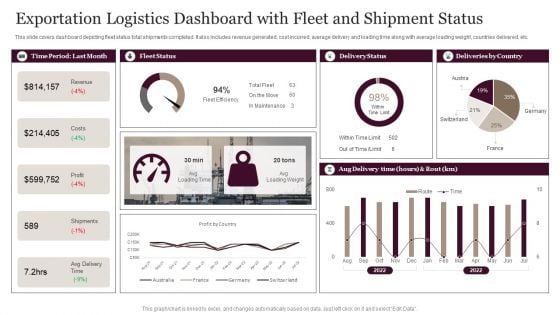
Exportation Logistics Dashboard With Fleet And Shipment Status Demonstration PDF
This slide covers dashboard depicting fleet status total shipments completed. It also includes revenue generated, cost incurred, average delivery and loading time along with average loading weight, countries delivered, etc. Showcasing this set of slides titled Exportation Logistics Dashboard With Fleet And Shipment Status Demonstration PDF. The topics addressed in these templates are Revenue, Costs, Profit. All the content presented in this PPT design is completely editable. Download it and make adjustments in color, background, font etc. as per your unique business setting.
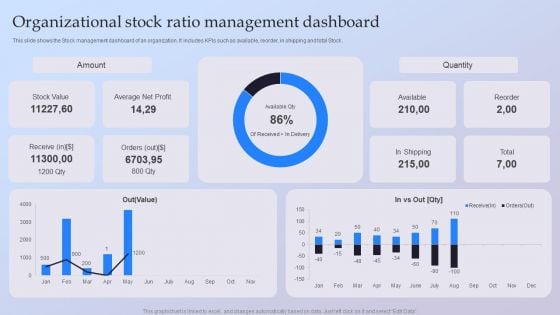
Organizational Stock Ratio Management Dashboard Ppt Layouts Outline PDF
This slide shows the Stock management dashboard of an organization. It includes KPIs such as available, reorder, in shipping and total Stock. Showcasing this set of slides titled Organizational Stock Ratio Management Dashboard Ppt Layouts Outline PDF. The topics addressed in these templates are Stock Value, Average Net Profit, Quantity, Available. All the content presented in this PPT design is completely editable. Download it and make adjustments in color, background, font etc. as per your unique business setting.

 Home
Home