Data Analysis Report
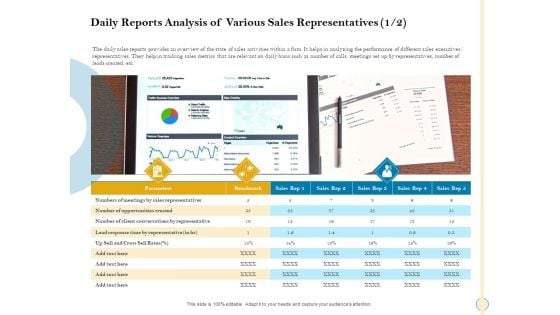
Sales Optimization Best Practices To Close More Deals Daily Reports Analysis Of Various Sales Representatives Client Professional PDF
The daily sales reports provides an overview of the state of sales activities within a firm. It helps in analyzing the performance of different sales executives or representatives. They help in tracking sales metrics that are relevant on daily basis such as number of calls, meetings set up by representatives, number of leads created, etc. This is a sales optimization best practices to close more deals daily reports analysis of various sales representatives client professional pdf template with various stages. Focus and dispense information on three stages using this creative set, that comes with editable features. It contains large content boxes to add your information on topics like cross sell rates, opportunities, sales, representatives, parameters. You can also showcase facts, figures, and other relevant content using this PPT layout. Grab it now.
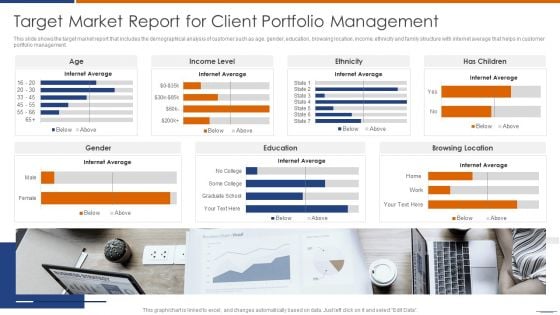
Target Market Report For Client Portfolio Management Brochure PDF
This slide shows the target market report that includes the demographical analysis of customer such as age, gender, education, browsing location, income, ethnicity and family structure with internet average that helps in customer portfolio management.Showcasing this set of slides titled Target Market Report For Client Portfolio Management Brochure PDF The topics addressed in these templates are Target Market, Report Client, Portfolio Management All the content presented in this PPT design is completely editable. Download it and make adjustments in color, background, font etc. as per your unique business setting.
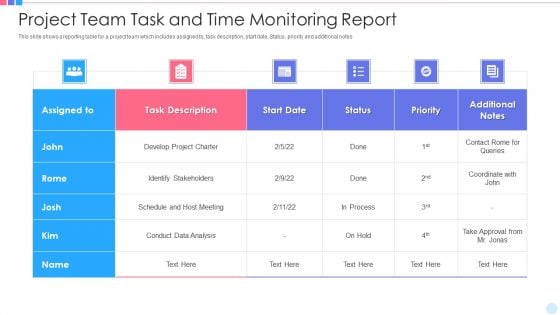
Project Team Task And Time Monitoring Report Topics PDF
This slide shows a reporting table for a project team which includes assigned to, task description, start date, Status, priority and additional notes Showcasing this set of slides titled project team task and time monitoring report topics pdf. The topics addressed in these templates are develop project charter, conduct data analysis. All the content presented in this PPT design is completely editable. Download it and make adjustments in color, background, font etc. as per your unique business setting.
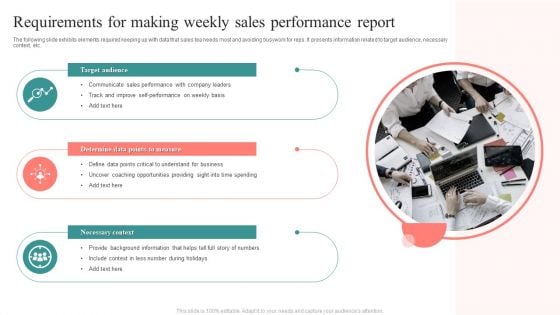
Requirements For Making Weekly Sales Performance Report Inspiration PDF
The following slide exhibits elements required keeping up with data that sales tea needs most and avoiding busywork for reps. It presents information related to target audience, necessary context, etc. Presenting Requirements For Making Weekly Sales Performance Report Inspiration PDF to dispense important information. This template comprises three stages. It also presents valuable insights into the topics including Target Audience, Determine Data, Points To Measure, Necessary Context. This is a completely customizable PowerPoint theme that can be put to use immediately. So, download it and address the topic impactfully.

Human Resource Monthly Report Powerpoint Ppt Template Bundles
This Human Resource Monthly Report Powerpoint Ppt Template Bundles is designed to help you retain your audiences attention. This content-ready PowerPoint Template enables you to take your audience on a journey and share information in a way that is easier to recall. It helps you highlight the crucial parts of your work so that the audience does not get saddled with information download. This twenty-slide PPT Deck comes prepared with the graphs and charts you could need to showcase your information through visuals. You only need to enter your own data in them. Download this editable PowerPoint Theme and walk into that meeting with confidence. The human resource monthly report powerpoint template bundles is ideal for sharing employee performance, recruitment data and workforce metrics. These templates ensure polished and professional presentation every time.
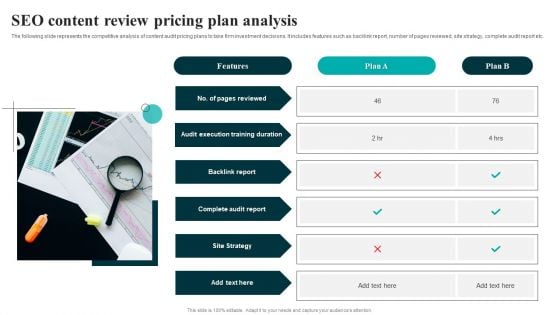
SEO Content Review Pricing Plan Analysis Slides PDF
The following slide represents the competitive analysis of content audit pricing plans to take firm investment decisions. It includes features such as backlink report, number of pages reviewed, site strategy, complete audit report etc. Presenting SEO Content Review Pricing Plan Analysis Slides PDF to dispense important information. This template comprises One stage. It also presents valuable insights into the topics including Backlink Report, Complete Audit Report, Site Strategy. This is a completely customizable PowerPoint theme that can be put to use immediately. So, download it and address the topic impactfully.
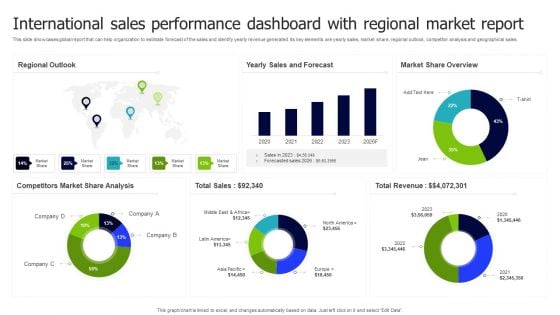
International Sales Performance Dashboard With Regional Market Report Inspiration PDF
This slide showcases global report that can help organization to estimate forecast of the sales and identify yearly revenue generated. Its key elements are yearly sales, market share, regional outlook, competitor analysis and geographical sales. Pitch your topic with ease and precision using this International Sales Performance Dashboard With Regional Market Report Inspiration PDF. This layout presents information on Regional Outlook, Sales And Forecast, Market Share Overview. It is also available for immediate download and adjustment. So, changes can be made in the color, design, graphics or any other component to create a unique layout.
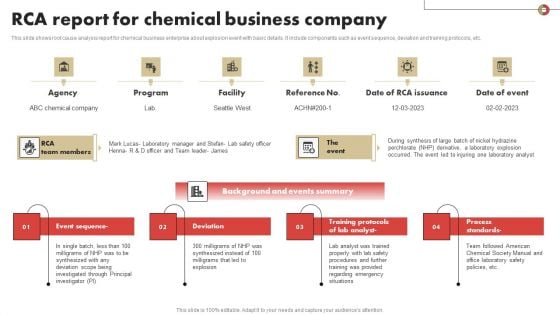
RCA Report For Chemical Business Company Introduction PDF
This slide shows root cause analysis report for chemical business enterprise about explosion event with basic details. It include components such as event sequence, deviation and training protocols, etc. Presenting RCA Report For Chemical Business Company Introduction PDF Graphics to dispense important information. This template comprises four stages. It also presents valuable insights into the topics including Training Protocols, Process Standards, Event Sequence. This is a completely customizable PowerPoint theme that can be put to use immediately. So, download it and address the topic impactfully.
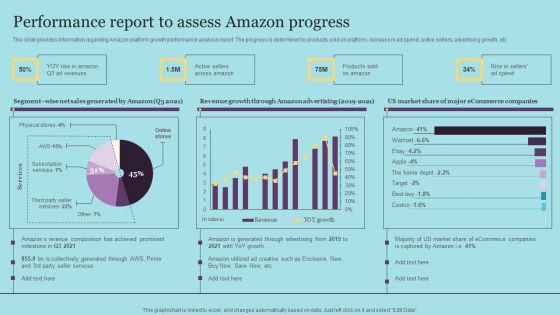
Performance Report To Assess Amazon Progress Formats PDF
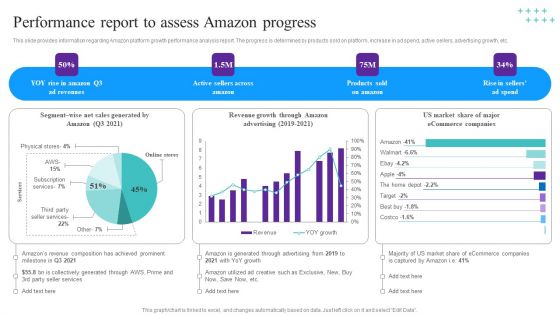
This slide provides information regarding Amazon platform growth performance analysis report. The progress is determined by products sold on platform, increase in ad spend, active sellers, advertising growth, etc. From laying roadmaps to briefing everything in detail, our templates are perfect for you. You can set the stage with your presentation slides. All you have to do is download these easy-to-edit and customizable templates. Performance Report To Assess Amazon Progress Formats PDF will help you deliver an outstanding performance that everyone would remember and praise you for. Do download this presentation today.
Performance Report To Assess Amazon Progress Background PDF
This slide provides information regarding Amazon platform growth performance analysis report. The progress is determined by products sold on platform, increase in ad spend, active sellers, advertising growth, etc. From laying roadmaps to briefing everything in detail, our templates are perfect for you. You can set the stage with your presentation slides. All you have to do is download these easy-to-edit and customizable templates. Performance Report To Assess Amazon Progress Background PDF will help you deliver an outstanding performance that everyone would remember and praise you for. Do download this presentation today.
Qualitative Assessment Report For Ecommerce Business Ppt Professional Deck PDF
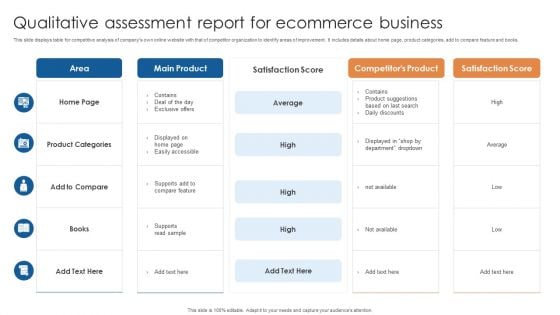
This slide displays table for competitive analysis of companys own online website with that of competitor organization to identify areas of improvement. It includes details about home page, product categories, add to compare feature and books. Pitch your topic with ease and precision using this Qualitative Assessment Report For Ecommerce Business Ppt Professional Deck PDF. This layout presents information on Home Page, Main Product, Product Categories. It is also available for immediate download and adjustment. So, changes can be made in the color, design, graphics or any other component to create a unique layout.

Business Referral Marketing Program Analytics Report Summary PDF
This slide shows the analysis of business referral program conducted by the organization in order to track the level of customer satisfaction. It includes details related to source, sessions, new sessions percentage and users, bounce rate, page or session and average session duration. Pitch your topic with ease and precision using this Business Referral Marketing Program Analytics Report Summary PDF. This layout presents information on Acquisitions, Behavior, Source, Bounce Rate. It is also available for immediate download and adjustment. So, changes can be made in the color, design, graphics or any other component to create a unique layout.
Sales Target Metrics Report With Metrics Introduction PDF
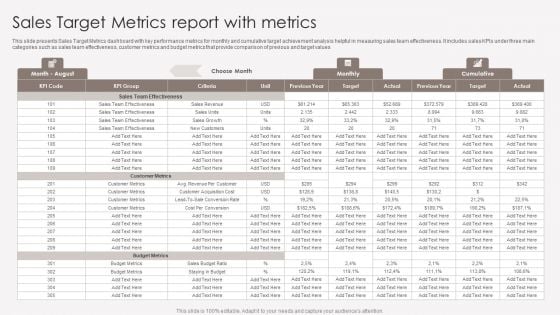
This slide presents Sales Target Metrics dashboard with key performance metrics for monthly and cumulative target achievement analysis helpful in measuring sales team effectiveness. It includes sales KPIs under three main categories such as sales team effectiveness, customer metrics and budget metrics that provide comparison of previous and target values. Pitch your topic with ease and precision using this Sales Target Metrics Report With Metrics Introduction PDF. This layout presents information on Sales Team Effectiveness, Customer Metrics, Budget Metrics. It is also available for immediate download and adjustment. So, changes can be made in the color, design, graphics or any other component to create a unique layout.
Malware Assessment Challenges Survey Result Report Slides PDF
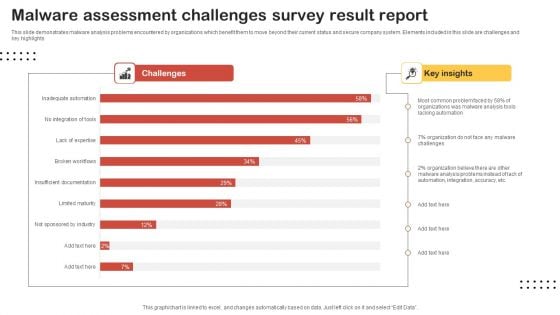
This slide demonstrates malware analysis problems encountered by organizations which benefit them to move beyond their current status and secure company system. Elements included in this slide are challenges and key highlights. Showcasing this set of slides titled Malware Assessment Challenges Survey Result Report Slides PDF. The topics addressed in these templates are Most Common Problem, Organization, Malware Challenges. All the content presented in this PPT design is completely editable. Download it and make adjustments in color, background, font etc. as per your unique business setting.
Approaches For Tracking Weekly Sales Performance Report Brochure PDF
The following slide exhibits approaches which helps in tracking data and metrics in sales report. It presents information related to size deal, conversion rate, etc. Presenting Approaches For Tracking Weekly Sales Performance Report Brochure PDF to dispense important information. This template comprises five stages. It also presents valuable insights into the topics including Conversion Rate, Average Size Deal, Sales Cycle Length. This is a completely customizable PowerPoint theme that can be put to use immediately. So, download it and address the topic impactfully.
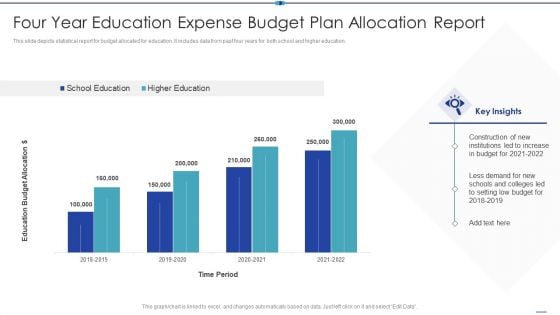
Four Year Education Expense Budget Plan Allocation Report Sample PDF
This slide depicts statistical report for budget allocated for education. It includes data from past four years for both school and higher education.Pitch your topic with ease and precision using this Four Year Education Expense Budget Plan Allocation Report Sample PDF This layout presents information on Institutions Increase, Less Demand, Education Budget It is also available for immediate download and adjustment. So, changes can be made in the color, design, graphics or any other component to create a unique layout.
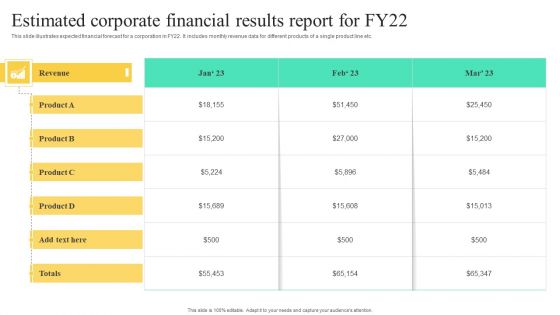
Estimated Corporate Financial Results Report For Fy22 Ideas PDF
This slide illustrates expected financial forecast for a corporation in FY22. It includes monthly revenue data for different products of a single product line etc. Showcasing this set of slides titled Estimated Corporate Financial Results Report For Fy22 Ideas PDF. The topics addressed in these templates are Estimated Corporate, Financial, Results Report. All the content presented in this PPT design is completely editable. Download it and make adjustments in color, background, font etc. as per your unique business setting.
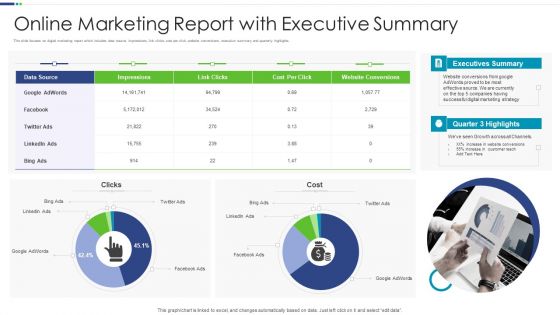
Online Marketing Report With Executive Summary Designs PDF
This slide focuses on digital marketing report which includes data source, impressions, link clicks, cost per click, website conversions, executive summary and quarterly highlights.Pitch your topic with ease and precision using this Online Marketing Report With Executive Summary Designs PDF This layout presents information on Executives Summary, Digital Marketing, Conversions It is also available for immediate download and adjustment. So, changes can be made in the color, design, graphics or any other component to create a unique layout.
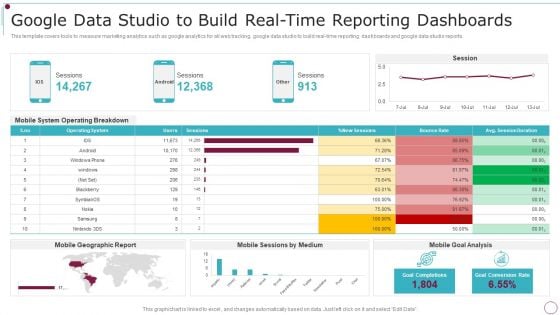
Playbook For Content Advertising Google Data Studio To Build Real Time Reporting Dashboards Formats PDF
This template covers tools to measure marketing analytics such as google analytics for all web tracking, google data studio to build real-time reporting dashboards and google data studio reports. Deliver and pitch your topic in the best possible manner with this Playbook For Content Advertising Google Data Studio To Build Real Time Reporting Dashboards Formats PDF. Use them to share invaluable insights on Mobile System, Operating Breakdown, Geographic Report and impress your audience. This template can be altered and modified as per your expectations. So, grab it now.
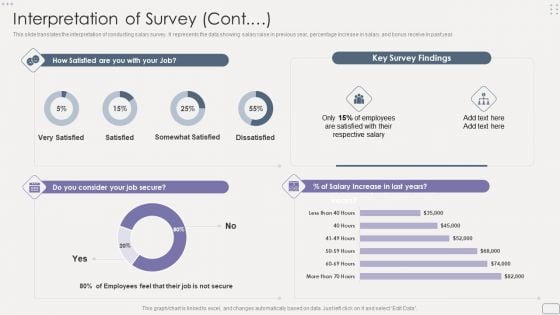
Income Assessment Report Interpretation Of Survey Contd Portrait PDF
This slide translates the interpretation of conducting salary survey. It represents the data showing salary raise in previous year, percentage increase in salary, and bonus receive in past year.Deliver and pitch your topic in the best possible manner with this Income Assessment Report Interpretation Of Survey Contd Portrait PDF. Use them to share invaluable insights on Increment Criteria, Projected Increment, Middle Management and impress your audience. This template can be altered and modified as per your expectations. So, grab it now.
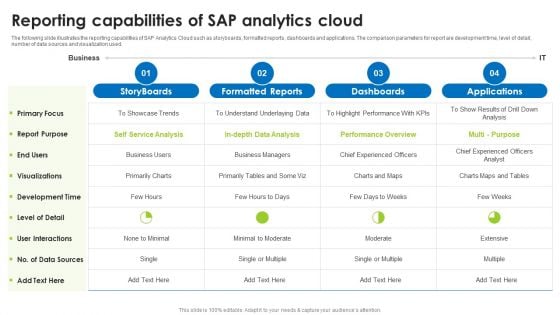
BI Technique For Data Informed Decisions Reporting Capabilities Of Sap Analytics Cloud Demonstration PDF
The following slide illustrates the reporting capabilities of SAP Analytics Cloud such as storyboards, formatted reports, dashboards and applications. The comparison parameters for report are development time, level of detail, number of data sources and visualization used. Make sure to capture your audiences attention in your business displays with our gratis customizable BI Technique For Data Informed Decisions Reporting Capabilities Of Sap Analytics Cloud Demonstration PDF. These are great for business strategies, office conferences, capital raising or task suggestions. If you desire to acquire more customers for your tech business and ensure they stay satisfied, create your own sales presentation with these plain slides.
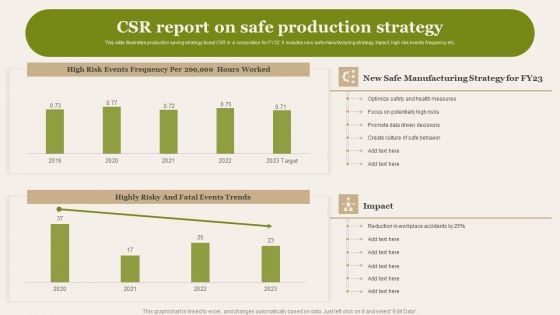
CSR Report On Safe Production Strategy Demonstration PDF
This slide illustrates production saving strategy boost CSR in a corporation for FY22. It includes new safe manufacturing strategy, impact, high risk events frequency etc. Showcasing this set of slides titled CSR Report On Safe Production Strategy Demonstration PDF. The topics addressed in these templates are Optimize Safety, Potentially High Risks, Promote Data Driven Decisions. All the content presented in this PPT design is completely editable. Download it and make adjustments in color, background, font etc. as per your unique business setting.
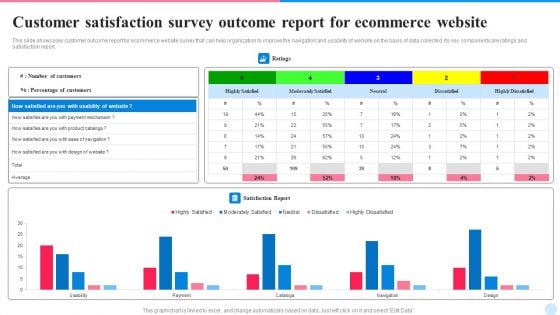
Customer Satisfaction Survey Outcome Report For Ecommerce Website Themes PDF
This slide showcases customer outcome report for ecommerce website survey that can help organization to improve the navigation and usability of website on the basis of data collected. Its key components are ratings and satisfaction report. Pitch your topic with ease and precision using this Customer Satisfaction Survey Outcome Report For Ecommerce Website Themes PDF. This layout presents information on Customer Satisfaction, Survey Outcome Report, Ecommerce Website. It is also available for immediate download and adjustment. So, changes can be made in the color, design, graphics or any other component to create a unique layout.
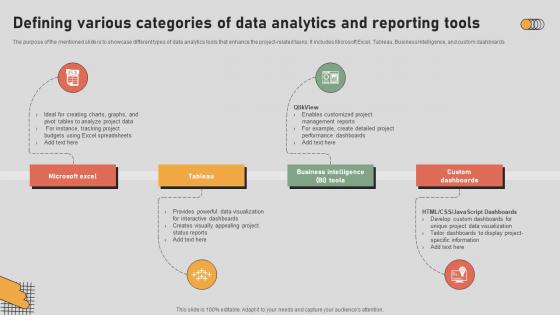
The Digital Project Managers Defining Various Categories Of Data Analytics And Reporting Tools
The purpose of the mentioned slide is to showcase different types of data analytics tools that enhance the project-related tasks. It includes Microsoft Excel, Tableau, Business Intelligence, and custom dashboards. If your project calls for a presentation, then Slidegeeks is your go-to partner because we have professionally designed, easy-to-edit templates that are perfect for any presentation. After downloading, you can easily edit The Digital Project Managers Defining Various Categories Of Data Analytics And Reporting Tools and make the changes accordingly. You can rearrange slides or fill them with different images. Check out all the handy templates The purpose of the mentioned slide is to showcase different types of data analytics tools that enhance the project-related tasks. It includes Microsoft Excel, Tableau, Business Intelligence, and custom dashboards.
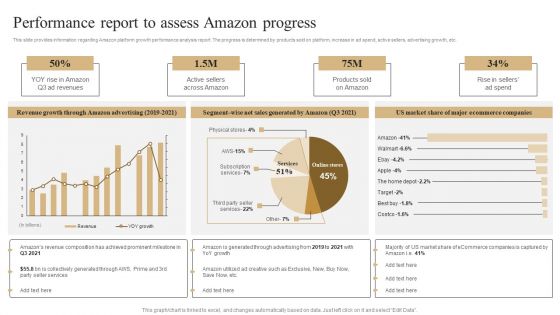
Performance Report To Assess Amazon Progress Template PDF
This slide provides information regarding Amazon platform growth performance analysis report. The progress is determined by products sold on platform, increase in ad spend, active sellers, advertising growth, etc. Coming up with a presentation necessitates that the majority of the effort goes into the content and the message you intend to convey. The visuals of a PowerPoint presentation can only be effective if it supplements and supports the story that is being told. Keeping this in mind our experts created Performance Report To Assess Amazon Progress Template PDF to reduce the time that goes into designing the presentation. This way, you can concentrate on the message while our designers take care of providing you with the right template for the situation.
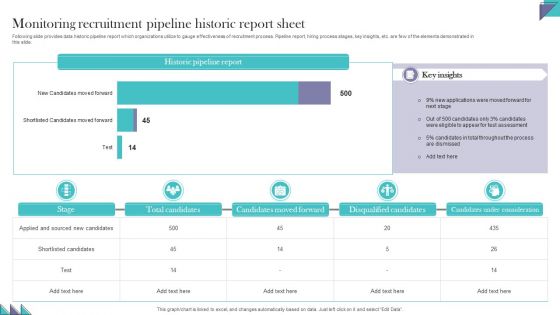
Monitoring Recruitment Pipeline Historic Report Sheet Pictures PDF
Following slide provides data historic pipeline report which organizations utilize to gauge effectiveness of recruitment process. Pipeline report, hiring process stages, key insights, etc. are few of the elements demonstrated in this slide. Pitch your topic with ease and precision using this Monitoring Recruitment Pipeline Historic Report Sheet Pictures PDF. This layout presents information on Candidates Moved Forward, Disqualified Candidates, Candidates Under Consideration. It is also available for immediate download and adjustment. So, changes can be made in the color, design, graphics or any other component to create a unique layout
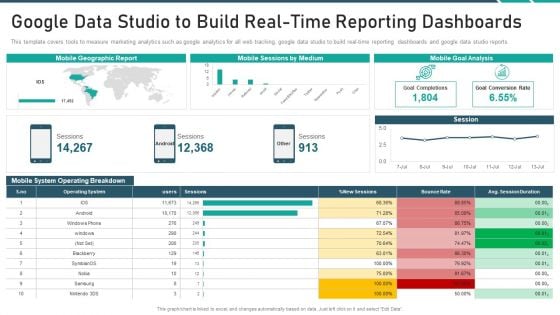
Online Promotion Playbook Google Data Studio To Build Real Time Reporting Dashboards Topics PDF
This template covers tools to measure marketing analytics such as google analytics for all web tracking, google data studio to build real time reporting dashboards and google data studio reports. Deliver and pitch your topic in the best possible manner with this online promotion playbook google data studio to build real time reporting dashboards topics pdf. Use them to share invaluable insights on google data studio to build real time reporting dashboards and impress your audience. This template can be altered and modified as per your expectations. So, grab it now.
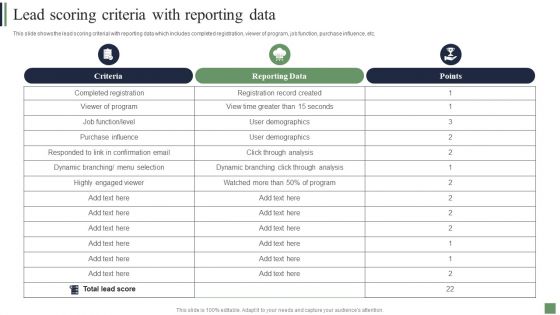
Customer Acquisition Strategies Lead Scoring Criteria With Reporting Data Mockup PDF
This slide shows the lead scoring criterial with reporting data which includes completed registration, viewer of program, job function, purchase influence, etc. Deliver and pitch your topic in the best possible manner with this Customer Acquisition Strategies Lead Scoring Criteria With Reporting Data Mockup PDF. Use them to share invaluable insights on Criteria, Reporting Data, Reporting Data and impress your audience. This template can be altered and modified as per your expectations. So, grab it now.
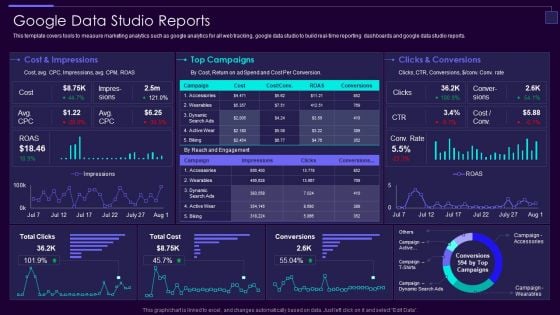
Social Media Brand Promotion Instructions Playbook Google Data Studio Reports Formats PDF
This template covers tools to measure marketing analytics such as google analytics for all web tracking, google data studio to build real-time reporting dashboards and google data studio reports.Deliver an awe inspiring pitch with this creative Social Media Brand Promotion Instructions Playbook Google Data Studio Reports Formats PDF bundle. Topics like Conversions, Cost And Impressions, Top Campaigns can be discussed with this completely editable template. It is available for immediate download depending on the needs and requirements of the user.
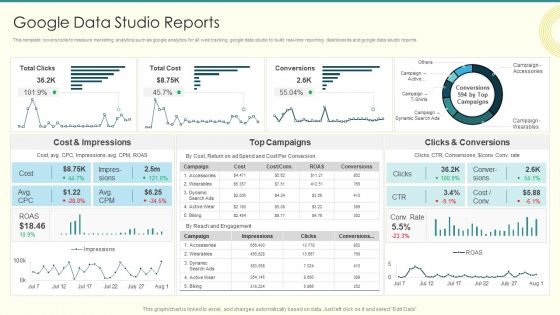
Security And Performance Digital Marketing Google Data Studio Reports Brochure PDF
This template covers tools to measure marketing analytics such as google analytics for all web tracking, google data studio to build real-time reporting dashboards and google data studio reports.Deliver an awe inspiring pitch with this creative Security And Performance Digital Marketing Google Data Studio Reports Brochure PDF bundle. Topics like Impressions, Clicks Conversions, Cost Impressions can be discussed with this completely editable template. It is available for immediate download depending on the needs and requirements of the user.
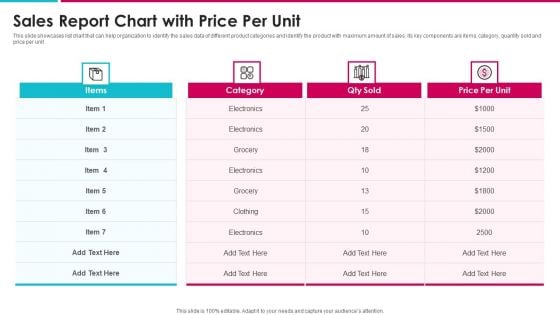
Sales Report Chart With Price Per Unit Information PDF
This slide showcases list chart that can help organization to identify the sales data of different product categories and identify the product with maximum amount of sales. Its key components are items, category, quantity sold and price per unit Showcasing this set of slides titled sales report chart with price per unit information pdf. The topics addressed in these templates are sales report chart with price per unit. All the content presented in this PPT design is completely editable. Download it and make adjustments in color, background, font etc. as per your unique business setting.
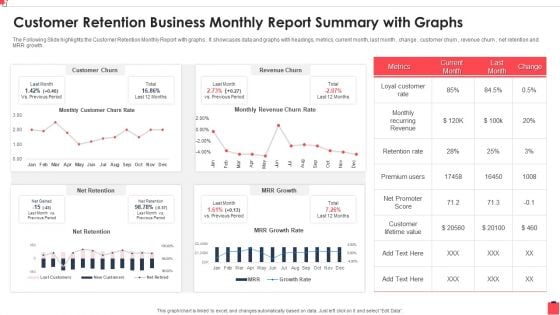
Customer Retention Business Monthly Report Summary With Graphs Guidelines PDF
The Following Slide highlights the Customer Retention Monthly Report with graphs . It showcases data and graphs with headings, metrics, current month, last month , change , customer churn , revenue churn , net retention and MRR growth. Showcasing this set of slides titled Customer Retention Business Monthly Report Summary With Graphs Guidelines PDF The topics addressed in these templates are Recurring Revenue, Customer Churn, Promoter Score All the content presented in this PPT design is completely editable. Download it and make adjustments in color, background, font etc. as per your unique business setting.
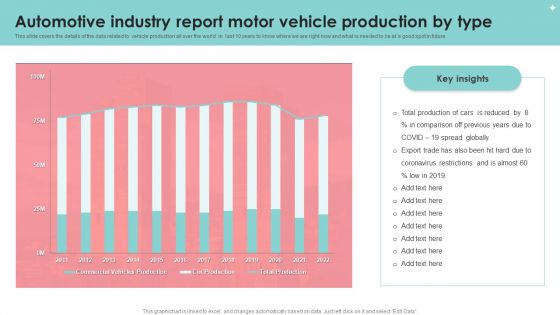
Automotive Industry Report Motor Vehicle Production By Type Portrait PDF
This slide covers the details of the data related to vehicle production all over the world in last 10 years to know where we are right now and what is needed to be at a good spot in future. Pitch your topic with ease and precision using this Automotive Industry Report Motor Vehicle Production By Type Portrait PDF. This layout presents information on Automotive Industry Report, Motor Vehicle Production. It is also available for immediate download and adjustment. So, changes can be made in the color, design, graphics or any other component to create a unique layout.
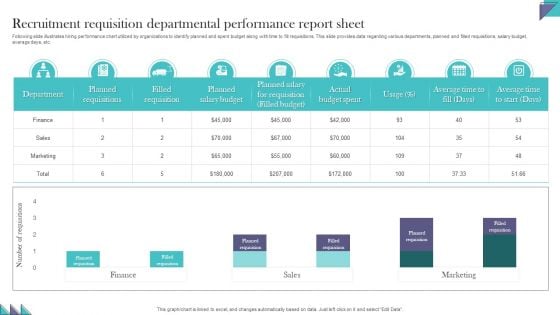
Recruitment Requisition Departmental Performance Report Sheet Demonstration PDF
Following slide illustrates hiring performance chart utilized by organizations to identify planned and spent budget along with time to fill requisitions. This slide provides data regarding various departments, planned and filled requisitions, salary budget, average days, etc. Pitch your topic with ease and precision using this Recruitment Requisition Departmental Performance Report Sheet Demonstration PDF. This layout presents information on Recruitment Requisition, Departmental Performance, Report Sheet. It is also available for immediate download and adjustment. So, changes can be made in the color, design, graphics or any other component to create a unique layout.
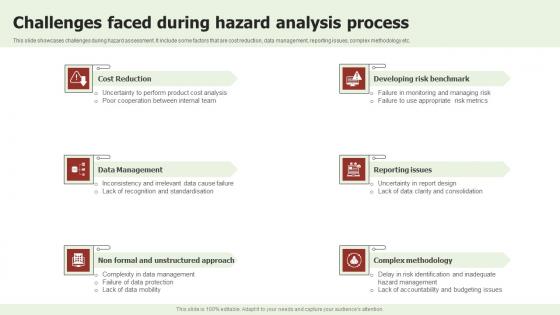
Challenges Faced During Hazard Analysis Process Structure Pdf
This slide showcases challenges during hazard assessment. It include some factors that are cost reduction, data management, reporting issues, complex methodology etc. Showcasing this set of slides titled Challenges Faced During Hazard Analysis Process Structure Pdf. The topics addressed in these templates are Cost Reduction, Data Management, Reporting Issues. All the content presented in this PPT design is completely editable. Download it and make adjustments in color, background, font etc. as per your unique business setting. This slide showcases challenges during hazard assessment. It include some factors that are cost reduction, data management, reporting issues, complex methodology etc.

Security And Performance Digital Marketing Google Data Studio To Build Realtime Reporting Dashboards Information PDF
This template covers tools to measure marketing analytics such as google analytics for all web tracking, google data studio to build real time reporting dashboards and google data studio reports.Deliver an awe inspiring pitch with this creative Security And Performance Digital Marketing Google Data Studio To Build Realtime Reporting Dashboards Information PDF bundle. Topics like Operating Breakdown, Session Duration, Goal Completions can be discussed with this completely editable template. It is available for immediate download depending on the needs and requirements of the user.
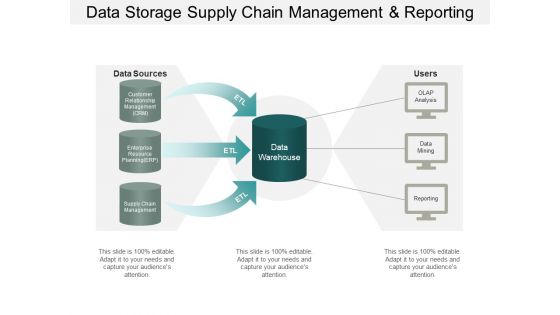
Data Storage Supply Chain Management And Reporting Ppt PowerPoint Presentation Outline
This is a data storage supply chain management and reporting ppt powerpoint presentation outline. This is a six stage process. The stages in this process are transform and load, data wore housing, etl, extract.
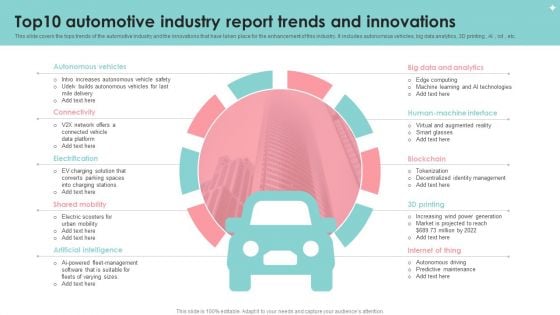
Top10 Automotive Industry Report Trends And Innovations Pictures PDF
This slide covers the tops trends of the automotive industry and the innovations that have taken place for the enhancement of this industry. It includes autonomous vehicles, big data analytics, 3D printing , AI , iot , etc. Persuade your audience using this Top10 Automotive Industry Report Trends And Innovations Pictures PDF. This PPT design covers ten stages, thus making it a great tool to use. It also caters to a variety of topics including Connectivity, Shared Mobility, Electrification. Download this PPT design now to present a convincing pitch that not only emphasizes the topic but also showcases your presentation skills.
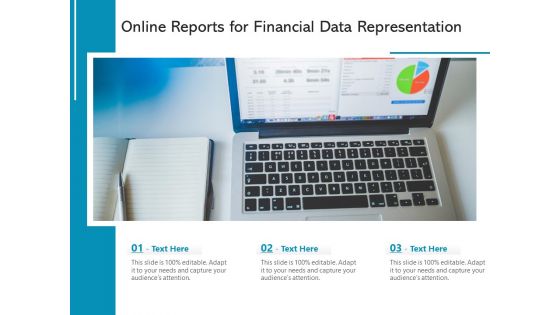
Online Reports For Financial Data Representation Ppt PowerPoint Presentation Professional Picture PDF
Presenting online reports for financial data representation ppt powerpoint presentation professional picture pdf to dispense important information. This template comprises three stages. It also presents valuable insights into the topics including online reports for financial data representation. This is a completely customizable PowerPoint theme that can be put to use immediately. So, download it and address the topic impactfully.
Data Collection Tools And Techniques With Financial Reports Ppt PowerPoint Presentation Icon Example File PDF
Persuade your audience using this data collection tools and techniques with financial reports ppt powerpoint presentation icon example file pdf. This PPT design covers two stages, thus making it a great tool to use. It also caters to a variety of topics including government report, sales reports, financial reports. Download this PPT design now to present a convincing pitch that not only emphasizes the topic but also showcases your presentation skills.
Real Time Data Processing For Monitoring And Reporting Ppt PowerPoint Presentation Gallery Display PDF
Presenting this set of slides with name real time data processing for monitoring and reporting ppt powerpoint presentation gallery display pdf. This is a three stage process. The stages in this process are real time data processing for monitoring and reporting. This is a completely editable PowerPoint presentation and is available for immediate download. Download now and impress your audience.
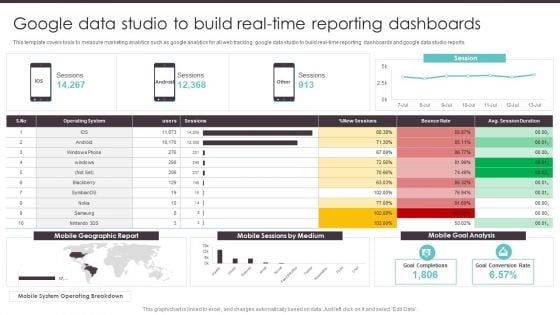
Business To Business Digital Google Data Studio To Build Real Time Reporting Summary PDF
This template covers tools to measure marketing analytics such as google analytics for all web tracking, google data studio to build real-time reporting dashboards and google data studio reports. Find highly impressive Business To Business Digital Google Data Studio To Build Real Time Reporting Summary PDF on Slidegeeks to deliver a meaningful presentation. You can save an ample amount of time using these presentation templates. No need to worry to prepare everything from scratch because Slidegeeks experts have already done a huge research and work for you. You need to download Business To Business Digital Google Data Studio To Build Real Time Reporting Summary PDF for your upcoming presentation. All the presentation templates are 100 percent editable and you can change the color and personalize the content accordingly. Download now.

Executive Report Ppt PowerPoint Presentation Complete Deck With Slides
This Executive Report Ppt PowerPoint Presentation Complete Deck With Slides is designed to help you retain your audiences attention. This content ready PowerPoint Template enables you to take your audience on a journey and share information in a way that is easier to recall. It helps you highlight the crucial parts of your work so that the audience does not get saddled with information download. This fourteen slide PPT Deck comes prepared with the graphs and charts you could need to showcase your information through visuals. You only need to enter your own data in them. Download this editable PowerPoint Theme and walk into that meeting with confidence.
CSR Report On Employees Statistics During Pandemic Icons PDF
This slide illustrates data related to CSR human resources of a corporation. It includes global employees, dough-nut chart of North American employees, global employees by age etc. Showcasing this set of slides titled CSR Report On Employees Statistics During Pandemic Icons PDF. The topics addressed in these templates are Global Employees, Supporting Workforce Transformation, Employees Statistics During Pandemic. All the content presented in this PPT design is completely editable. Download it and make adjustments in color, background, font etc. as per your unique business setting.

Quarterly Recruitment Report Sheet Status For Various Departments Portrait PDF
Following slide demonstrates quarterly hiring status which assist organizations to assess overall success of recruitment campaign and identify areas for improvement. This slide provides data regarding various organizational departments, job position and four quarters. Pitch your topic with ease and precision using this Quarterly Recruitment Report Sheet Status For Various Departments Portrait PDF. This layout presents information on Sales And Marketing, Human Resource, Research And Development, Production, Finance, Engineering. It is also available for immediate download and adjustment. So, changes can be made in the color, design, graphics or any other component to create a unique layout.
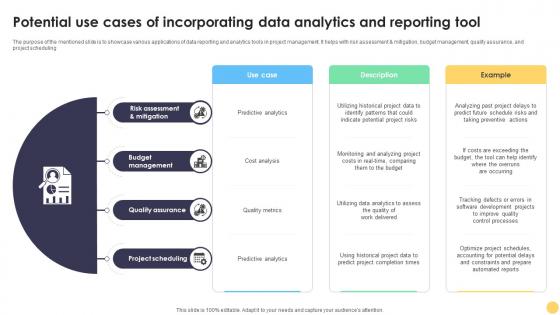
Digital Project Management Strategies Potential Use Cases Of Incorporating Data Analytics And Reporting
The purpose of the mentioned slide is to showcase various applications of data reporting and analytics tools in project management. It helps with risk assessment and mitigation, budget management, quality assurance, and project scheduling. The Digital Project Management Strategies Potential Use Cases Of Incorporating Data Analytics And Reporting is a compilation of the most recent design trends as a series of slides. It is suitable for any subject or industry presentation, containing attractive visuals and photo spots for businesses to clearly express their messages. This template contains a variety of slides for the user to input data, such as structures to contrast two elements, bullet points, and slides for written information. Slidegeeks is prepared to create an impression. The purpose of the mentioned slide is to showcase various applications of data reporting and analytics tools in project management. It helps with risk assessment and mitigation, budget management, quality assurance, and project scheduling.
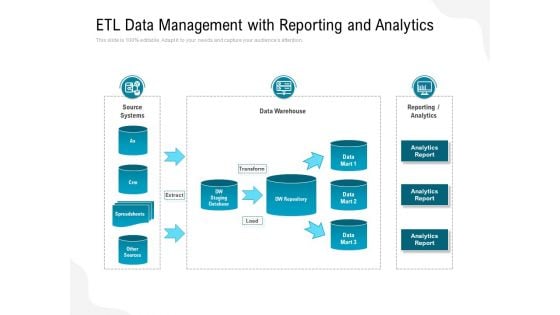
ETL Data Management With Reporting And Analytics Ppt PowerPoint Presentation Gallery Slide Download PDF
Pitch your topic with ease and precision using this etl data management with reporting and analytics ppt powerpoint presentation gallery slide download pdf. This layout presents information on source systems, data warehouse, analytics. It is also available for immediate download and adjustment. So, changes can be made in the color, design, graphics or any other component to create a unique layout.
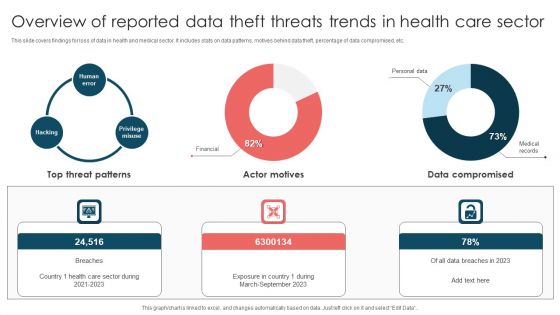
Overview Of Reported Data Theft Threats Trends In Health Care Sector Introduction PDF
This slide covers findings for loss of data in health and medical sector. It includes stats on data patterns, motives behind data theft, percentage of data compromised, etc. Pitch your topic with ease and precision using this Overview Of Reported Data Theft Threats Trends In Health Care Sector Introduction PDF. This layout presents information on Top Threat Patterns, Exposure Country, March To September 2023. It is also available for immediate download and adjustment. So, changes can be made in the color, design, graphics or any other component to create a unique layout.
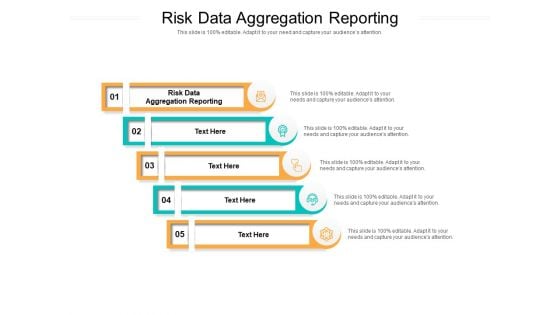
Risk Data Aggregation Reporting Ppt PowerPoint Presentation Gallery Structure Cpb Pdf
Presenting this set of slides with name risk data aggregation reporting ppt powerpoint presentation gallery structure cpb pdf. This is an editable Powerpoint five stages graphic that deals with topics like risk data aggregation reporting to help convey your message better graphically. This product is a premium product available for immediate download and is 100 percent editable in Powerpoint. Download this now and use it in your presentations to impress your audience.
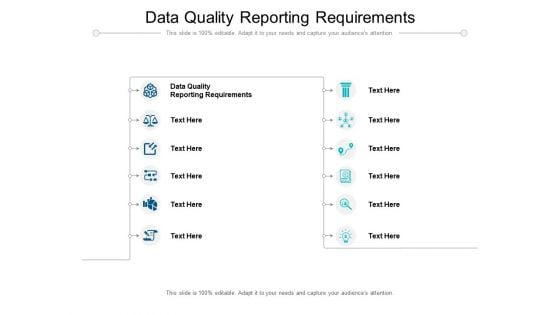
Data Quality Reporting Requirements Ppt PowerPoint Presentation Portfolio Introduction Cpb Pdf
Presenting this set of slides with name data quality reporting requirements ppt powerpoint presentation portfolio introduction cpb pdf. This is an editable Powerpoint twelve stages graphic that deals with topics like data quality reporting requirements to help convey your message better graphically. This product is a premium product available for immediate download and is 100 percent editable in Powerpoint. Download this now and use it in your presentations to impress your audience.
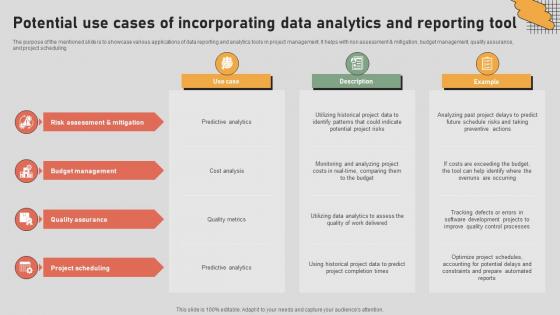
The Digital Project Managers Potential Use Cases Of Incorporating Data Analytics And Reporting
The purpose of the mentioned slide is to showcase various applications of data reporting and analytics tools in project management. It helps with risk assessment and mitigation, budget management, quality assurance, and project scheduling. Presenting this PowerPoint presentation, titled The Digital Project Managers Potential Use Cases Of Incorporating Data Analytics And Reporting, with topics curated by our researchers after extensive research. This editable presentation is available for immediate download and provides attractive features when used. Download now and captivate your audience. Presenting this The Digital Project Managers Potential Use Cases Of Incorporating Data Analytics And Reporting. Our researchers have carefully researched and created these slides with all aspects taken into consideration. This is a completely customizable The Digital Project Managers Potential Use Cases Of Incorporating Data Analytics And Reporting that is available for immediate downloading. Download now and make an impact on your audience. Highlight the attractive features available with our PPTs. The purpose of the mentioned slide is to showcase various applications of data reporting and analytics tools in project management. It helps with risk assessment and mitigation, budget management, quality assurance, and project scheduling.
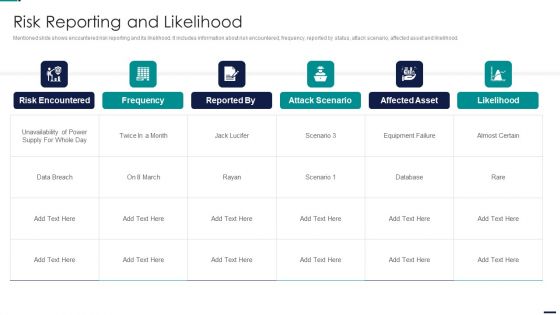
Risk Management Model For Data Security Risk Reporting And Likelihood Infographics PDF
Mentioned slide shows encountered risk reporting and its likelihood. It includes information about risk encountered, frequency, reported by status, attack scenario, affected asset and likelihood. Deliver an awe inspiring pitch with this creative Risk Management Model For Data Security Risk Reporting And Likelihood Infographics PDF bundle. Topics like Risk Encountered, Frequency, Attack Scenario, Affected Asset can be discussed with this completely editable template. It is available for immediate download depending on the needs and requirements of the user.
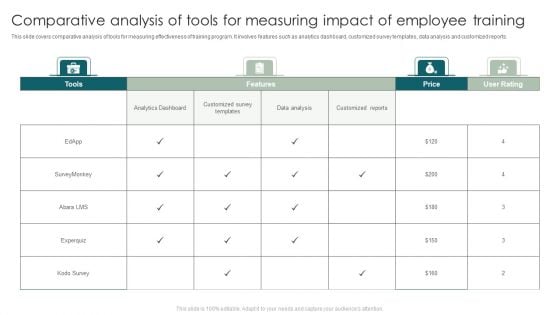
Comparative Analysis Of Tools For Measuring Impact Of Employee Training Template PDF
This slide covers comparative analysis of tools for measuring effectiveness of training program. It involves features such as analytics dashboard, customized survey templates, data analysis and customized reports. Showcasing this set of slides titled Comparative Analysis Of Tools For Measuring Impact Of Employee Training Template PDF. The topics addressed in these templates are Analytics Dashboard, Customized Survey Templates, Data Analysis. All the content presented in this PPT design is completely editable. Download it and make adjustments in color, background, font etc. as per your unique business setting.
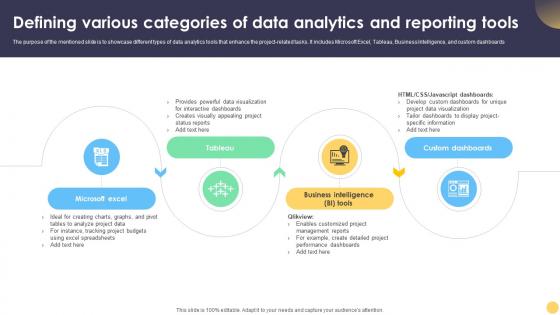
Digital Project Management Strategies Defining Various Categories Of Data Analytics And Reporting
The purpose of the mentioned slide is to showcase different types of data analytics tools that enhance the project-related tasks. It includes Microsoft Excel, Tableau, Business Intelligence, and custom dashboards. Slidegeeks is here to make your presentations a breeze with Digital Project Management Strategies Defining Various Categories Of Data Analytics And Reporting With our easy-to-use and customizable templates, you can focus on delivering your ideas rather than worrying about formatting. With a variety of designs to choose from, you are sure to find one that suits your needs. And with animations and unique photos, illustrations, and fonts, you can make your presentation pop. So whether you are giving a sales pitch or presenting to the board, make sure to check out Slidegeeks first The purpose of the mentioned slide is to showcase different types of data analytics tools that enhance the project-related tasks. It includes Microsoft Excel, Tableau, Business Intelligence, and custom dashboards.
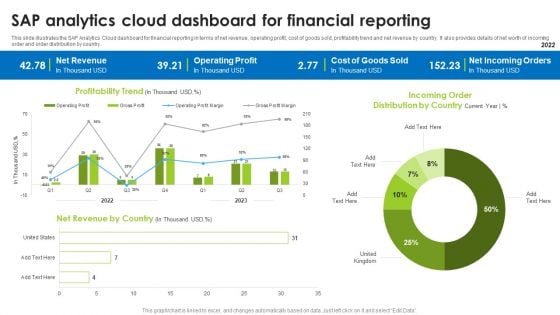
BI Technique For Data Informed Decisions Sap Analytics Cloud Dashboard For Financial Reporting Portrait PDF
This slide illustrates the SAP Analytics Cloud dashboard for financial reporting in terms of net revenue, operating profit, cost of goods sold, profitability trend and net revenue by country. It also provides details of net worth of incoming order and order distribution by country. Coming up with a presentation necessitates that the majority of the effort goes into the content and the message you intend to convey. The visuals of a PowerPoint presentation can only be effective if it supplements and supports the story that is being told. Keeping this in mind our experts created BI Technique For Data Informed Decisions Sap Analytics Cloud Dashboard For Financial Reporting Portrait PDF to reduce the time that goes into designing the presentation. This way, you can concentrate on the message while our designers take care of providing you with the right template for the situation.
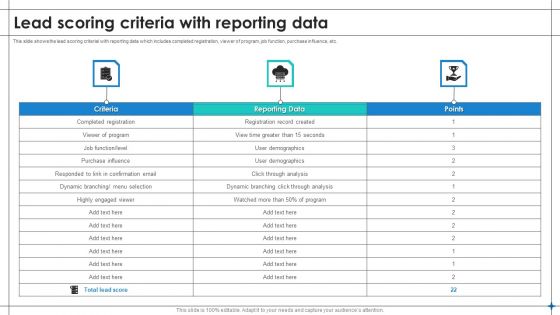
Increase Sales By Lead Generation Lead Scoring Criteria With Reporting Data Structure PDF
This slide shows the lead scoring criterial with reporting data which includes completed registration, viewer of program, job function, purchase influence, etc. Formulating a presentation can take up a lot of effort and time, so the content and message should always be the primary focus. The visuals of the PowerPoint can enhance the presenters message, so our Increase Sales By Lead Generation Lead Scoring Criteria With Reporting Data Structure PDF was created to help save time. Instead of worrying about the design, the presenter can concentrate on the message while our designers work on creating the ideal templates for whatever situation is needed. Slidegeeks has experts for everything from amazing designs to valuable content, we have put everything into Increase Sales By Lead Generation Lead Scoring Criteria With Reporting Data Structure PDF
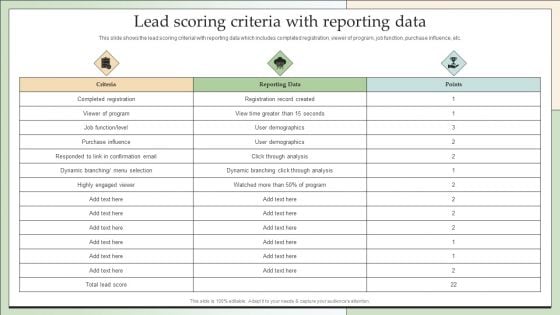
Customer Lead Development Management Strategies Lead Scoring Criteria With Reporting Data Ideas PDF
This slide shows the lead scoring criterial with reporting data which includes completed registration, viewer of program, job function, purchase influence, etc. Formulating a presentation can take up a lot of effort and time, so the content and message should always be the primary focus. The visuals of the PowerPoint can enhance the presenters message, so our Customer Lead Development Management Strategies Lead Scoring Criteria With Reporting Data Ideas PDF was created to help save time. Instead of worrying about the design, the presenter can concentrate on the message while our designers work on creating the ideal templates for whatever situation is needed. Slidegeeks has experts for everything from amazing designs to valuable content, we have put everything into Customer Lead Development Management Strategies Lead Scoring Criteria With Reporting Data Ideas PDF.
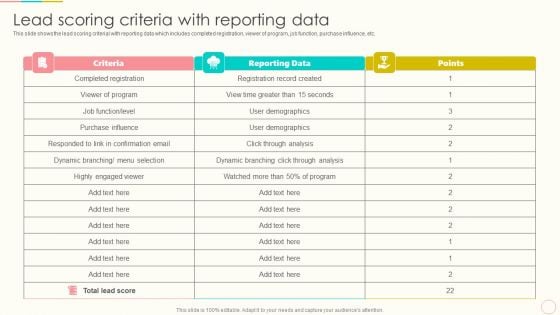
Lead Management To Engage Potential Customers Lead Scoring Criteria With Reporting Data Brochure PDF
This slide shows the lead scoring criterial with reporting data which includes completed registration, viewer of program, job function, purchase influence, etc. Formulating a presentation can take up a lot of effort and time, so the content and message should always be the primary focus. The visuals of the PowerPoint can enhance the presenters message, so our Lead Management To Engage Potential Customers Lead Scoring Criteria With Reporting Data Brochure PDF was created to help save time. Instead of worrying about the design, the presenter can concentrate on the message while our designers work on creating the ideal templates for whatever situation is needed. Slidegeeks has experts for everything from amazing designs to valuable content, we have put everything into Lead Management To Engage Potential Customers Lead Scoring Criteria With Reporting Data Brochure PDF.
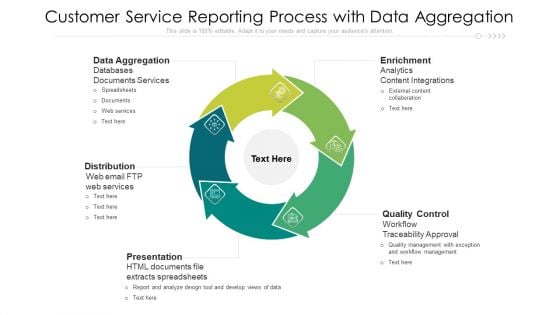
Customer Service Reporting Process With Data Aggregation Ppt Outline Shapes PDF
Persuade your audience using this customer service reporting process with data aggregation ppt outline shapes pdf. This PPT design covers five stages, thus making it a great tool to use. It also caters to a variety of topics including enrichment, quality control, presentation, distribution, data aggregation. Download this PPT design now to present a convincing pitch that not only emphasizes the topic but also showcases your presentation skills.
Data Science And Management With Business Reporting Ppt PowerPoint Presentation Icon Styles PDF
Presenting this set of slides with name data science and management with business reporting ppt powerpoint presentation icon styles pdf. This is a nine stage process. The stages in this process are business, management, structuring. This is a completely editable PowerPoint presentation and is available for immediate download. Download now and impress your audience.


 Continue with Email

 Home
Home


