Data Analytics Icons
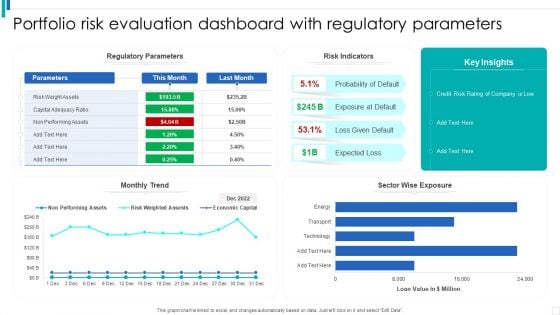
Portfolio Risk Evaluation Dashboard With Regulatory Parameters Slides PDF
Pitch your topic with ease and precision using this Portfolio Risk Evaluation Dashboard With Regulatory Parameters Slides PDF. This layout presents information on Probability Of Default, Expected Loss, Credit Risk Rating. It is also available for immediate download and adjustment. So, changes can be made in the color, design, graphics or any other component to create a unique layout.

IT Project Expenses Dashboard With Return On Investment Topics PDF
Pitch your topic with ease and precision using this IT Project Expenses Dashboard With Return On Investment Topics PDF. This layout presents information on Revenue, Costs, Budget. It is also available for immediate download and adjustment. So, changes can be made in the color, design, graphics or any other component to create a unique layout.
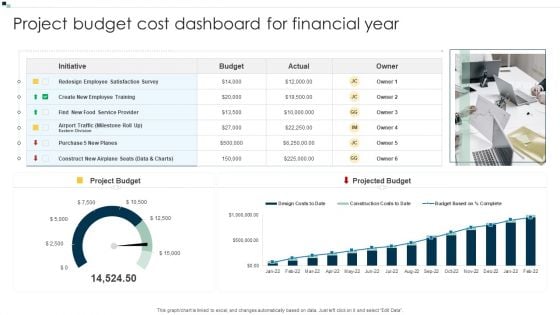
Project Budget Cost Dashboard For Financial Year Ideas PDF
Pitch your topic with ease and precision using this Project Budget Cost Dashboard For Financial Year Ideas PDF. This layout presents information on Budget, Service Provider, Redesign Employee. It is also available for immediate download and adjustment. So, changes can be made in the color, design, graphics or any other component to create a unique layout.
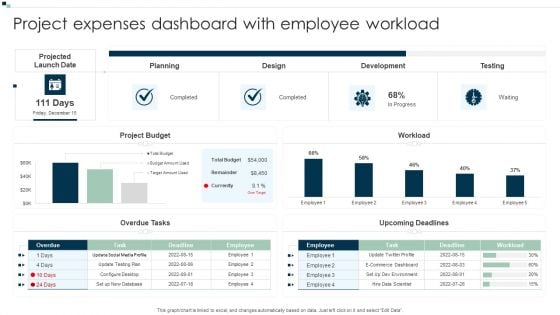
Project Expenses Dashboard With Employee Workload Background PDF
Pitch your topic with ease and precision using this Project Expenses Dashboard With Employee Workload Background PDF. This layout presents information on Planning, Design, Development. It is also available for immediate download and adjustment. So, changes can be made in the color, design, graphics or any other component to create a unique layout.

Project Expenses Saving And Avoidance Dashboard Guidelines PDF
Pitch your topic with ease and precision using this Project Expenses Saving And Avoidance Dashboard Guidelines PDF. This layout presents information on Procurement Roi, Supplier By Cost Reduction, Cost Of Purchase Order. It is also available for immediate download and adjustment. So, changes can be made in the color, design, graphics or any other component to create a unique layout.
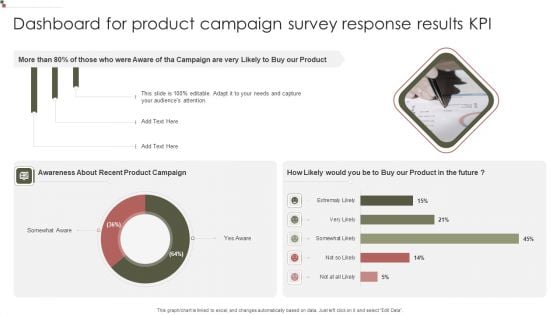
Dashboard For Product Campaign Survey Response Results KPI Pictures PDF
Pitch your topic with ease and precision using this Dashboard For Product Campaign Survey Response Results KPI Pictures PDF. This layout presents information on Awareness Recent, Product Campaign, Product Future. It is also available for immediate download and adjustment. So, changes can be made in the color, design, graphics or any other component to create a unique layout.
Dashboard For Tracking Organizational OGSM Model Metrics Microsoft PDF
Pitch your topic with ease and precision using this Dashboard For Tracking Organizational OGSM Model Metrics Microsoft PDF. This layout presents information on Revenue, Market Share, Gross Margin. It is also available for immediate download and adjustment. So, changes can be made in the color, design, graphics or any other component to create a unique layout.
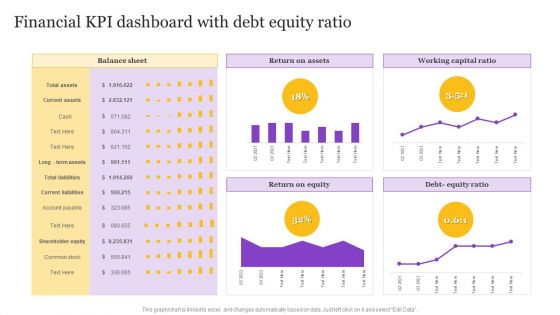
Financial KPI Dashboard With Debt Equity Ratio Rules PDF
Pitch your topic with ease and precision using this Financial KPI Dashboard With Debt Equity Ratio Rules PDF. This layout presents information on Working Capital Ratio, Return On Assets, Return On Equity. It is also available for immediate download and adjustment. So, changes can be made in the color, design, graphics or any other component to create a unique layout.
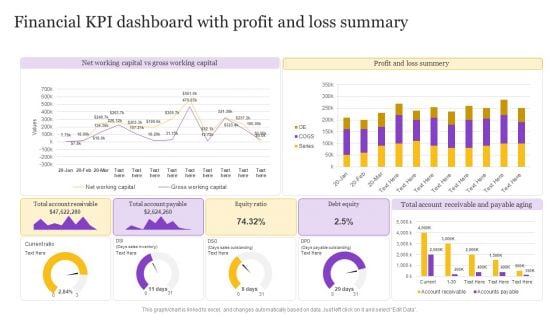
Financial KPI Dashboard With Profit And Loss Summary Professional PDF
Pitch your topic with ease and precision using this Financial KPI Dashboard With Profit And Loss Summary Professional PDF. This layout presents information on Net Working Capital, Gross Working Capital. It is also available for immediate download and adjustment. So, changes can be made in the color, design, graphics or any other component to create a unique layout.
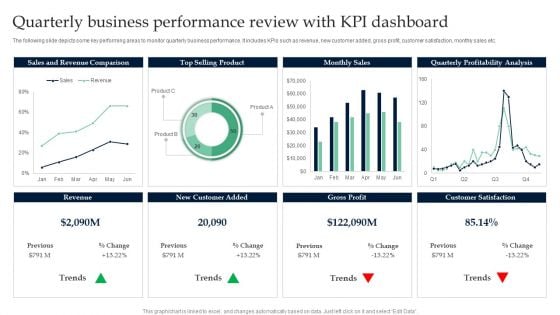
Quarterly Business Performance Review With KPI Dashboard Infographics PDF
Pitch your topic with ease and precision using this Quarterly Business Performance Review With KPI Dashboard Infographics PDF. This layout presents information on Sales And Revenue Comparison, Top Selling Product. It is also available for immediate download and adjustment. So, changes can be made in the color, design, graphics or any other component to create a unique layout.
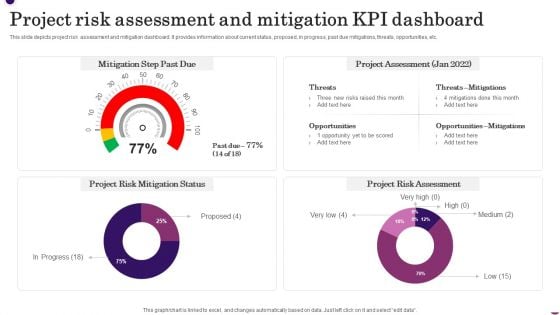
Project Risk Assessment And Mitigation KPI Dashboard Summary PDF
Pitch your topic with ease and precision using this Project Risk Assessment And Mitigation KPI Dashboard Summary PDF. This layout presents information on Mitigation Step Past Due, Project Assessment, Mitigation Status, Project Risk Assessment. It is also available for immediate download and adjustment. So, changes can be made in the color, design, graphics or any other component to create a unique layout.

KPI Dashboard To Measure Financial Institution Industry Revenue Summary PDF
Pitch your topic with ease and precision using this KPI Dashboard To Measure Financial Institution Industry Revenue Summary PDF. This layout presents information on Measure Financial, Institution Industry . It is also available for immediate download and adjustment. So, changes can be made in the color, design, graphics or any other component to create a unique layout.
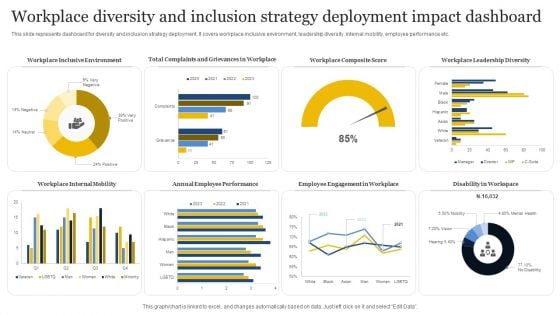
Workplace Diversity And Inclusion Strategy Deployment Impact Dashboard Demonstration PDF
Pitch your topic with ease and precision using this Workplace Diversity And Inclusion Strategy Deployment Impact Dashboard Demonstration PDF. This layout presents information on Workplace Inclusive Environment, Workplace Internal Mobility, Annual Employee Performance, Disability In Workspace. It is also available for immediate download and adjustment. So, changes can be made in the color, design, graphics or any other component to create a unique layout.
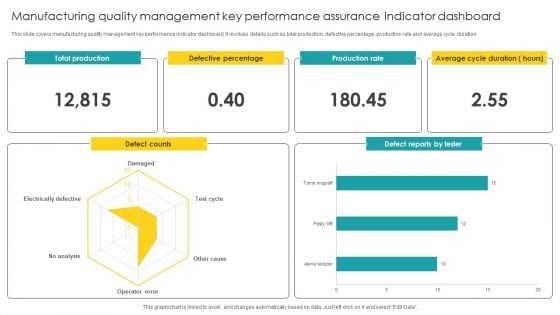
Manufacturing Quality Management Key Performance Assurance Indicator Dashboard Microsoft PDF
Pitch your topic with ease and precision using this Manufacturing Quality Management Key Performance Assurance Indicator Dashboard Microsoft PDF. This layout presents information on Quality Management, Key Performance Assurance. It is also available for immediate download and adjustment. So, changes can be made in the color, design, graphics or any other component to create a unique layout.
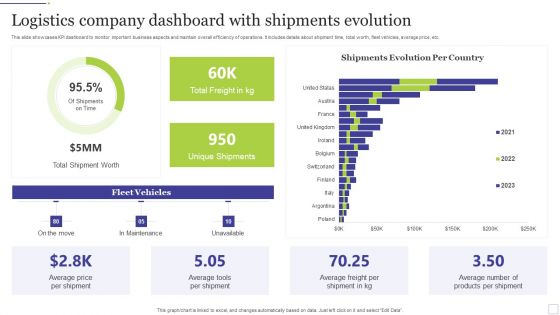
Logistics Company Dashboard With Shipments Evolution Summary PDF
Pitch your topic with ease and precision using this Logistics Company Dashboard With Shipments Evolution Summary PDF. This layout presents information on Logistics Company, Shipments Evolution. It is also available for immediate download and adjustment. So, changes can be made in the color, design, graphics or any other component to create a unique layout.
Deploying Cloud Technology Cloud Platform Dashboard For Tracking Project Team Activities Ppt Inspiration Summary PDF
The following slide depicts project team task tracking cloud dashboard. It provides information about hours worked, projects worked, time spent, daily limit, product design, weekly activity, etc. Create an editable Deploying Cloud Technology Cloud Platform Dashboard For Tracking Project Team Activities Ppt Inspiration Summary PDF that communicates your idea and engages your audience. Whether you are presenting a business or an educational presentation, pre-designed presentation templates help save time. Deploying Cloud Technology Cloud Platform Dashboard For Tracking Project Team Activities Ppt Inspiration Summary PDF is highly customizable and very easy to edit, covering many different styles from creative to business presentations. Slidegeeks has creative team members who have crafted amazing templates. So, go and get them without any delay.
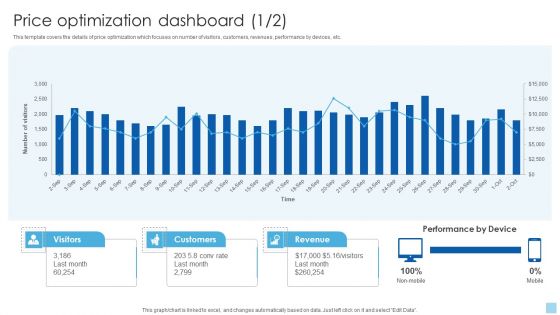
Strategies To Select Effective Price Optimization Dashboard Graphics PDF
This template covers the details of price optimization which focuses on number of visitors, customers, revenues, performance by devices, etc. Here you can discover an assortment of the finest PowerPoint and Google Slides templates. With these templates, you can create presentations for a variety of purposes while simultaneously providing your audience with an eye-catching visual experience. Download Strategies To Select Effective Price Optimization Dashboard Graphics PDF to deliver an impeccable presentation. These templates will make your job of preparing presentations much quicker, yet still, maintain a high level of quality. Slidegeeks has experienced researchers who prepare these templates and write high-quality content for you. Later on, you can personalize the content by editing the Strategies To Select Effective Price Optimization Dashboard Graphics PDF.
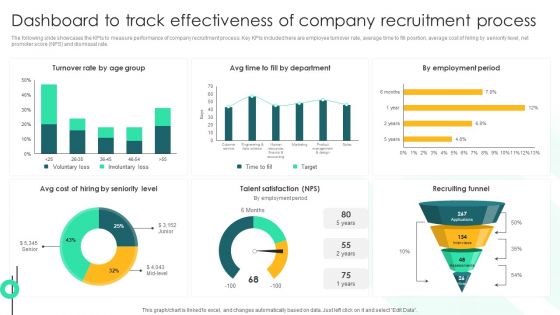
Dashboard To Track Effectiveness Of Company Recruitment Process Demonstration PDF
The following slide showcases the KPIs to measure performance of company recruitment process. Key KPIs included here are employee turnover rate, average time to fill position, average cost of hiring by seniority level, net promoter score NPS and dismissal rate. Here you can discover an assortment of the finest PowerPoint and Google Slides templates. With these templates, you can create presentations for a variety of purposes while simultaneously providing your audience with an eye-catching visual experience. Download Dashboard To Track Effectiveness Of Company Recruitment Process Demonstration PDF to deliver an impeccable presentation. These templates will make your job of preparing presentations much quicker, yet still, maintain a high level of quality. Slidegeeks has experienced researchers who prepare these templates and write high-quality content for you. Later on, you can personalize the content by editing the Dashboard To Track Effectiveness Of Company Recruitment Process Demonstration PDF.
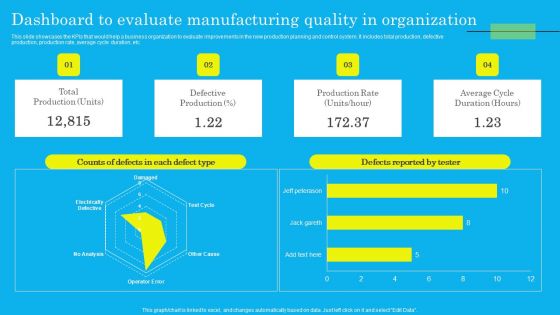
Dashboard To Evaluate Manufacturing Quality In Organization Elements PDF
This slide showcases the KPIs that would help a business organization to evaluate improvements in the new production planning and control system. It includes total production, defective production, production rate, average cycle duration, etc. Here you can discover an assortment of the finest PowerPoint and Google Slides templates. With these templates, you can create presentations for a variety of purposes while simultaneously providing your audience with an eye catching visual experience. Download Dashboard To Evaluate Manufacturing Quality In Organization Elements PDF to deliver an impeccable presentation. These templates will make your job of preparing presentations much quicker, yet still, maintain a high level of quality. Slidegeeks has experienced researchers who prepare these templates and write high quality content for you. Later on, you can personalize the content by editing the Dashboard To Evaluate Manufacturing Quality In Organization Elements PDF.
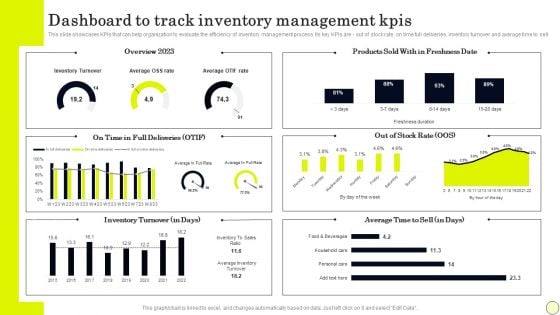
Dashboard To Track Inventory Management Kpis Portrait PDF
This slide showcases KPIs that can help organization to evaluate the efficiency of inventory management process. Its key KPIs are out of stock rate, on time full deliveries, inventory turnover and average time to sell. Here you can discover an assortment of the finest PowerPoint and Google Slides templates. With these templates, you can create presentations for a variety of purposes while simultaneously providing your audience with an eye catching visual experience. Download Dashboard To Track Inventory Management Kpis Portrait PDF to deliver an impeccable presentation. These templates will make your job of preparing presentations much quicker, yet still, maintain a high level of quality. Slidegeeks has experienced researchers who prepare these templates and write high quality content for you. Later on, you can personalize the content by editing the Dashboard To Track Inventory Management Kpis Portrait PDF.
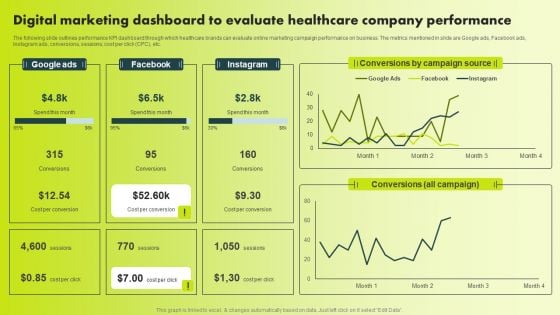
Digital Marketing Dashboard To Evaluate Healthcare Company Performance Template PDF
The following slide outlines performance KPI dashboard through which healthcare brands can evaluate online marketing campaign performance on business. The metrics mentioned in slide are Google ads, Facebook ads, Instagram ads, conversions, sessions, cost per click CPC, etc. Slidegeeks has constructed Digital Marketing Dashboard To Evaluate Healthcare Company Performance Template PDF after conducting extensive research and examination. These presentation templates are constantly being generated and modified based on user preferences and critiques from editors. Here, you will find the most attractive templates for a range of purposes while taking into account ratings and remarks from users regarding the content. This is an excellent jumping-off point to explore our content and will give new users an insight into our top-notch PowerPoint Templates.
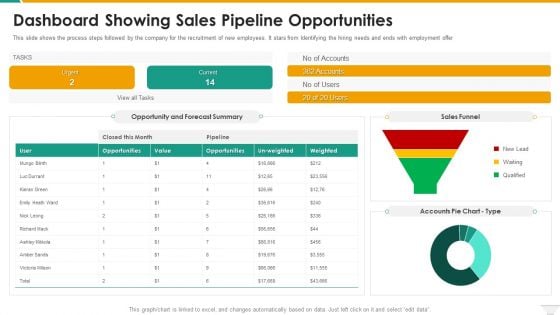
Dashboard Showing Sales Pipeline Opportunities Microsoft PDF
This slide shows the process steps followed by the company for the recruitment of new employees. It stars from Identifying the hiring needs and ends with employment offer. Deliver and pitch your topic in the best possible manner with this Dashboard Showing Sales Pipeline Opportunities Microsoft PDF. Use them to share invaluable insights on Dashboard Showing Sales Pipeline Opportunities and impress your audience. This template can be altered and modified as per your expectations. So, grab it now.
Cloud Performance Tracking Dashboard Cloud Computing Complexities And Solutions Structure PDF
This slide covers the Key performance indicators for tracking performance of the cloud such as violations break down, sources, rules and severity. Are you searching for a xxxxxxxxxxxxxxxxxxxxxx that is uncluttered, straightforward, and original Its easy to edit, and you can change the colors to suit your personal or business branding. For a presentation that expresses how much effort you ve put in, this template is ideal With all of its features, including tables, diagrams, statistics, and lists, its perfect for a business plan presentation. Make your ideas more appealing with these professional slides. Download Cloud Performance Tracking Dashboard Cloud Computing Complexities And Solutions Structure PDF from Slidegeeks today.
Dashboard For Tracking Impact Of Warehouse House Automation Pictures PDF
This slide covers the dashboard with after automation warehouse overview. It include KPIs such as autonomous robots status, robotic arms status, battery level, performance, time to return, etc. Find highly impressive Dashboard For Tracking Impact Of Warehouse House Automation Pictures PDF on Slidegeeks to deliver a meaningful presentation. You can save an ample amount of time using these presentation templates. No need to worry to prepare everything from scratch because Slidegeeks experts have already done a huge research and work for you. You need to download Dashboard For Tracking Impact Of Warehouse House Automation Pictures PDF for your upcoming presentation. All the presentation templates are 100precent editable and you can change the color and personalize the content accordingly. Download now.
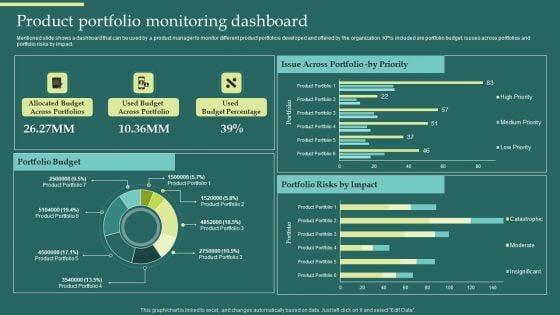
Product Portfolios And Strategic Product Portfolio Monitoring Dashboard Introduction PDF
Mentioned slide shows a dashboard that can be used by a product manager to monitor different product portfolios developed and offered by the organization. KPIs included are portfolio budget, issues across portfolios and portfolio risks by impact. Explore a selection of the finest Product Portfolios And Strategic Product Portfolio Monitoring Dashboard Introduction PDF here. With a plethora of professionally designed and pre-made slide templates, you can quickly and easily find the right one for your upcoming presentation. You can use our Product Portfolios And Strategic Product Portfolio Monitoring Dashboard Introduction PDF to effectively convey your message to a wider audience. Slidegeeks has done a lot of research before preparing these presentation templates. The content can be personalized and the slides are highly editable. Grab templates today from Slidegeeks.
Website Performance Tracking And Monitoring Dashboard Designs PDF
The following slide showcases a dashboard to track and measure website performance. It includes key elements such as visits, average session duration, bounce rate, page views, goal conversion, visits by week, traffic sources, top channels by conversions, etc. Explore a selection of the finest Website Performance Tracking And Monitoring Dashboard Designs PDF here. With a plethora of professionally designed and pre made slide templates, you can quickly and easily find the right one for your upcoming presentation. You can use our Website Performance Tracking And Monitoring Dashboard Designs PDF to effectively convey your message to a wider audience. Slidegeeks has done a lot of research before preparing these presentation templates. The content can be personalized and the slides are highly editable. Grab templates today from Slidegeeks.

Instagram Influencer Marketing Campaign Dashboard Ppt Infographic Template Topics PDF
This slide represents key metrics dashboard to track and measure progress of Instagram influencer marketing campaign. It includes details related to KPIs such as impressions, likes, engagement rates etc. Explore a selection of the finest Instagram Influencer Marketing Campaign Dashboard Ppt Infographic Template Topics PDF here. With a plethora of professionally designed and pre made slide templates, you can quickly and easily find the right one for your upcoming presentation. You can use our Instagram Influencer Marketing Campaign Dashboard Ppt Infographic Template Topics PDF to effectively convey your message to a wider audience. Slidegeeks has done a lot of research before preparing these presentation templates. The content can be personalized and the slides are highly editable. Grab templates today from Slidegeeks.
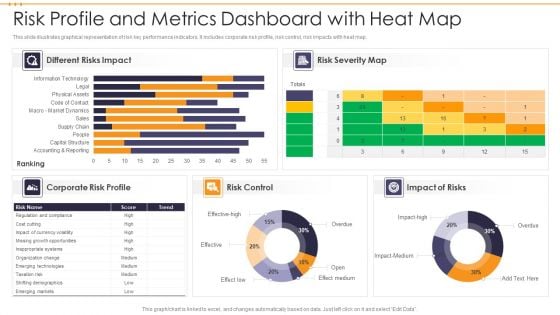
Risk Profile And Metrics Dashboard With Heat Map Brochure PDF
This slide illustrates graphical representation of risk key performance indicators. It includes corporate risk profile, risk control, risk impacts with heat map. Showcasing this set of slides titled Risk Profile And Metrics Dashboard With Heat Map Brochure PDF. The topics addressed in these templates are Risk Control, Impact Of Risks, Risk Severity Map. All the content presented in this PPT design is completely editable. Download it and make adjustments in color, background, font etc. as per your unique business setting.
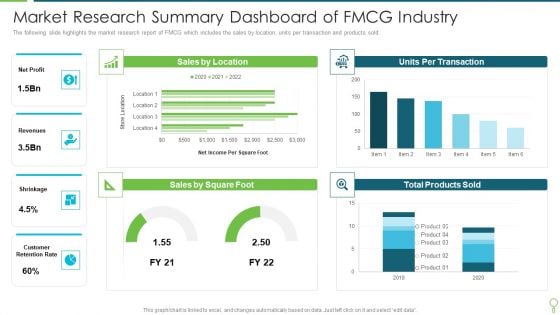
Market Research Summary Dashboard Of Fmcg Industry Pictures PDF
The following slide highlights the market research report of FMCG which includes the sales by location, units per transaction and products sold. Showcasing this set of slides titled Market Research Summary Dashboard Of Fmcg Industry Pictures PDF. The topics addressed in these templates are Revenues, Net Profit, Sales. All the content presented in this PPT design is completely editable. Download it and make adjustments in color, background, font etc. as per your unique business setting.
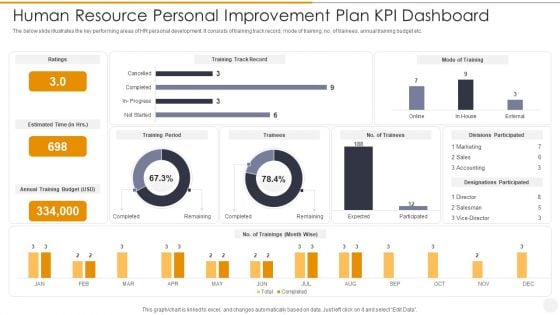
Human Resource Personal Improvement Plan Kpi Dashboard Topics PDF
The below slide illustrates the key performing areas of HR personal development. It consists of training track record, mode of training, no. of trainees, annual training budget etc. Showcasing this set of slides titled Human Resource Personal Improvement Plan Kpi Dashboard Topics PDF. The topics addressed in these templates are Sales, Marketing, Accounting. All the content presented in this PPT design is completely editable. Download it and make adjustments in color, background, font etc. as per your unique business setting.

Sales Training KPI Dashboard For Improving Skills Portrait PDF
The following slide depicts the sales training assessment to work upon the areas need improvement. It also includes current status, goals along with training basis, index and scores.Showcasing this set of slides titled Sales Training KPI Dashboard For Improving Skills Portrait PDF The topics addressed in these templates are Acquisition Process, Sales Presentation, Customer Relationship Management All the content presented in this PPT design is completely editable. Download it and make adjustments in color, background, font etc. as per your unique business setting.
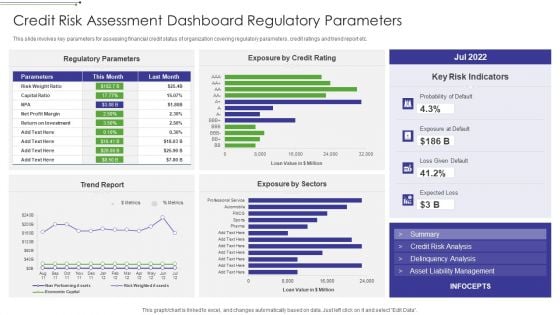
Credit Risk Assessment Dashboard Regulatory Parameters Microsoft PDF
This slide involves key parameters for assessing financial credit status of organization covering regulatory parameters, credit ratings and trend report etc.Showcasing this set of slides titled Credit Risk Assessment Dashboard Regulatory Parameters Microsoft PDF The topics addressed in these templates are Regulatory Parameters, Exposure By Credit Rating, Exposure By Sectors All the content presented in this PPT design is completely editable. Download it and make adjustments in color, background, font etc. as per your unique business setting.
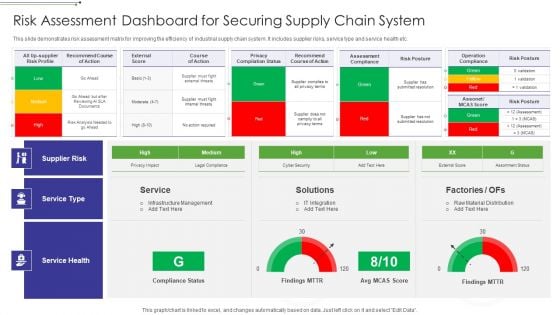
Risk Assessment Dashboard For Securing Supply Chain System Graphics PDF
This slide demonstrates risk assessment matrix for improving the efficiency of industrial supply chain system. It includes supplier risks, service type and service health etc.Showcasing this set of slides titled Risk Assessment Dashboard For Securing Supply Chain System Graphics PDF The topics addressed in these templates are Operation Compliance, Privacy Compilation, External Score All the content presented in this PPT design is completely editable. Download it and make adjustments in color, background, font etc. as per your unique business setting.

Development And Operations KPI Dashboard With Successful Deployments Inspiration PDF
This template covers about total number of deployments with success ratio. Further, this slide includes average duration time and total breakdown due to errors in whole year.Showcasing this set of slides titled Development And Operations KPI Dashboard With Successful Deployments Inspiration PDF The topics addressed in these templates are Environment Deployments, Average Deployment, Breakdown Deployments All the content presented in this PPT design is completely editable. Download it and make adjustments in color, background, font etc. as per your unique business setting.
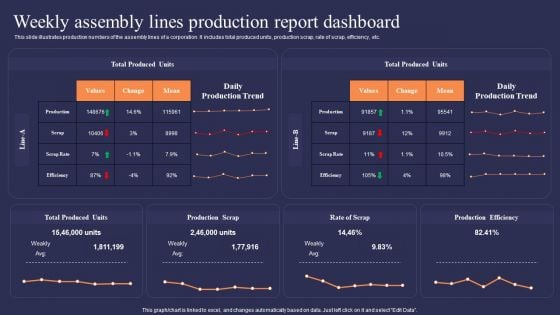
Weekly Assembly Lines Production Report Dashboard Demonstration PDF
This slide illustrates production numbers of the assembly lines of a corporation. It includes total produced units, production scrap, rate of scrap, efficiency, etc.Showcasing this set of slides titled Weekly Assembly Lines Production Report Dashboard Demonstration PDF. The topics addressed in these templates are Total Produced, Production Efficiency, Production Scrap. All the content presented in this PPT design is completely editable. Download it and make adjustments in color, background, font etc. as per your unique business setting.
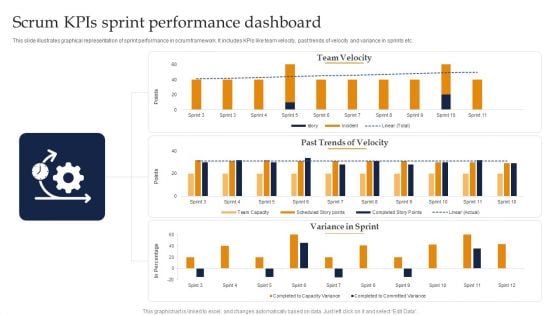
Scrum Kpis Sprint Performance Dashboard Ppt Portfolio Example Introduction PDF
This slide illustrates graphical representation of sprint performance in scrum framework. It includes KPIs like team velocity, past trends of velocity and variance in sprints etc. Showcasing this set of slides titled Scrum Kpis Sprint Performance Dashboard Ppt Portfolio Example Introduction PDF. The topics addressed in these templates are Team Velocity, Past Trends Velocity, Variance Sprint. All the content presented in this PPT design is completely editable. Download it and make adjustments in color, background, font etc. as per your unique business setting.

Facility Planning Management Workforce Productivity Dashboard Formats PDF
This slide showcase employees productivity driven by facility planning in organisation.it includes workforce productivity , organisation department , monthly productivity percentage and facility percentage. Showcasing this set of slides titled Facility Planning Management Workforce Productivity Dashboard Formats PDF. The topics addressed in these templates are Workforce Productivity, Work Productivity, Facility Percentage. All the content presented in this PPT design is completely editable. Download it and make adjustments in color, background, font etc. as per your unique business setting.
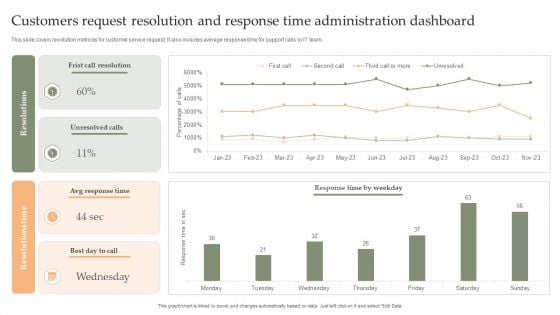
Customers Request Resolution And Response Time Administration Dashboard Mockup PDF
This slide covers resolution metrices for customer service request. It also includes average response time for support calls by IT team. Showcasing this set of slides titled Customers Request Resolution And Response Time Administration Dashboard Mockup PDF. The topics addressed in these templates are Frist Call Resolution, Unresolved Calls, Avg Response Time. All the content presented in this PPT design is completely editable. Download it and make adjustments in color, background, font etc. as per your unique business setting.
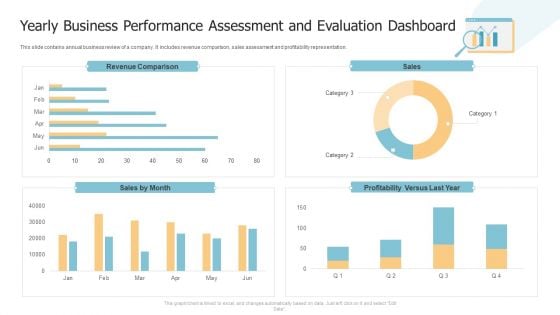
Yearly Business Performance Assessment And Evaluation Dashboard Structure PDF
This slide contains annual business review of a company. It includes revenue comparison, sales assessment and profitability representation. Showcasing this set of slides titled Yearly Business Performance Assessment And Evaluation Dashboard Structure PDF. The topics addressed in these templates are Revenue Comparison, Sales, Profitability. All the content presented in this PPT design is completely editable. Download it and make adjustments in color, background, font etc. as per your unique business setting.
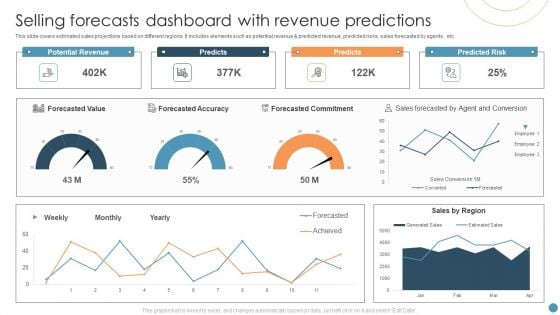
Selling Forecasts Dashboard With Revenue Predictions Elements PDF
This slide covers estimated sales projections based on different regions. It includes elements such as potential revenue and predicted revenue, predicted risks, sales forecasted by agents , etc. Showcasing this set of slides titled Selling Forecasts Dashboard With Revenue Predictions Elements PDF. The topics addressed in these templates are Forecasted Value, Potential Revenue, Predicted Risk. All the content presented in this PPT design is completely editable. Download it and make adjustments in color, background, font etc. as per your unique business setting.
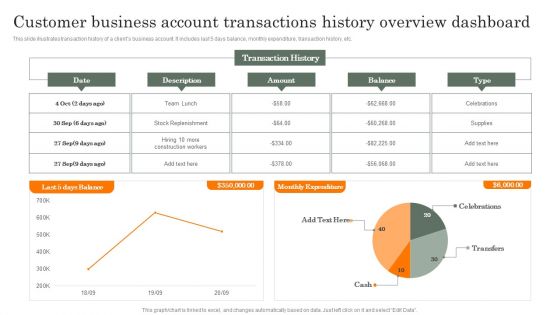
Customer Business Account Transactions History Overview Dashboard Guidelines PDF
This slide illustrates transaction history of a clients business account. It includes last 5 days balance, monthly expenditure, transaction history, etc. Showcasing this set of slides titled Customer Business Account Transactions History Overview Dashboard Guidelines PDF. The topics addressed in these templates are Customer Business, Account Transactions, History Overview. All the content presented in this PPT design is completely editable. Download it and make adjustments in color, background, font etc. as per your unique business setting.
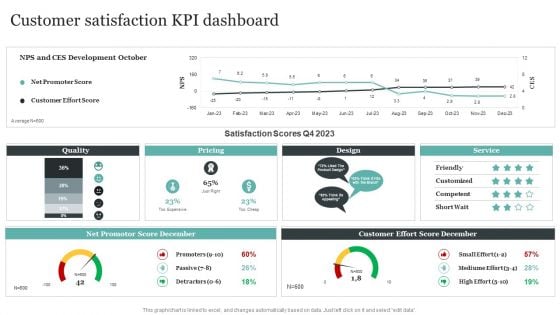
Comprehensive Personal Branding Guidelines Customer Satisfaction Kpi Dashboard Microsoft PDF
Boost your pitch with our creative Comprehensive Personal Branding Guidelines Customer Satisfaction Kpi Dashboard Microsoft PDF. Deliver an awe-inspiring pitch that will mesmerize everyone. Using these presentation templates you will surely catch everyones attention. You can browse the ppts collection on our website. We have researchers who are experts at creating the right content for the templates. So you do not have to invest time in any additional work. Just grab the template now and use them.
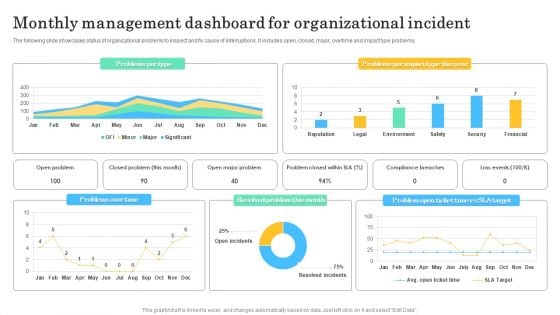
Monthly Management Dashboard For Organizational Incident Professional PDF
The following slide showcases status of organizational problems to inspect and fix cause of interruptions. It includes open, closed, major, overtime and impact type problems. Showcasing this set of slides titled Monthly Management Dashboard For Organizational Incident Professional PDF. The topics addressed in these templates are Problems Over Time, Resolved Problem Month. All the content presented in this PPT design is completely editable. Download it and make adjustments in color, background, font etc. as per your unique business setting.
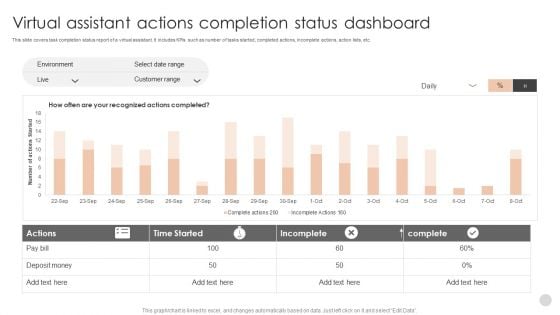
Virtual Assistant Actions Completion Status Dashboard Elements PDF
This slide covers task completion status report of a virtual assistant. It includes KPIs such as number of tasks started, completed actions, incomplete actions, action lists, etc.Showcasing this set of slides titled Virtual Assistant Actions Completion Status Dashboard Elements PDF. The topics addressed in these templates are Customer Range, Time Started, Incomplete. All the content presented in this PPT design is completely editable. Download it and make adjustments in color, background, font etc. as per your unique business setting.
Workflow Optimization And Tracking Dashboard Of Project Guidelines PDF
This slide shows graphical presentation of workflow improvement and tracking status such as task done , ongoing task , pending and sum total of projects. Showcasing this set of slides titled Workflow Optimization And Tracking Dashboard Of Project Guidelines PDF. The topics addressed in these templates are Pending Task, Status Tasks, Pending Task. All the content presented in this PPT design is completely editable. Download it and make adjustments in color, background, font etc. as per your unique business setting.
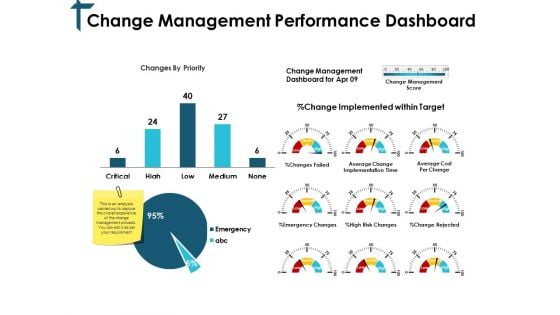
Change Management Performance Dashboard Ppt PowerPoint Presentation Professional Slides
This is a change management performance dashboard ppt powerpoint presentation professional slides. This is a three stage process. The stages in this process are finance, marketing, management, investment, analysis.
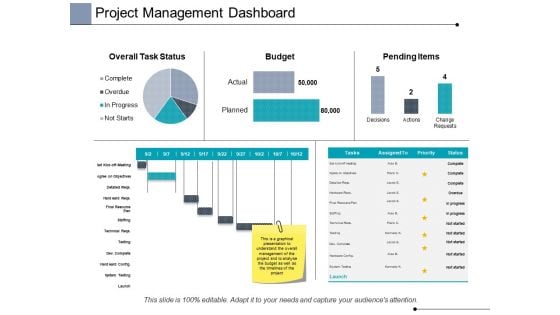
Project Management Dashboard Ppt PowerPoint Presentation Infographic Template Graphics
This is a project management dashboard ppt powerpoint presentation infographic template graphics. This is a three stage process. The stages in this process are finance, analysis, business, investment, marketing.
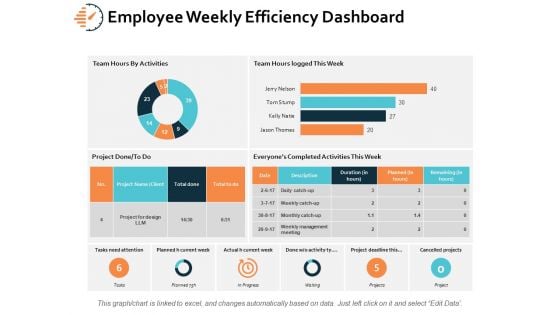
Employee Weekly Efficiency Dashboard Ppt PowerPoint Presentation Infographics Microsoft
This is a employee weekly efficiency dashboard ppt powerpoint presentation infographics microsoft. This is a six stage process. The stages in this process are finance, analysis, business, investment, marketing.
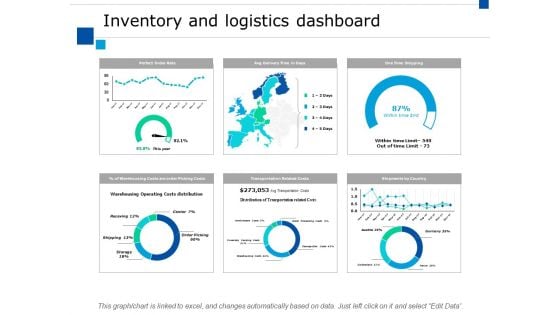
Inventory And Logistics Dashboard Ppt PowerPoint Presentation Professional Styles
This is a inventory and logistics dashboard ppt powerpoint presentation professional styles. This is a four stage process. The stages in this process are finance, marketing, management, investment, analysis.
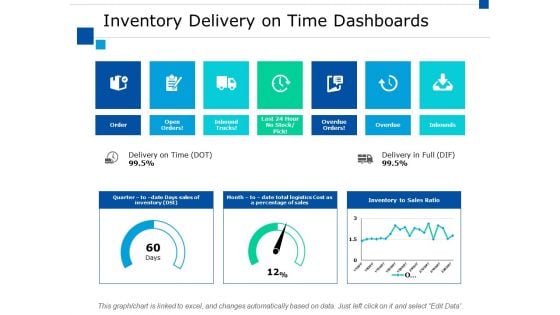
Inventory Delivery On Time Dashboards Ppt PowerPoint Presentation Slides Download
This is a inventory delivery on time dashboards ppt powerpoint presentation slides download. This is a seven stage process. The stages in this process are finance, marketing, management, investment, analysis.
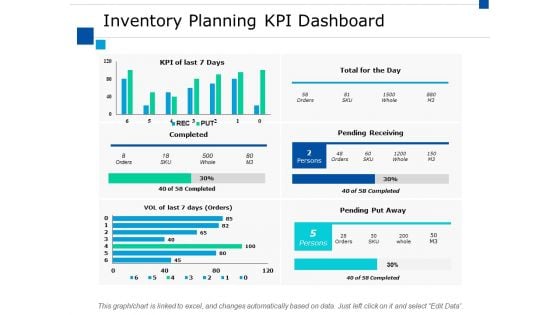
Inventory Planning Kpi Dashboard Ppt PowerPoint Presentation Summary Layout Ideas
This is a inventory planning kpi dashboard ppt powerpoint presentation summary layout ideas. This is a two stage process. The stages in this process are finance, marketing, management, investment, analysis.
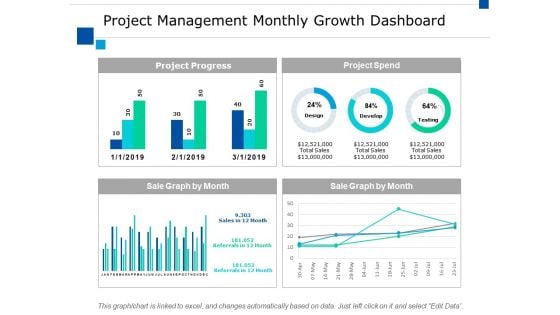
Project Management Monthly Growth Dashboard Ppt PowerPoint Presentation Pictures Guide
This is a project management monthly growth dashboard ppt powerpoint presentation pictures guide. This is a four stage process. The stages in this process are finance, marketing, management, investment, analysis.

Quality Control Kpi Dashboard Ppt PowerPoint Presentation Slides Topics
This is a quality control kpi dashboard ppt powerpoint presentation slides topics. This is a four stage process. The stages in this process are finance, marketing, management, investment, analysis.
Interactive Medium Mobile Dashboard Ppt PowerPoint Presentation Complete Deck
If designing a presentation takes a lot of your time and resources and you are looking for a better alternative, then this interactive medium mobile dashboard ppt powerpoint presentation complete deck is the right fit for you. This is a prefabricated set that can help you deliver a great presentation on the topic. All the twelve slides included in this sample template can be used to present a birds-eye view of the topic. These slides are also fully editable, giving you enough freedom to add specific details to make this layout more suited to your business setting. Apart from the content, all other elements like color, design, theme are also replaceable and editable. This helps in designing a variety of presentations with a single layout. Not only this, you can use this PPT design in formats like PDF, PNG, and JPG once downloaded. Therefore, without any further ado, download and utilize this sample presentation as per your liking.

Employee Hiring Dashboard Ppt PowerPoint Presentation Complete Deck With Slides
If designing a presentation takes a lot of your time and resources and you are looking for a better alternative, then this Employee Hiring Dashboard Ppt PowerPoint Presentation Complete Deck With Slides is the right fit for you. This is a prefabricated set that can help you deliver a great presentation on the topic. All the twelve slides included in this sample template can be used to present a birds-eye view of the topic. These slides are also fully editable, giving you enough freedom to add specific details to make this layout more suited to your business setting. Apart from the content, all other elements like color, design, theme are also replaceable and editable. This helps in designing a variety of presentations with a single layout. Not only this, you can use this PPT design in formats like PDF, PNG, and JPG once downloaded. Therefore, without any further ado, download and utilize this sample presentation as per your liking.
Communication KPI Dashboard Ppt PowerPoint Presentation Complete Deck With Slides
If designing a presentation takes a lot of your time and resources and you are looking for a better alternative, then this Communication KPI Dashboard Ppt PowerPoint Presentation Complete Deck With Slides is the right fit for you. This is a prefabricated set that can help you deliver a great presentation on the topic. All the twelve slides included in this sample template can be used to present a birds-eye view of the topic. These slides are also fully editable, giving you enough freedom to add specific details to make this layout more suited to your business setting. Apart from the content, all other elements like color, design, theme are also replaceable and editable. This helps in designing a variety of presentations with a single layout. Not only this, you can use this PPT design in formats like PDF, PNG, and JPG once downloaded. Therefore, without any further ado, download and utilize this sample presentation as per your liking.
Transformation KPI Dashboard Ppt PowerPoint Presentation Complete With Slides
If designing a presentation takes a lot of your time and resources and you are looking for a better alternative, then this Transformation KPI Dashboard Ppt PowerPoint Presentation Complete With Slides is the right fit for you. This is a prefabricated set that can help you deliver a great presentation on the topic. All the tweleve slides included in this sample template can be used to present a birds-eye view of the topic. These slides are also fully editable, giving you enough freedom to add specific details to make this layout more suited to your business setting. Apart from the content, all other elements like color, design, theme are also replaceable and editable. This helps in designing a variety of presentations with a single layout. Not only this, you can use this PPT design in formats like PDF, PNG, and JPG once downloaded. Therefore, without any further ado, download and utilize this sample presentation as per your liking.

Personnel Salary Dashboard Ppt PowerPoint Presentation Complete Deck With Slides
If designing a presentation takes a lot of your time and resources and you are looking for a better alternative, then this Personnel Salary Dashboard Ppt PowerPoint Presentation Complete Deck With Slides is the right fit for you. This is a prefabricated set that can help you deliver a great presentation on the topic. All the seventeen slides included in this sample template can be used to present a birds-eye view of the topic. These slides are also fully editable, giving you enough freedom to add specific details to make this layout more suited to your business setting. Apart from the content, all other elements like color, design, theme are also replaceable and editable. This helps in designing a variety of presentations with a single layout. Not only this, you can use this PPT design in formats like PDF, PNG, and JPG once downloaded. Therefore, without any further ado, download and utilize this sample presentation as per your liking.

Customer Relationship Management Dashboard Ppt PowerPoint Presentation Complete Deck
If designing a presentation takes a lot of your time and resources and you are looking for a better alternative, then this Customer Relationship Management Dashboard Ppt PowerPoint Presentation Complete Deck is the right fit for you. This is a prefabricated set that can help you deliver a great presentation on the topic. All the twelve slides included in this sample template can be used to present a birds-eye view of the topic. These slides are also fully editable, giving you enough freedom to add specific details to make this layout more suited to your business setting. Apart from the content, all other elements like color, design, theme are also replaceable and editable. This helps in designing a variety of presentations with a single layout. Not only this, you can use this PPT design in formats like PDF, PNG, and JPG once downloaded. Therefore, without any further ado, download and utilize this sample presentation as per your liking.
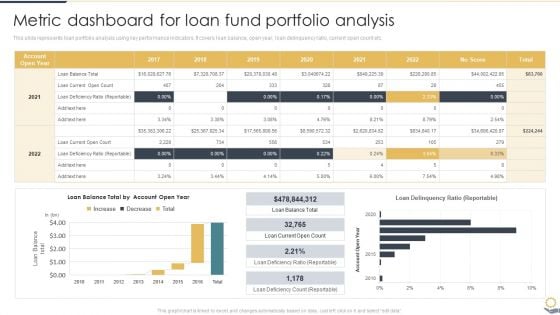
Metric Dashboard For Loan Fund Portfolio Analysis Portfolio Investment Analysis Formats PDF
This slide represents loan portfolio analysis using key performance indicators. It covers loan balance, open year, loan delinquency ratio, current open count etc.From laying roadmaps to briefing everything in detail, our templates are perfect for you. You can set the stage with your presentation slides. All you have to do is download these easy-to-edit and customizable templates. Metric Dashboard For Loan Fund Portfolio Analysis Portfolio Investment Analysis Formats PDF will help you deliver an outstanding performance that everyone would remember and praise you for. Do download this presentation today.
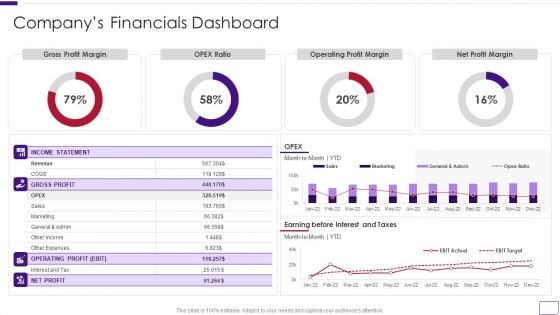
Business Overview Of A Technology Firm Companys Financials Dashboard Sample PDF
Deliver and pitch your topic in the best possible manner with this Business Overview Of A Technology Firm Companys Financials Dashboard Sample PDF. Use them to share invaluable insights on Financials Dashboard, Operating Profit Margin, Net Profit Margin and impress your audience. This template can be altered and modified as per your expectations. So, grab it now.
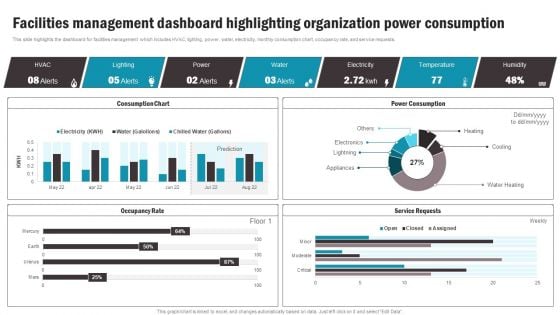
Facilities Management Dashboard Highlighting Organization Power Consumption Introduction PDF
This slide highlights the dashboard for facilities management which includes HVAC, lighting, power, water, electricity, monthly consumption chart, occupancy rate, and service requests. Coming up with a presentation necessitates that the majority of the effort goes into the content and the message you intend to convey. The visuals of a PowerPoint presentation can only be effective if it supplements and supports the story that is being told. Keeping this in mind our experts created Facilities Management Dashboard Highlighting Organization Power Consumption Introduction PDF to reduce the time that goes into designing the presentation. This way, you can concentrate on the message while our designers take care of providing you with the right template for the situation.
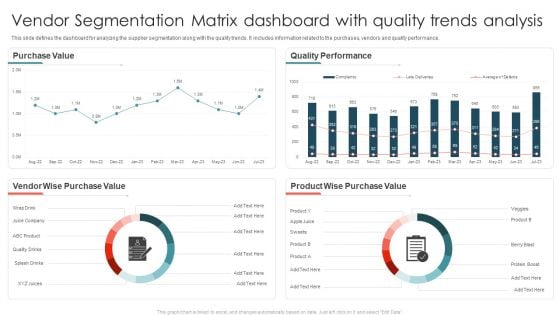
Vendor Segmentation Matrix Dashboard With Quality Trends Analysis Ppt Model Rules PDF
This slide defines the dashboard for analyzing the supplier segmentation along with the quality trends. It includes information related to the purchases, vendors and quality performance. Pitch your topic with ease and precision using this Vendor Segmentation Matrix Dashboard With Quality Trends Analysis Ppt Model Rules PDF. This layout presents information on Purchase Value, Quality Performance, Vendor Wise. It is also available for immediate download and adjustment. So, changes can be made in the color, design, graphics or any other component to create a unique layout.
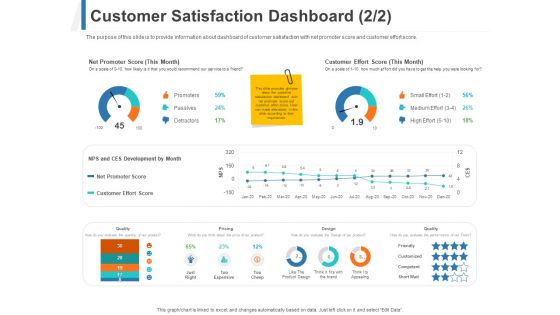
Share Of Wallet Customer Satisfaction Dashboard Ppt Pictures Slide PDF
The purpose of this slide is to provide information about dashboard of customer satisfaction with net promoter score and customer effort score. Deliver and pitch your topic in the best possible manner with this share of wallet customer satisfaction dashboard ppt pictures slide pdf. Use them to share invaluable insights on net promoter score, customer effort score , nps and ces development by month, net promoter score, customer effort score and impress your audience. This template can be altered and modified as per your expectations. So, grab it now.
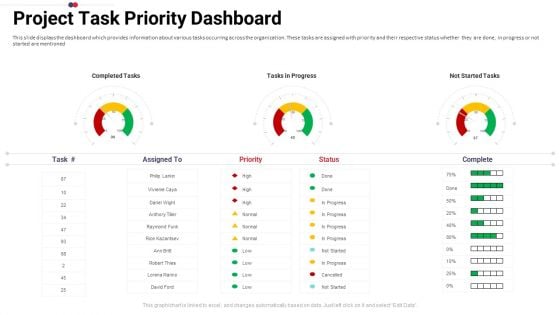
Work Prioritization Procedure Project Task Priority Dashboard Elements PDF
This slide displays the dashboard which provides information about various tasks occurring across the organization. These tasks are assigned with priority and their respective status whether they are done, in progress or not started are mentioned. Deliver an awe inspiring pitch with this creative work prioritization procedure project task priority dashboard elements pdf bundle. Topics like completed tasks, tasks in progress, not started tasks can be discussed with this completely editable template. It is available for immediate download depending on the needs and requirements of the user.
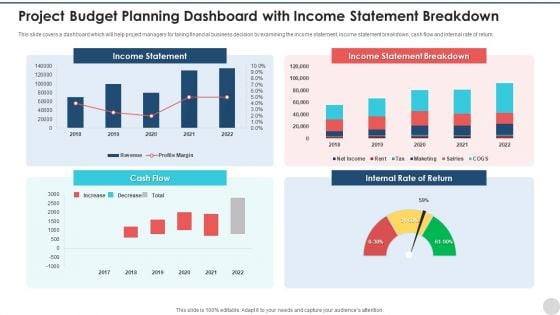
Project Budget Planning Dashboard With Income Statement Breakdown Professional PDF
This slide covers a dashboard which will help project managers for taking financial business decision by examining the income statement, income statement breakdown, cash flow and internal rate of return. Pitch your topic with ease and precision using this project budget planning dashboard with income statement breakdown professional pdf. This layout presents information on income statement, income statement breakdown, cash flow, internal rate of return . It is also available for immediate download and adjustment. So, changes can be made in the color, design, graphics or any other component to create a unique layout.
Dashboard For Tracking Logistics Management Strategy Results Ideas PDF
This slide covers a dashboard for tracking the logistics operations KPIs. It includes metrics such as warehousing operating cost, perfect order rate, total shipments by areas, on time shipments, etc. Pitch your topic with ease and precision using this dashboard for tracking logistics management strategy results ideas pdf. This layout presents information on cost, warehouse, rate. It is also available for immediate download and adjustment. So, changes can be made in the color, design, graphics or any other component to create a unique layout.
Dashboard For Tracking Leadership Growth And Development Program Ideas PDF
This slide exhibits a dashboard for tracking the development of leadership programs for team growth. It covers executive training programs, supervisor competency heatmap, leadership training, etc. Pitch your topic with ease and precision using this dashboard for tracking leadership growth and development program ideas pdf This layout presents information on executive training program, leadership training, completion v or s success It is also available for immediate download and adjustment. So, changes can be made in the color, design, graphics or any other component to create a unique layout.
Dashboard For Tracking Leadership Growth And Development Program Topics PDF
This slide exhibits a dashboard for tracking the development of leadership programs for team growth. It covers executive training programs, supervisor competency heatmap, leadership training, etc. Pitch your topic with ease and precision using this dashboard for tracking leadership growth and development program topics pdf This layout presents information on executive training program, leadership training, completion v or s success It is also available for immediate download and adjustment. So, changes can be made in the color, design, graphics or any other component to create a unique layout.
Salesman Principles Playbook Sales Management Activities Tracking Dashboard Ideas PDF
This slide provides information regarding various metrics catered to track sales team performance in terms of average revenue per account, win rate, NPS, along with sales representative performance tracking through number of opportunities created, lead response time, etc. Deliver and pitch your topic in the best possible manner with this salesman principles playbook sales management activities tracking dashboard ideas pdf Use them to share invaluable insights on sales management activities tracking dashboard and impress your audience. This template can be altered and modified as per your expectations. So, grab it now.
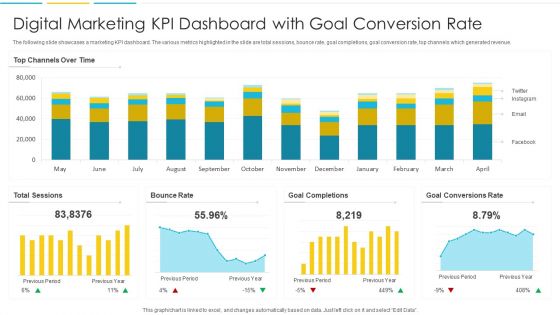
Digital Marketing KPI Dashboard With Goal Conversion Rate Ideas PDF
The following slide showcases a marketing KPI dashboard. The various metrics highlighted in the slide are total sessions, bounce rate, goal completions, goal conversion rate, top channels which generated revenue. Pitch your topic with ease and precision using this Digital Marketing KPI Dashboard With Goal Conversion Rate Ideas PDF. This layout presents information on Rate, Goal, Conversions. It is also available for immediate download and adjustment. So, changes can be made in the color, design, graphics or any other component to create a unique layout.
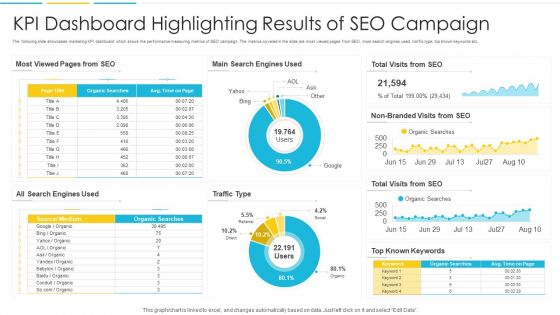
KPI Dashboard Highlighting Results Of SEO Campaign Topics PDF
The following slide showcases marketing KPI dashboard which shows the performance measuring metrics of SEO campaign. The metrics covered in the slide are most viewed pages from SEO, most search engines used, traffic type, top known keywords etc. Pitch your topic with ease and precision using this KPI Dashboard Highlighting Results Of SEO Campaign Topics PDF. This layout presents information on Search Engines, Traffic, Organic. It is also available for immediate download and adjustment. So, changes can be made in the color, design, graphics or any other component to create a unique layout.
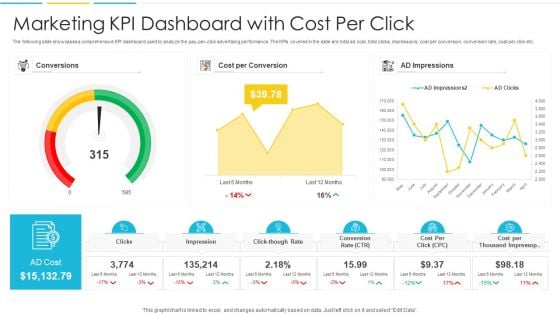
Marketing KPI Dashboard With Cost Per Click Infographics PDF
The following slide showcases a comprehensive KPI dashboard used to analyze the pay-per-click advertising performance. The KPIs covered in the slide are total ad cost, total clicks, impressions, cost per conversion, conversion rate, cost per click etc. Pitch your topic with ease and precision using this Marketing KPI Dashboard With Cost Per Click Infographics PDF. This layout presents information on Conversions, Cost, Impressions. It is also available for immediate download and adjustment. So, changes can be made in the color, design, graphics or any other component to create a unique layout.
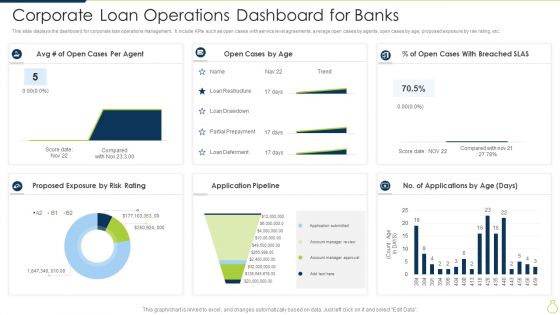
Corporate Loan Operations Dashboard For Banks Introduction PDF
This slide displays the dashboard for corporate loan operations management. It include KPIs such as open cases with service level agreements, average open cases by agents, open cases by age, proposed exposure by risk rating, etc. Pitch your topic with ease and precision using this Corporate Loan Operations Dashboard For Banks Introduction PDF. This layout presents information on Proposed Exposure By Risk Rating, Open Cases By Age, Application Pipeline. It is also available for immediate download and adjustment. So, changes can be made in the color, design, graphics or any other component to create a unique layout.
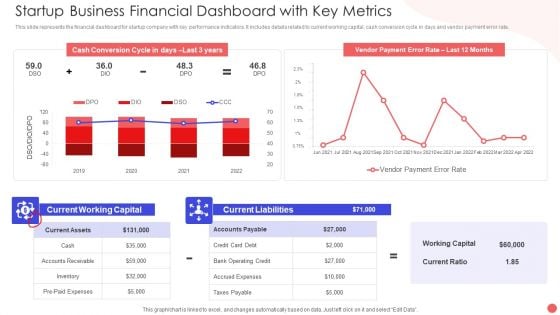
Startup Business Financial Dashboard With Key Metrics Sample PDF
This slide represents the financial dashboard for startup company with key performance indicators. It includes details related to current working capital, cash conversion cycle in days and vendor payment error rate. Pitch your topic with ease and precision using this Startup Business Financial Dashboard With Key Metrics Sample PDF. This layout presents information on Cash Conversion Cycle, Current Working Capital, Current Liabilities Debt. It is also available for immediate download and adjustment. So, changes can be made in the color, design, graphics or any other component to create a unique layout.
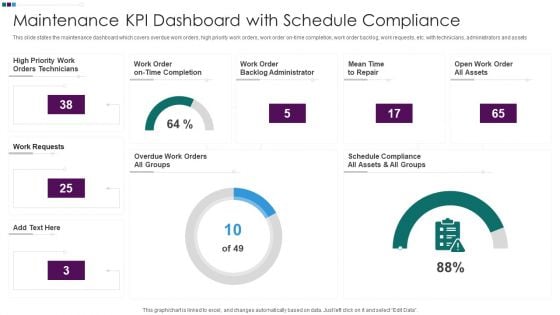
Maintenance KPI Dashboard With Schedule Compliance Ppt Styles Demonstration PDF
This slide states the maintenance dashboard which covers overdue work orders, high priority work orders, work order on-time completion, work order backlog, work requests, etc. with technicians, administrators and assets. Pitch your topic with ease and precision using this Maintenance KPI Dashboard With Schedule Compliance Ppt Styles Demonstration PDF. This layout presents information on High Priority Work, Work Order Backlog, Mean Time Repair, Open Work Order. It is also available for immediate download and adjustment. So, changes can be made in the color, design, graphics or any other component to create a unique layout.
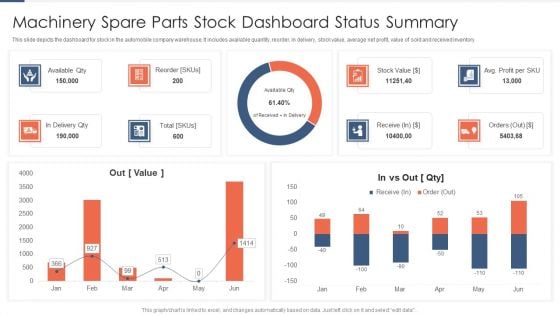
Machinery Spare Parts Stock Dashboard Status Summary Topics PDF
This slide depicts the dashboard for stock in the automobile company warehouse. It includes available quantity, reorder, in delivery, stock value, average net profit, value of sold and received inventory. Pitch your topic with ease and precision using this Machinery Spare Parts Stock Dashboard Status Summary Topics PDF. This layout presents information on Available Qty, Delivery Qty, Reorder. It is also available for immediate download and adjustment. So, changes can be made in the color, design, graphics or any other component to create a unique layout.
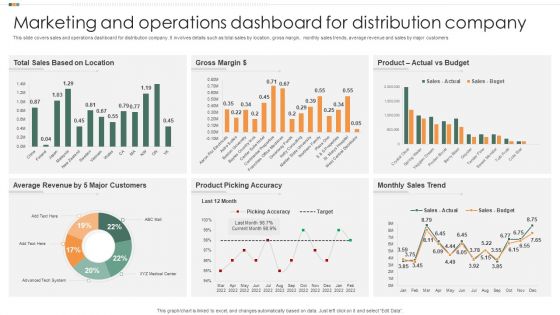
Marketing And Operations Dashboard For Distribution Company Guidelines PDF
This slide covers sales and operations dashboard for distribution company. It involves details such as total sales by location, gross margin, monthly sales trends, average revenue and sales by major customers. Pitch your topic with ease and precision using this Marketing And Operations Dashboard For Distribution Company Guidelines PDF. This layout presents information on Gross Margin, Actual Vs Budget, Product. It is also available for immediate download and adjustment. So, changes can be made in the color, design, graphics or any other component to create a unique layout.

Marketing And Operations Dashboard To Drive Effective Productivity Background PDF
This slide covers sales and operations dashboard to drive effective productivity. It involves details such as number of account assigned, working accounts, engaged accounts and total account activity. Pitch your topic with ease and precision using this Marketing And Operations Dashboard To Drive Effective Productivity Background PDF. This layout presents information on Total Account Activity, Number Of Working Account, Engaged Account. It is also available for immediate download and adjustment. So, changes can be made in the color, design, graphics or any other component to create a unique layout.
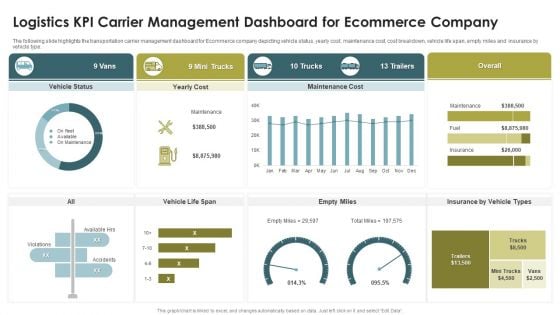
Logistics KPI Carrier Management Dashboard For Ecommerce Company Microsoft PDF
The following slide highlights the transportation carrier management dashboard for Ecommerce company depicting vehicle status, yearly cost, maintenance cost, cost breakdown, vehicle life span, empty miles and insurance by vehicle type. Pitch your topic with ease and precision using this Logistics KPI Carrier Management Dashboard For Ecommerce Company Microsoft PDF. This layout presents information on Mini Trucks, 13 Trailers, Empty Miles, Vehicle Life Span. It is also available for immediate download and adjustment. So, changes can be made in the color, design, graphics or any other component to create a unique layout.
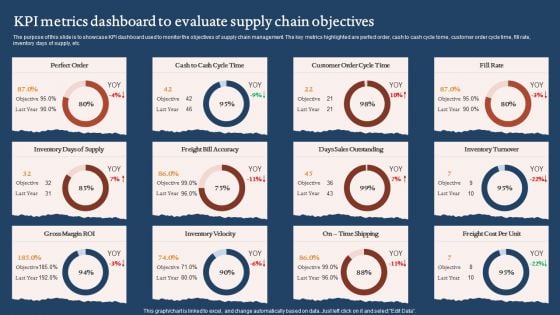
KPI Metrics Dashboard To Evaluate Supply Chain Objectives Graphics PDF
The purpose of this slide is to showcase KPI dashboard used to monitor the objectives of supply chain management. The key metrics highlighted are perfect order, cash to cash cycle tome, customer order cycle time, fill rate, inventory days of supply, etc. Pitch your topic with ease and precision using this KPI Metrics Dashboard To Evaluate Supply Chain Objectives Graphics PDF. This layout presents information on Days Sales Outstanding, Inventory Velocity, Gross Margin Roi. It is also available for immediate download and adjustment. So, changes can be made in the color, design, graphics or any other component to create a unique layout.
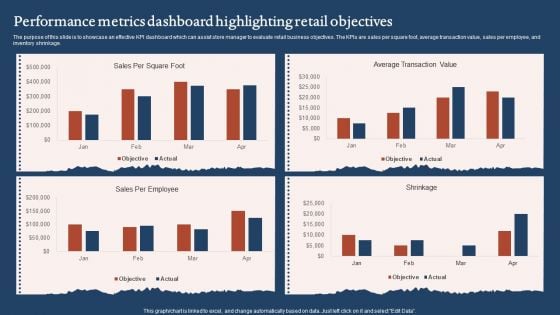
Performance Metrics Dashboard Highlighting Retail Objectives Sample PDF
The purpose of this slide is to showcase an effective KPI dashboard which can assist store manager to evaluate retail business objectives. The KPIs are sales per square foot, average transaction value, sales per employee, and inventory shrinkage. Pitch your topic with ease and precision using this Performance Metrics Dashboard Highlighting Retail Objectives Sample PDF. This layout presents information on Average Transaction Value, Sales Per Employee. It is also available for immediate download and adjustment. So, changes can be made in the color, design, graphics or any other component to create a unique layout.
KPI Dashboard For Tracking Supply Chain Costs Inspiration PDF
This slide represents the KPI dashboard to track the multiple cost associated with supply chain in food manufacturing industry. It includes information regarding cash to cash cycle in days, carry cost of inventory along with details of net sales. Deliver an awe inspiring pitch with this creative KPI Dashboard For Tracking Supply Chain Costs Inspiration PDF bundle. Topics like Supply Chain Costs, Average Cash, Service can be discussed with this completely editable template. It is available for immediate download depending on the needs and requirements of the user.
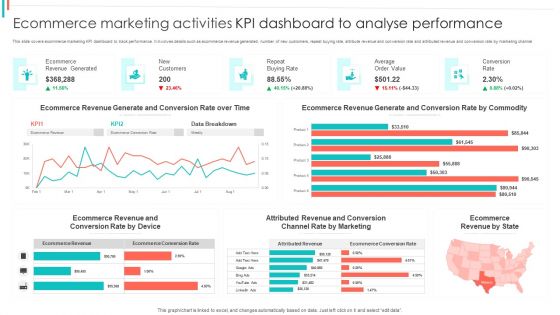
Ecommerce Marketing Activities KPI Dashboard To Analyse Performance Guidelines PDF
This slide covers ecommerce marketing KPI dashboard to track performance. It involves details such as ecommerce revenue generated, number of new customers, repeat buying rate, attribute revenue and conversion rate and attributed revenue and conversion rate by marketing channel.Pitch your topic with ease and precision using this Ecommerce Marketing Activities KPI Dashboard To Analyse Performance Guidelines PDF. This layout presents information on Revenue Generated, Ecommerce Revenue, Generate Conversion. It is also available for immediate download and adjustment. So, changes can be made in the color, design, graphics or any other component to create a unique layout.
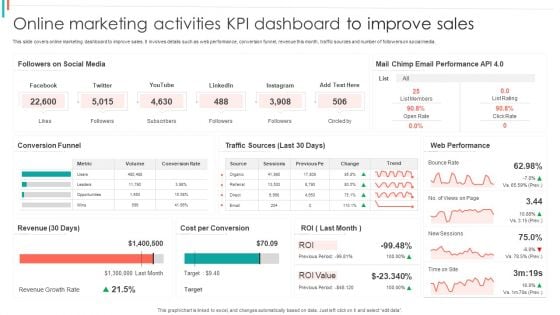
Online Marketing Activities KPI Dashboard To Improve Sales Ideas PDF
This slide covers online marketing dashboard to improve sales. It involves details such as web performance, conversion funnel, revenue this month, traffic sources and number of followers on social media.Pitch your topic with ease and precision using this Online Marketing Activities KPI Dashboard To Improve Sales Ideas PDF. This layout presents information on Email Performance, Web Performance, Cost Conversion. It is also available for immediate download and adjustment. So, changes can be made in the color, design, graphics or any other component to create a unique layout.
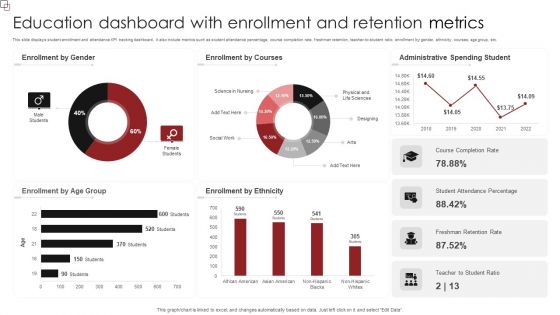
Education Dashboard With Enrollment And Retention Metrics Sample PDF
This slide displays student enrollment and attendance KPI tracking dashboard. It also include metrics such as student attendance percentage, course completion rate, freshman retention, teacher-to-student ratio, enrollment by gender, ethnicity, courses, age group, etc. Pitch your topic with ease and precision using this Education Dashboard With Enrollment And Retention Metrics Sample PDF. This layout presents information on Enrollment Gender, Enrollment Courses, Administrative Spending Student. It is also available for immediate download and adjustment. So, changes can be made in the color, design, graphics or any other component to create a unique layout.
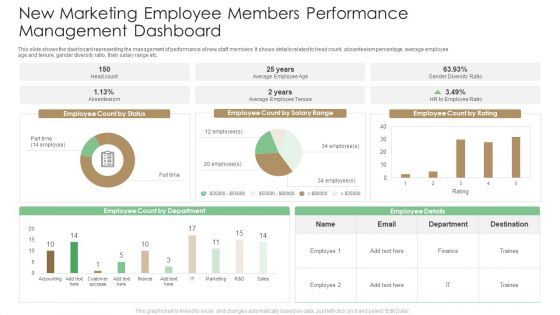
New Marketing Employee Members Performance Management Dashboard Summary PDF
This slide shows the dashboard representing the management of performance of new staff members. It shows details related to head count, absenteeism percentage, average employee age and tenure, gender diversity ratio, their salary range etc. Pitch your topic with ease and precision using this New Marketing Employee Members Performance Management Dashboard Summary PDF. This layout presents information on Employee Ratio, Average Employee Tenure. It is also available for immediate download and adjustment. So, changes can be made in the color, design, graphics or any other component to create a unique layout.
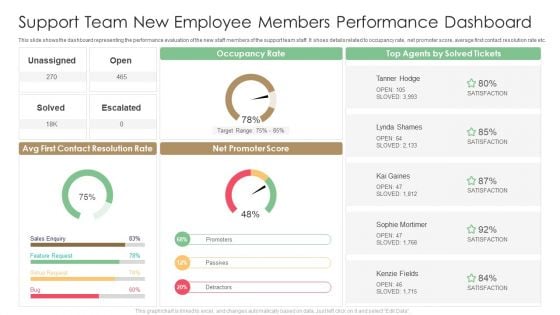
Support Team New Employee Members Performance Dashboard Designs PDF
This slide shows the dashboard representing the performance evaluation of the new staff members of the support team staff. It shoes details related to occupancy rate, net promoter score, average first contact resolution rate etc. Pitch your topic with ease and precision using this Support Team New Employee Members Performance Dashboard Designs PDF. This layout presents information on Target Range, Occupancy Rate, Contact Resolution Rate. It is also available for immediate download and adjustment. So, changes can be made in the color, design, graphics or any other component to create a unique layout.
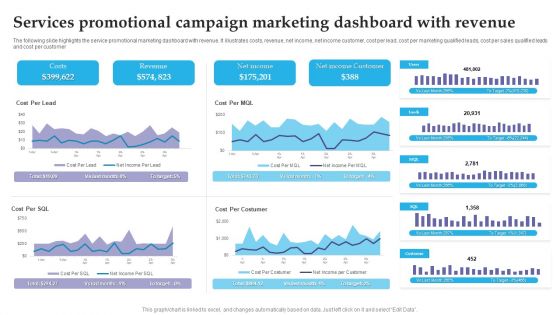
Services Promotional Campaign Marketing Dashboard With Revenue Brochure PDF
The following slide highlights the service promotional marketing dashboard with revenue. It illustrates costs, revenue, net income, net income customer, cost per lead, cost per marketing qualified leads, cost per sales qualified leads and cost per customer. Pitch your topic with ease and precision using this Services Promotional Campaign Marketing Dashboard With Revenue Brochure PDF. This layout presents information on Costs, Revenue, Net Income. It is also available for immediate download and adjustment. So, changes can be made in the color, design, graphics or any other component to create a unique layout.
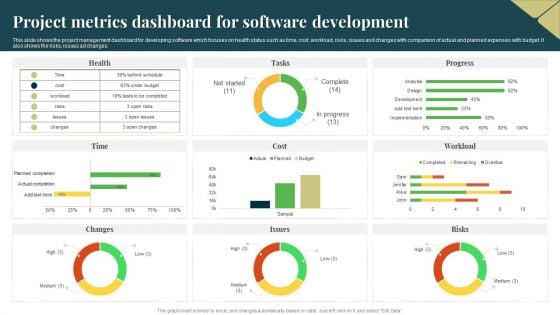
Project Metrics Dashboard For Software Development Designs PDF
This slide shows the project management dashboard for developing software which focuses on health status such as time, cost, workload, risks, issues and changes with comparison of actual and planned expenses with budget. It also shows the risks, issues ad changes. Pitch your topic with ease and precision using this Project Metrics Dashboard For Software Development Designs PDF. This layout presents information on Risks, Budget, Cost. It is also available for immediate download and adjustment. So, changes can be made in the color, design, graphics or any other component to create a unique layout.

Project Metrics Dashboard With Average Margin Sample PDF
This slide focuses on project management dashboard which covers number of active projects, average margin, revenues, costs, tasks status, resources with planned and actual efforts, available hours, tasks assignments with project deadlines, client, etc. Pitch your topic with ease and precision using this Project Metrics Dashboard With Average Margin Sample PDF. This layout presents information on Average Margin, Revenue, Cost. It is also available for immediate download and adjustment. So, changes can be made in the color, design, graphics or any other component to create a unique layout.
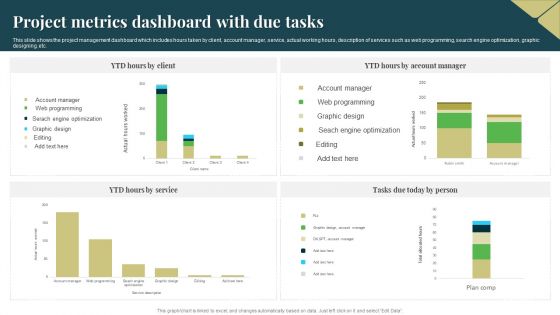
Project Metrics Dashboard With Due Tasks Microsoft PDF
This slide shows the project management dashboard which includes hours taken by client, account manager, service, actual working hours, description of services such as web programming, search engine optimization, graphic designing, etc. Pitch your topic with ease and precision using this Project Metrics Dashboard With Due Tasks Microsoft PDF. This layout presents information on Service, Optimization, Graphic Design. It is also available for immediate download and adjustment. So, changes can be made in the color, design, graphics or any other component to create a unique layout.
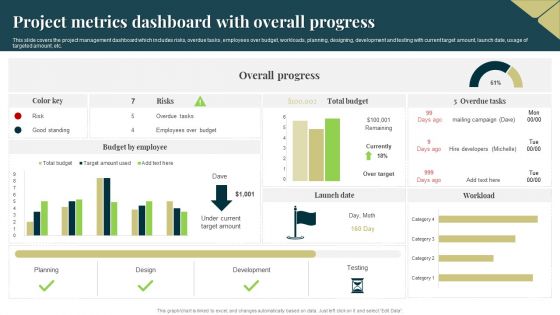
Project Metrics Dashboard With Overall Progress Brochure PDF
This slide covers the project management dashboard which includes risks, overdue tasks, employees over budget, workloads, planning, designing, development and testing with current target amount, launch date, usage of targeted amount, etc. Pitch your topic with ease and precision using this Project Metrics Dashboard With Overall Progress Brochure PDF. This layout presents information on Design, Planning, Development. It is also available for immediate download and adjustment. So, changes can be made in the color, design, graphics or any other component to create a unique layout.

Project Metrics Dashboard With Task Status Rules PDF
This slide shows the project management dashboard which shows the number of team members of managing project activities, estimated and actual time to complete the project task, hours taken by employees with achieved and open milestones and progress status. Pitch your topic with ease and precision using this Project Metrics Dashboard With Task Status Rules PDF. This layout presents information on Team Members, Employee. It is also available for immediate download and adjustment. So, changes can be made in the color, design, graphics or any other component to create a unique layout.
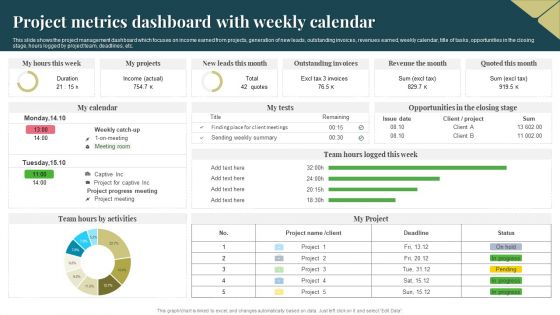
Project Metrics Dashboard With Weekly Calendar Download PDF
This slide shows the project management dashboard which focuses on income earned from projects, generation of new leads, outstanding invoices, revenues earned, weekly calendar, title of tasks, opportunities in the closing stage, hours logged by project team, deadlines, etc. Pitch your topic with ease and precision using this Project Metrics Dashboard With Weekly Calendar Download PDF. This layout presents information on Income, Revenue, Project. It is also available for immediate download and adjustment. So, changes can be made in the color, design, graphics or any other component to create a unique layout.
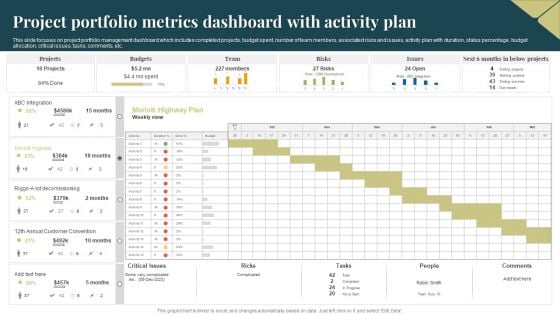
Project Portfolio Metrics Dashboard With Activity Plan Clipart PDF
This slide focuses on project portfolio management dashboard which includes completed projects, budget spent, number of team members, associated risks and issues, activity plan with duration, status percentage, budget allocation, critical issues, tasks, comments, etc. Pitch your topic with ease and precision using this Project Portfolio Metrics Dashboard With Activity Plan Clipart PDF. This layout presents information on Budgets, Team, Risks. It is also available for immediate download and adjustment. So, changes can be made in the color, design, graphics or any other component to create a unique layout.
Dashboard Tracking Essential Kpis For Ecommerce Performance Slides PDF
This slide provides information regarding essential KPIs for ecommerce performance dashboard tracking average bounce rate, new vs. old customers, channel revenue vs. channel acquisitions costs, channel revenue vs. sales, average conversion rate, etc. Deliver an awe inspiring pitch with this creative Dashboard Tracking Essential Kpis For Ecommerce Performance Slides PDF bundle. Topics like Average Bounce Rate, Channel Acquisition Costs, Channel Revenue can be discussed with this completely editable template. It is available for immediate download depending on the needs and requirements of the user.
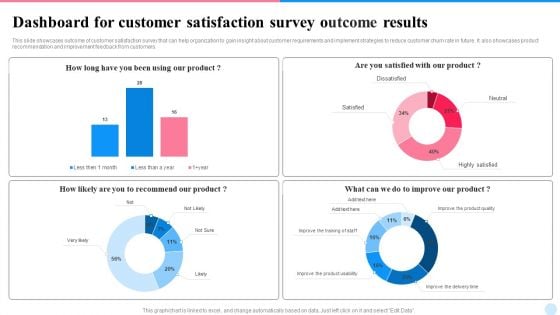
Dashboard For Customer Satisfaction Survey Outcome Results Topics PDF
This slide showcases outcome of customer satisfaction survey that can help organization to gain insight about customer requirements and implement strategies to reduce customer churn rate in future. It also showcases product recommendation and improvement feedback from customers. Pitch your topic with ease and precision using this Dashboard For Customer Satisfaction Survey Outcome Results Topics PDF. This layout presents information on Dashboard, Customer Satisfaction, Survey Outcome Results. It is also available for immediate download and adjustment. So, changes can be made in the color, design, graphics or any other component to create a unique layout.
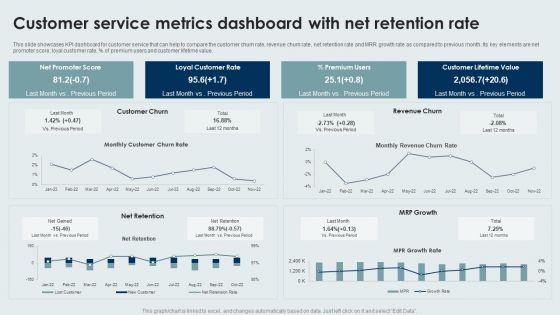
Customer Service Metrics Dashboard With Net Retention Rate Sample PDF
This slide showcases KPI dashboard for customer service that can help to compare the customer churn rate, revenue churn rate, net retention rate and MRR growth rate as compared to previous month. Its key elements are net promoter score, loyal customer rate, percentage of premium users and customer lifetime value. Pitch your topic with ease and precision using this Customer Service Metrics Dashboard With Net Retention Rate Sample PDF. This layout presents information on Loyal Customer Rate, Premium Users, Customer Lifetime Value. It is also available for immediate download and adjustment. So, changes can be made in the color, design, graphics or any other component to create a unique layout.
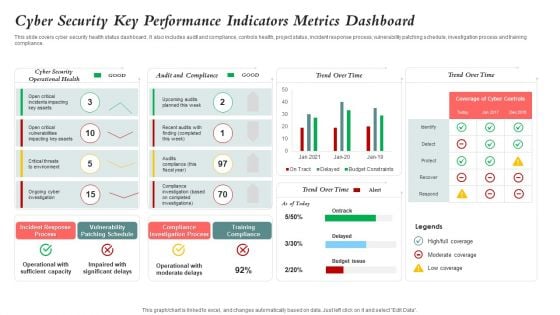
Cyber Security Key Performance Indicators Metrics Dashboard Mockup PDF
This slide covers cyber security health status dashboard . It also includes audit and compliance, controls health, project status, incident response process, vulnerability patching schedule, investigation process and training compliance. Pitch your topic with ease and precision using this Cyber Security Key Performance Indicators Metrics Dashboard Mockup PDF. This layout presents information on Cyber Security, Vulnerability Patching Schedule, Compliance Investigation Process. It is also available for immediate download and adjustment. So, changes can be made in the color, design, graphics or any other component to create a unique layout.
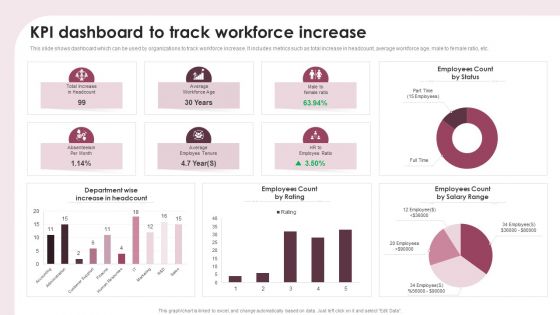
KPI Dashboard To Track Workforce Increase Ppt Show Portfolio PDF
This slide shows dashboard which can be used by organizations to track workforce increase. It includes metrics such as total increase in headcount, average workforce age, male to female ratio, etc. Pitch your topic with ease and precision using this KPI Dashboard To Track Workforce Increase Ppt Show Portfolio PDF. This layout presents information on Department Wise, Increase Headcount, Employees Count Rating. It is also available for immediate download and adjustment. So, changes can be made in the color, design, graphics or any other component to create a unique layout.

Health And Risk KPI Dashboard Ppt Pictures Designs Download PDF
The slide highlights the health and safety key performance indicator dashboard illustrating key headings which includes key objectives, inspections, total reports vs over due reports, injuries by body part and accident trends. Pitch your topic with ease and precision using this Health And Risk KPI Dashboard Ppt Pictures Designs Download PDF. This layout presents information on Key Objectives, Inspections, Accidents Trends. It is also available for immediate download and adjustment. So, changes can be made in the color, design, graphics or any other component to create a unique layout.
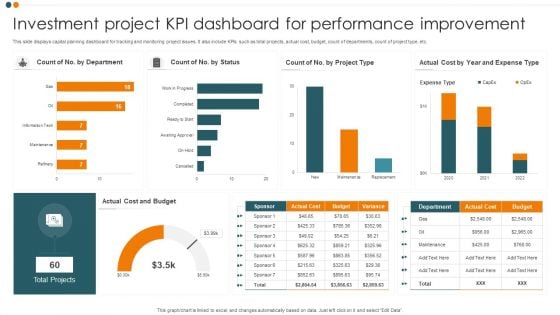
Investment Project KPI Dashboard For Performance Improvement Guidelines PDF
This slide displays capital planning dashboard for tracking and monitoring project issues. It also include KPIs such as total projects, actual cost, budget, count of departments, count of project type, etc. Pitch your topic with ease and precision using this Investment Project KPI Dashboard For Performance Improvement Guidelines PDF. This layout presents information on Cost And Budget, Total Projects, Expense Type. It is also available for immediate download and adjustment. So, changes can be made in the color, design, graphics or any other component to create a unique layout.
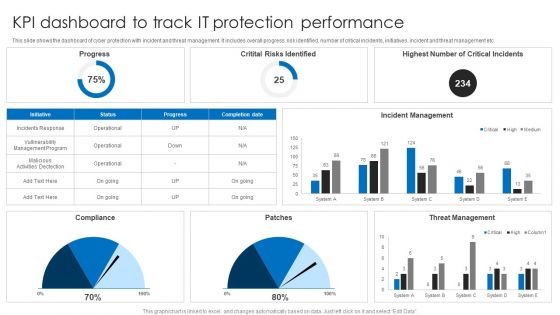
KPI Dashboard To Track IT Protection Performance Elements PDF
This slide shows the dashboard of cyber protection with incident and threat management. It includes overall progress, risk identified, number of critical incidents, initiatives, incident and threat management etc. Pitch your topic with ease and precision using this KPI Dashboard To Track IT Protection Performance Elements PDF. This layout presents information on Incident Management, Threat Management, Critital Risks Identified. It is also available for immediate download and adjustment. So, changes can be made in the color, design, graphics or any other component to create a unique layout.
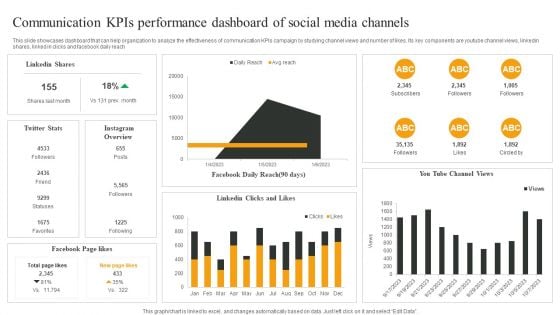
Communication Kpis Performance Dashboard Of Social Media Channels Mockup PDF
This slide showcases dashboard that can help organization to analyze the effectiveness of communication KPIs campaign by studying channel views and number of likes. Its key components are youtube channel views, linkedin shares, linked in clicks and facebook daily reach. Pitch your topic with ease and precision using this Communication Kpis Performance Dashboard Of Social Media Channels Mockup PDF. This layout presents information on Linkedin Shares, Facebook Page likes, Facebook Daily Reach. It is also available for immediate download and adjustment. So, changes can be made in the color, design, graphics or any other component to create a unique layout.
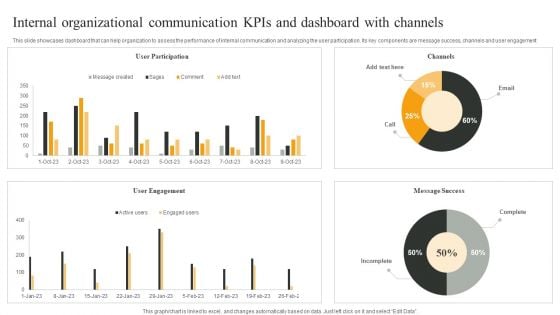
Internal Organizational Communication Kpis And Dashboard With Channels Infographics PDF
This slide showcases dashboard that can help organization to assess the performance of internal communication and analyzing the user participation. Its key components are message success, channels and user engagement. Pitch your topic with ease and precision using this Internal Organizational Communication Kpis And Dashboard With Channels Infographics PDF. This layout presents information on User Participation, User Engagement, Message Success. It is also available for immediate download and adjustment. So, changes can be made in the color, design, graphics or any other component to create a unique layout.
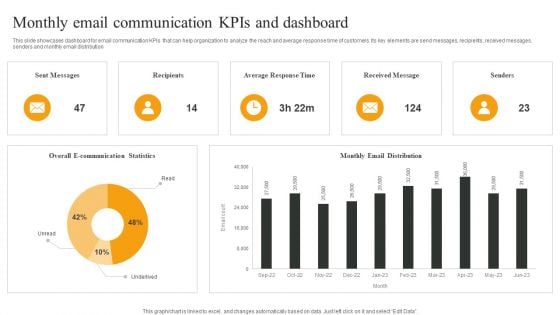
Monthly Email Communication Kpis And Dashboard Download PDF
This slide showcases dashboard for email communication KPIs that can help organization to analyze the reach and average response time of customers. Its key elements are send messages, recipients, received messages, senders and monthly email distribution. Pitch your topic with ease and precision using this Monthly Email Communication Kpis And Dashboard Download PDF. This layout presents information on Sent Messages, Recipients, Average Response Time, Received Message. It is also available for immediate download and adjustment. So, changes can be made in the color, design, graphics or any other component to create a unique layout.
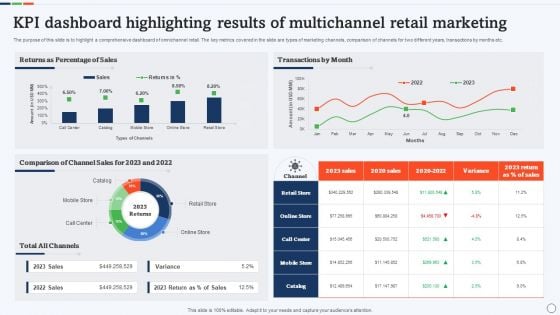
KPI Dashboard Highlighting Results Of Multichannel Retail Marketing Rules PDF
The purpose of this slide is to highlight a comprehensive dashboard of omnichannel retail. The key metrics covered in the slide are types of marketing channels, comparison of channels for two different years, transactions by months etc. Pitch your topic with ease and precision using this KPI Dashboard Highlighting Results Of Multichannel Retail Marketing Rules PDF. This layout presents information on Comparison Of Channel Sales, Percentage Of Sales, Transactions By Month. It is also available for immediate download and adjustment. So, changes can be made in the color, design, graphics or any other component to create a unique layout.
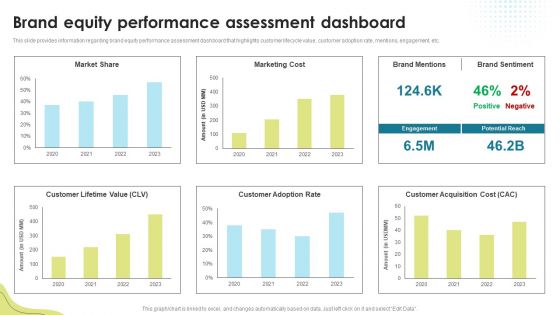
Brand Equity Performance Assessment Dashboard Brand Administration Template PDF
This slide provides information regarding brand equity performance assessment dashboard that highlights customer lifecycle value, customer adoption rate, mentions, engagement, etc. This modern and well-arranged Brand Equity Performance Assessment Dashboard Brand Administration Template PDF provides lots of creative possibilities. It is very simple to customize and edit with the Powerpoint Software. Just drag and drop your pictures into the shapes. All facets of this template can be edited with Powerpoint no extra software is necessary. Add your own material, put your images in the places assigned for them, adjust the colors, and then you can show your slides to the world, with an animated slide included.
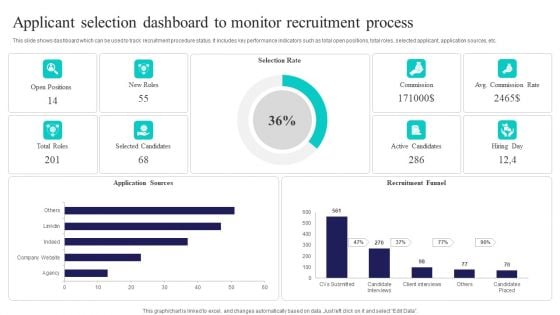
Applicant Selection Dashboard To Monitor Recruitment Process Sample PDF
This slide shows dashboard which can be used to track recruitment procedure status. It includes key performance indicators such as total open positions, total roles, selected applicant, application sources, etc. Pitch your topic with ease and precision using this Applicant Selection Dashboard To Monitor Recruitment Process Sample PDF. This layout presents information on Selection Rate, Recruitment Funnel, Application Sources. It is also available for immediate download and adjustment. So, changes can be made in the color, design, graphics or any other component to create a unique layout.
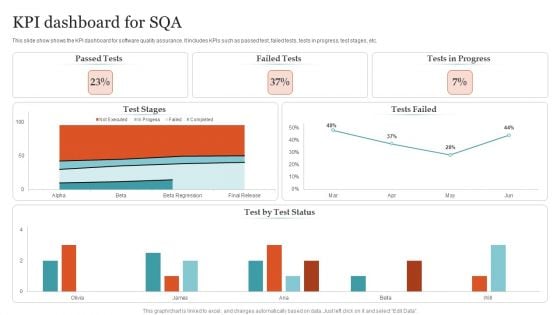
KPI Dashboard For SQA Ppt PowerPoint Presentation Gallery Structure PDF
This slide show shows the KPI dashboard for software quality assurance. It includes KPIs such as passed test, failed tests, tests in progress, test stages, etc. Pitch your topic with ease and precision using this KPI Dashboard For SQA Ppt PowerPoint Presentation Gallery Structure PDF. This layout presents information on Passed Tests, Failed Tests, Tests Progress . It is also available for immediate download and adjustment. So, changes can be made in the color, design, graphics or any other component to create a unique layout.
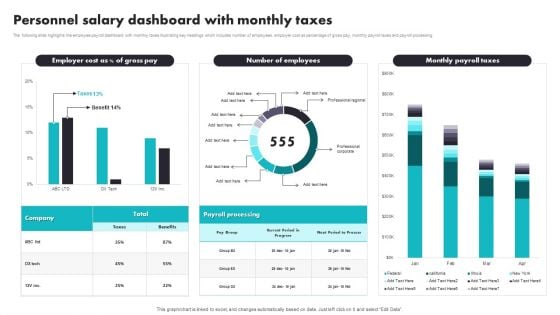
Personnel Salary Dashboard With Monthly Taxes Introduction PDF
The following slide highlights the employee payroll dashboard with monthly taxes illustrating key headings which includes number of employees, employer cost as percentage of gross pay, monthly payroll taxes and payroll processing. Pitch your topic with ease and precision using this Personnel Salary Dashboard With Monthly Taxes Introduction PDF. This layout presents information on Payroll Processing, Benefits. It is also available for immediate download and adjustment. So, changes can be made in the color, design, graphics or any other component to create a unique layout.
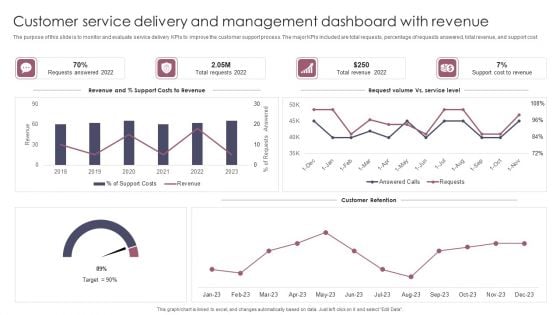
Customer Service Delivery And Management Dashboard With Revenue Brochure PDF
The purpose of this slide is to monitor and evaluate service delivery KPIs to improve the customer support process. The major KPIs included are total requests, percentage of requests answered, total revenue, and support cost. Pitch your topic with ease and precision using this Customer Service Delivery And Management Dashboard With Revenue Brochure PDF. This layout presents information on Customer Service Delivery, Management Dashboard With Revenue. It is also available for immediate download and adjustment. So, changes can be made in the color, design, graphics or any other component to create a unique layout.
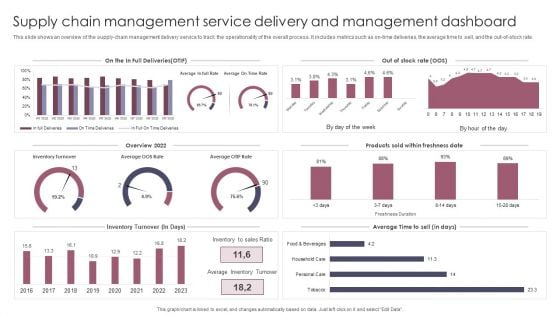
Supply Chain Management Service Delivery And Management Dashboard Guidelines PDF
This slide shows an overview of the supply chain management delivery service to track the operationality of the overall process. It includes metrics such as on time deliveries, the average time to sell, and the out of stock rate. Pitch your topic with ease and precision using this Supply Chain Management Service Delivery And Management Dashboard Guidelines PDF. This layout presents information on Supply Chain Management, Service Delivery, Management Dashboard. It is also available for immediate download and adjustment. So, changes can be made in the color, design, graphics or any other component to create a unique layout.
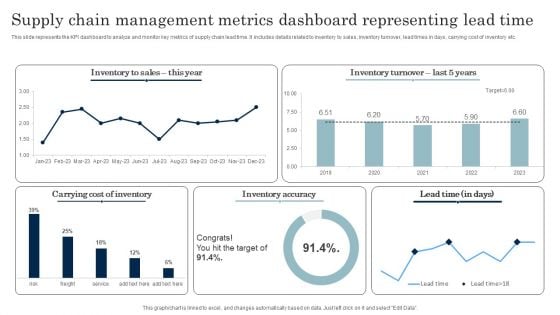
Supply Chain Management Metrics Dashboard Representing Lead Time Download PDF
This slide represents the KPI dashboard to analyze and monitor key metrics of supply chain lead time. It includes details related to inventory to sales, inventory turnover, lead times in days, carrying cost of inventory etc. Pitch your topic with ease and precision using this Supply Chain Management Metrics Dashboard Representing Lead Time Download PDF. This layout presents information on Inventory Accuracy, Carrying Cost Of Inventory. It is also available for immediate download and adjustment. So, changes can be made in the color, design, graphics or any other component to create a unique layout.
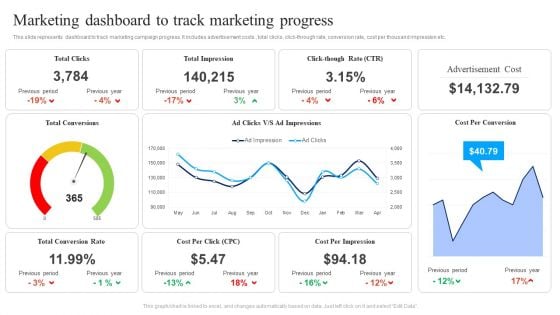
Marketing Dashboard To Track Marketing Progress Ppt Tips PDF
This slide represents dashboard to track marketing campaign progress. It includes advertisement costs , total clicks, click-through rate, conversion rate, cost per thousand impression etc. Pitch your topic with ease and precision using this Marketing Dashboard To Track Marketing Progress Ppt Tips PDF. This layout presents information on Total Clicks, Total Impression, Total Conversion Rate, Cost Per Click. It is also available for immediate download and adjustment. So, changes can be made in the color, design, graphics or any other component to create a unique layout.
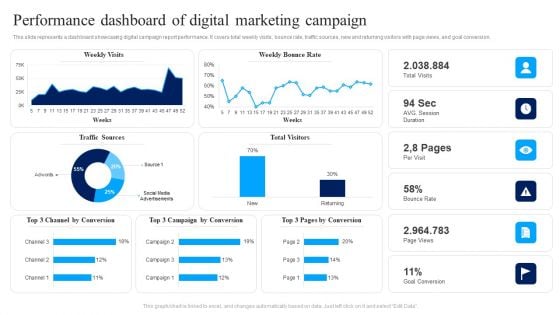
Performance Dashboard Of Digital Marketing Campaign Ppt Show Slide PDF
This slide represents a dashboard showcasing digital campaign report performance. It covers total weekly visits, bounce rate, traffic sources, new and returning visitors with page views, and goal conversion. Pitch your topic with ease and precision using this Performance Dashboard Of Digital Marketing Campaign Ppt Show Slide PDF. This layout presents information on Weekly Visits, Weekly Bounce Rate, Bounce Rate. It is also available for immediate download and adjustment. So, changes can be made in the color, design, graphics or any other component to create a unique layout.
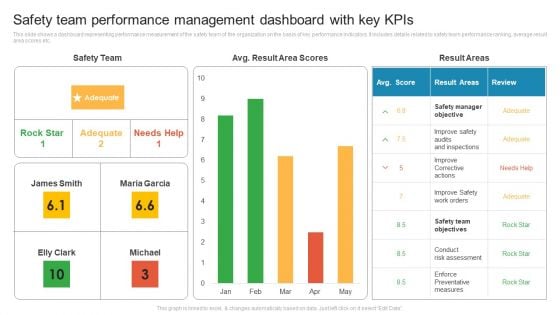
Safety Team Performance Management Dashboard With Key Kpis Rules PDF
This slide shows a dashboard representing performance measurement of the safety team of the organization on the basis of key performance indicators. It includes details related to safety team performance ranking, average result area scores etc. Pitch your topic with ease and precision using this Safety Team Performance Management Dashboard With Key Kpis Rules PDF. This layout presents information on Improve Corrective Actions, Safety Manager Objective, Conduct Risk Assessment. It is also available for immediate download and adjustment. So, changes can be made in the color, design, graphics or any other component to create a unique layout.
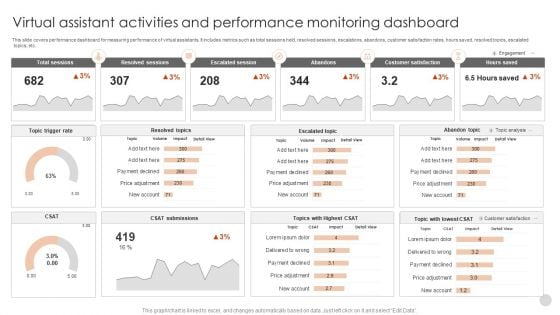
Virtual Assistant Activities And Performance Monitoring Dashboard Guidelines PDF
This slide covers performance dashboard for measuring performance of virtual assistants. It includes metrics such as total sessions held, resolved sessions, escalations, abandons, customer satisfaction rates, hours saved, resolved topics, escalated topics, etc.Pitch your topic with ease and precision using this Virtual Assistant Activities And Performance Monitoring Dashboard Guidelines PDF. This layout presents information on Total Sessions, Resolved Sessions, Escalated Session. It is also available for immediate download and adjustment. So, changes can be made in the color, design, graphics or any other component to create a unique layout.
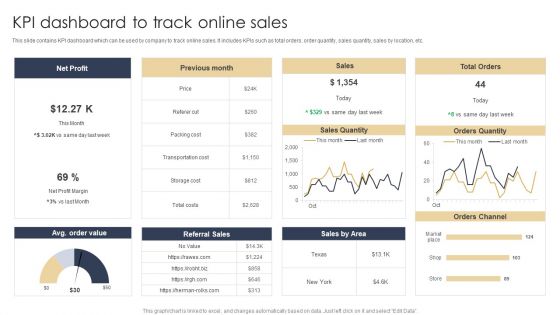
KPI Dashboard To Track Online Sales Structure PDF
This slide contains KPI dashboard which can be used by company to track online sales. It includes KPIs such as total orders, order quantity, sales quantity, sales by location, etc. Pitch your topic with ease and precision using this KPI Dashboard To Track Online Sales Structure PDF. This layout presents information on Net Profit, Sales, Orders Quantity. It is also available for immediate download and adjustment. So, changes can be made in the color, design, graphics or any other component to create a unique layout.

 Home
Home