Data Analytics Icons
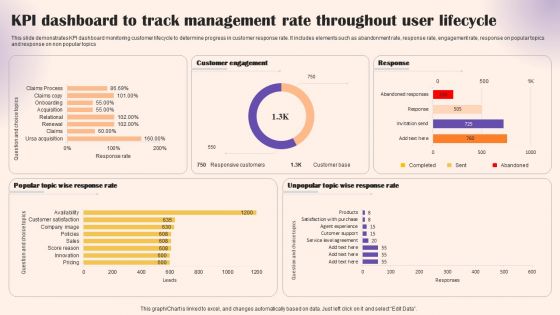
KPI Dashboard To Track Management Rate Throughout User Lifecycle Portrait PDF
This slide demonstrates KPI dashboard monitoring customer lifecycle to determine progress in customer response rate. It includes elements such as abandonment rate, response rate, engagement rate, response on popular topics and response on non popular topics. Showcasing this set of slides titled KPI Dashboard To Track Management Rate Throughout User Lifecycle Portrait PDF. The topics addressed in these templates are Customer Engagement, Response, Response Rate. All the content presented in this PPT design is completely editable. Download it and make adjustments in color, background, font etc. as per your unique business setting.
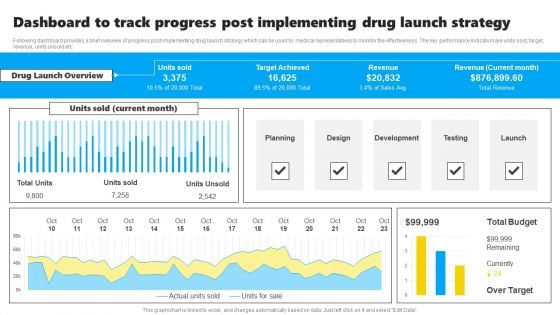
Dashboard To Track Progress Post Implementing Drug Launch Strategy Slides PDF
Following dashboard provides a brief overview of progress post implementing drug launch strategy which can be used by medical representatives to monitor the effectiveness. The key performance indicators are units sold, target, revenue, units unsold etc. Showcasing this set of slides titled Dashboard To Track Progress Post Implementing Drug Launch Strategy Slides PDF. The topics addressed in these templates are Planning, Design, Development, Testing, Launch. All the content presented in this PPT design is completely editable. Download it and make adjustments in color, background, font etc. as per your unique business setting.
Monthly Sales KPI Dashboard For Tracking Brand Recommendation Progress Background PDF
Following slide demonstrates key performance indicator dashboard for tracking monthly sales to monitor business performance. It includes components such as monthly execution cost, sales, state wise events, Brand market, and programs. Showcasing this set of slides titled Monthly Sales KPI Dashboard For Tracking Brand Recommendation Progress Background PDF. The topics addressed in these templates are Products Sold, Engagements, Events, Active Markets, Sampled, Attendance. All the content presented in this PPT design is completely editable. Download it and make adjustments in color, background, font etc. as per your unique business setting.
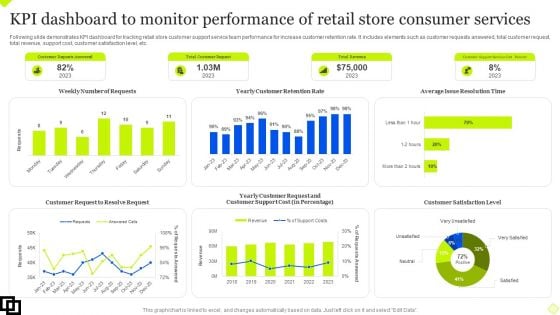
KPI Dashboard To Monitor Performance Of Retail Store Consumer Services Summary PDF
Following slide demonstrates KPI dashboard for tracking retail store customer support service team performance for increase customer retention rate. It includes elements such as customer requests answered, total customer request, total revenue, support cost, customer satisfaction level, etc. Showcasing this set of slides titled KPI Dashboard To Monitor Performance Of Retail Store Consumer Services Summary PDF. The topics addressed in these templates are Customer Request, Customer Retention Rate, Customer Satisfaction Level. All the content presented in this PPT design is completely editable. Download it and make adjustments in color, background, font etc. as per your unique business setting.
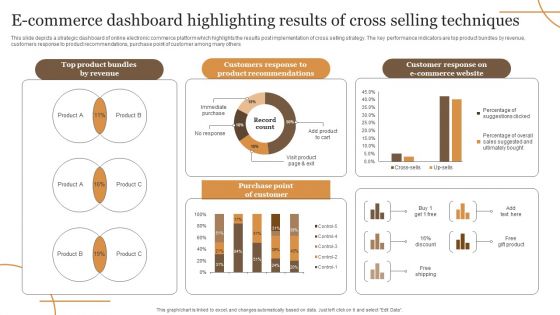
E Commerce Dashboard Highlighting Results Of Cross Selling Techniques Elements PDF
This slide depicts a strategic dashboard of online electronic commerce platform which highlights the results post implementation of cross selling strategy. The key performance indicators are top product bundles by revenue, customers response to product recommendations, purchase point of customer among many others. Showcasing this set of slides titled E Commerce Dashboard Highlighting Results Of Cross Selling Techniques Elements PDF. The topics addressed in these templates are Revenue, E Commerce Website, Purchase. All the content presented in this PPT design is completely editable. Download it and make adjustments in color, background, font etc. as per your unique business setting.
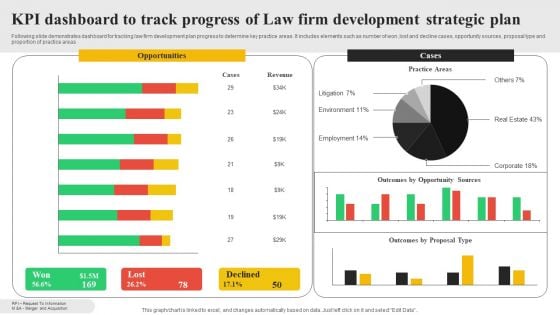
KPI Dashboard To Track Progress Of Law Firm Development Strategic Plan Infographics PDF
Following slide demonstrates dashboard for tracking law firm development plan progress to determine key practice areas. It includes elements such as number of won ,lost and decline cases, opportunity sources, proposal type and proportion of practice areas. Showcasing this set of slides titled KPI Dashboard To Track Progress Of Law Firm Development Strategic Plan Infographics PDF. The topics addressed in these templates are Opportunities, Cases, Practice Areas. All the content presented in this PPT design is completely editable. Download it and make adjustments in color, background, font etc. as per your unique business setting.
Real Time Employment Tracking Dashboard With Human Resource Metrics Brochure PDF
This slide showcases dashboard that can help human resource manager to track the salary and hiring status of employee in organization. Its key KPIs are permanent rate, turnover rate, absenteeism rate, employees hired and employees left. Showcasing this set of slides titled Real Time Employment Tracking Dashboard With Human Resource Metrics Brochure PDF. The topics addressed in these templates are Average Age, Permanent Rate, Headcount. All the content presented in this PPT design is completely editable. Download it and make adjustments in color, background, font etc. as per your unique business setting.
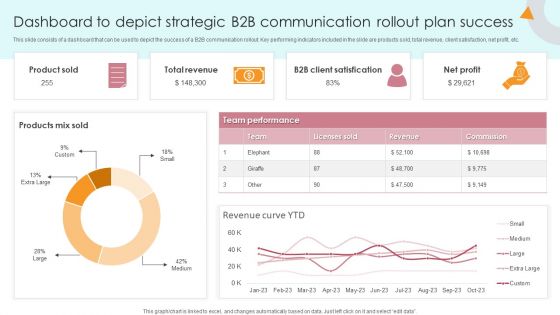
Dashboard To Depict Strategic B2B Communication Rollout Plan Success Portrait PDF
This slide consists of a dashboard that can be used to depict the success of a B2B communication rollout. Key performing indicators included in the slide are products sold, total revenue, client satisfaction, net profit, etc. Showcasing this set of slides titled Dashboard To Depict Strategic B2B Communication Rollout Plan Success Portrait PDF. The topics addressed in these templates are Product Sold, Total Revenue, B2b Client Satisfication. All the content presented in this PPT design is completely editable. Download it and make adjustments in color, background, font etc. as per your unique business setting.

Business Continuous Process Improvement KPI Dashboard In Healthcare Industry Guidelines PDF
Following slides shows the complete outline of healthcare business process improvement KPI dashboard which will assist in providing better services to patients . The major metrics mentioned in a slide are such as average patients discharge by hour or on weekly basis Showcasing this set of slides titled Business Continuous Process Improvement KPI Dashboard In Healthcare Industry Guidelines PDF. The topics addressed in these templates are Patients, Discharge List, Healthcare Industry. All the content presented in this PPT design is completely editable. Download it and make adjustments in color, background, font etc. as per your unique business setting.
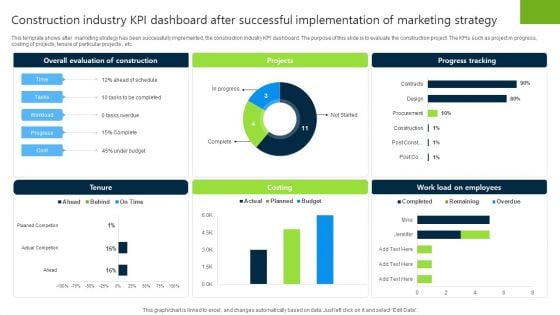
Construction Industry KPI Dashboard After Successful Implementation Of Marketing Strategy Sample PDF
This template shows after marketing strategy has been successfully implemented, the construction industry KPI dashboard. The purpose of this slide is to evaluate the construction project. The KPIs such as project in progress, costing of projects, tenure of particular projects , etc. Showcasing this set of slides titled Construction Industry KPI Dashboard After Successful Implementation Of Marketing Strategy Sample PDF. The topics addressed in these templates are Projetcs, Progress Tracking, Costing. All the content presented in this PPT design is completely editable. Download it and make adjustments in color, background, font etc. as per your unique business setting.
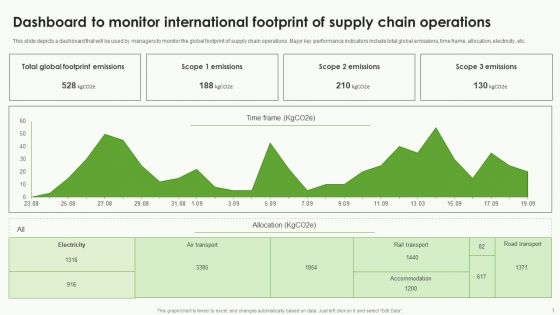
Dashboard To Monitor International Footprint Of Supply Chain Operations Brochure PDF
This slide depicts a dashboard that will be used by managers to monitor the global footprint of supply chain operations. Major key performance indicators include total global emissions, time frame, allocation, electricity, etc. Showcasing this set of slides titled Dashboard To Monitor International Footprint Of Supply Chain Operations Brochure PDF. The topics addressed in these templates are Electricity, Footprint Emissions, Allocation. All the content presented in this PPT design is completely editable. Download it and make adjustments in color, background, font etc. as per your unique business setting.
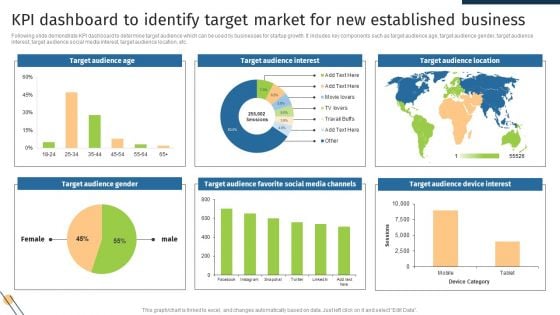
KPI Dashboard To Identify Target Market For New Established Business Formats PDF
Following slide demonstrate KPI dashboard to determine target audience which can be used by businesses for startup growth. It includes key components such as target audience age, target audience gender, target audience interest, target audience social media interest, target audience location, etc. Showcasing this set of slides titled KPI Dashboard To Identify Target Market For New Established Business Formats PDF. The topics addressed in these templates are Target Audience Age, Target Audience Interest, Target Audience Location. All the content presented in this PPT design is completely editable. Download it and make adjustments in color, background, font etc. as per your unique business setting.
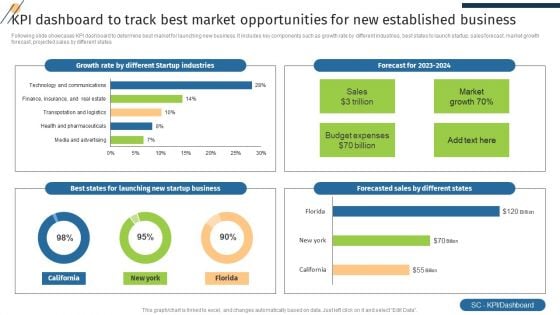
KPI Dashboard To Track Best Market Opportunities For New Established Business Pictures PDF
Following slide showcases KPI dashboard to determine best market for launching new business. It includes key components such as growth rate by different industries, best states to launch startup, sales forecast, market growth forecast, projected sales by different states. Showcasing this set of slides titled KPI Dashboard To Track Best Market Opportunities For New Established Business Pictures PDF. The topics addressed in these templates are Forecasted Sales, Growth Rate, Startup Industries. All the content presented in this PPT design is completely editable. Download it and make adjustments in color, background, font etc. as per your unique business setting.
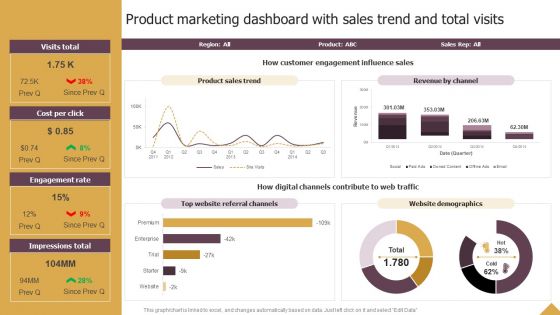
Product Marketing Dashboard With Sales Trend And Total Visits Ppt Inspiration Show PDF
Explore a selection of the finest Product Marketing Dashboard With Sales Trend And Total Visits Ppt Inspiration Show PDF here. With a plethora of professionally designed and pre made slide templates, you can quickly and easily find the right one for your upcoming presentation. You can use our Product Marketing Dashboard With Sales Trend And Total Visits Ppt Inspiration Show PDF to effectively convey your message to a wider audience. Slidegeeks has done a lot of research before preparing these presentation templates. The content can be personalized and the slides are highly editable. Grab templates today from Slidegeeks.
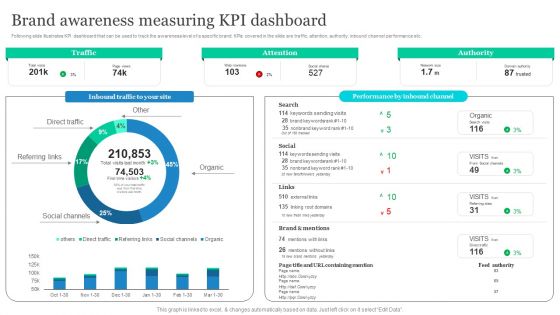
Effective Product Positioning Approach Brand Awareness Measuring Kpi Dashboard Ideas PDF
Following slide illustrates KPI dashboard that can be used to track the awareness level of a specific brand. KPIs covered in the slide are traffic, attention, authority, inbound channel performance etc. Boost your pitch with our creative Effective Product Positioning Approach Brand Awareness Measuring Kpi Dashboard Ideas PDF. Deliver an awe-inspiring pitch that will mesmerize everyone. Using these presentation templates you will surely catch everyones attention. You can browse the ppts collection on our website. We have researchers who are experts at creating the right content for the templates. So you do not have to invest time in any additional work. Just grab the template now and use them.
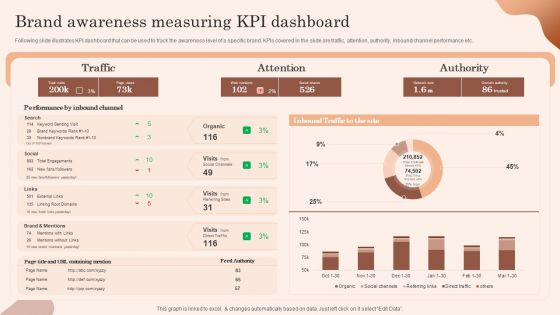
Building Market Brand Leadership Strategies Brand Awareness Measuring Kpi Dashboard Structure PDF
Following slide illustrates KPI dashboard that can be used to track the awareness level of a specific brand. KPIs covered in the slide are traffic, attention, authority, inbound channel performance etc. Boost your pitch with our creative Building Market Brand Leadership Strategies Brand Awareness Measuring Kpi Dashboard Structure PDF. Deliver an awe-inspiring pitch that will mesmerize everyone. Using these presentation templates you will surely catch everyones attention. You can browse the ppts collection on our website. We have researchers who are experts at creating the right content for the templates. So you do not have to invest time in any additional work. Just grab the template now and use them.
Effective Lead Generation For Higher Conversion Rates Dashboard For Tracking Lead Generation And Conversion Structure PDF
This slide covers the KPI dashboard for analyzing metrics such as cost per lead, cost per conversion, average time conversion, conversion rate, monthly new leads, and qualified leads per month. Boost your pitch with our creative Effective Lead Generation For Higher Conversion Rates Dashboard For Tracking Lead Generation And Conversion Structure PDF. Deliver an awe-inspiring pitch that will mesmerize everyone. Using these presentation templates you will surely catch everyones attention. You can browse the ppts collection on our website. We have researchers who are experts at creating the right content for the templates. So you do not have to invest time in any additional work. Just grab the template now and use them.
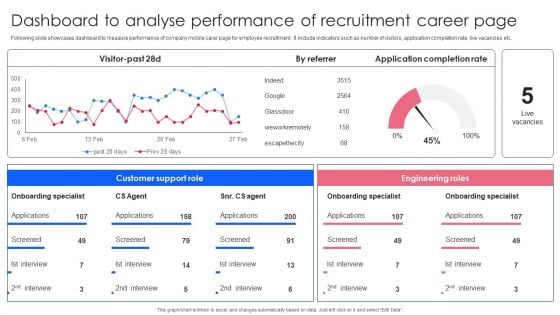
Effective Guide To Build Strong Online Hiring Strategy Dashboard To Analyse Performance Of Recruitment Download PDF
Following slide showcases dashboard to measure performance of company mobile carer page for employee recruitment . It include indicators such as number of visitors, application completion rate, live vacancies etc. Boost your pitch with our creative Effective Guide To Build Strong Online Hiring Strategy Dashboard To Analyse Performance Of Recruitment Download PDF. Deliver an awe-inspiring pitch that will mesmerize everyone. Using these presentation templates you will surely catch everyones attention. You can browse the ppts collection on our website. We have researchers who are experts at creating the right content for the templates. So you do not have to invest time in any additional work. Just grab the template now and use them.
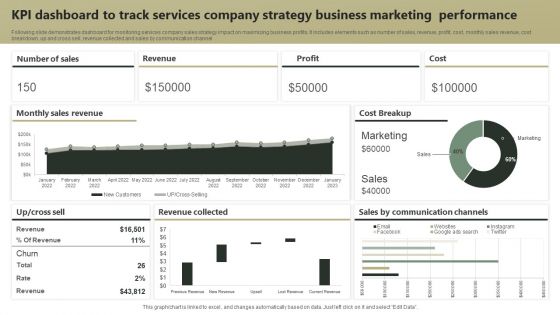
KPI Dashboard To Track Services Company Strategy Business Marketing Performance Guidelines PDF
Following slide demonstrates dashboard for monitoring services company sales strategy impact on maximizing business profits. It includes elements such as number of sales, revenue, profit, cost, monthly sales revenue, cost breakdown, up and cross sell, revenue collected and sales by communication channel. Showcasing this set of slides titled KPI Dashboard To Track Services Company Strategy Business Marketing Performance Guidelines PDF. The topics addressed in these templates are Revenue, Profit, Cost. All the content presented in this PPT design is completely editable. Download it and make adjustments in color, background, font etc. as per your unique business setting.
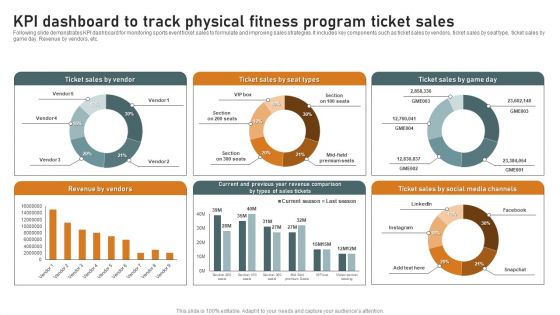
KPI Dashboard To Track Physical Fitness Program Ticket Sales Summary PDF
Following slide demonstrates KPI dashboard for monitoring sports event ticket sales to formulate and improving sales strategies. It includes key components such as ticket sales by vendors, ticket sales by seat type, ticket sales by game day. Revenue by vendors, etc. Showcasing this set of slides titled KPI Dashboard To Track Physical Fitness Program Ticket Sales Summary PDF. The topics addressed in these templates are Revenue By Vendors, Sales By Vendor, Social Media Channels. All the content presented in this PPT design is completely editable. Download it and make adjustments in color, background, font etc. as per your unique business setting.
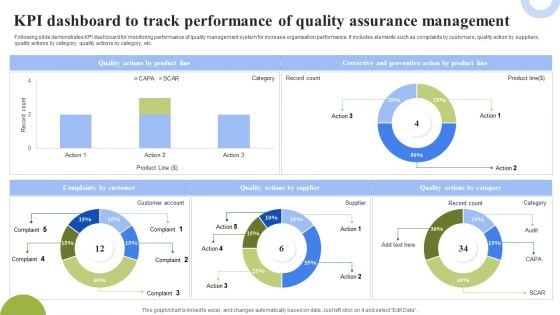
KPI Dashboard To Track Performance Of Quality Assurance Management Topics PDF
Following slide demonstrates KPI dashboard for monitoring performance of quality management system for increase organisation performance. It includes elements such as complaints by customers, quality action by suppliers, quality actions by category, quality actions by category, etc. Showcasing this set of slides titled KPI Dashboard To Track Performance Of Quality Assurance Management Topics PDF. The topics addressed in these templates are Corrective Preventive Action, Quality Actions Supplier, Quality Actions Category. All the content presented in this PPT design is completely editable. Download it and make adjustments in color, background, font etc. as per your unique business setting.
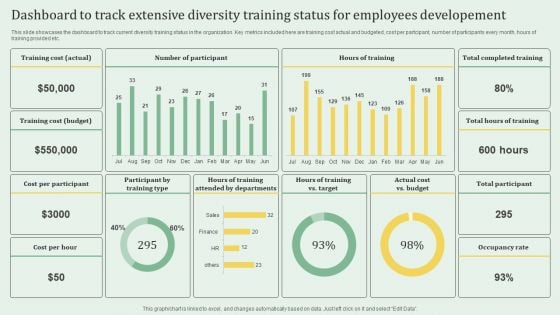
Dashboard To Track Extensive Diversity Training Status For Employees Developement Elements PDF
This slide showcases the dashboard to track current diversity training status in the organization. Key metrics included here are training cost actual and budgeted, cost per partcipant, number of participants every month, hours of training provided etc. Showcasing this set of slides titled Dashboard To Track Extensive Diversity Training Status For Employees Developement Elements PDF. The topics addressed in these templates are Training Cost, Budget, Occupancy Rate. All the content presented in this PPT design is completely editable. Download it and make adjustments in color, background, font etc. as per your unique business setting.
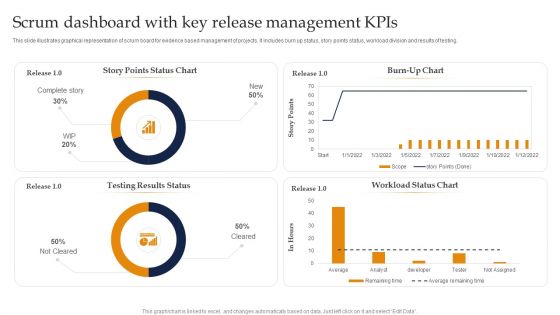
Scrum Dashboard With Key Release Management Kpis Ppt Summary Vector PDF
This slide illustrates graphical representation of scrum board for evidence based management of projects. It includes burn up status, story points status, workload division and results of testing. Showcasing this set of slides titled Scrum Dashboard With Key Release Management Kpis Ppt Summary Vector PDF. The topics addressed in these templates are Burn Up Chart, Workload Status Chart, Testing Results Status. All the content presented in this PPT design is completely editable. Download it and make adjustments in color, background, font etc. as per your unique business setting.
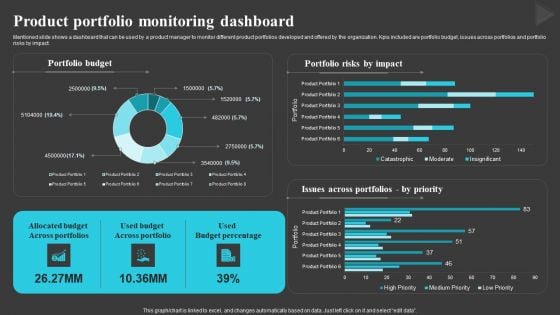
Product Portfolio Monitoring Dashboard Creating And Offering Multiple Product Ranges In New Business Diagrams PDF
Mentioned slide shows a dashboard that can be used by a product manager to monitor different product portfolios developed and offered by the organization. Kpis included are portfolio budget, issues across portfolios and portfolio risks by impact.Crafting an eye-catching presentation has never been more straightforward. Let your presentation shine with this tasteful yet straightforward Product Portfolio Monitoring Dashboard Creating And Offering Multiple Product Ranges In New Business Diagrams PDF template. It offers a minimalistic and classy look that is great for making a statement. The colors have been employed intelligently to add a bit of playfulness while still remaining professional. Construct the ideal Product Portfolio Monitoring Dashboard Creating And Offering Multiple Product Ranges In New Business Diagrams PDF that effortlessly grabs the attention of your audience Begin now and be certain to wow your customers.
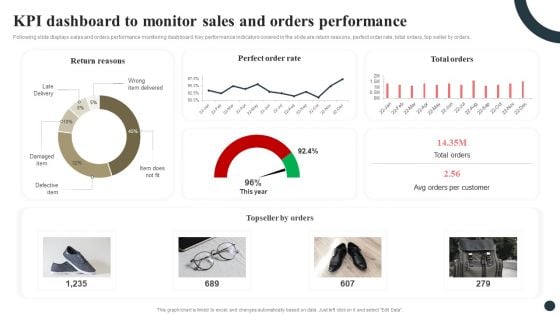
Strategic Guide For Positioning Expanded Brand KPI Dashboard To Monitor Sales And Orders Performance Diagrams PDF
Following slide displays sales and orders performance monitoring dashboard. Key performance indicators covered in the slide are return reasons, perfect order rate, total orders, top seller by orders. Crafting an eye-catching presentation has never been more straightforward. Let your presentation shine with this tasteful yet straightforward Strategic Guide For Positioning Expanded Brand KPI Dashboard To Monitor Sales And Orders Performance Diagrams PDF template. It offers a minimalistic and classy look that is great for making a statement. The colors have been employed intelligently to add a bit of playfulness while still remaining professional. Construct the ideal Strategic Guide For Positioning Expanded Brand KPI Dashboard To Monitor Sales And Orders Performance Diagrams PDF that effortlessly grabs the attention of your audience Begin now and be certain to wow your customers.
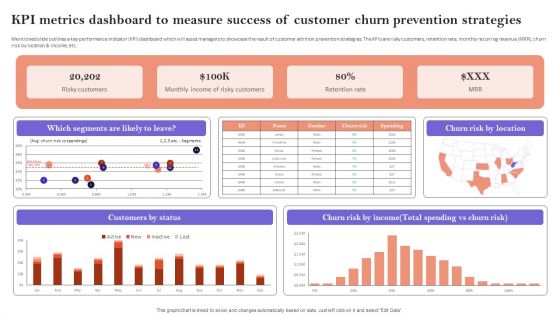
KPI Metrics Dashboard To Measure Success Of Customer Churn Prevention Strategies Diagrams PDF
Mentioned slide outlines a key performance indicator KPI dashboard which will assist managers to showcase the result of customer attrition prevention strategies. The KPIs are risky customers, retention rate, monthly recurring revenue MRR, churn risk by location and income, etc. This KPI Metrics Dashboard To Measure Success Of Customer Churn Prevention Strategies Diagrams PDF is perfect for any presentation, be it in front of clients or colleagues. It is a versatile and stylish solution for organizing your meetings. The KPI Metrics Dashboard To Measure Success Of Customer Churn Prevention Strategies Diagrams PDF features a modern design for your presentation meetings. The adjustable and customizable slides provide unlimited possibilities for acing up your presentation. Slidegeeks has done all the homework before launching the product for you. So, do not wait, grab the presentation templates today
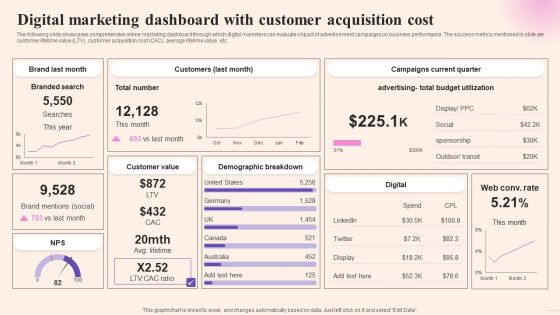
Comprehensive Guide To Build Marketing Digital Marketing Dashboard With Customer Acquisition Diagrams PDF
The following slide showcases comprehensive online marketing dashboard through which digital marketers can evaluate impact of advertisement campaigns on business performance. The success metrics mentioned in slide are customer lifetime value LTV, customer acquisition cost CAC, average lifetime value, etc. Do you have an important presentation coming up Are you looking for something that will make your presentation stand out from the rest Look no further than Comprehensive Guide To Build Marketing Digital Marketing Dashboard With Customer Acquisition Diagrams PDF. With our professional designs, you can trust that your presentation will pop and make delivering it a smooth process. And with Slidegeeks, you can trust that your presentation will be unique and memorable. So why wait Grab Comprehensive Guide To Build Marketing Digital Marketing Dashboard With Customer Acquisition Diagrams PDF today and make your presentation stand out from the rest.
Enterprise SMS Marketing Subscribers Tracking Dashboard Ppt PowerPoint Presentation Diagram PDF
This slide represents the key metrics dashboard to monito and track the SMS marketing subscribers of the enterprise. It includes details related to KPIs such as total subscribers, new subscribers, total unsubscribes etc. Do you have an important presentation coming up Are you looking for something that will make your presentation stand out from the rest Look no further than Enterprise SMS Marketing Subscribers Tracking Dashboard Ppt PowerPoint Presentation Diagram PDF. With our professional designs, you can trust that your presentation will pop and make delivering it a smooth process. And with Slidegeeks, you can trust that your presentation will be unique and memorable. So why wait Grab Enterprise SMS Marketing Subscribers Tracking Dashboard Ppt PowerPoint Presentation Diagram PDF today and make your presentation stand out from the rest.
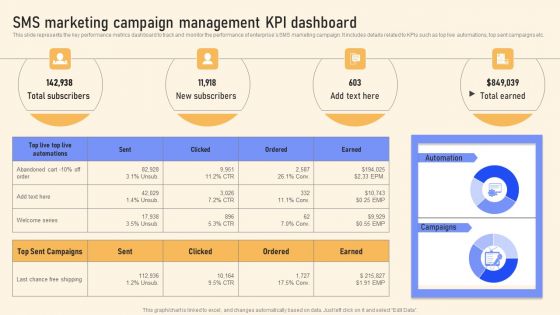
SMS Marketing Campaign Management KPI Dashboard Ppt PowerPoint Presentation Diagram Templates PDF
This slide represents the key performance metrics dashboard to track and monitor the performance of enterprises SMS marketing campaign. It includes details related to KPIs such as top live automations, top sent campaigns etc. Get a simple yet stunning designed SMS Marketing Campaign Management KPI Dashboard Ppt PowerPoint Presentation Diagram Templates PDF. It is the best one to establish the tone in your meetings. It is an excellent way to make your presentations highly effective. So, download this PPT today from Slidegeeks and see the positive impacts. Our easy to edit SMS Marketing Campaign Management KPI Dashboard Ppt PowerPoint Presentation Diagram Templates PDF can be your go to option for all upcoming conferences and meetings. So, what are you waiting for Grab this template today.
Brand Management To Enhance Rebranding Performance Tracking Dashboard To Track Renewed Brand Mockup PDF
This slide provides information regarding rebranding performance tracking dashboard in order to track renewed brand. It includes details about total spent, total link clicks, total conversations, etc. Presenting this PowerPoint presentation, titled Brand Management To Enhance Rebranding Performance Tracking Dashboard To Track Renewed Brand Mockup PDF, with topics curated by our researchers after extensive research. This editable presentation is available for immediate download and provides attractive features when used. Download now and captivate your audience. Presenting this Brand Management To Enhance Rebranding Performance Tracking Dashboard To Track Renewed Brand Mockup PDF. Our researchers have carefully researched and created these slides with all aspects taken into consideration. This is a completely customizable Brand Management To Enhance Rebranding Performance Tracking Dashboard To Track Renewed Brand Mockup PDF that is available for immediate downloading. Download now and make an impact on your audience. Highlight the attractive features available with our PPTs.
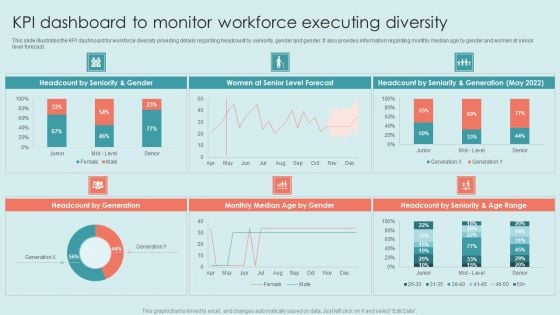
Executing Diversity KPI Dashboard To Monitor Workforce Executing Diversity Structure PDF
This slide illustrates the KPI dashboard for workforce diversity providing details regarding headcount by seniority, gender and gender. It also provides information regarding monthly median age by gender and women at senior level forecast. Presenting this PowerPoint presentation, titled Executing Diversity KPI Dashboard To Monitor Workforce Executing Diversity Structure PDF, with topics curated by our researchers after extensive research. This editable presentation is available for immediate download and provides attractive features when used. Download now and captivate your audience. Presenting this Executing Diversity KPI Dashboard To Monitor Workforce Executing Diversity Structure PDF. Our researchers have carefully researched and created these slides with all aspects taken into consideration. This is a completely customizable Executing Diversity KPI Dashboard To Monitor Workforce Executing Diversity Structure PDF that is available for immediate downloading. Download now and make an impact on your audience. Highlight the attractive features available with our PPTs.
Comprehensive Promotion Guidelines To Administer Brand Overall Brand Performance Tracking Dashboard Mockup PDF
This slide provides information regarding brand performance tracking dashboard capturing KPIs such as brand metric, brand commitment, advertising metrics, and purchase metrics. Presenting this PowerPoint presentation, titled Comprehensive Promotion Guidelines To Administer Brand Overall Brand Performance Tracking Dashboard Mockup PDF, with topics curated by our researchers after extensive research. This editable presentation is available for immediate download and provides attractive features when used. Download now and captivate your audience. Presenting this Comprehensive Promotion Guidelines To Administer Brand Overall Brand Performance Tracking Dashboard Mockup PDF. Our researchers have carefully researched and created these slides with all aspects taken into consideration. This is a completely customizable Comprehensive Promotion Guidelines To Administer Brand Overall Brand Performance Tracking Dashboard Mockup PDF that is available for immediate downloading. Download now and make an impact on your audience. Highlight the attractive features available with our PPTs.
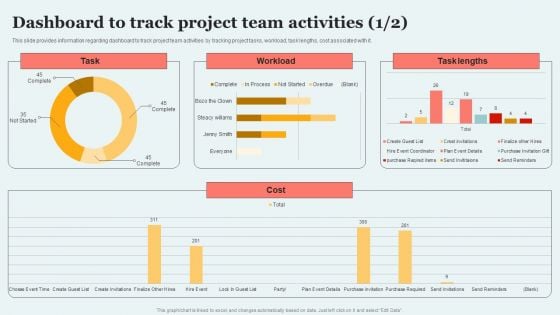
Participants Engaged In Coordinating Project Activities Dashboard To Track Project Team Activities Introduction PDF
This slide provides information regarding dashboard to track project team activities by tracking project tasks, workload, task lengths, cost associated with it. Presenting this PowerPoint presentation, titled Participants Engaged In Coordinating Project Activities Dashboard To Track Project Team Activities Introduction PDF, with topics curated by our researchers after extensive research. This editable presentation is available for immediate download and provides attractive features when used. Download now and captivate your audience. Presenting this Participants Engaged In Coordinating Project Activities Dashboard To Track Project Team Activities Introduction PDF. Our researchers have carefully researched and created these slides with all aspects taken into consideration. This is a completely customizable Participants Engaged In Coordinating Project Activities Dashboard To Track Project Team Activities Introduction PDF that is available for immediate downloading. Download now and make an impact on your audience. Highlight the attractive features available with our PPTs.
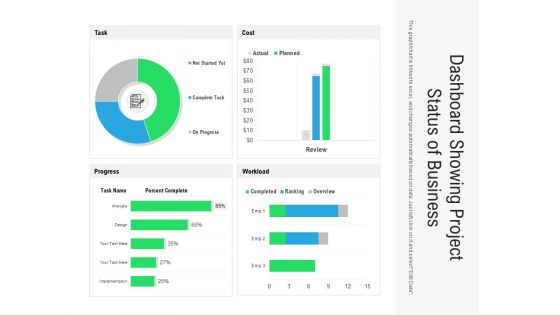
Dashboard Showing Project Status Of Business Ppt PowerPoint Presentation Infographics Graphics Download PDF
Pitch your topic with ease and precision using this dashboard showing project status of business ppt powerpoint presentation infographics graphics download pdf. This layout presents information on task, cost, progress, workload, percent complete, actual. It is also available for immediate download and adjustment. So, changes can be made in the color, design, graphics or any other component to create a unique layout.
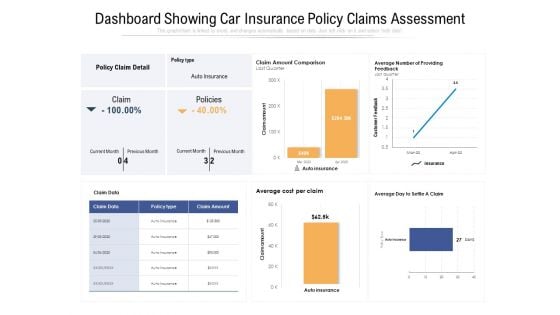
Dashboard Showing Car Insurance Policy Claims Assessment Ppt PowerPoint Presentation Infographic Template Deck PDF
Pitch your topic with ease and precision using this dashboard showing car insurance policy claims assessment ppt powerpoint presentation infographic template ideas pdf. This layout presents information on policy claim detail, policies, average cost per claim. It is also available for immediate download and adjustment. So, changes can be made in the color, design, graphics or any other component to create a unique layout.
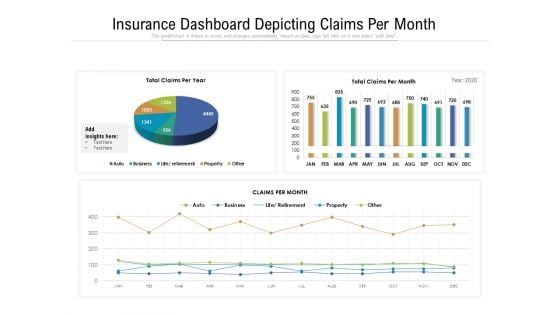
Insurance Dashboard Depicting Claims Per Month Ppt PowerPoint Presentation Show PDF
Pitch your topic with ease and precision using this insurance dashboard depicting claims per month ppt powerpoint presentation show example pdf. This layout presents information on property, business, sales. It is also available for immediate download and adjustment. So, changes can be made in the color, design, graphics or any other component to create a unique layout.

Online Promotion Plan Dashboard With Total Traffic Visit Ppt Infographic Template Display PDF
Pitch your topic with ease and precision using this online promotion plan dashboard with total traffic visit ppt infographic template display pdf. This layout presents information on engagement, promotion, product. It is also available for immediate download and adjustment. So, changes can be made in the color, design, graphics or any other component to create a unique layout.
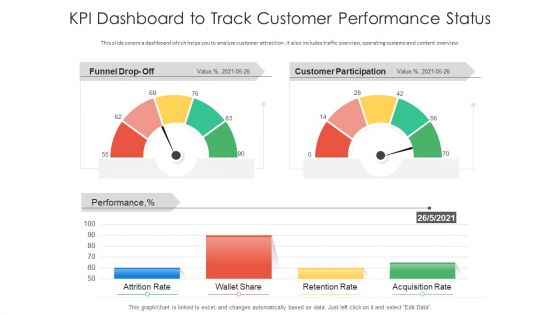
Kpi Dashboard To Track Customer Performance Status Ppt PowerPoint Presentation Inspiration Shapes PDF
Pitch your topic with ease and precision using this kpi dashboard to track customer performance status ppt powerpoint presentation inspiration shapes pdf. This layout presents information on attrition rate, wallet share, retention rate. It is also available for immediate download and adjustment. So, changes can be made in the color, design, graphics or any other component to create a unique layout.
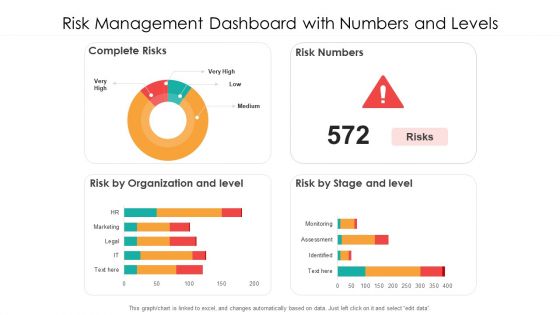
Risk Management Dashboard With Numbers And Levels Ppt PowerPoint Presentation Infographics Picture PDF
Pitch your topic with ease and precision using this risk management dashboard with numbers and levels ppt powerpoint presentation infographics picture pdf. This layout presents information on complete risks, risk numbers, risk by organization and level. It is also available for immediate download and adjustment. So, changes can be made in the color, design, graphics or any other component to create a unique layout.
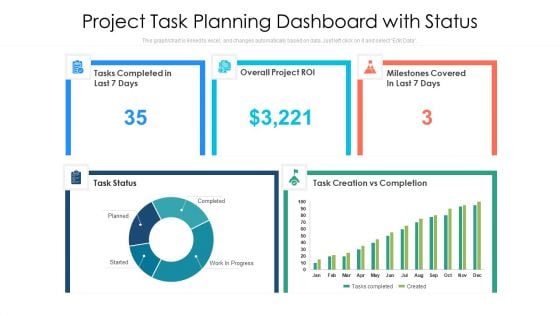
Project Task Planning Dashboard With Status Ppt PowerPoint Presentation Gallery Visual Aids PDF
Pitch your topic with ease and precision using this project task planning dashboard with status ppt powerpoint presentation gallery visual aids pdf. This layout presents information on task creation vs completion, milestones covered, overall project. It is also available for immediate download and adjustment. So, changes can be made in the color, design, graphics or any other component to create a unique layout.
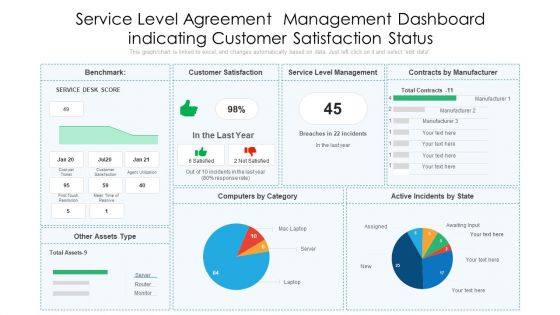
Service Level Agreement Management Dashboard Indicating Customer Satisfaction Status Designs PDF
Pitch your topic with ease and precision using this service level agreement management dashboard indicating customer satisfaction status designs pdf. This layout presents information on customer satisfaction, service level management, contracts by manufacturer. It is also available for immediate download and adjustment. So, changes can be made in the color, design, graphics or any other component to create a unique layout.
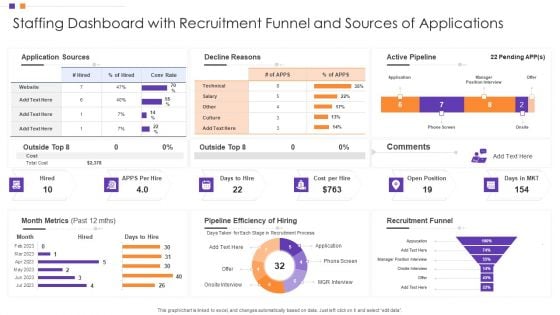
Staffing Dashboard With Recruitment Funnel And Sources Of Applications Brochure PDF
Pitch your topic with ease and precision using this Staffing Dashboard With Recruitment Funnel And Sources Of Applications Brochure PDF This layout presents information on Application Sources, Decline Reasons, Active Pipeline It is also available for immediate download and adjustment. So, changes can be made in the color, design, graphics or any other component to create a unique layout.

Dashboard Of Net Promoter Score Survey Response Results KPI Portrait PDF
Pitch your topic with ease and precision using this Dashboard Of Net Promoter Score Survey Response Results KPI Portrait PDF. This layout presents information on Product Average, Promoter Score, Product Experience. It is also available for immediate download and adjustment. So, changes can be made in the color, design, graphics or any other component to create a unique layout.
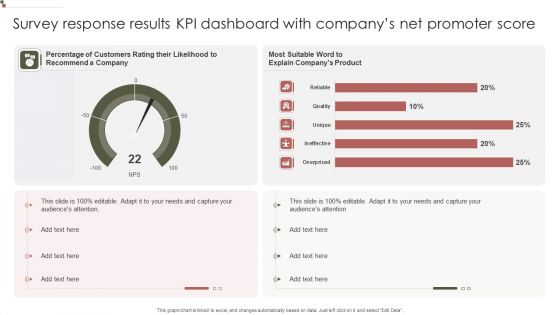
Survey Response Results KPI Dashboard With Companys Net Promoter Score Graphics PDF
Pitch your topic with ease and precision using this Survey Response Results KPI Dashboard With Companys Net Promoter Score Graphics PDF. This layout presents information on Recommend Company, Percentage Customers, Explain Companys. It is also available for immediate download and adjustment. So, changes can be made in the color, design, graphics or any other component to create a unique layout.
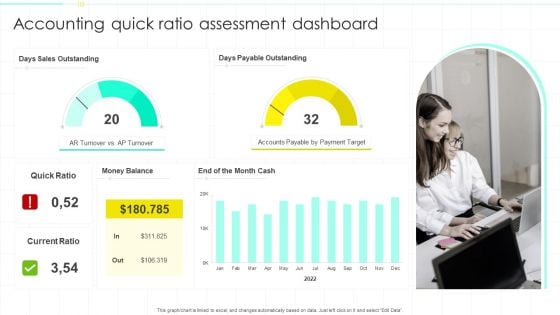
Accounting Quick Ratio Assessment Dashboard Ppt PowerPoint Presentation Show Deck PDF
Pitch your topic with ease and precision using this Accounting Quick Ratio Assessment Dashboard Ppt PowerPoint Presentation Show Deck PDF. This layout presents information on Sales Outstanding, Payable Outstanding, Accounts Payable. It is also available for immediate download and adjustment. So, changes can be made in the color, design, graphics or any other component to create a unique layout.
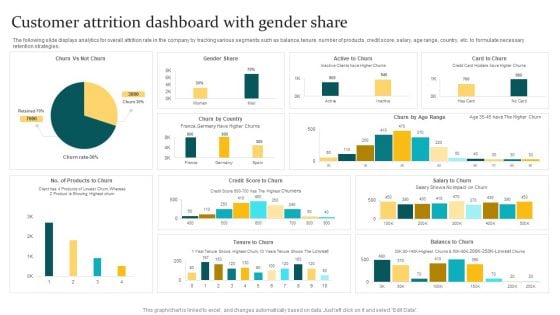
Customer Attrition Dashboard With Gender Share Ppt PowerPoint Presentation Gallery Slide Download PDF
Pitch your topic with ease and precision using this Customer Attrition Dashboard With Gender Share Ppt PowerPoint Presentation Gallery Slide Download PDF. This layout presents information on Gender Share, Product Showing, Shows Highest. It is also available for immediate download and adjustment. So, changes can be made in the color, design, graphics or any other component to create a unique layout.
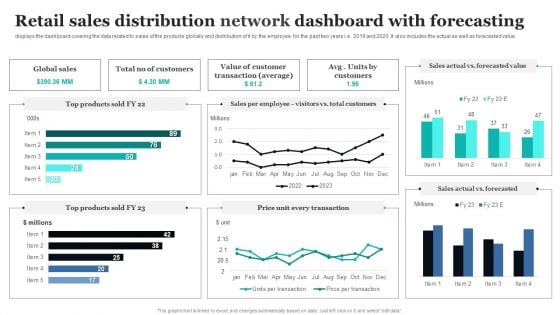
Retail Sales Distribution Network Dashboard With Forecasting Ppt PowerPoint Presentation File Design Templates PDF
Pitch your topic with ease and precision using this Retail Sales Distribution Network Dashboard With Forecasting Ppt PowerPoint Presentation File Design Templates PDF. This layout presents information on Global Sales, Value Customer, Total Customers. It is also available for immediate download and adjustment. So, changes can be made in the color, design, graphics or any other component to create a unique layout.
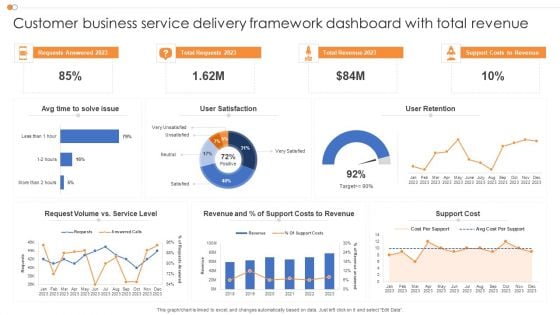
Customer Business Service Delivery Framework Dashboard With Total Revenue Structure PDF
Pitch your topic with ease and precision using this Customer Business Service Delivery Framework Dashboard With Total Revenue Structure PDF. This layout presents information on Requests Answered, Total Requests, Total Revenue. It is also available for immediate download and adjustment. So, changes can be made in the color, design, graphics or any other component to create a unique layout.
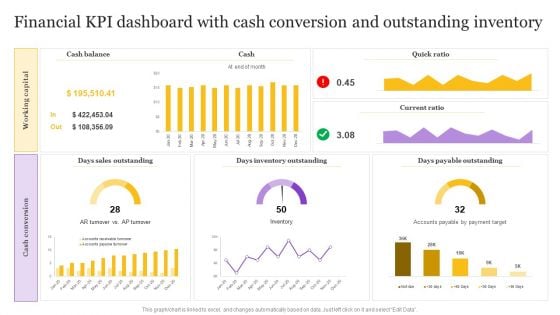
Financial KPI Dashboard With Cash Conversion And Outstanding Inventory Pictures PDF
Pitch your topic with ease and precision using this Financial KPI Dashboard With Cash Conversion And Outstanding Inventory Pictures PDF. This layout presents information on Cash Conversion, Working Capital, Days Sales Outstanding. It is also available for immediate download and adjustment. So, changes can be made in the color, design, graphics or any other component to create a unique layout.
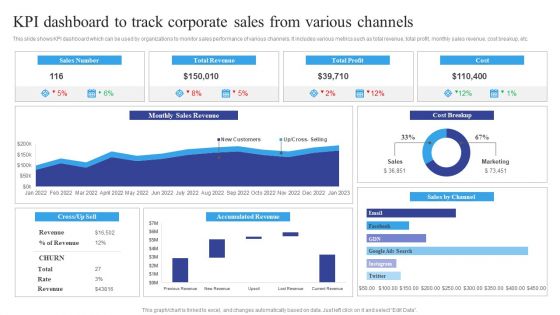
KPI Dashboard To Track Corporate Sales From Various Channels Inspiration PDF
Pitch your topic with ease and precision using this KPI Dashboard To Track Corporate Sales From Various Channels Inspiration PDF. This layout presents information on Track Corporate Sales, Various Channels. It is also available for immediate download and adjustment. So, changes can be made in the color, design, graphics or any other component to create a unique layout.
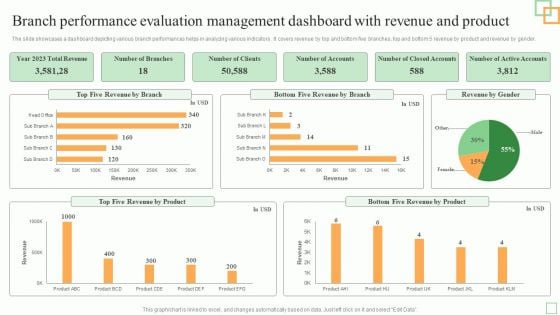
Branch Performance Evaluation Management Dashboard With Revenue And Product Mockup PDF
Pitch your topic with ease and precision using this Branch Performance Evaluation Management Dashboard With Revenue And Product Mockup PDF. This layout presents information on Five Revenue, Revenue Product, Total Revenue. It is also available for immediate download and adjustment. So, changes can be made in the color, design, graphics or any other component to create a unique layout.
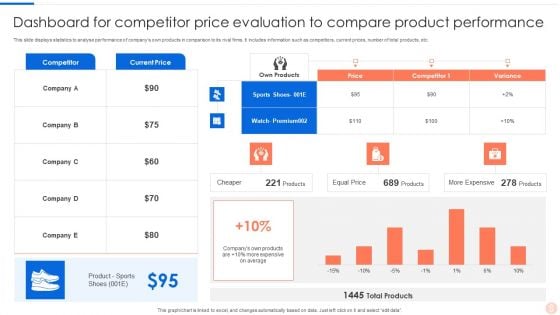
Dashboard For Competitor Price Evaluation To Compare Product Performance Portrait PDF
Pitch your topic with ease and precision using this Dashboard For Competitor Price Evaluation To Compare Product Performance Portrait PDF. This layout presents information on Competitor Price Evaluation, Compare Product. It is also available for immediate download and adjustment. So, changes can be made in the color, design, graphics or any other component to create a unique layout.
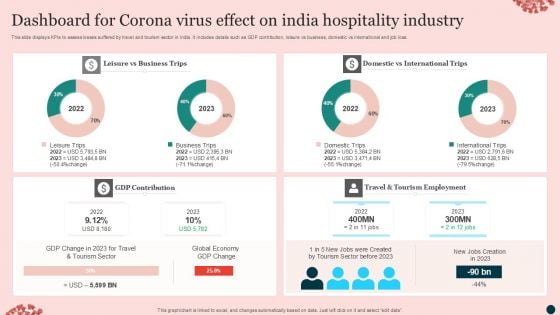
Dashboard For Corona Virus Effect On India Hospitality Industry Download PDF
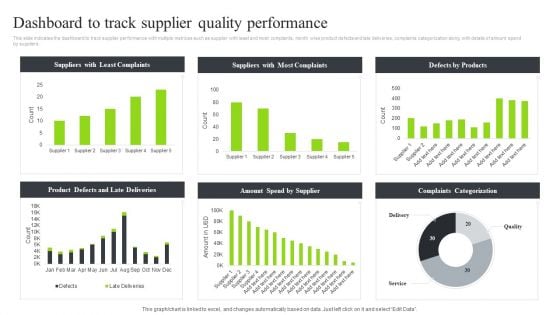
Strategic Sourcing And Supplier Quality Dashboard To Track Supplier Quality Performance Microsoft PDF
This slide indicates the dashboard to track supplier performance with multiple metrices such as supplier with least and most complaints, month wise product defects and late deliveries, complaints categorization along with details of amount spend by suppliers.Slidegeeks has constructed Strategic Sourcing And Supplier Quality Dashboard To Track Supplier Quality Performance Microsoft PDF after conducting extensive research and examination. These presentation templates are constantly being generated and modified based on user preferences and critiques from editors. Here, you will find the most attractive templates for a range of purposes while taking into account ratings and remarks from users regarding the content. This is an excellent jumping-off point to explore our content and will give new users an insight into our top-notch PowerPoint Templates.
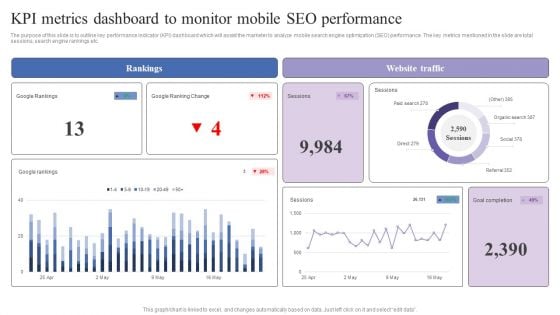
KPI Metrics Dashboard To Monitor Mobile Seo Performance Mobile Search Engine Optimization Guide Professional PDF
The purpose of this slide is to outline key performance indicator KPI dashboard which will assist the marketer to analyze mobile search engine optimization SEO performance. The key metrics mentioned in the slide are total sessions, search engine rankings etc. Slidegeeks has constructed KPI Metrics Dashboard To Monitor Mobile Seo Performance Mobile Search Engine Optimization Guide Professional PDF after conducting extensive research and examination. These presentation templates are constantly being generated and modified based on user preferences and critiques from editors. Here, you will find the most attractive templates for a range of purposes while taking into account ratings and remarks from users regarding the content. This is an excellent jumping-off point to explore our content and will give new users an insight into our top-notch PowerPoint Templates.
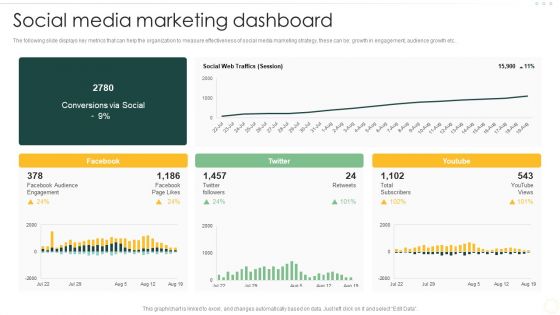
Effective Organizational B2B And B2C Social Media Marketing Dashboard Brochure PDF
The following slide displays key metrics that can help the organization to measure effectiveness of social media marketing strategy, these can be growth in engagement, audience growth etc. Formulating a presentation can take up a lot of effort and time, so the content and message should always be the primary focus. The visuals of the PowerPoint can enhance the presenters message, so our Effective Organizational B2B And B2C Social Media Marketing Dashboard Brochure PDF was created to help save time. Instead of worrying about the design, the presenter can concentrate on the message while our designers work on creating the ideal templates for whatever situation is needed. Slidegeeks has experts for everything from amazing designs to valuable content, we have put everything into Effective Organizational B2B And B2C Social Media Marketing Dashboard Brochure PDF.
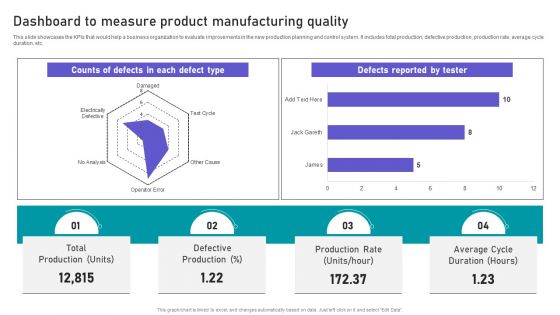
Effective Manufacturing Planning And Control Administration System Dashboard To Measure Product Pictures PDF
This slide showcases the KPIs that would help a business organization to evaluate improvements in the new production planning and control system. It includes total production, defective production, production rate, average cycle duration, etc. Here you can discover an assortment of the finest PowerPoint and Google Slides templates. With these templates, you can create presentations for a variety of purposes while simultaneously providing your audience with an eye-catching visual experience. Download Effective Manufacturing Planning And Control Administration System Dashboard To Measure Product Pictures PDF to deliver an impeccable presentation. These templates will make your job of preparing presentations much quicker, yet still, maintain a high level of quality. Slidegeeks has experienced researchers who prepare these templates and write high-quality content for you. Later on, you can personalize the content by editing the Effective Manufacturing Planning And Control Administration System Dashboard To Measure Product Pictures PDF.
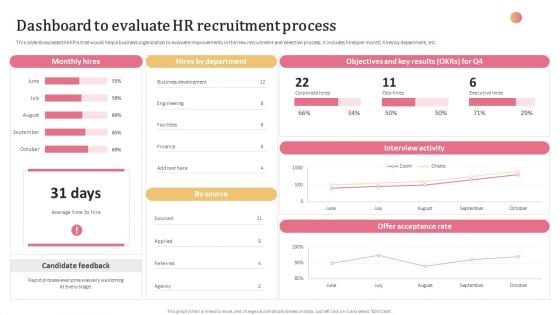
Aligning Human Resource Hiring Procedure Dashboard To Evaluate HR Recruitment Process Portrait PDF
This slide showcases the KPIs that would help a business organization to evaluate improvements in the new recruitment and selection process. It includes hires per month, hires by department, etc. Here you can discover an assortment of the finest PowerPoint and Google Slides templates. With these templates, you can create presentations for a variety of purposes while simultaneously providing your audience with an eye catching visual experience. Download Aligning Human Resource Hiring Procedure Dashboard To Evaluate HR Recruitment Process Portrait PDF to deliver an impeccable presentation. These templates will make your job of preparing presentations much quicker, yet still, maintain a high level of quality. Slidegeeks has experienced researchers who prepare these templates and write high quality content for you. Later on, you can personalize the content by editing the Aligning Human Resource Hiring Procedure Dashboard To Evaluate HR Recruitment Process Portrait PDF.
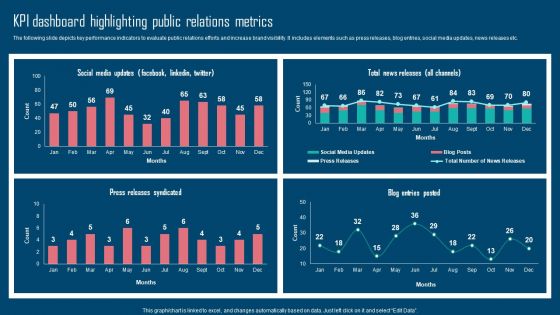
Adopting IMC Technique To Boost Brand Recognition Kpi Dashboard Highlighting Public Relations Metrics Brochure PDF
The following slide depicts key performance indicators to evaluate public relations efforts and increase brand visibility. It includes elements such as press releases, blog entries, social media updates, news releases etc. Formulating a presentation can take up a lot of effort and time, so the content and message should always be the primary focus. The visuals of the PowerPoint can enhance the presenters message, so our Adopting IMC Technique To Boost Brand Recognition Kpi Dashboard Highlighting Public Relations Metrics Brochure PDF was created to help save time. Instead of worrying about the design, the presenter can concentrate on the message while our designers work on creating the ideal templates for whatever situation is needed. Slidegeeks has experts for everything from amazing designs to valuable content, we have put everything into Adopting IMC Technique To Boost Brand Recognition Kpi Dashboard Highlighting Public Relations Metrics Brochure PDF
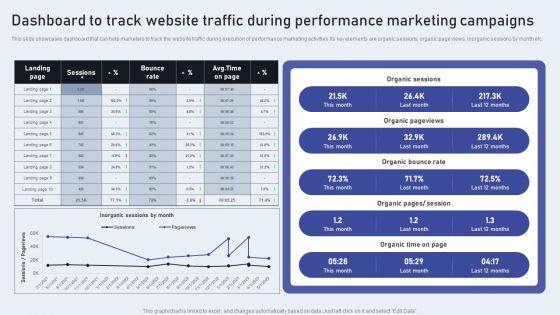
Dashboard To Track Website Traffic During Performance Marketing Campaigns Topics PDF
This slide showcases dashboard that can help marketers to track the website traffic during execution of performance marketing activities.Its key elements are organic sessions, organic page views, inorganic sessions by month etc. Slidegeeks has constructed Dashboard To Track Website Traffic During Performance Marketing Campaigns Topics PDF after conducting extensive research and examination. These presentation templates are constantly being generated and modified based on user preferences and critiques from editors. Here, you will find the most attractive templates for a range of purposes while taking into account ratings and remarks from users regarding the content. This is an excellent jumping-off point to explore our content and will give new users an insight into our top-notch PowerPoint Templates.
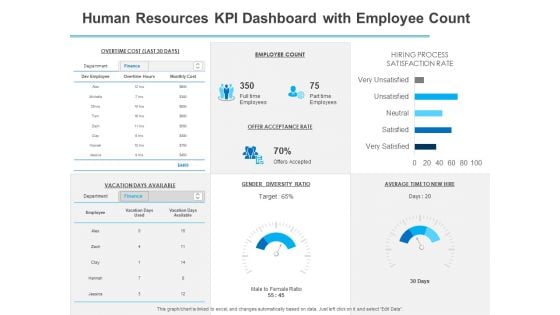
All About HRM Human Resources KPI Dashboard With Employee Count Ppt Diagram Templates PDF
Presenting this set of slides with name all about hrm human resources kpi dashboard with employee count ppt diagram templates pdf. The topics discussed in these slides are costs, acceptance rate, process satisfaction rate. This is a completely editable PowerPoint presentation and is available for immediate download. Download now and impress your audience.
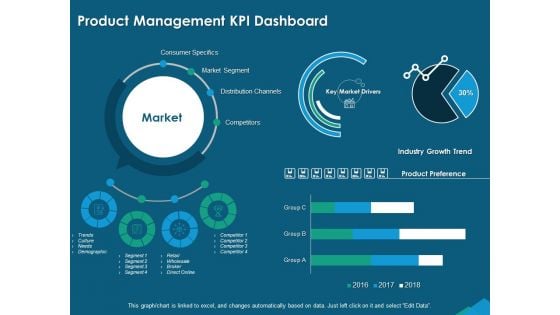
Guide For Managers To Effectively Handle Products Product Management KPI Dashboard Diagrams PDF
Presenting this set of slides with name guide for managers to effectively handle products product management kpi dashboard diagrams pdf. The topics discussed in these slides are consumer specifics, market segment, distribution channels, competitors, industry growth trend, product preference, key market drivers. This is a completely editable PowerPoint presentation and is available for immediate download. Download now and impress your audience.
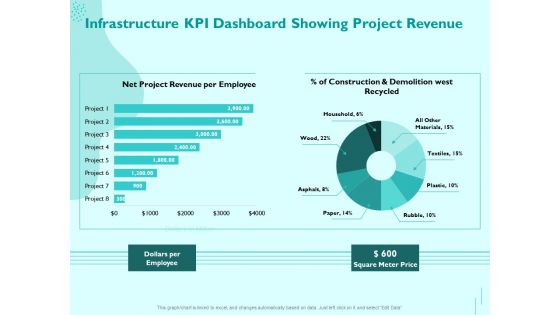
Managing IT Operating System Infrastructure KPI Dashboard Showing Project Revenue Diagrams PDF
Presenting this set of slides with name managing it operating system infrastructure kpi dashboard showing project revenue diagrams pdf. The topics discussed in these slides are dollars per employee, square meter price. This is a completely editable PowerPoint presentation and is available for immediate download. Download now and impress your audience.
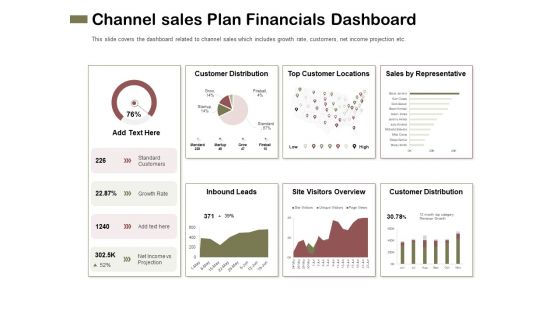
Promotional Channels And Action Plan For Increasing Revenues Channel Sales Plan Financials Dashboard Diagrams PDF
Deliver an awe inspiring pitch with this creative promotional channels and action plan for increasing revenues channel sales plan financials dashboard diagrams pdf bundle. Topics like distribution, sales, representative, locations, revenue can be discussed with this completely editable template. It is available for immediate download depending on the needs and requirements of the user.
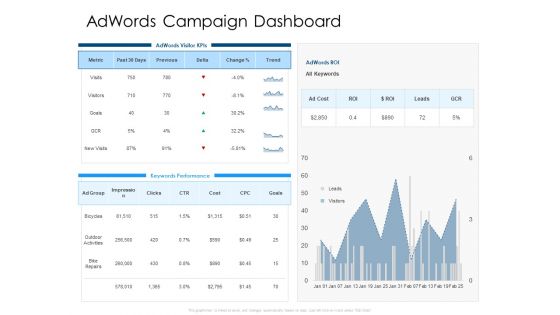
Developing Implementing Organization Marketing Promotional Strategies Adwords Campaign Dashboard Diagrams PDF
Deliver and pitch your topic in the best possible manner with this developing implementing organization marketing promotional strategies adwords campaign dashboard diagrams pdf. Use them to share invaluable insights on goals, impression, performance, metric, costs and impress your audience. This template can be altered and modified as per your expectations. So, grab it now.
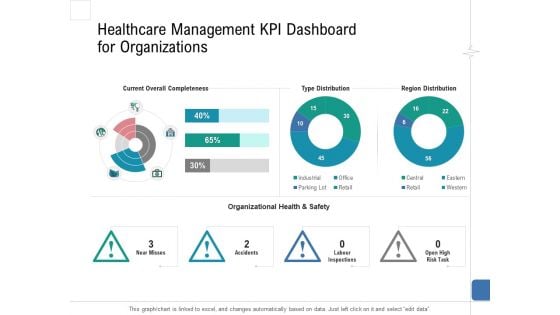
Health Centre Management Business Plan Healthcare Management KPI Dashboard For Organizations Diagrams PDF
Deliver and pitch your topic in the best possible manner with this health centre management business plan healthcare management kpi dashboard for organizations diagrams pdf. Use them to share invaluable insights on current overall completeness, type distribution, region distribution, organizational health and safety and impress your audience. This template can be altered and modified as per your expectations. So, grab it now.
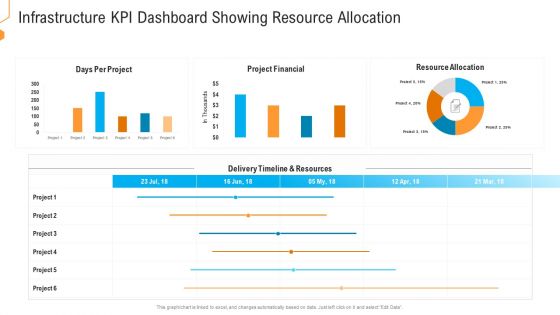
Civil Infrastructure Designing Services Management Infrastructure Kpi Dashboard Showing Resource Allocation Diagrams PDF
Deliver and pitch your topic in the best possible manner with this civil infrastructure designing services management infrastructure kpi dashboard showing resource allocation diagrams pdf. Use them to share invaluable insights on project financial, resource allocation, resources and impress your audience. This template can be altered and modified as per your expectations. So, grab it now.

Infrastructure Designing And Administration Infrastructure KPI Dashboard Showing Cost Reduction And Procurement Diagrams PDF
Deliver an awe inspiring pitch with this creative infrastructure designing and administration infrastructure kpi dashboard showing cost reduction and procurement diagrams pdf bundle. Topics like cost of purchase, cost of reduction, cost savings, cost avoidance, procurement roi can be discussed with this completely editable template. It is available for immediate download depending on the needs and requirements of the user.

Dashboard To Track Google Cloud Monitoring Google Cloud Computing System Diagrams PDF
Deliver and pitch your topic in the best possible manner with this Dashboard To Track Google Cloud Monitoring Google Cloud Computing System Diagrams PDF. Use them to share invaluable insights on Associate Certifications, Professional Certifications, Suite Certifications and impress your audience. This template can be altered and modified as per your expectations. So, grab it now.
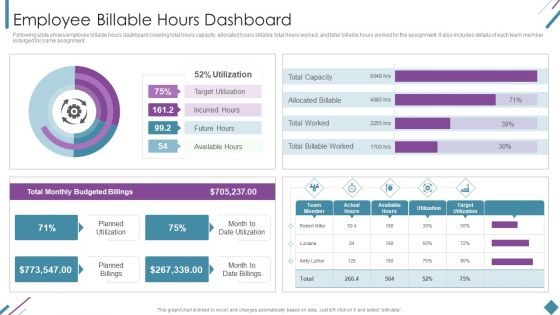
Metrics To Measure Business Performance Employee Billable Hours Dashboard Diagrams PDF
Following slide shows employee billable hours dashboard covering total hours capacity, allocated hours billable, total hours worked, and total billable hours worked for the assignment. It also includes details of each team member indulged for same assignment. Deliver an awe inspiring pitch with this creative Metrics To Measure Business Performance Employee Billable Hours Dashboard Diagrams PDF bundle. Topics like Total Monthly, Budgeted Billings, Planned Utilization can be discussed with this completely editable template. It is available for immediate download depending on the needs and requirements of the user.
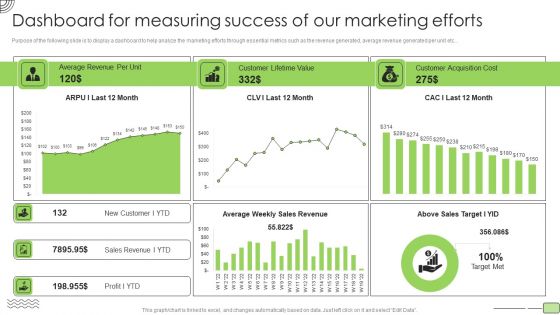
Organic Business Growth Strategies Dashboard For Measuring Success Of Our Marketing Efforts Diagrams PDF
Purpose of the following slide is to display a dashboard to help analyze the marketing efforts through essential metrics such as the revenue generated, average revenue generated per unit etc. Deliver an awe inspiring pitch with this creative Organic Business Growth Strategies Dashboard For Measuring Success Of Our Marketing Efforts Diagrams PDF bundle. Topics like Average Revenue, Customer Lifetime Value, Customer Acquisition Cost can be discussed with this completely editable template. It is available for immediate download depending on the needs and requirements of the user.
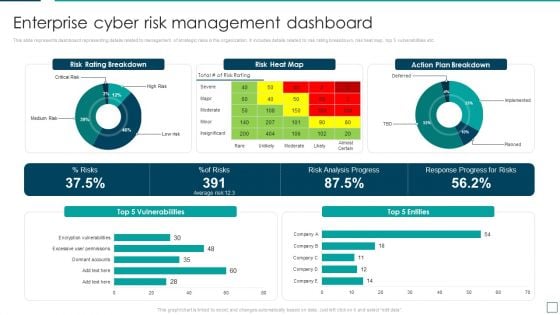
Strategic Risk Management And Mitigation Plan Enterprise Cyber Risk Management Dashboard Diagrams PDF
This slide represents dashboard representing details related to management of strategic risks in the organization. It includes details related to risk rating breakdown, risk heat map, top 5 vulnerabilities etc. From laying roadmaps to briefing everything in detail, our templates are perfect for you. You can set the stage with your presentation slides. All you have to do is download these easy to edit and customizable templates. Strategic Risk Management And Mitigation Plan Enterprise Cyber Risk Management Dashboard Diagrams PDF will help you deliver an outstanding performance that everyone would remember and praise you for. Do download this presentation today.
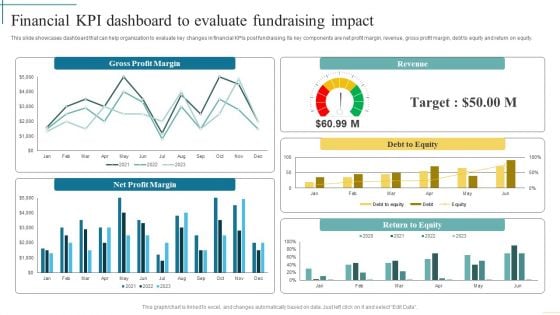
Financial Kpi Dashboard To Evaluate Fundraising Impact Developing Fundraising Techniques Diagrams PDF
This slide showcases dashboard that can help organization to evaluate key changes in financial KPIs post fundraising. Its key components are net profit margin, revenue, gross profit margin, debt to equity and return on equity. From laying roadmaps to briefing everything in detail, our templates are perfect for you. You can set the stage with your presentation slides. All you have to do is download these easy-to-edit and customizable templates. Financial Kpi Dashboard To Evaluate Fundraising Impact Developing Fundraising Techniques Diagrams PDF will help you deliver an outstanding performance that everyone would remember and praise you for. Do download this presentation today.
Process Enhancement Plan To Boost Sales Performance Website Performance Tracking And Monitoring Dashboard Diagrams PDF
The following slide showcases a dashboard to track and measure website performance. It includes key elements such as visits, average session duration, bounce rate, page views, goal conversion, visits by week, traffic sources, top channels by conversions, etc. From laying roadmaps to briefing everything in detail, our templates are perfect for you. You can set the stage with your presentation slides. All you have to do is download these easy to edit and customizable templates. Process Enhancement Plan To Boost Sales Performance Website Performance Tracking And Monitoring Dashboard Diagrams PDF will help you deliver an outstanding performance that everyone would remember and praise you for. Do download this presentation today.

Customer Support Center Call Center Action Plan Dashboard Highlighting Agent Diagrams PDF
This slide showcases dashboard for call center action plan which includes total calls, average answer speed, abandon rate, average calls per minute with agent performance and overall customer satisfaction score. Want to ace your presentation in front of a live audience Our Customer Support Center Call Center Action Plan Dashboard Highlighting Agent Diagrams PDF can help you do that by engaging all the users towards you.. Slidegeeks experts have put their efforts and expertise into creating these impeccable powerpoint presentations so that you can communicate your ideas clearly. Moreover, all the templates are customizable, and easy-to-edit and downloadable. Use these for both personal and commercial use.
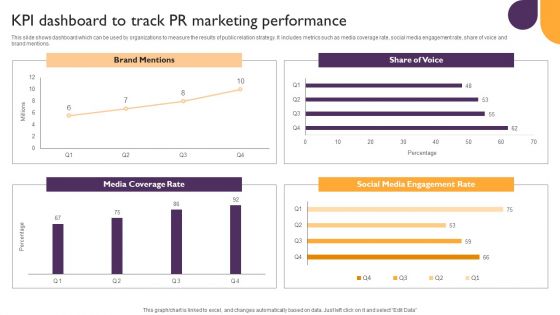
Public Relations Guide To Enhance Brand Credibility KPI Dashboard To Track PR Marketing Performance Diagrams PDF
This slide shows dashboard which can be used by organizations to measure the results of public relation strategy. It includes metrics such as media coverage rate, social media engagement rate, share of voice and brand mentions. Make sure to capture your audiences attention in your business displays with our gratis customizable Public Relations Guide To Enhance Brand Credibility KPI Dashboard To Track PR Marketing Performance Diagrams PDF. These are great for business strategies, office conferences, capital raising or task suggestions. If you desire to acquire more customers for your tech business and ensure they stay satisfied, create your own sales presentation with these plain slides.
Providing Efficient Client Services Kpi Dashboard For Tracking Customer Retention Diagrams PDF
This slide covers the dashboard for analyzing customer loyalty with metrics such as NPS, loyal customer rate, premium users, CLV, customer churn, revenue churn, net retention, MRR growth, etc. Take your projects to the next level with our ultimate collection of Providing Efficient Client Services Kpi Dashboard For Tracking Customer Retention Diagrams PDF. Slidegeeks has designed a range of layouts that are perfect for representing task or activity duration, keeping track of all your deadlines at a glance. Tailor these designs to your exact needs and give them a truly corporate look with your own brand colors they will make your projects stand out from the rest.
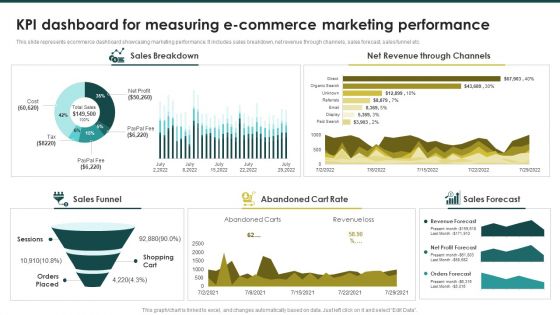
KPI Dashboard For Measuring Ecommerce Marketing Ecommerce Marketing Plan To Enhance Brochure PDF
This slide represents ecommerce dashboard showcasing marketing performance. It includes sales breakdown, net revenue through channels, sales forecast, sales funnel etc.Find highly impressive KPI Dashboard For Measuring Ecommerce Marketing Ecommerce Marketing Plan To Enhance Brochure PDF on Slidegeeks to deliver a meaningful presentation. You can save an ample amount of time using these presentation templates. No need to worry to prepare everything from scratch because Slidegeeks experts have already done a huge research and work for you. You need to download KPI Dashboard For Measuring Ecommerce Marketing Ecommerce Marketing Plan To Enhance Brochure PDF for your upcoming presentation. All the presentation templates are 100precent editable and you can change the color and personalize the content accordingly. Download now.
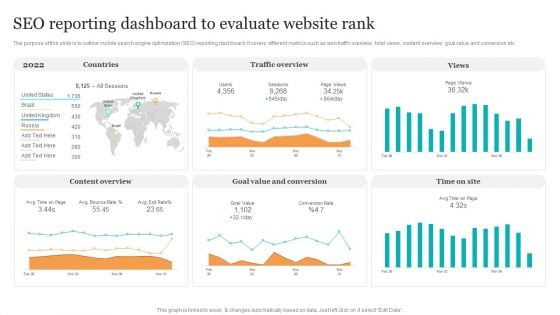
Seo Reporting Dashboard To Evaluate Website Rank Search Engine Optimization Services To Minimize Template PDF
The purpose of this slide is to outline mobile search engine optimization SEO reporting dashboard. It covers different metrics such as web traffic overview, total views, content overview, goal value and conversion etc. This Seo Reporting Dashboard To Evaluate Website Rank Search Engine Optimization Services To Minimize Template PDF is perfect for any presentation, be it in front of clients or colleagues. It is a versatile and stylish solution for organizing your meetings. The Seo Reporting Dashboard To Evaluate Website Rank Search Engine Optimization Services To Minimize Template PDF features a modern design for your presentation meetings. The adjustable and customizable slides provide unlimited possibilities for acing up your presentation. Slidegeeks has done all the homework before launching the product for you. So, do not wait, grab the presentation templates today.
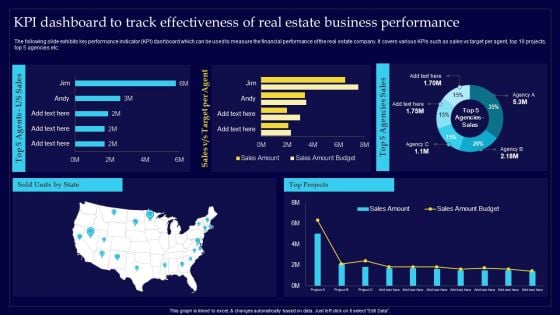
Executing Risk Mitigation KPI Dashboard To Track Effectiveness Of Real Estate Rules PDF
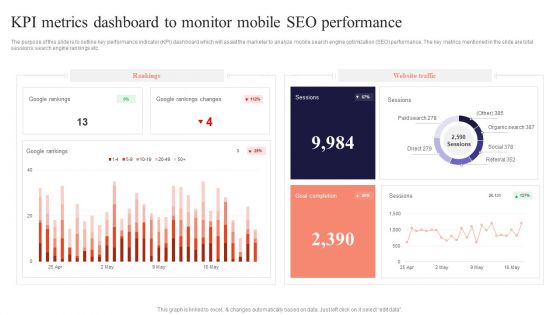
KPI Metrics Dashboard To Monitor Mobile Performing Mobile SEO Audit To Analyze Web Traffic Graphics PDF
The purpose of this slide is to outline key performance indicator KPI dashboard which will assist the marketer to analyze mobile search engine optimization SEO performance. The key metrics mentioned in the slide are total sessions, search engine rankings etc.Find highly impressive KPI Metrics Dashboard To Monitor Mobile Performing Mobile SEO Audit To Analyze Web Traffic Graphics PDF on Slidegeeks to deliver a meaningful presentation. You can save an ample amount of time using these presentation templates. No need to worry to prepare everything from scratch because Slidegeeks experts have already done a huge research and work for you. You need to download KPI Metrics Dashboard To Monitor Mobile Performing Mobile SEO Audit To Analyze Web Traffic Graphics PDF for your upcoming presentation. All the presentation templates are 100 precent editable and you can change the color and personalize the content accordingly. Download now.
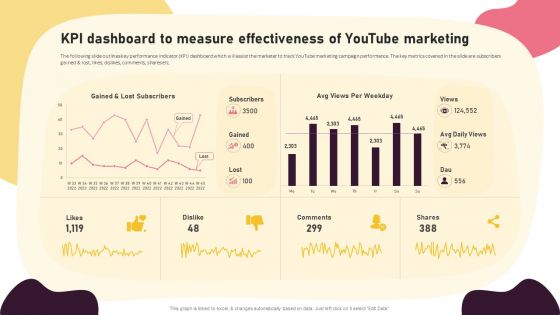
Video Promotion Techniques KPI Dashboard To Measure Effectiveness Of Youtube Pictures PDF
The following slide outlines key performance indicator KPI dashboard which will assist the marketer to track YouTube marketing campaign performance. The key metrics covered in the slide are subscribers gained and lost, likes, dislikes, comments, shares etc. Explore a selection of the finest Video Promotion Techniques KPI Dashboard To Measure Effectiveness Of Youtube Pictures PDF here. With a plethora of professionally designed and pre-made slide templates, you can quickly and easily find the right one for your upcoming presentation. You can use our Video Promotion Techniques KPI Dashboard To Measure Effectiveness Of Youtube Pictures PDF to effectively convey your message to a wider audience. Slidegeeks has done a lot of research before preparing these presentation templates. The content can be personalized and the slides are highly editable. Grab templates today from Slidegeeks.
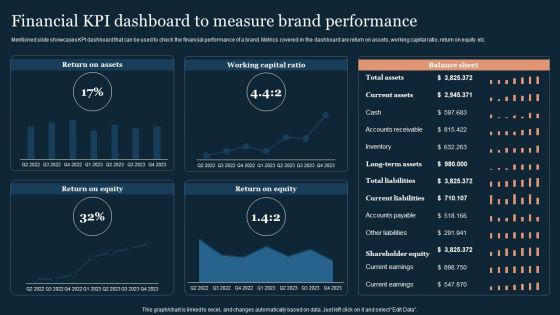
Guide To Develop And Estimate Brand Value Financial KPI Dashboard To Measure Brand Performance Formats PDF
Mentioned slide showcases KPI dashboard that can be used to check the financial performance of a brand. Metrics covered in the dashboard are return on assets, working capital ratio, return on equity etc.Coming up with a presentation necessitates that the majority of the effort goes into the content and the message you intend to convey. The visuals of a PowerPoint presentation can only be effective if it supplements and supports the story that is being told. Keeping this in mind our experts created Guide To Develop And Estimate Brand Value Financial KPI Dashboard To Measure Brand Performance Formats PDF to reduce the time that goes into designing the presentation. This way, you can concentrate on the message while our designers take care of providing you with the right template for the situation.
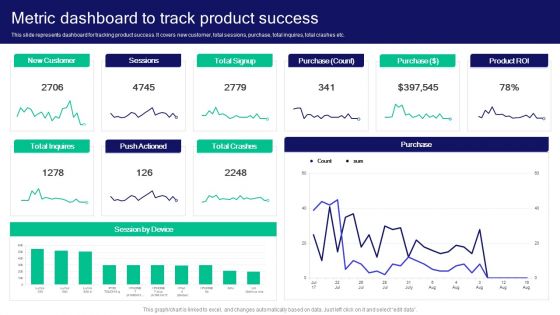
Strategies For Effective Product Metric Dashboard To Track Product Success Elements PDF
This slide represents dashboard for tracking product success. It covers new customer, total sessions, purchase, total inquires, total crashes etc. Explore a selection of the finest Strategies For Effective Product Metric Dashboard To Track Product Success Elements PDF here. With a plethora of professionally designed and pre-made slide templates, you can quickly and easily find the right one for your upcoming presentation. You can use our Strategies For Effective Product Metric Dashboard To Track Product Success Elements PDF to effectively convey your message to a wider audience. Slidegeeks has done a lot of research before preparing these presentation templates. The content can be personalized and the slides are highly editable. Grab templates today from Slidegeeks.
Integrating AI To Enhance Dashboard For Tracking Impact Of Warehouse House Automation Professional PDF
This slide covers the dashboard with after automation warehouse overview. It include KPIs such as autonomous robots status, robotic arms status, battery level, performance, time to return, etc. Find highly impressive Integrating AI To Enhance Dashboard For Tracking Impact Of Warehouse House Automation Professional PDF on Slidegeeks to deliver a meaningful presentation. You can save an ample amount of time using these presentation templates. No need to worry to prepare everything from scratch because Slidegeeks experts have already done a huge research and work for you. You need to download Integrating AI To Enhance Dashboard For Tracking Impact Of Warehouse House Automation Professional PDF for your upcoming presentation. All the presentation templates are 100 percent editable and you can change the color and personalize the content accordingly. Download now.
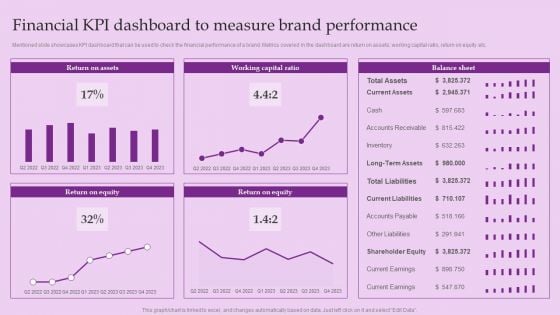
Financial KPI Dashboard To Measure Brand Performance Brand And Equity Evaluation Techniques Elements PDF
Mentioned slide showcases KPI dashboard that can be used to check the financial performance of a brand. Metrics covered in the dashboard are return on assets, working capital ratio, return on equity etc.Coming up with a presentation necessitates that the majority of the effort goes into the content and the message you intend to convey. The visuals of a PowerPoint presentation can only be effective if it supplements and supports the story that is being told. Keeping this in mind our experts created Financial KPI Dashboard To Measure Brand Performance Brand And Equity Evaluation Techniques Elements PDF to reduce the time that goes into designing the presentation. This way, you can concentrate on the message while our designers take care of providing you with the right template for the situation.
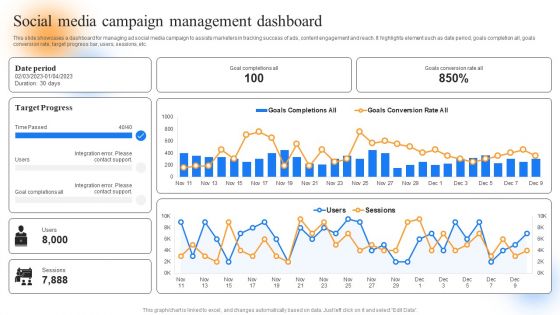
Strategic Guide To Perform Marketing Social Media Campaign Management Dashboard Brochure PDF
This slide showcases a dashboard for managing ad social media campaign to assists marketers in tracking success of ads, content engagement and reach. It highlights element such as date period, goals completion all, goals conversion rate, target progress bar, users, sessions, etc. Create an editable Strategic Guide To Perform Marketing Social Media Campaign Management Dashboard Brochure PDF that communicates your idea and engages your audience. Whether youre presenting a business or an educational presentation, pre-designed presentation templates help save time. Strategic Guide To Perform Marketing Social Media Campaign Management Dashboard Brochure PDF is highly customizable and very easy to edit, covering many different styles from creative to business presentations. Slidegeeks has creative team members who have crafted amazing templates. So, go and get them without any delay.
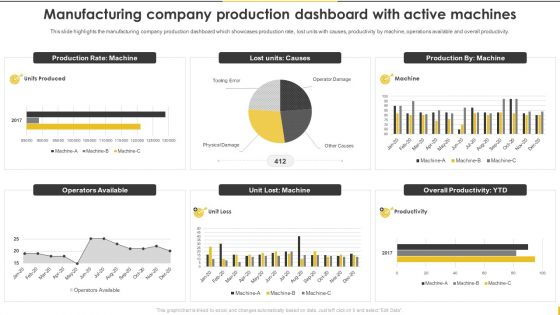
Customer Goods Production Manufacturing Company Production Dashboard With Active Slides PDF
This slide highlights the manufacturing company production dashboard which showcases production rate, lost units with causes, productivity by machine, operations available and overall productivity. Explore a selection of the finest Customer Goods Production Manufacturing Company Production Dashboard With Active Slides PDF here. With a plethora of professionally designed and pre-made slide templates, you can quickly and easily find the right one for your upcoming presentation. You can use our Customer Goods Production Manufacturing Company Production Dashboard With Active Slides PDF to effectively convey your message to a wider audience. Slidegeeks has done a lot of research before preparing these presentation templates. The content can be personalized and the slides are highly editable. Grab templates today from Slidegeeks.
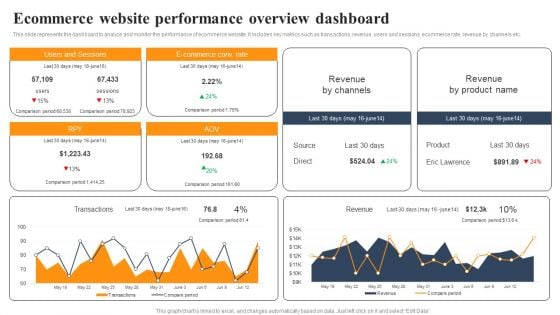
Implementing An Effective Ecommerce Management Framework Ecommerce Website Performance Overview Dashboard Clipart PDF
This slide represents the dashboard to analyze and monitor the performance of ecommerce website. It includes key metrics such as transactions, revenue, users and sessions, ecommerce rate, revenue by channels etc. Find highly impressive Implementing An Effective Ecommerce Management Framework Ecommerce Website Performance Overview Dashboard Clipart PDF on Slidegeeks to deliver a meaningful presentation. You can save an ample amount of time using these presentation templates. No need to worry to prepare everything from scratch because Slidegeeks experts have already done a huge research and work for you. You need to download Implementing An Effective Ecommerce Management Framework Ecommerce Website Performance Overview Dashboard Clipart PDFfor your upcoming presentation. All the presentation templates are 100 percent editable and you can change the color and personalize the content accordingly. Download now
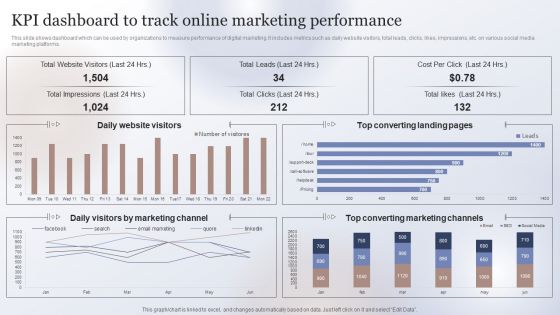
Marketing Strategy To Enhance KPI Dashboard To Track Online Marketing Performance Slides PDF
This slide shows dashboard which can be used by organizations to measure performance of digital marketing. It includes metrics such as daily website visitors, total leads, clicks, likes, impressions, etc. on various social media marketing platforms. Explore a selection of the finest Marketing Strategy To Enhance KPI Dashboard To Track Online Marketing Performance Slides PDF here. With a plethora of professionally designed and pre-made slide templates, you can quickly and easily find the right one for your upcoming presentation. You can use our Marketing Strategy To Enhance KPI Dashboard To Track Online Marketing Performance Slides PDF to effectively convey your message to a wider audience. Slidegeeks has done a lot of research before preparing these presentation templates. The content can be personalized and the slides are highly editable. Grab templates today from Slidegeeks.
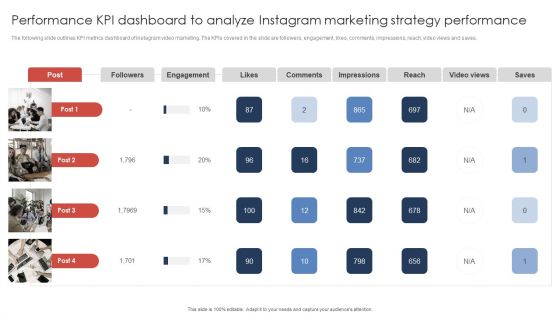
Performance Kpi Dashboard To Analyze Instagram Marketing Strategy Performance Microsoft PDF
The following slide outlines KPI metrics dashboard of Instagram video marketing. The KPIs covered in the slide are followers, engagement, likes, comments, impressions, reach, video views and saves. Find highly impressive Performance Kpi Dashboard To Analyze Instagram Marketing Strategy Performance Microsoft PDF on Slidegeeks to deliver a meaningful presentation. You can save an ample amount of time using these presentation templates. No need to worry to prepare everything from scratch because Slidegeeks experts have already done a huge research and work for you. You need to download Performance Kpi Dashboard To Analyze Instagram Marketing Strategy Performance Microsoft PDF for your upcoming presentation. All the presentation templates are 100 percent editable and you can change the color and personalize the content accordingly. Download now.
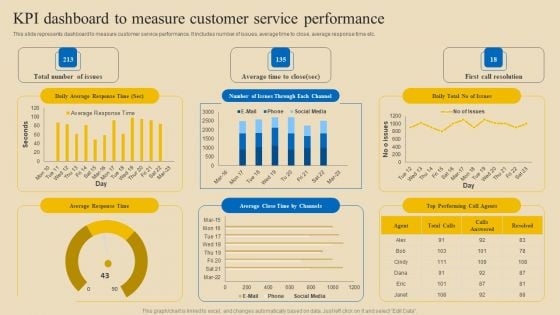
Implementing Digital Customer Service Kpi Dashboard To Measure Customer Service Structure PDF
This slide represents dashboard to measure customer service performance. It includes number of issues, average time to close, average response time etc. Explore a selection of the finest Implementing Digital Customer Service Kpi Dashboard To Measure Customer Service Structure PDF here. With a plethora of professionally designed and pre-made slide templates, you can quickly and easily find the right one for your upcoming presentation. You can use our Implementing Digital Customer Service Kpi Dashboard To Measure Customer Service Structure PDF to effectively convey your message to a wider audience. Slidegeeks has done a lot of research before preparing these presentation templates. The content can be personalized and the slides are highly editable. Grab templates today from Slidegeeks.
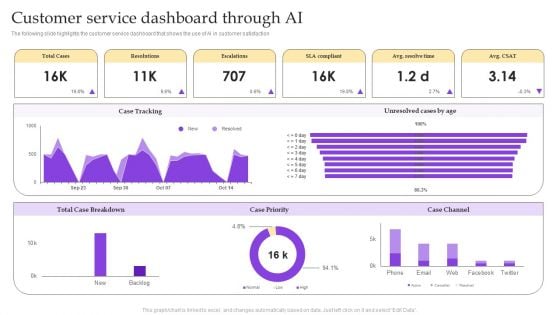
Operational Strategy For ML In IT Sector Customer Service Dashboard Through AI Topics PDF
The following slide highlights the customer service dashboard that shows the use of AI in customer satisfaction. Explore a selection of the finest Operational Strategy For ML In IT Sector Customer Service Dashboard Through AI Topics PDF here. With a plethora of professionally designed and pre-made slide templates, you can quickly and easily find the right one for your upcoming presentation. You can use our Operational Strategy For ML In IT Sector Customer Service Dashboard Through AI Topics PDF to effectively convey your message to a wider audience. Slidegeeks has done a lot of research before preparing these presentation templates. The content can be personalized and the slides are highly editable. Grab templates today from Slidegeeks.
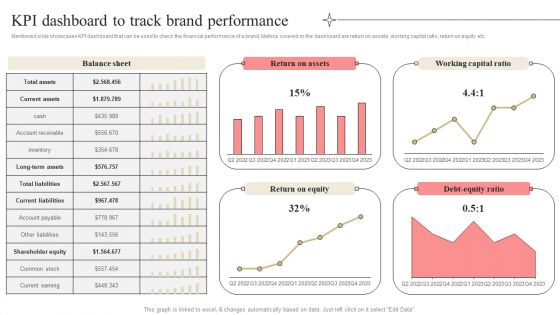
Developing Market Leading Businesses KPI Dashboard To Track Brand Performance Summary PDF
Mentioned slide showcases KPI dashboard that can be used to check the financial performance of a brand. Metrics covered in the dashboard are return on assets, working capital ratio, return on equity etc. Coming up with a presentation necessitates that the majority of the effort goes into the content and the message you intend to convey. The visuals of a PowerPoint presentation can only be effective if it supplements and supports the story that is being told. Keeping this in mind our experts created Developing Market Leading Businesses KPI Dashboard To Track Brand Performance Summary PDF to reduce the time that goes into designing the presentation. This way, you can concentrate on the message while our designers take care of providing you with the right template for the situation.

Introduction To Mobile SEM SEO Reporting Dashboard To Evaluate Website Rank Portrait PDF
The purpose of this slide is to outline mobile search engine optimization SEO reporting dashboard. It covers different metrics such as web traffic overview, total views, content overview, goal value and conversion etc. Get a simple yet stunning designed Introduction To Mobile SEM SEO Reporting Dashboard To Evaluate Website Rank Portrait PDF. It is the best one to establish the tone in your meetings. It is an excellent way to make your presentations highly effective. So, download this PPT today from Slidegeeks and see the positive impacts. Our easy to edit Introduction To Mobile SEM SEO Reporting Dashboard To Evaluate Website Rank Portrait PDF can be your go to option for all upcoming conferences and meetings. So, what are you waiting for Grab this template today.
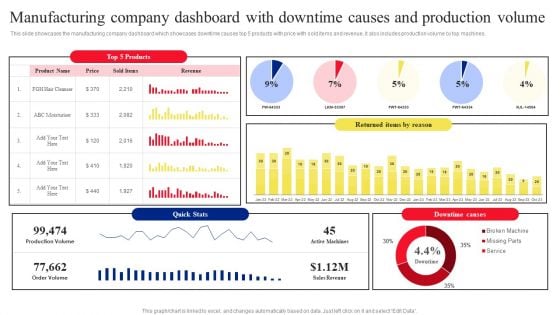
Manufacturing Company Dashboard With Downtime Causes And Production Volume Microsoft PDF
This slide showcases the manufacturing company dashboard which showcases downtime causes top 5 products with price with sold items and revenue, it also includes production volume by top machines. Explore a selection of the finest Manufacturing Company Dashboard With Downtime Causes And Production Volume Microsoft PDF here. With a plethora of professionally designed and pre made slide templates, you can quickly and easily find the right one for your upcoming presentation. You can use our Manufacturing Company Dashboard With Downtime Causes And Production Volume Microsoft PDF to effectively convey your message to a wider audience. Slidegeeks has done a lot of research before preparing these presentation templates. The content can be personalized and the slides are highly editable. Grab templates today from Slidegeeks.
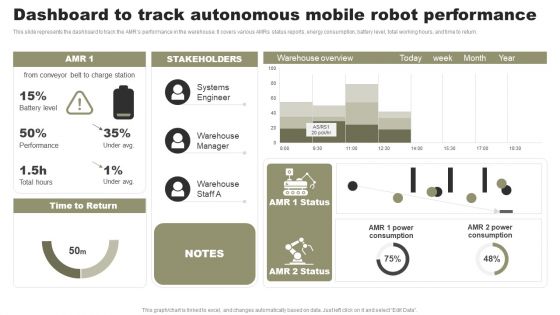
Types Of Independent Robotic System Dashboard To Track Autonomous Mobile Robot Performance Designs PDF
This slide represents the dashboard to track the AMRs performance in the warehouse. It covers various AMRs status reports, energy consumption, battery level, total working hours, and time to return. Find highly impressive Types Of Independent Robotic System Dashboard To Track Autonomous Mobile Robot Performance Designs PDF on Slidegeeks to deliver a meaningful presentation. You can save an ample amount of time using these presentation templates. No need to worry to prepare everything from scratch because Slidegeeks experts have already done a huge research and work for you. You need to download Types Of Independent Robotic System Dashboard To Track Autonomous Mobile Robot Performance Designs PDF for your upcoming presentation. All the presentation templates are 100 percent editable and you can change the color and personalize the content accordingly. Download now.
Planning Transnational Technique To Improve International Scope Dashboard For Tracking Post Expansion Sales Introduction PDF
This slide covers the dashboard for analyzing fast food business sales by region. It includes KPIs such as sales, sales target, target achievement, gross profit, gross profit margin, sales by channels, sales growth, etc. Find highly impressive Planning Transnational Technique To Improve International Scope Dashboard For Tracking Post Expansion Sales Introduction PDF on Slidegeeks to deliver a meaningful presentation. You can save an ample amount of time using these presentation templates. No need to worry to prepare everything from scratch because Slidegeeks experts have already done a huge research and work for you. You need to download Planning Transnational Technique To Improve International Scope Dashboard For Tracking Post Expansion Sales Introduction PDF for your upcoming presentation. All the presentation templates are 100 percent editable and you can change the color and personalize the content accordingly. Download now.
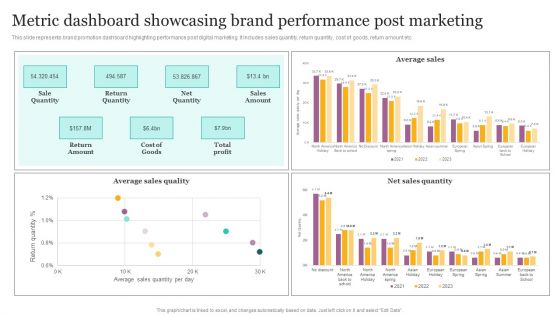
Metric Dashboard Showcasing Brand Performance Post Marketing Ppt Layouts Microsoft PDF
This slide represents brand promotion dashboard highlighting performance post digital marketing. It includes sales quantity, return quantity, cost of goods, return amount etc. Explore a selection of the finest Metric Dashboard Showcasing Brand Performance Post Marketing Ppt Layouts Microsoft PDF here. With a plethora of professionally designed and pre made slide templates, you can quickly and easily find the right one for your upcoming presentation. You can use our Metric Dashboard Showcasing Brand Performance Post Marketing Ppt Layouts Microsoft PDF to effectively convey your message to a wider audience. Slidegeeks has done a lot of research before preparing these presentation templates. The content can be personalized and the slides are highly editable. Grab templates today from Slidegeeks.
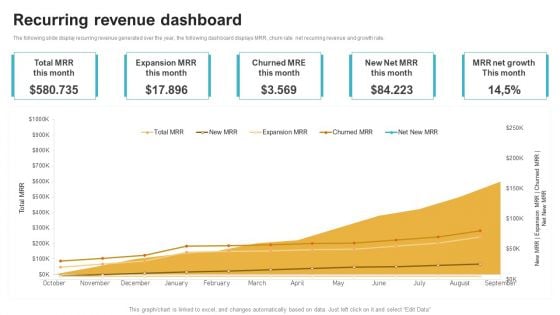
Saas Continuous Income Generation Model For Software Startup Recurring Revenue Dashboard Demonstration PDF
The following slide display recurring revenue generated over the year, the following dashboard displays MRR, churn rate net recurring revenue and growth rate. Explore a selection of the finest Saas Continuous Income Generation Model For Software Startup Recurring Revenue Dashboard Demonstration PDF here. With a plethora of professionally designed and pre made slide templates, you can quickly and easily find the right one for your upcoming presentation. You can use our Saas Continuous Income Generation Model For Software Startup Recurring Revenue Dashboard Demonstration PDF to effectively convey your message to a wider audience. Slidegeeks has done a lot of research before preparing these presentation templates. The content can be personalized and the slides are highly editable. Grab templates today from Slidegeeks.
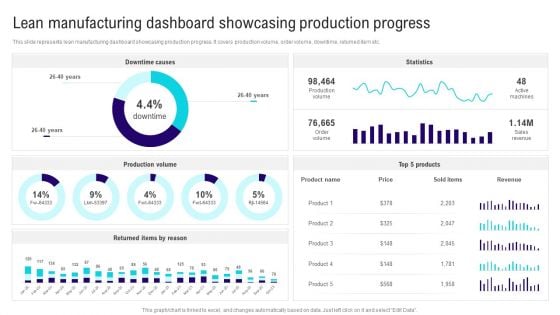
Implementing Lean Production Tool And Techniques Lean Manufacturing Dashboard Showcasing Infographics PDF
This slide represents lean manufacturing dashboard showcasing production progress. It covers production volume, order volume, downtime, returned item etc. Explore a selection of the finest Implementing Lean Production Tool And Techniques Lean Manufacturing Dashboard Showcasing Infographics PDF here. With a plethora of professionally designed and pre made slide templates, you can quickly and easily find the right one for your upcoming presentation. You can use our Implementing Lean Production Tool And Techniques Lean Manufacturing Dashboard Showcasing Infographics PDF to effectively convey your message to a wider audience. Slidegeeks has done a lot of research before preparing these presentation templates. The content can be personalized and the slides are highly editable. Grab templates today from Slidegeeks.
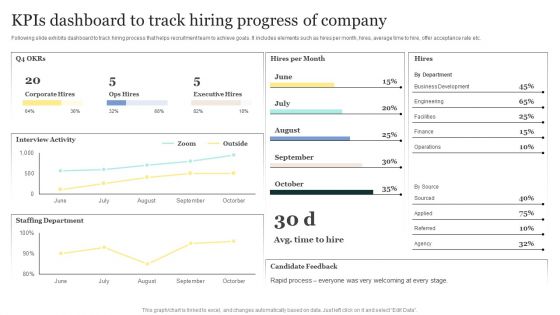
Strategic Approaches To Efficient Candidate Selection Kpis Dashboard To Track Hiring Progress Of Company Pictures PDF
Following slide exhibits dashboard to track hiring process that helps recruitment team to achieve goals. It includes elements such as hires per month, hires, average time to hire, offer acceptance rate etc. Explore a selection of the finest Strategic Approaches To Efficient Candidate Selection Kpis Dashboard To Track Hiring Progress Of Company Pictures PDF here. With a plethora of professionally designed and pre-made slide templates, you can quickly and easily find the right one for your upcoming presentation. You can use our Strategic Approaches To Efficient Candidate Selection Kpis Dashboard To Track Hiring Progress Of Company Pictures PDF to effectively convey your message to a wider audience. Slidegeeks has done a lot of research before preparing these presentation templates. The content can be personalized and the slides are highly editable. Grab templates today from Slidegeeks.
Improving Buyer Journey Through Strategic Customer Engagement Social Media Engagement Tracking Dashboard Structure PDF
This slide showcases a dashboard highlighting the customer engagement through social sites. it includes KPIs such as total website traffics, site revenue, fans count and followers Find highly impressive Improving Buyer Journey Through Strategic Customer Engagement Social Media Engagement Tracking Dashboard Structure PDF on Slidegeeks to deliver a meaningful presentation. You can save an ample amount of time using these presentation templates. No need to worry to prepare everything from scratch because Slidegeeks experts have already done a huge research and work for you. You need to download Improving Buyer Journey Through Strategic Customer Engagement Social Media Engagement Tracking Dashboard Structure PDF for your upcoming presentation. All the presentation templates are 100 percent editable and you can change the color and personalize the content accordingly. Download now

Sales Management Dashboard With Win Rate Ppt PowerPoint Presentation Show Demonstration PDF
Presenting this set of slides with name sales management dashboard with win rate ppt powerpoint presentation show demonstration pdf. The topics discussed in these slides are team quota attainment for quarter, current sales content, team closed deals qtd, win rate, closed business by type, pipeline top deals. This is a completely editable PowerPoint presentation and is available for immediate download. Download now and impress your audience.
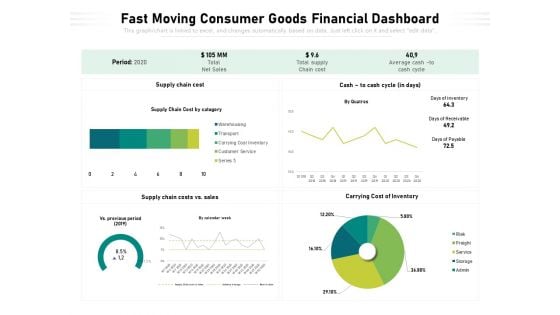
Fast Moving Consumer Goods Financial Dashboard Ppt PowerPoint Presentation Infographic Template Guide PDF
Showcasing this set of slides titled fast moving consumer goods financial dashboard ppt powerpoint presentation infographic template guide pdf. The topics addressed in these templates are supply chain cost, cash to cash cycle in days, supply chain costs vs sales. All the content presented in this PPT design is completely editable. Download it and make adjustments in color, background, font etc. as per your unique business setting.
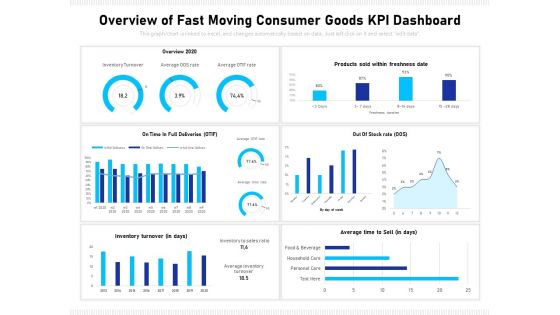
Overview Of Fast Moving Consumer Goods Kpi Dashboard Ppt PowerPoint Presentation Show Visual Aids PDF
Showcasing this set of slides titled overview of fast moving consumer goods kpi dashboard ppt powerpoint presentation show visual aids pdf. The topics addressed in these templates are overview 2020, on time in full deliveries otif, out of stock rate oos, inventory turnover in days, average time to sell in days. All the content presented in this PPT design is completely editable. Download it and make adjustments in color, background, font etc. as per your unique business setting.

Dashboard For Business Investment Management Ppt PowerPoint Presentation Inspiration Images PDF
Showcasing this set of slides titled dashboard for business investment management ppt powerpoint presentation inspiration images pdf. The topics addressed in these templates are total invested amount, number of investments, rate of return, total investment by assets class. All the content presented in this PPT design is completely editable. Download it and make adjustments in color, background, font etc. as per your unique business setting.
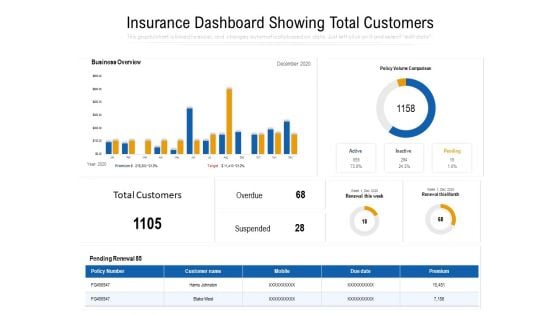
Insurance Dashboard Showing Total Customers Ppt PowerPoint Presentation Pictures Model PDF
Showcasing this set of slides titled insurance dashboard showing total customers ppt powerpoint presentation slides graphics tutorials pdf. The topics addressed in these templates are business overview, policy volume comparison, suspended, renewal this week, renewal this month, premium. All the content presented in this PPT design is completely editable. Download it and make adjustments in color, background, font etc. as per your unique business setting.
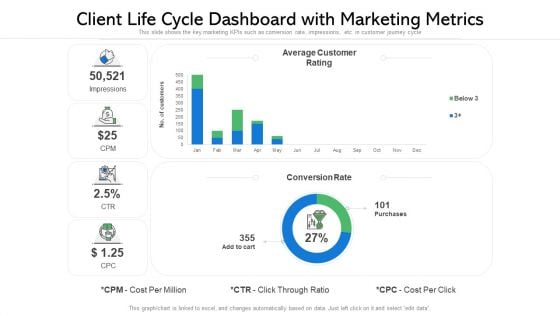
Client Life Cycle Dashboard With Marketing Metrics Ppt File Format PDF
This slide shows the key marketing KPIs such as conversion rate, impressions, etc. in customer journey cycle Showcasing this set of slides titled client life cycle dashboard with marketing metrics ppt file format pdf. The topics addressed in these templates are average customer rating, conversion rate, purchases. All the content presented in this PPT design is completely editable. Download it and make adjustments in color, background, font etc. as per your unique business setting.
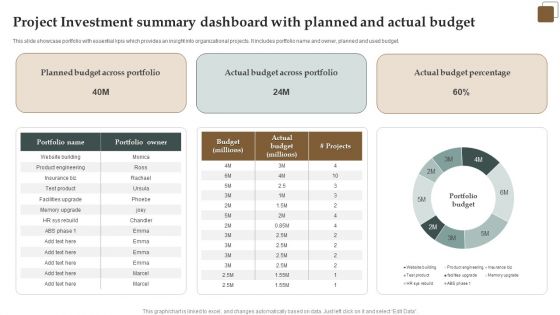
Project Investment Summary Dashboard With Planned And Actual Budget Rules PDF
This slide showcase portfolio with essential kpis which provides an insight into organizational projects. It includes portfolio name and owner, planned and used budget. Showcasing this set of slides titled Project Investment Summary Dashboard With Planned And Actual Budget Rules PDF. The topics addressed in these templates are Portfolio Owner, Budget, Product. All the content presented in this PPT design is completely editable. Download it and make adjustments in color, background, font etc. as per your unique business setting.
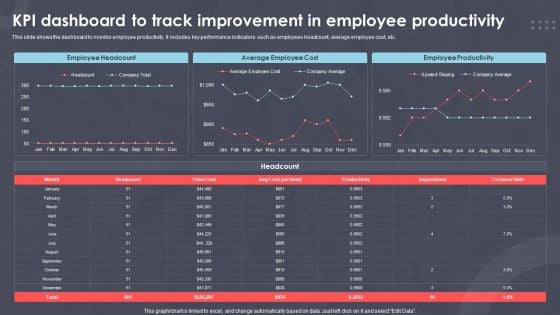
Kpi Dashboard To Track Improvement In Employee Productivity Ppt PowerPoint Presentation Outline Samples PDF
This slide shows the dashboard to monitor employee productivity. It includes key performance indicators such as employees headcount, average employee cost, etc.Showcasing this set of slides titled XXXXXXXXX. The topics addressed in these templates are Employee Headcount, Average Employee, Employee Productivity. All the content presented in this PPT design is completely editable. Download it and make adjustments in color, background, font etc. as per your unique business setting.
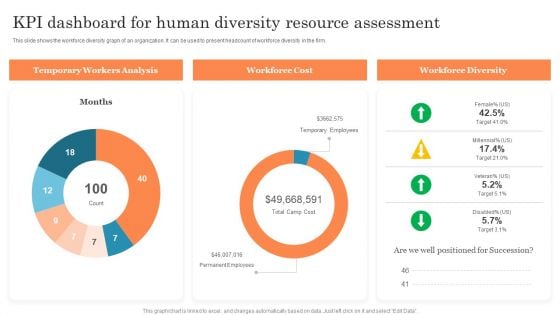
KPI Dashboard For Human Diversity Resource Assessment Ppt PowerPoint Presentation Model Vector PDF
This slide shows the workforce diversity graph of an organization. It can be used to present headcount of workforce diversity in the firm. Showcasing this set of slides titled KPI Dashboard For Human Diversity Resource Assessment Ppt PowerPoint Presentation Model Vector PDF. The topics addressed in these templates are Temporary Workers, Temporary Employees, Workforce Diversity. All the content presented in this PPT design is completely editable. Download it and make adjustments in color, background, font etc. as per your unique business setting.
HR Manager KPI Dashboard With Employee Attrition Tracking Report Brochure PDF
This slide covers performance key indicators for HR manager. It also indicates employee turnover count, new recruitment, retention, training and development of new employees. Showcasing this set of slides titled HR Manager KPI Dashboard With Employee Attrition Tracking Report Brochure PDF. The topics addressed in these templates are Recruitment, Employee Turnover, Development. All the content presented in this PPT design is completely editable. Download it and make adjustments in color, background, font etc. as per your unique business setting.
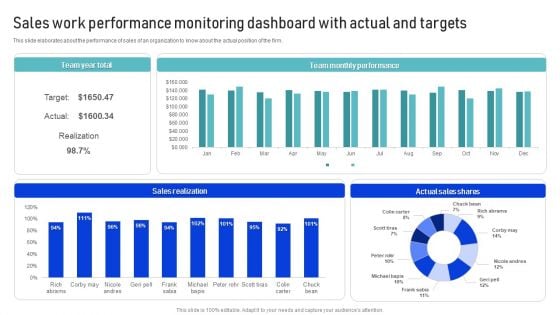
Sales Work Performance Monitoring Dashboard With Actual And Targets Introduction PDF
This slide elaborates about the performance of sales of an organization to know about the actual position of the firm. Showcasing this set of slides titled Sales Work Performance Monitoring Dashboard With Actual And Targets Introduction PDF. The topics addressed in these templates are Sales Realization, Team Monthly, Performance. All the content presented in this PPT design is completely editable. Download it and make adjustments in color, background, font etc. as per your unique business setting.
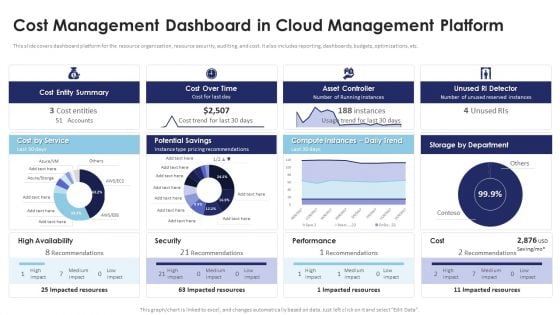
Multi Cloud Infrastructure Management Cost Management Dashboard In Cloud Management Structure PDF
Boost your pitch with our creative Multi Cloud Infrastructure Management Cost Management Dashboard In Cloud Management Structure PDF. Deliver an awe-inspiring pitch that will mesmerize everyone. Using these presentation templates you will surely catch everyones attention. You can browse the ppts collection on our website. We have researchers who are experts at creating the right content for the templates. So you dont have to invest time in any additional work. Just grab the template now and use them.
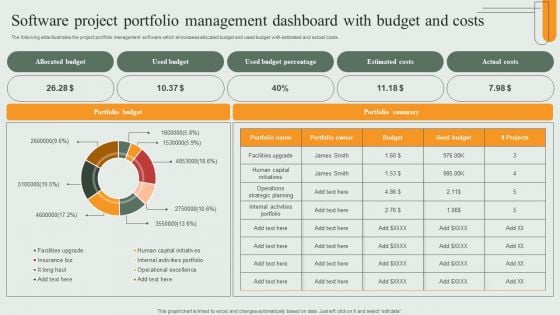
Software Project Portfolio Management Dashboard With Budget And Costs Structure PDF
The following slide illustrates the project portfolio management software which showcases allocated budget and used budget with estimated and actual costs. Showcasing this set of slides titled Software Project Portfolio Management Dashboard With Budget And Costs Structure PDF. The topics addressed in these templates are Allocated Budget, Used Budget, Used Budget Percentage. All the content presented in this PPT design is completely editable. Download it and make adjustments in color, background, font etc. as per your unique business setting.
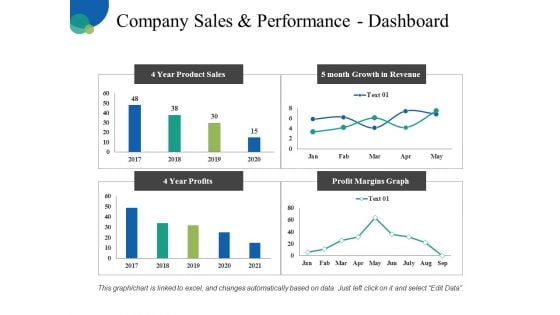
Company Sales And Performance Dashboard Ppt PowerPoint Presentation Pictures Infographic Template
This is a company sales and performance dashboard ppt powerpoint presentation pictures infographic template. This is a four stage process. The stages in this process are business, finance, analysis, management, marketing.

Retail KPI Dashboard Showing Revenue Vs Units Sold Ppt PowerPoint Presentation Professional Smartart
This is a retail kpi dashboard showing revenue vs units sold ppt powerpoint presentation professional smartart. This is a four stage process. The stages in this process are finance, analysis, business, investment, marketing.
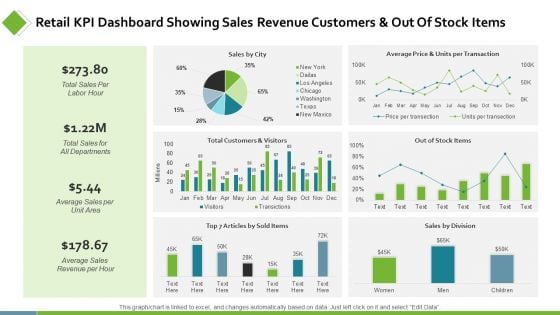
Retail KPI Dashboard Showing Sales Revenue Customers Ppt PowerPoint Presentation Show Background Designs
This is a retail kpi dashboard showing sales revenue customers ppt powerpoint presentation show background designs. This is a six stage process. The stages in this process are finance, analysis, business, investment, marketing.
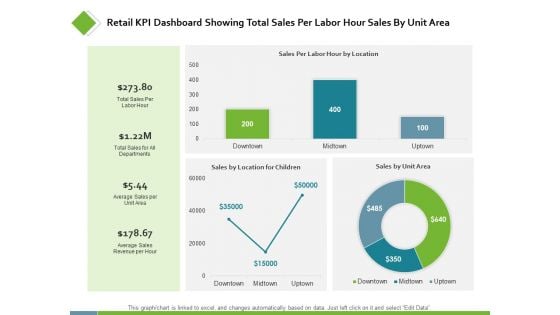
Retail KPI Dashboard Showing Total Sales Per Labor Ppt PowerPoint Presentation Styles Examples
This is a retail kpi dashboard showing total sales per labor ppt powerpoint presentation styles examples. This is a three stage process. The stages in this process are finance, analysis, business, investment, marketing.

Sales Growth And Profitability Sales Dashboard Ppt PowerPoint Presentation Complete Deck With Slides
If designing a presentation takes a lot of your time and resources and you are looking for a better alternative, then this sales growth and profitability sales dashboard ppt powerpoint presentation complete deck with slides is the right fit for you. This is a prefabricated set that can help you deliver a great presentation on the topic. All the twelve slides included in this sample template can be used to present a birds-eye view of the topic. These slides are also fully editable, giving you enough freedom to add specific details to make this layout more suited to your business setting. Apart from the content, all other elements like color, design, theme are also replaceable and editable. This helps in designing a variety of presentations with a single layout. Not only this, you can use this PPT design in formats like PDF, PNG, and JPG once downloaded. Therefore, without any further ado, download and utilize this sample presentation as per your liking.

Development And Operations KPI Dashboard Ppt PowerPoint Presentation Complete Deck With Slides
If designing a presentation takes a lot of your time and resources and you are looking for a better alternative, then this Development And Operations KPI Dashboard Ppt PowerPoint Presentation Complete Deck With Slides is the right fit for you. This is a prefabricated set that can help you deliver a great presentation on the topic. All the twelve slides included in this sample template can be used to present a birds-eye view of the topic. These slides are also fully editable, giving you enough freedom to add specific details to make this layout more suited to your business setting. Apart from the content, all other elements like color, design, theme are also replaceable and editable. This helps in designing a variety of presentations with a single layout. Not only this, you can use this PPT design in formats like PDF, PNG, and JPG once downloaded. Therefore, without any further ado, download and utilize this sample presentation as per your liking.

Survey Response Results KPI Dashboard Infographic Ppt PowerPoint Presentation Complete Deck With Slides
If designing a presentation takes a lot of your time and resources and you are looking for a better alternative, then this Survey Response Results KPI Dashboard Infographic Ppt PowerPoint Presentation Complete Deck With Slides is the right fit for you. This is a prefabricated set that can help you deliver a great presentation on the topic. All the twelv slides included in this sample template can be used to present a birds-eye view of the topic. These slides are also fully editable, giving you enough freedom to add specific details to make this layout more suited to your business setting. Apart from the content, all other elements like color, design, theme are also replaceable and editable. This helps in designing a variety of presentations with a single layout. Not only this, you can use this PPT design in formats like PDF, PNG, and JPG once downloaded. Therefore, without any further ado, download and utilize this sample presentation as per your liking.
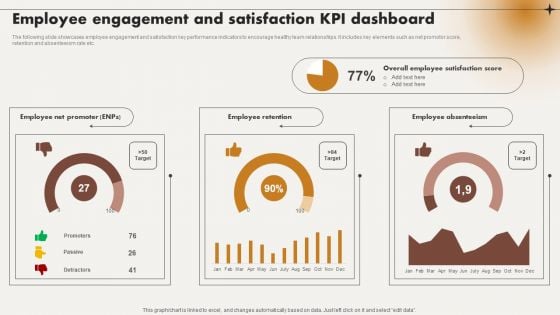
Employee Engagement And Satisfaction Kpi Dashboard Ppt Model Layouts PDF
The following slide showcases employee engagement and satisfaction key performance indicators to encourage healthy team relationships. It includes key elements such as net promotor score, retention and absenteeism rate etc. Do you know about Slidesgeeks Employee Engagement And Satisfaction Kpi Dashboard Ppt Model Layouts PDF These are perfect for delivering any kind od presentation. Using it, create PowerPoint presentations that communicate your ideas and engage audiences. Save time and effort by using our pre designed presentation templates that are perfect for a wide range of topic. Our vast selection of designs covers a range of styles, from creative to business, and are all highly customizable and easy to edit. Download as a PowerPoint template or use them as Google Slides themes.
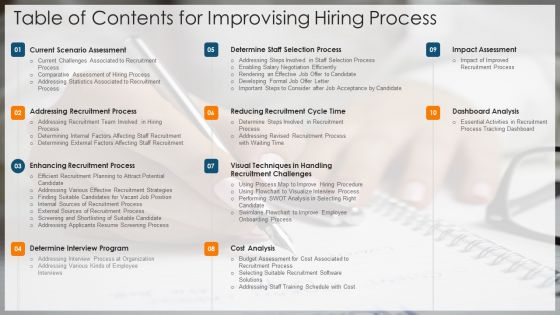
Table Of Contents For Improvising Hiring Process Themes PDF
Deliver an awe inspiring pitch with this creative table of contents for improvising hiring process themes pdf bundle. Topics like impact assessment, dashboard analysis, cost analysis, reducing recruitment cycle time, current scenario assessment can be discussed with this completely editable template. It is available for immediate download depending on the needs and requirements of the user.
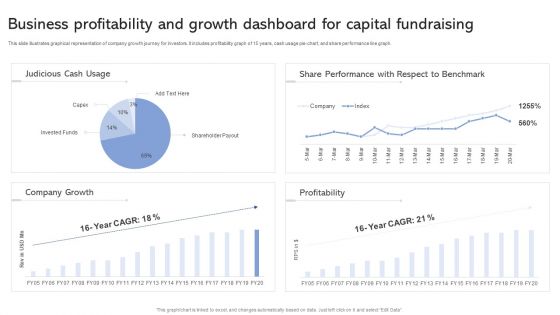
Business Profitability And Growth Dashboard For Capital Fundraising Ppt Slides Guide PDF
This slide illustrates graphical representation of company growth journey for investors. It includes profitability graph of 15 years, cash usage pie-chart, and share performance line graph. Showcasing this set of slides titled Business Profitability And Growth Dashboard For Capital Fundraising Ppt Slides Guide PDF. The topics addressed in these templates are Judicious Cash Usage, Share Performance, Respect To Benchmark. All the content presented in this PPT design is completely editable. Download it and make adjustments in color, background, font etc. as per your unique business setting.
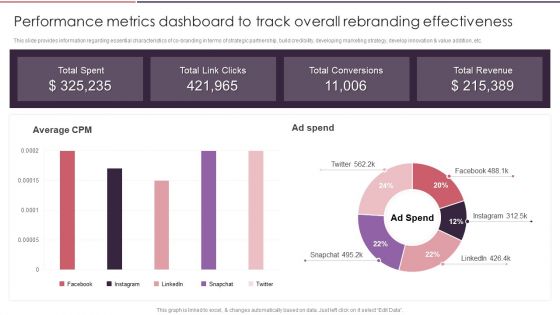
Rebranding Brand Fresh Face Development Performance Metrics Dashboard To Track Overall Rules PDF
This slide provides information regarding essential characteristics of co-branding in terms of strategic partnership, build credibility, developing marketing strategy, develop innovation and value addition, etc. Coming up with a presentation necessitates that the majority of the effort goes into the content and the message you intend to convey. The visuals of a PowerPoint presentation can only be effective if it supplements and supports the story that is being told. Keeping this in mind our experts created Rebranding Brand Fresh Face Development Performance Metrics Dashboard To Track Overall Rules PDF to reduce the time that goes into designing the presentation. This way, you can concentrate on the message while our designers take care of providing you with the right template for the situation.
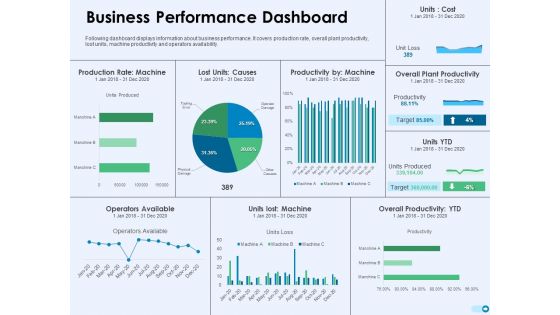
Tools For Prioritization Business Performance Dashboard Ppt PowerPoint Presentation Portfolio Clipart PDF
Following dashboard displays information about business performance. It covers production rate, overall plant productivity, lost units, machine productivity and operators availability. Deliver an awe-inspiring pitch with this creative tools for prioritization business performance dashboard ppt powerpoint presentation portfolio clipart pdf bundle. Topics like production rate machine, lost units causes, productivity by machine, overall plant productivity, units lost machine, overall productivity ytd, operators available can be discussed with this completely editable template. It is available for immediate download depending on the needs and requirements of the user.
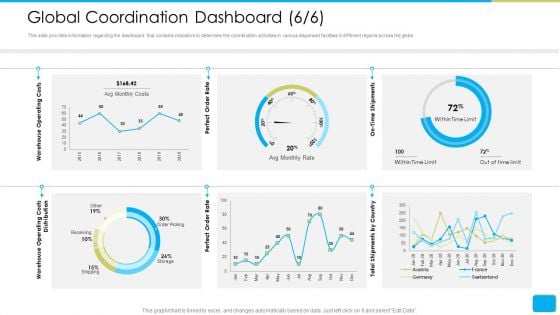
Cross Border Integration In Multinational Corporation Global Coordination Dashboard Costs Topics PDF
This slide provides information regarding the dashboard that contains indicators to determine the coordination activities in various dispersed facilities in different regions across the globe. Deliver and pitch your topic in the best possible manner with this cross border integration in multinational corporation global coordination dashboard costs topics pdf. Use them to share invaluable insights on perfect order rate, on time shipments, total shipments country, warehouse operating costs distribution, warehouse operating costs and impress your audience. This template can be altered and modified as per your expectations. So, grab it now.
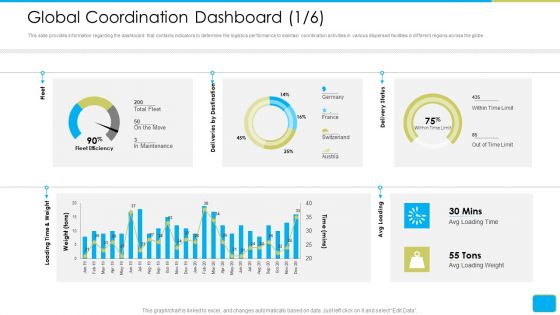
Cross Border Integration In Multinational Corporation Global Coordination Dashboard Download PDF
This slide provides information regarding the dashboard that contains indicators to determine the logistics performance to maintain coordination activities in various dispersed facilities in different regions across the globe. Deliver an awe-inspiring pitch with this creative cross border integration in multinational corporation global coordination dashboard download pdf bundle. Topics like loading time and weight, delivery status, avg loading, avg loading time, avg loading weight, time limit can be discussed with this completely editable template. It is available for immediate download depending on the needs and requirements of the user.
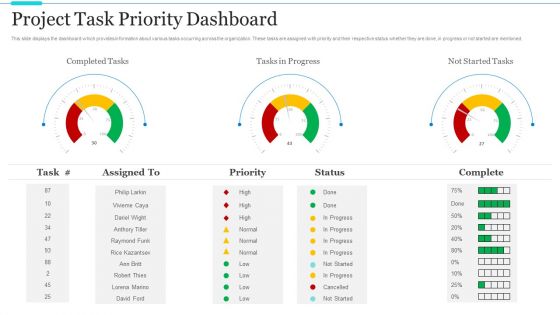
Strategic Methods Of Stakeholder Prioritization Project Task Priority Dashboard Pictures PDF
This slide displays the dashboard which provides information about various tasks occurring across the organization. These tasks are assigned with priority and their respective status whether they are done, in progress or not started are mentioned. Deliver an awe inspiring pitch with this creative strategic methods of stakeholder prioritization project task priority dashboard pictures pdf bundle. Topics like completed tasks, tasks in progress, not started tasks can be discussed with this completely editable template. It is available for immediate download depending on the needs and requirements of the user.
Buzz Marketing Strategies For Brand Promotion Dashboard For Tracking Essential Marketing Slides PDF
This slide covers information regarding the dashboard for tracking essential marketing activities in terms of total leads, email sent, sales ready leads, new customers and revenues, etc. Deliver and pitch your topic in the best possible manner with this buzz marketing strategies for brand promotion dashboard for tracking essential marketing slides pdf. Use them to share invaluable insights on total leads, sales ready leads, new customers, new revenue and impress your audience. This template can be altered and modified as per your expectations. So, grab it now.
Developing Firm Security Strategy Plan Security Incidents Tracking Dashboard Growth Guidelines PDF
This slide portrays information regarding the dashboard that firm will track various security incidents detected. These incidents will be managed in order to avoid security risks. Deliver and pitch your topic in the best possible manner with this developing firm security strategy plan security incidents tracking dashboard growth guidelines pdf. Use them to share invaluable insights on number of open security incidents, open security incidents by age, average age of open security incidents, security incident backlog growth and impress your audience. This template can be altered and modified as per your expectations. So, grab it now.
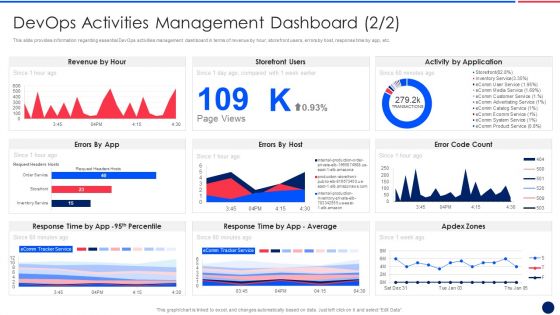
Key Components Critical To Devops Viability IT Devops Activities Management Dashboard Revenue Ideas PDF
This slide provides information regarding essential DevOps activities management dashboard in terms of revenue by hour, storefront users, errors by host, response time by app, etc. Deliver an awe inspiring pitch with this creative key components critical to devops viability it devops activities management dashboard revenue ideas pdf bundle. Topics like revenue by hour, storefront users, errors by host, response time by app can be discussed with this completely editable template. It is available for immediate download depending on the needs and requirements of the user.
Improvising Hiring Process Essential Activities In Recruitment Process Tracking Dashboard Seniority Designs PDF
This slide provides information regarding tracking of essential activities associated to recruitment process and presented in dashboard. Deliver an awe inspiring pitch with this creative improvising hiring process essential activities in recruitment process tracking dashboard seniority designs pdf bundle. Topics like recruitment conversion rate, avg cost of hiring by seniority level, recruiting funnel, avg time to fill by department, turnover rate by age group year can be discussed with this completely editable template. It is available for immediate download depending on the needs and requirements of the user.
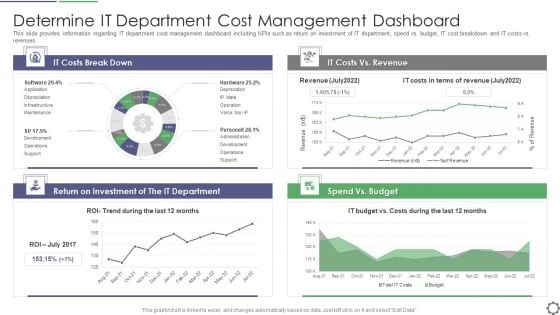
Determine IT Department Cost Management Dashboard Ppt PowerPoint Presentation Gallery Outline PDF
This slide provides information regarding IT department cost management dashboard including KPIs such as return on investment of IT department, spend vs. budget, IT cost breakdown and IT costs vs. revenues. Deliver an awe inspiring pitch with this creative determine it department cost management dashboard ppt powerpoint presentation gallery outline pdf bundle. Topics like it costs break down, it costs vs revenue, spend vs budget, return on investment can be discussed with this completely editable template. It is available for immediate download depending on the needs and requirements of the user.
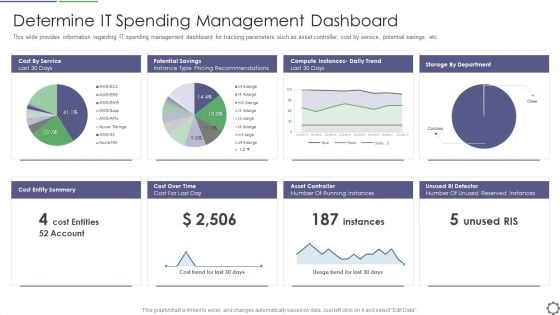
Determine IT Spending Management Dashboard Ppt PowerPoint Presentation Gallery Slide PDF
This slide provides information regarding IT spending management dashboard for tracking parameters such as asset controller, cost by service, potential savings, etc. Deliver and pitch your topic in the best possible manner with this determine it spending management dashboard ppt powerpoint presentation gallery slide pdf. Use them to share invaluable insights on cost entities, cost over time, cost for last day, asset controller, number of running instances and impress your audience. This template can be altered and modified as per your expectations. So, grab it now.
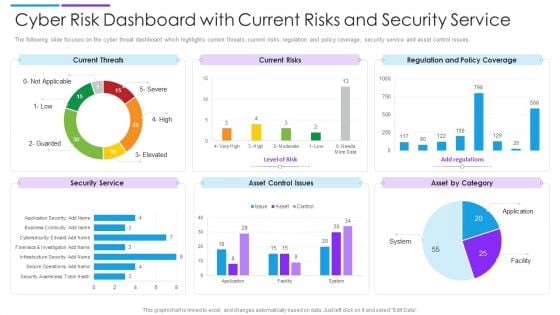
Cyber Risk Dashboard With Current Risks And Security Service Formats PDF
The following slide focuses on the cyber threat dashboard which highlights current threats, current risks, regulation and policy coverage, security service and asset control issues. Pitch your topic with ease and precision using this cyber risk dashboard with current risks and security service formats pdf. This layout presents information on current threats, current risks, regulation and policy coverage. It is also available for immediate download and adjustment. So, changes can be made in the color, design, graphics or any other component to create a unique layout.
Improving Brand Awareness Through WOM Marketing Dashboard For Tracking Essential Marketing Activities Professional PDF
This slide covers information regarding the dashboard for tracking essential marketing activities in terms of total leads, email sent, sales ready leads, new customers and revenues, etc. Deliver and pitch your topic in the best possible manner with this improving brand awareness through wom marketing dashboard for tracking essential marketing activities professional pdf. Use them to share invaluable insights on sales ready leads, new customers, new revenue and impress your audience. This template can be altered and modified as per your expectations. So, grab it now.
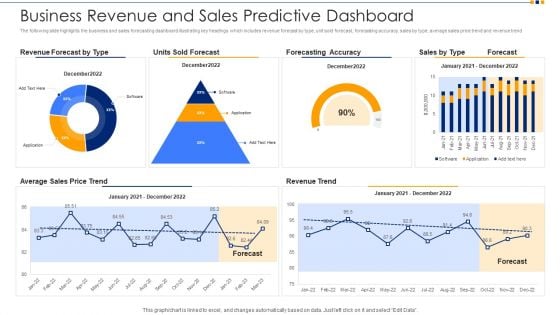
Business Revenue And Sales Predictive Dashboard Ppt Inspiration Background Designs PDF
The following slide highlights the business and sales forecasting dashboard illustrating key headings which includes revenue forecast by type, unit sold forecast, forecasting accuracy, sales by type, average sales price trend and revenue trend. Pitch your topic with ease and precision using this business revenue and sales predictive dashboard ppt inspiration background designs pdf. This layout presents information on revenue forecast by type, units sold forecast, forecasting accuracy, average sales price trend, revenue trend. It is also available for immediate download and adjustment. So, changes can be made in the color, design, graphics or any other component to create a unique layout.
OEM Spare Parts Sales Tracking Dashboard Ppt PowerPoint Presentation Gallery Inspiration PDF
This slide showcases dashboard that can help organization to keep track of aftermarket components sales. Its key elements are sold quantity per spare part and deviation of sold units. Pitch your topic with ease and precision using this oem spare parts sales tracking dashboard ppt powerpoint presentation gallery inspiration pdf. This layout presents information on sold quantity, budgeted quantity, quantity ytd ly. It is also available for immediate download and adjustment. So, changes can be made in the color, design, graphics or any other component to create a unique layout.
Dashboard For Tracking Essential Marketing Activities Positive Marketing For Corporate Topics PDF
This slide covers information regarding the dashboard for tracking essential marketing activities in terms of total leads, email sent, sales ready leads, new customers and revenues, etc. Deliver and pitch your topic in the best possible manner with this dashboard for tracking essential marketing activities positive marketing for corporate topics pdf. Use them to share invaluable insights on total leads, sales ready leads, new customers, new revenue and impress your audience. This template can be altered and modified as per your expectations. So, grab it now.
Actively Influencing Customers Dashboard For Tracking Marketing Activities At Social Guidelines PDF
This slide covers information regarding the dashboard for tracking essential marketing activities at social media platform in terms of social traffic and conversion, referral traffic by site, key social media metrics. Deliver and pitch your topic in the best possible manner with this Actively Influencing Customers Dashboard For Tracking Marketing Activities At Social Guidelines PDF. Use them to share invaluable insights on Social Events, Social Traffic And Conversion, Referral Traffic By Site, Key Social Metrics and impress your audience. This template can be altered and modified as per your expectations. So, grab it now.
Dashboard For Tracking Essential Marketing Activities Actively Influencing Customers Formats PDF
This slide covers information regarding the dashboard for tracking essential marketing activities in terms of total leads, email sent, sales ready leads, new customers and revenues, etc. Deliver and pitch your topic in the best possible manner with this Dashboard For Tracking Essential Marketing Activities Actively Influencing Customers Formats PDF. Use them to share invaluable insights on Total Leads, Sales Ready Leads, New Customers, New Revenue and impress your audience. This template can be altered and modified as per your expectations. So, grab it now.
Business To Business Account B2B Sales Representatives Performance Tracking Dashboard Demonstration PDF
This slide provides information regarding B2B sales representatives performance tracking dashboard to measure leads by region, revenue breakdown, top performers by leads, revenues, etc. Deliver and pitch your topic in the best possible manner with this Business To Business Account B2B Sales Representatives Performance Tracking Dashboard Demonstration PDF. Use them to share invaluable insights on Top 5 Sales Reps By Revenue Pace, Top 5 Sales Reps By Revenue, Top 5 Sales Reps By Leads and impress your audience. This template can be altered and modified as per your expectations. So, grab it now.
Business To Business Account Sales Management Activities Tracking Dashboard Mockup PDF
This slide provides information regarding sales management activities tracking dashboard to measure closed business, sales pipeline, sales activity by sales rep, month over month growth, forecast by month, etc. Deliver and pitch your topic in the best possible manner with this Business To Business Account Sales Management Activities Tracking Dashboard Mockup PDF. Use them to share invaluable insights on Closed Business, Sales Pipeline, Sales Activity By Sales Rep, Forecast By Month, Sales Pipeline By Sales Rep and impress your audience. This template can be altered and modified as per your expectations. So, grab it now.
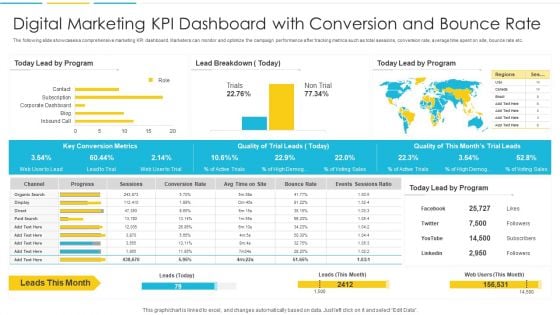
Digital Marketing KPI Dashboard With Conversion And Bounce Rate Introduction PDF
The following slide showcases a comprehensive marketing KPI dashboard. Marketers can monitor and optimize the campaign performance after tracking metrics such as total sessions, conversion rate, average time spent on site, bounce rate etc. Pitch your topic with ease and precision using this Digital Marketing KPI Dashboard With Conversion And Bounce Rate Introduction PDF. This layout presents information on Organic, Progress, Conversion Rate. It is also available for immediate download and adjustment. So, changes can be made in the color, design, graphics or any other component to create a unique layout
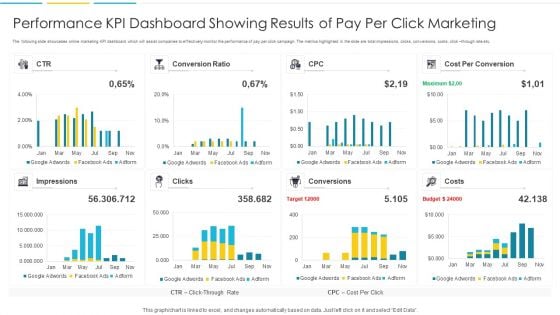
Performance KPI Dashboard Showing Results Of Pay Per Click Marketing Portrait PDF
The following slide showcases online marketing KPI dashboard which will assist companies to effectively monitor the performance of pay per click campaign. The metrics highlighted in the slide are total impressions, clicks, conversions, costs, click through rate etc. Pitch your topic with ease and precision using this Performance KPI Dashboard Showing Results Of Pay Per Click Marketing Portrait PDF. This layout presents information on Impressions, Target, Budget. It is also available for immediate download and adjustment. So, changes can be made in the color, design, graphics or any other component to create a unique layout.
Internet Marketing Playbook Dashboard For Tracking Lead Generation From Marketing Efforts Portrait PDF
Following slide displays KPI dashboard that company is currently using for measuring lead generation through marketing. It also provides information about the traffic generation through different sources. Deliver and pitch your topic in the best possible manner with this Internet Marketing Playbook Dashboard For Tracking Lead Generation From Marketing Efforts Portrait PDF. Use them to share invaluable insights on Traffic Per Source, Leader Per Source, Total Leader Year and impress your audience. This template can be altered and modified as per your expectations. So, grab it now.
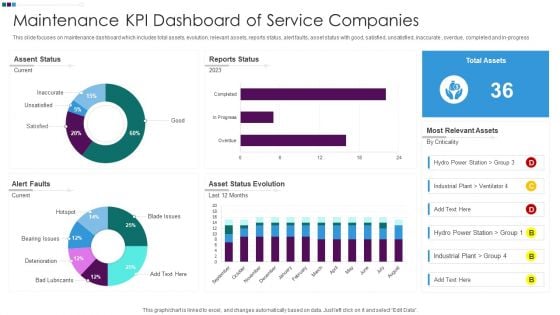
Maintenance KPI Dashboard Of Service Companies Ppt Outline Graphics Design PDF
This slide focuses on maintenance dashboard which includes total assets, evolution, relevant assets, reports status, alert faults, asset status with good, satisfied, unsatisfied, inaccurate , overdue, completed and in-progress. Pitch your topic with ease and precision using this Maintenance KPI Dashboard Of Service Companies Ppt Outline Graphics Design PDF. This layout presents information on Assent Status Current, Reports Status 2023, Asset Status Evolution. It is also available for immediate download and adjustment. So, changes can be made in the color, design, graphics or any other component to create a unique layout.
Business To Business Sales Management Playbook Sales Management Activities Tracking Dashboard Microsoft PDF
This slide provides information regarding sales management activities tracking dashboard to measure closed business, sales pipeline, sales activity by sales rep, month over month growth, forecast by month, etc.Deliver and pitch your topic in the best possible manner with this Business To Business Sales Management Playbook Sales Management Activities Tracking Dashboard Microsoft PDF Use them to share invaluable insights on Forecast Month, Sales Pipeline, Sales Activity and impress your audience. This template can be altered and modified as per your expectations. So, grab it now.
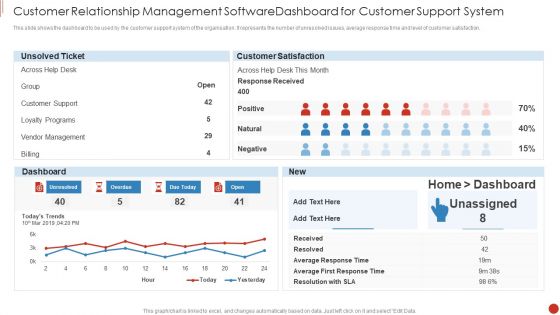
Customer Relationship Management Software Dashboard For Customer Support System Demonstration PDF
This slide shows the dashboard to be used by the customer support system of the organisation. It represents the number of unresolved issues, average response time and level of customer satisfaction.Pitch your topic with ease and precision using this Customer Relationship Management Software Dashboard For Customer Support System Demonstration PDF This layout presents information on Customer Support, Vendor Management, Loyalty Programs It is also available for immediate download and adjustment. So, changes can be made in the color, design, graphics or any other component to create a unique layout.
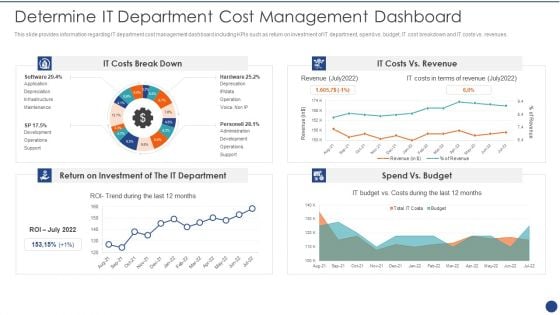
Cios Value Optimization Determine IT Department Cost Management Dashboard Microsoft PDF
This slide provides information regarding IT department cost management dashboard including KPIs such as return on investment of IT department, spend vs. budget, IT cost breakdown and IT costs vs. revenues. Deliver and pitch your topic in the best possible manner with this Cios Value Optimization Determine IT Department Cost Management Dashboard Microsoft PDF. Use them to share invaluable insights on IT Costs, Return Investment, IT Department and impress your audience. This template can be altered and modified as per your expectations. So, grab it now.

HR Recruitment Dashboard Kpis With Open Positions Ppt Model Good PDF
Following slide showcases the recruitment dashboard metrics for measuring placement per department. It include KPIs like applications received by departments, applicant details, sources, time to hire. Pitch your topic with ease and precision using this HR Recruitment Dashboard Kpis With Open Positions Ppt Model Good PDF. This layout presents information on Offer Acceptance Ratio, Recruitment Funnel, Applicant Details. It is also available for immediate download and adjustment. So, changes can be made in the color, design, graphics or any other component to create a unique layout.
How To Implement Cloud Collaboration Cloud Platform Dashboard For Tracking Project Team Professional PDF
The following slide depicts project team task tracking cloud dashboard. It provides information about hours worked, projects worked, time spent, daily limit, product design, weekly activity, etc. Deliver and pitch your topic in the best possible manner with this How To Implement Cloud Collaboration Cloud Platform Dashboard For Tracking Project Team Professional PDF. Use them to share invaluable insights on Today Activity, Daily Limits, Recent Activity and impress your audience. This template can be altered and modified as per your expectations. So, grab it now.
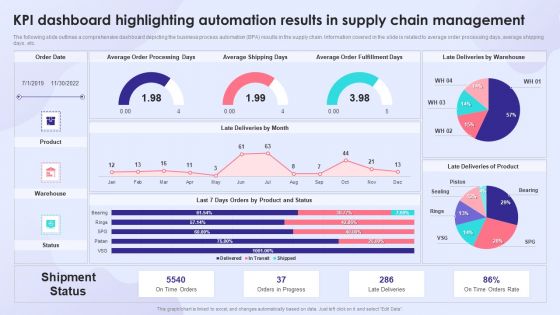
KPI Dashboard Highlighting Automation Results In Supply Chain Management Rules PDF
The following slide outlines a comprehensive dashboard depicting the business process automation BPA results in the supply chain. Information covered in the slide is related to average order processing days, average shipping days, etc. Deliver and pitch your topic in the best possible manner with this KPI Dashboard Highlighting Automation Results In Supply Chain Management Rules PDF. Use them to share invaluable insights on Average Order Fulfillment Days, Average Shipping Days, Average Order Processing Days and impress your audience. This template can be altered and modified as per your expectations. So, grab it now.
Instructions Playbook For B2B Sales Executive Sales Management Activities Tracking Dashboard Pictures PDF
This slide provides information regarding sales management activities tracking dashboard to measure closed business, sales pipeline, sales activity by sales rep, month over month growth, forecast by month, etc. Deliver and pitch your topic in the best possible manner with this Instructions Playbook For B2B Sales Executive Sales Management Activities Tracking Dashboard Pictures PDF. Use them to share invaluable insights on Closed Business, Sales Pipeline, Sales Activity and impress your audience. This template can be altered and modified as per your expectations. So, grab it now.
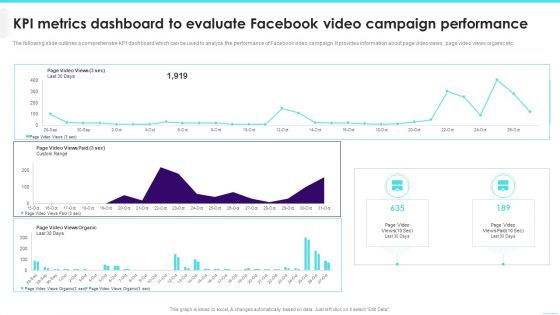
KPI Metrics Dashboard To Evaluate Facebook Video Campaign Performance Elements PDF
The following slide outlines a comprehensive KPI dashboard which can be used to analyze the performance of Facebook video campaign. It provides information about page video views, page video views organic etc.Deliver and pitch your topic in the best possible manner with this KPI Metrics Dashboard To Evaluate Facebook Video Campaign Performance Elements PDF. Use them to share invaluable insights on Custom Range, Page Video, Views Paid and impress your audience. This template can be altered and modified as per your expectations. So, grab it now.
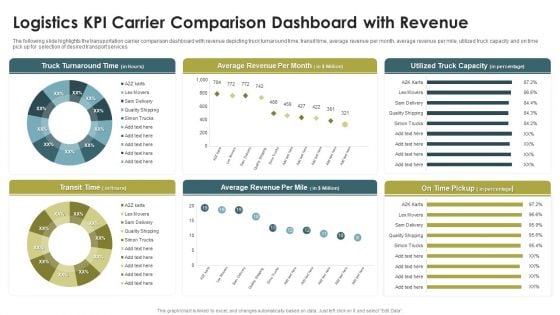
Logistics KPI Carrier Comparison Dashboard With Revenue Ppt Infographics Portfolio PDF
The following slide highlights the transportation carrier comparison dashboard with revenue depicting truck turnaround time, transit time, average revenue per month, average revenue per mile, utilized truck capacity and on time pick up for selection of desired transport services. Pitch your topic with ease and precision using this Logistics KPI Carrier Comparison Dashboard With Revenue Ppt Infographics Portfolio PDF. This layout presents information on Truck Turnaround Time, Average Revenue, Per Month, Transit Time. It is also available for immediate download and adjustment. So, changes can be made in the color, design, graphics or any other component to create a unique layout.

Logistics KPI Status Dashboard With Monthly KPI Ppt Infographic Template Layout PDF
The following slide highlights the transportation status dashboard with monthly KPI illustrating order status with customer, order date and delivery date. It shows financial performance for four quarters as well as todays order, inventory and monthly KPI with Inventory, shipping cost for past 30 days. Pitch your topic with ease and precision using this Logistics KPI Status Dashboard With Monthly KPI Ppt Infographic Template Layout PDF. This layout presents information on Order Status, Today Order, Inventory, Monthly KPI. It is also available for immediate download and adjustment. So, changes can be made in the color, design, graphics or any other component to create a unique layout.
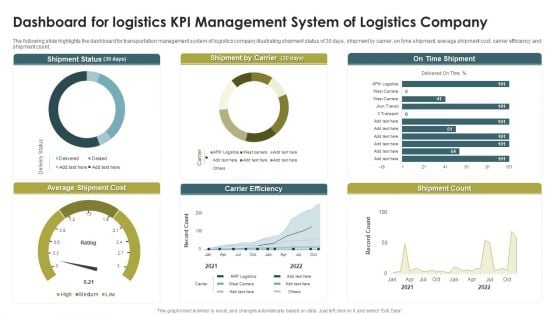
Dashboard For Logistics KPI Management System Of Logistics Company Infographics PDF
The following slide highlights the dashboard for transportation management system of logistics company illustrating shipment status of 30 days, shipment by carrier, on time shipment, average shipment cost, carrier efficiency and shipment count. Pitch your topic with ease and precision using this Dashboard For Logistics KPI Management System Of Logistics Company Infographics PDF. This layout presents information on Shipment Status, Shipment By Carrier, On Time Shipment. It is also available for immediate download and adjustment. So, changes can be made in the color, design, graphics or any other component to create a unique layout.
KPI Dashboard For Tracking Supply Chain Costs Ppt Summary Templates PDF
This slide represents the KPI dashboard to track the multiple cost associated with supply chain in food manufacturing industry. It includes information regarding cash to cash cycle in days, carry cost of inventory along with details of net sales. Deliver an awe inspiring pitch with this creative KPI Dashboard For Tracking Supply Chain Costs Ppt Summary Templates PDF bundle. Topics like Supply Chain, Costs vs Sales, Carrying Costs Inventory, Supply Chain Costs can be discussed with this completely editable template. It is available for immediate download depending on the needs and requirements of the user.
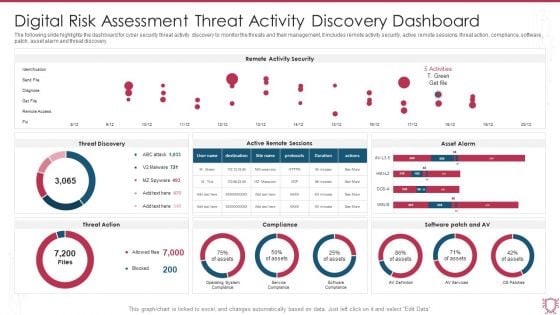
Digital Risk Assessment Threat Activity Discovery Dashboard Ppt Ideas Skills PDF
The following slide highlights the dashboard for cyber security threat activity discovery to monitor the threats and their management, it includes remote activity security, active remote sessions, threat action, compliance, software patch, asset alarm and threat discovery. Pitch your topic with ease and precision using this Digital Risk Assessment Threat Activity Discovery Dashboard Ppt Ideas Skills PDF. This layout presents information on Remote Activity Security, Threat Discovery, Asset Alarm. It is also available for immediate download and adjustment. So, changes can be made in the color, design, graphics or any other component to create a unique layout.
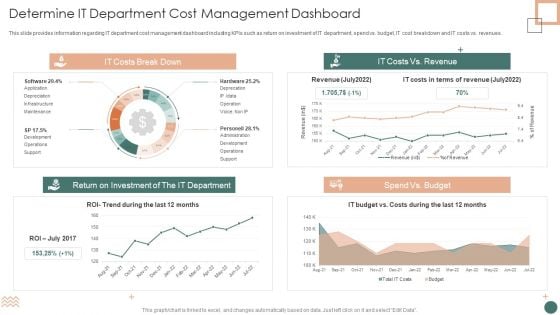
Improved Digital Expenditure Determine IT Department Cost Management Dashboard Introduction PDF
This slide provides information regarding IT department cost management dashboard including KPIs such as return on investment of IT department, spend vs. budget, IT cost breakdown and IT costs vs. revenues. Deliver and pitch your topic in the best possible manner with this Improved Digital Expenditure Determine IT Department Cost Management Dashboard Introduction PDF. Use them to share invaluable insights on Return Investment, Depreciation, Costs Break and impress your audience. This template can be altered and modified as per your expectations. So, grab it now.
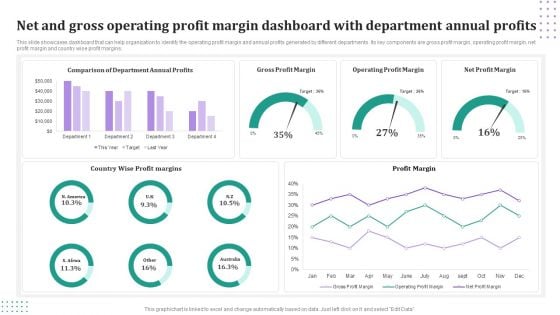
Net And Gross Operating Profit Margin Dashboard With Department Annual Profits Mockup PDF
This slide showcases dashboard that can help organization to identify the operating profit margin and annual profits generated by different departments. Its key components are gross profit margin, operating profit margin, net profit margin and country wise profit margins. Pitch your topic with ease and precision using this Net And Gross Operating Profit Margin Dashboard With Department Annual Profits Mockup PDF. This layout presents information on Gross Profit Margin, Operating Profit Margin, Net Profit Margin. It is also available for immediate download and adjustment. So, changes can be made in the color, design, graphics or any other component to create a unique layout.
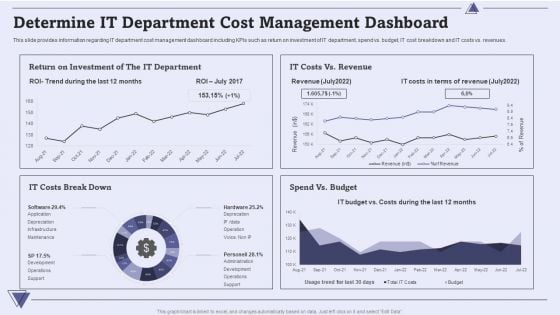
CIO For IT Cost Optimization Techniques Determine IT Department Cost Management Dashboard Introduction PDF
This slide provides information regarding IT department cost management dashboard including KPIs such as return on investment of IT department, spend vs. budget, IT cost breakdown and IT costs vs. revenues. Deliver and pitch your topic in the best possible manner with this CIO For IT Cost Optimization Techniques Determine IT Department Cost Management Dashboard Introduction PDF. Use them to share invaluable insights on Costs, Budget, Revenue and impress your audience. This template can be altered and modified as per your expectations. So, grab it now.
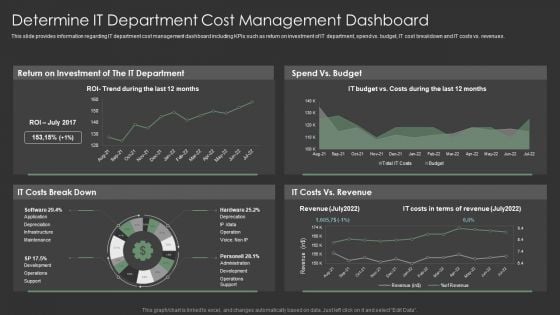
IT Spend Management Priorities By Cios Determine IT Department Cost Management Dashboard Pictures PDF
This slide provides information regarding IT department cost management dashboard including KPIs such as return on investment of IT department, spend vs. budget, IT cost breakdown and IT costs vs. revenues. Deliver and pitch your topic in the best possible manner with this IT Spend Management Priorities By Cios Determine IT Department Cost Management Dashboard Pictures PDF. Use them to share invaluable insights on Revenue, Costs, Budget and impress your audience. This template can be altered and modified as per your expectations. So, grab it now.
Strategy Playbook For Ecommerce Business Dashboard Tracking Essential Kpis For Ecommerce Performance Rules PDF
This slide provides information regarding essential KPIs for ecommerce performance dashboard tracking average bounce rate, new vs. old customers, channel revenue vs. channel acquisitions costs, channel revenue vs. sales, average conversion rate, etc. Deliver an awe inspiring pitch with this creative Strategy Playbook For Ecommerce Business Dashboard Tracking Essential Kpis For Ecommerce Performance Rules PDF bundle. Topics like Returning Customers, Acquisition Cost, Channel Revenue can be discussed with this completely editable template. It is available for immediate download depending on the needs and requirements of the user.
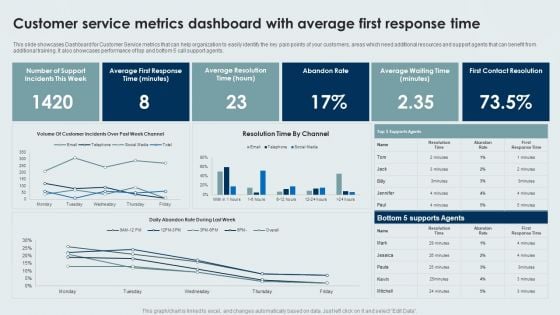
Customer Service Metrics Dashboard With Average First Response Time Background PDF
This slide showcases Dashboard for Customer Service metrics that can help organization to easily identify the key pain points of your customers, areas which need additional resources and support agents that can benefit from additional training. It also showcases performance of top and bottom 5 call support agents. Pitch your topic with ease and precision using this Customer Service Metrics Dashboard With Average First Response Time Background PDF. This layout presents information on Average, Abandon Rate, Contact Resolution. It is also available for immediate download and adjustment. So, changes can be made in the color, design, graphics or any other component to create a unique layout.
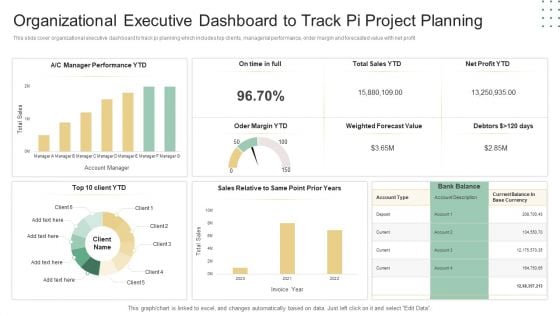
Organizational Executive Dashboard To Track Pi Project Planning Ppt Professional Background PDF
This slide cover organizational executive dashboard to track pi planning which includes top clients, managerial performance, order margin and forecasted value with net profit. Pitch your topic with ease and precision using this Organizational Executive Dashboard To Track Pi Project Planning Ppt Professional Background PDF. This layout presents information on Weighted Forecast Value, Top 10, Client YTD. It is also available for immediate download and adjustment. So, changes can be made in the color, design, graphics or any other component to create a unique layout.
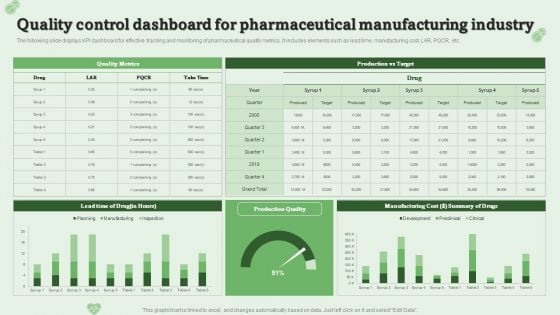
Quality Control Dashboard For Pharmaceutical Manufacturing Industry Ppt PowerPoint Presentation Model Layouts PDF
The following slide displays KPI dashboard for effective tracking and monitoring of pharmaceutical quality metrics. It includes elements such as lead time, manufacturing cost, LAR, PQCR, etc.Pitch your topic with ease and precision using this Quality Control Dashboard For Pharmaceutical Manufacturing Industry Ppt PowerPoint Presentation Model Layouts PDF. This layout presents information on Manufacturing Cost, Summary Drugs, Quality Metrics. It is also available for immediate download and adjustment. So, changes can be made in the color, design, graphics or any other component to create a unique layout.
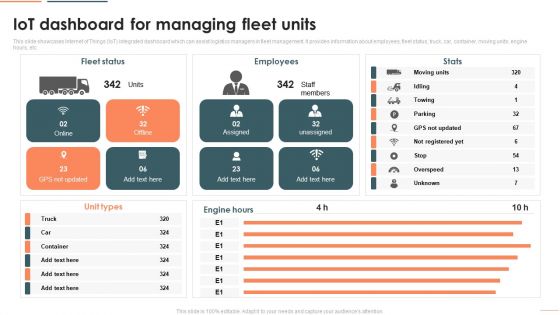
Deploying Iot In Logistics And Supply Chain Iot Dashboard For Managing Fleet Units Download PDF
This slide showcases Internet of Things IoT integrated dashboard which can assist logistics managers in fleet management. It provides information about employees, fleet status, truck, car, container, moving units, engine hours, etc. Deliver and pitch your topic in the best possible manner with this Deploying Iot In Logistics And Supply Chain Iot Dashboard For Managing Fleet Units Download PDF. Use them to share invaluable insights on Fleet Status, Employees, Unit Types and impress your audience. This template can be altered and modified as per your expectations. So, grab it now.
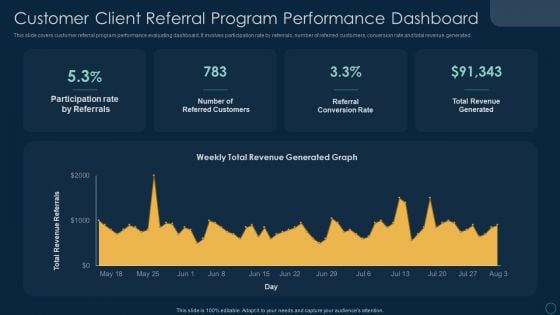
Customer Client Referral Program Performance Dashboard Ppt File Visual Aids PDF
This slide covers customer referral program performance evaluating dashboard. It involves participation rate by referrals, number of referred customers, conversion rate and total revenue generated. Pitch your topic with ease and precision using this Customer Client Referral Program Performance Dashboard Ppt File Visual Aids PDF. This layout presents information on Participation Rate Referrals, Number Referred Customers, Referral Conversion Rate. It is also available for immediate download and adjustment. So, changes can be made in the color, design, graphics or any other component to create a unique layout.

KPI Dashboard Highlighting Automation Results In Supply Achieving Operational Efficiency Graphics PDF
The following slide outlines a comprehensive dashboard depicting the business process automation BPA results in the supply chain. Information covered in the slide is related to average order processing days, average shipping days, etc.Deliver and pitch your topic in the best possible manner with this KPI Dashboard Highlighting Automation Results In Supply Achieving Operational Efficiency Graphics PDF. Use them to share invaluable insights on Orders Progress, Late Deliveries, Deliveries Warehouse and impress your audience. This template can be altered and modified as per your expectations. So, grab it now.
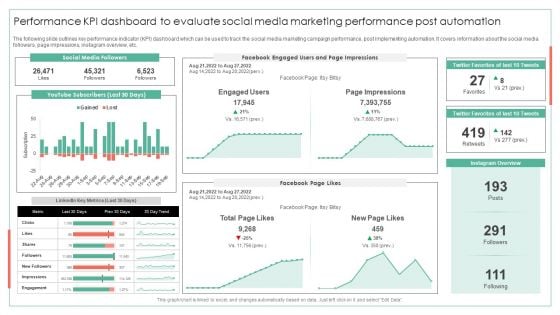
Performance KPI Dashboard To Evaluate Social Media Marketing Performance Post Automation Ideas PDF
The following slide outlines key performance indicator KPI dashboard which can be used to track the social media marketing campaign performance, post implementing automation. It covers information about the social media followers, page impressions, instagram overview, etc.Deliver an awe inspiring pitch with this creative Performance KPI Dashboard To Evaluate Social Media Marketing Performance Post Automation Ideas PDF bundle. Topics like Page Impressions, Twitter Favorites, Instagram Overview can be discussed with this completely editable template. It is available for immediate download depending on the needs and requirements of the user.
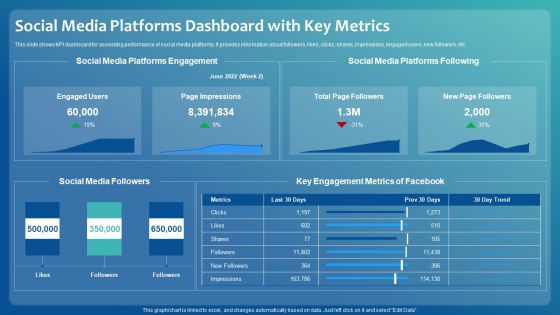
Improving Digital Community Engagement Strategy Social Media Platforms Dashboard With Key Metrics Professional PDF
This slide shows KPI dashboard for assessing performance of social media platforms. It provides information about followers, likes, clicks, shares, impressions, engaged users, new followers, etc. Deliver and pitch your topic in the best possible manner with this Improving Digital Community Engagement Strategy Social Media Platforms Dashboard With Key Metrics Professional PDF. Use them to share invaluable insights on Social Media Platforms Engagement, Key Engagement Metrics and impress your audience. This template can be altered and modified as per your expectations. So, grab it now.
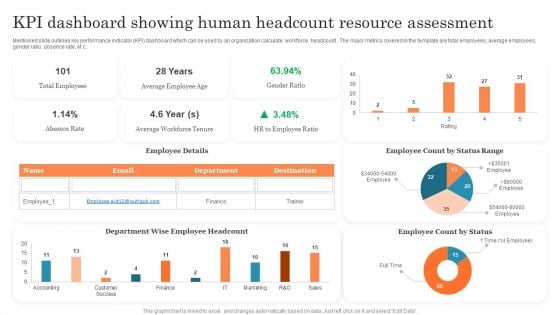
KPI Dashboard Showing Human Headcount Resource Assessment Ppt PowerPoint Presentation Outline PDF
Mentioned slide outlines key performance indicator KPI dashboard which can be used by an organization calculate workforce headcount . The major metrics covered in the template are total employees, average employees, gender ratio, absence rate, etc. Pitch your topic with ease and precision using this KPI Dashboard Showing Human Headcount Resource Assessment Ppt PowerPoint Presentation Outline PDF. This layout presents information on Total Employees, Average Employee, Employee Count. It is also available for immediate download and adjustment. So, changes can be made in the color, design, graphics or any other component to create a unique layout.

Patient Health And Risk Key Performance Indicator Dashboard Ppt Infographic Template Summary PDF
The following slide highlights the patient health and safety key performance indicator dashboard illustrating admission by department, admission by cost, patient satisfaction, total patients, operations cost, patient density, total staff, waiting time, treatment satisfaction and treatment confidence. Pitch your topic with ease and precision using this Patient Health And Risk Key Performance Indicator Dashboard Ppt Infographic Template Summary PDF. This layout presents information on Admission By Department, Admission Vs Cost, Patient Satisfaction. It is also available for immediate download and adjustment. So, changes can be made in the color, design, graphics or any other component to create a unique layout.
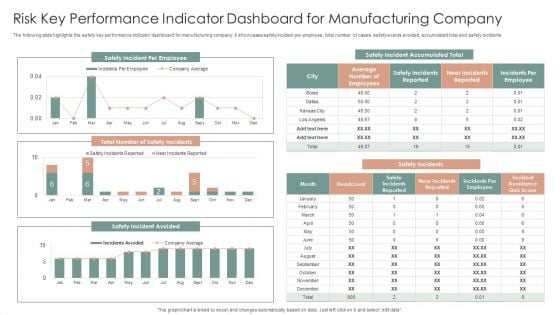
Risk Key Performance Indicator Dashboard For Manufacturing Company Ppt Gallery Graphics Design PDF
The following slide highlights the safety key performance indicator dashboard for manufacturing company. It showcases safety incident per employee, total number of cases, safety events avoided, accumulated total and safety incidents. Pitch your topic with ease and precision using this Risk Key Performance Indicator Dashboard For Manufacturing Company Ppt Gallery Graphics Design PDF. This layout presents information on Safety Incidents, Safety Incident Avoided, Safety Incident Accumulated. It is also available for immediate download and adjustment. So, changes can be made in the color, design, graphics or any other component to create a unique layout.
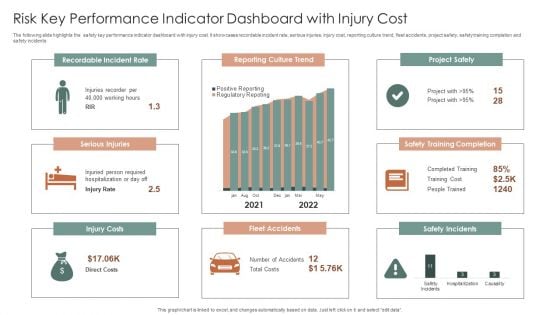
Risk Key Performance Indicator Dashboard With Injury Cost Ppt Summary Brochure PDF
The following slide highlights the safety key performance indicator dashboard with injury cost. It showcases recordable incident rate, serious injuries, injury cost, reporting culture trend, fleet accidents, project safety, safety training completion and safety incidents. Pitch your topic with ease and precision using this Risk Key Performance Indicator Dashboard With Injury Cost Ppt Summary Brochure PDF. This layout presents information on Recordable Incident Rate, Reporting Culture Trend, Project Safety. It is also available for immediate download and adjustment. So, changes can be made in the color, design, graphics or any other component to create a unique layout.

 Home
Home