Data Analytics Icons
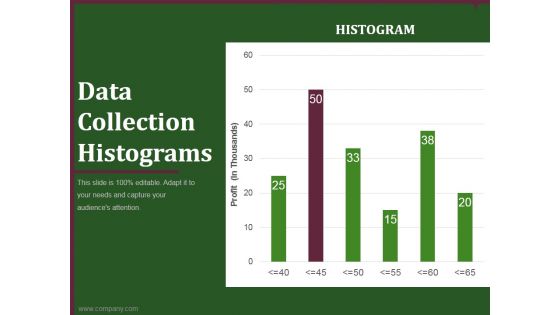
data collection histograms ppt powerpoint presentation example
This is a data collection histograms ppt powerpoint presentation example. This is a six stage process. The stages in this process are business, planning, marketing, histograms, graph.

Financial Data Analysis Sample Diagram Presentation Slide
This is a financial data analysis sample diagram presentation slide. This is a four stage process. The stages in this process are finance, sales and marketing, operations, credit and risk.
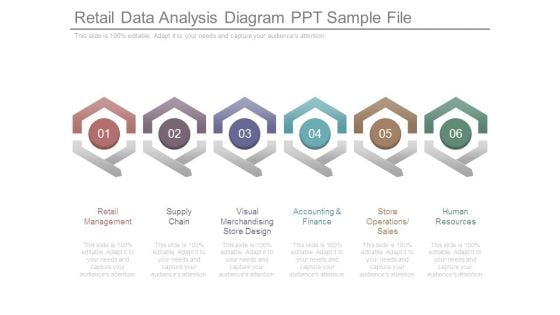
Retail Data Analysis Diagram Ppt Sample File
This is a retail data analysis diagram ppt sample file. This is a six stage process. The stages in this process are retail management, supply chain, visual merchandising store design, accounting and finance, store operations sales, human resources.
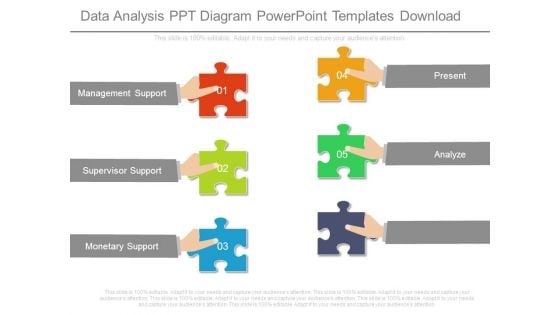
Data Analysis Ppt Diagram Powerpoint Templates Download
This is a data analysis ppt diagram powerpoint templates download. This is a five stage process. The stages in this process are management support, supervisor support, monetary support, present, analyze.
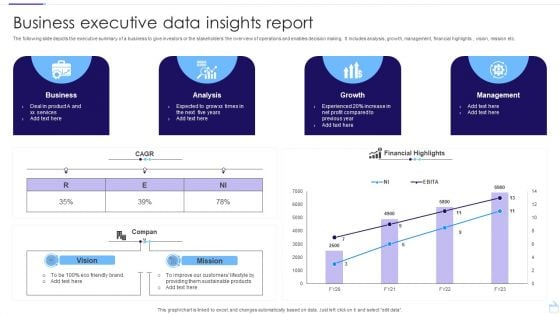
Business Executive Data Insights Report Pictures PDF
The following slide depicts the executive summary of a business to give investors or the stakeholders the overview of operations and enables decision making. It includes analysis, growth, management, financial highlights , vision, mission etc. Pitch your topic with ease and precision using this Business Executive Data Insights Report Pictures PDF. This layout presents information on Business, Analysis, Growth. It is also available for immediate download and adjustment. So, changes can be made in the color, design, graphics or any other component to create a unique layout.
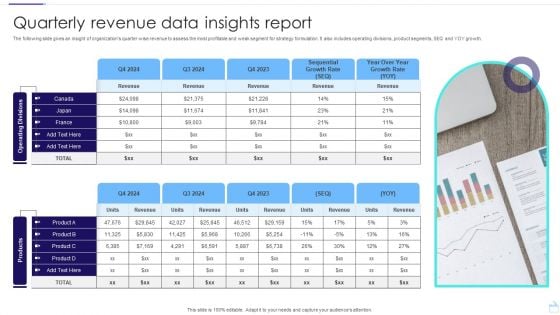
Quarterly Revenue Data Insights Report Template PDF
The following slide gives an insight of organizations quarter wise revenue to assess the most profitable and weak segment for strategy formulation. It also includes operating divisions, product segments, SEQ and YOY growth. Showcasing this set of slides titled Quarterly Revenue Data Insights Report Template PDF. The topics addressed in these templates are Operating, Divisions products, Insights Report. All the content presented in this PPT design is completely editable. Download it and make adjustments in color, background, font etc. as per your unique business setting.
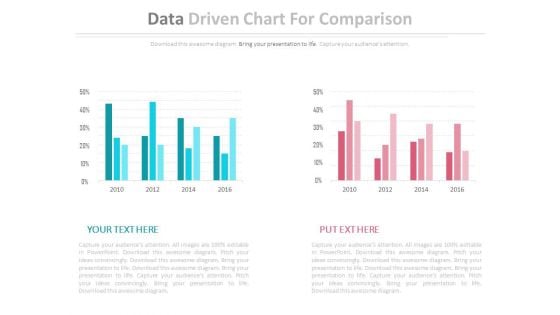
Two Data Driven Comparison Charts Powerpoint Slides
This PowerPoint template contains diagram of two data driven charts. You may use this PPT slide to depict strategic analysis for business. The color coding of this template is specifically designed to highlight you points.
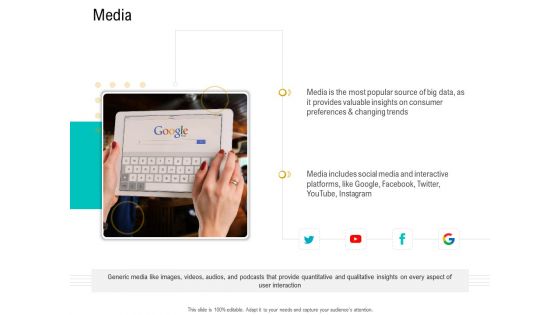
Business Data Analysis Media Themes PDF
This is a business data analysis media themes pdf template with various stages. Focus and dispense information on one stage using this creative set, that comes with editable features. It contains large content boxes to add your information on topics like media is the most popular source of big data, as it provides valuable insights on consumer preferences and changing trends, media includes social media and interactive platforms, like google, facebook, twitter, youtube, instagram. You can also showcase facts, figures, and other relevant content using this PPT layout. Grab it now.
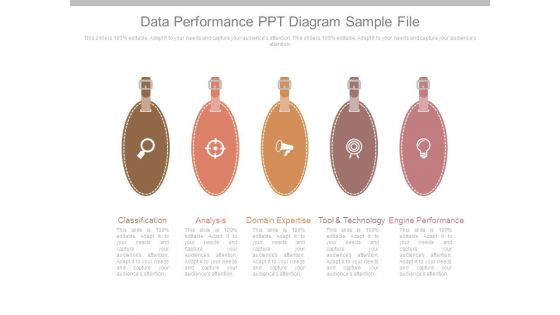
Data Performance Ppt Diagram Sample File
This is a data performance ppt diagram sample file. This is a five stage process. The stages in this process are classification, analysis, domain expertise, tool and technology, engine performance.
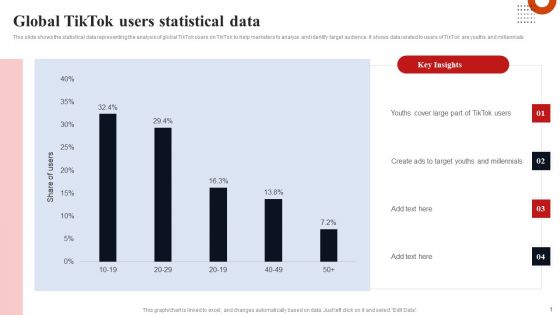
Global Tiktok Users Statistical Data Portrait PDF
This slide shows the statistical data representing the analysis of global TikTok users on TikTok to help marketers to analyze and identify target audience. It shows data related to users of TikTok are youths and millennials. If you are looking for a format to display your unique thoughts, then the professionally designed Global Tiktok Users Statistical Data Portrait PDF is the one for you. You can use it as a Google Slides template or a PowerPoint template. Incorporate impressive visuals, symbols, images, and other charts. Modify or reorganize the text boxes as you desire. Experiment with shade schemes and font pairings. Alter, share or cooperate with other people on your work. Download Global Tiktok Users Statistical Data Portrait PDF and find out how to give a successful presentation. Present a perfect display to your team and make your presentation unforgettable.
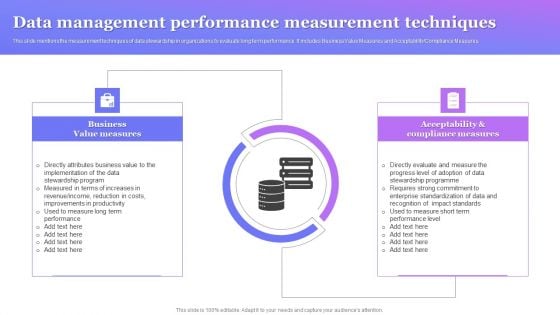
Data Management Performance Measurement Techniques Graphics PDF
This slide mentions the measurement techniques of data stewardship in organizations to evaluate long term performance. It includes Business Value Measures and Acceptability Compliance Measures. Presenting Data Management Performance Measurement Techniques Graphics PDF to dispense important information. This template comprises two stages. It also presents valuable insights into the topics including Business Value Measures, Acceptability Compliance Measures, Directly Attributes Business. This is a completely customizable PowerPoint theme that can be put to use immediately. So, download it and address the topic impactfully.
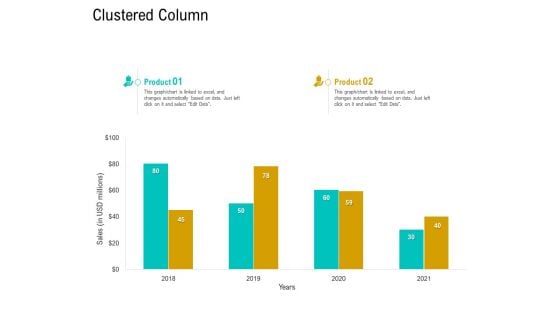
Business Data Analysis Clustered Column Template PDF
Deliver an awe inspiring pitch with this creative business data analysis clustered column template pdf bundle. Topics like clustered column can be discussed with this completely editable template. It is available for immediate download depending on the needs and requirements of the user.
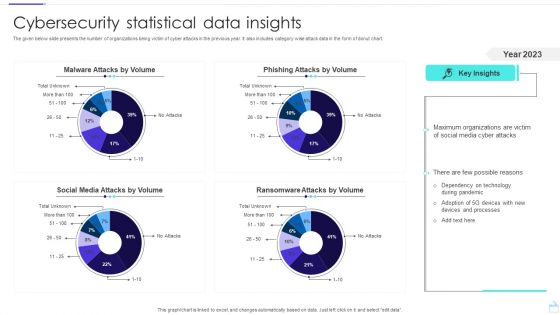
Cybersecurity Statistical Data Insights Sample PDF
The given below slide presents the number of organizations being victim of cyber attacks in the previous year. It also includes category wise attack data in the form of donut chart. Pitch your topic with ease and precision using this Cybersecurity Statistical Data Insights Sample PDF. This layout presents information on Social Media Attacks, Malware Attacks, Phishing Attacks. It is also available for immediate download and adjustment. So, changes can be made in the color, design, graphics or any other component to create a unique layout.
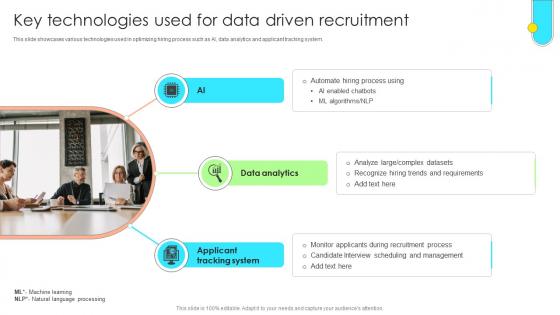
Data Driven Approach To Optimise Key Technologies Used For Data Driven Recruitment CRP SS V
This slide showcases various technologies used in optimizing hiring process such as AI, data analytics and applicant tracking system. Retrieve professionally designed Data Driven Approach To Optimise Key Technologies Used For Data Driven Recruitment CRP SS V to effectively convey your message and captivate your listeners. Save time by selecting pre-made slideshows that are appropriate for various topics, from business to educational purposes. These themes come in many different styles, from creative to corporate, and all of them are easily adjustable and can be edited quickly. Access them as PowerPoint templates or as Google Slides themes. You do not have to go on a hunt for the perfect presentation because Slidegeeks got you covered from everywhere. This slide showcases various technologies used in optimizing hiring process such as AI, data analytics and applicant tracking system.
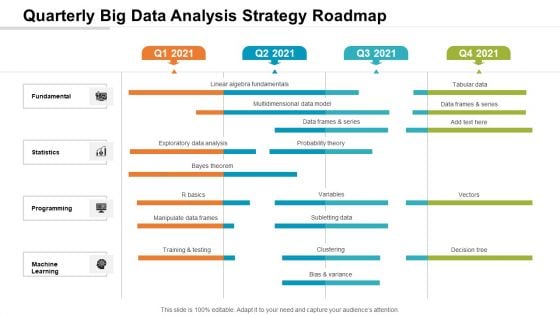
Quarterly Big Data Analysis Strategy Roadmap Infographics
Presenting our jaw-dropping quarterly big data analysis strategy roadmap infographics. You can alternate the color, font size, font type, and shapes of this PPT layout according to your strategic process. This PPT presentation is compatible with Google Slides and is available in both standard screen and widescreen aspect ratios. You can also download this well-researched PowerPoint template design in different formats like PDF, JPG, and PNG. So utilize this visually-appealing design by clicking the download button given below.
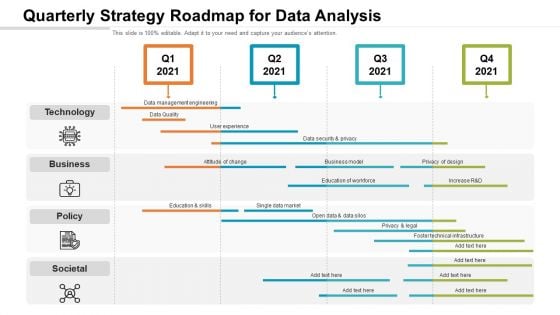
Quarterly Strategy Roadmap For Data Analysis Microsoft
Introducing our quarterly strategy roadmap for data analysis microsoft. This PPT presentation is Google Slides compatible, therefore, you can share it easily with the collaborators for measuring the progress. Also, the presentation is available in both standard screen and widescreen aspect ratios. So edit the template design by modifying the font size, font type, color, and shapes as per your requirements. As this PPT design is fully editable it can be presented in PDF, JPG and PNG formats.
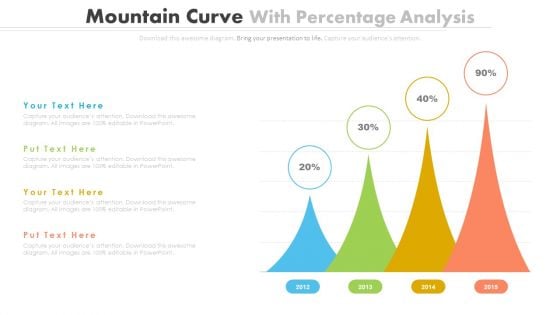
Percentage Data Growth Chart Powerpoint Slides
This PowerPoint template has been designed with percentage data growth chart. Download this PPT chart to depict financial ratio analysis. This PowerPoint slide is of great help in the business sector to make realistic presentations and provides effective way of presenting your newer thoughts.
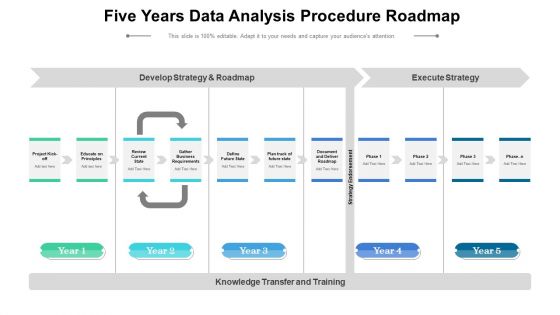
Five Years Data Analysis Procedure Roadmap Infographics
Introducing our five years data analysis procedure roadmap infographics. This PPT presentation is Google Slides compatible, therefore, you can share it easily with the collaborators for measuring the progress. Also, the presentation is available in both standard screen and widescreen aspect ratios. So edit the template design by modifying the font size, font type, color, and shapes as per your requirements. As this PPT design is fully editable it can be presented in PDF, JPG and PNG formats.
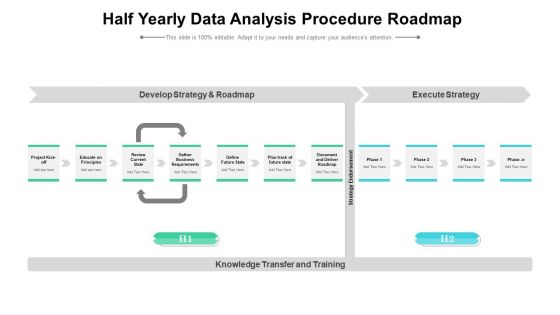
Half Yearly Data Analysis Procedure Roadmap Formats
Presenting our innovatively structured half yearly data analysis procedure roadmap formats Template. Showcase your roadmap process in different formats like PDF, PNG, and JPG by clicking the download button below. This PPT design is available in both Standard Screen and Widescreen aspect ratios. It can also be easily personalized and presented with modified font size, font type, color, and shapes to measure your progress in a clear way.
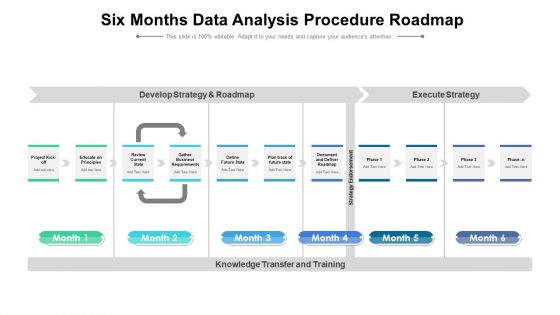
Six Months Data Analysis Procedure Roadmap Topics
Presenting our innovatively structured six months data analysis procedure roadmap topics Template. Showcase your roadmap process in different formats like PDF, PNG, and JPG by clicking the download button below. This PPT design is available in both Standard Screen and Widescreen aspect ratios. It can also be easily personalized and presented with modified font size, font type, color, and shapes to measure your progress in a clear way.
Hiring Plan Of Sales And Marketing Group Icons Pdf
The following slide showcases the hiring plan of sales and marketing team which makes the hiring simpler . It includes department wise vacant position of salesperson, sales assistant, content marketer, visual designer, data analyst etc. Showcasing this set of slides titled Hiring Plan Of Sales And Marketing Group Icons Pdf. The topics addressed in these templates are Department, Hiring Plan, Marketing Group. All the content presented in this PPT design is completely editable. Download it and make adjustments in color, background, font etc. as per your unique business setting. The following slide showcases the hiring plan of sales and marketing team which makes the hiring simpler . It includes department wise vacant position of salesperson, sales assistant, content marketer, visual designer, data analyst etc.
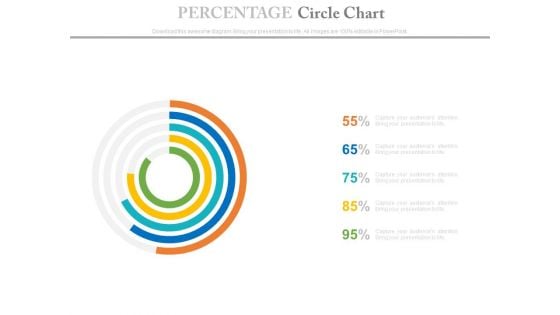
Percentage Data Circle Chart Powerpoint Slides
This PowerPoint template has been designed with circle chart. Download this PPT chart to depict financial ratio analysis. This PowerPoint slide is of great help in the business sector to make realistic presentations and provides effective way of presenting your newer thoughts.
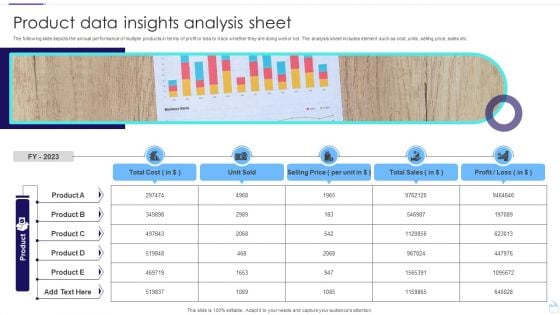
Product Data Insights Analysis Sheet Infographics PDF
The following slide depicts the annual performance of multiple products in terms of profit or loss to track whether they are doing well or not. The analysis sheet includes element such as cost, units, selling price, sales etc. Pitch your topic with ease and precision using this Product Data Insights Analysis Sheet Infographics PDF. This layout presents information on Unit Sold, Selling Price, Total Sales. It is also available for immediate download and adjustment. So, changes can be made in the color, design, graphics or any other component to create a unique layout.

Financial Reporting Manager With Data Powerpoint Slides
This PowerPoint template has been designed with graphics of finance manager and percentage data. This diagram is useful to exhibit financial management. This diagram slide can be used to make impressive presentations.
Competitor Analysis Market Restraints To Adoption Ppt Summary Icons PDF
This is a competitor analysis market restraints to adoption ppt summary icons pdf template with various stages. Focus and dispense information on three stages using this creative set, that comes with editable features. It contains large content boxes to add your information on topics like data privacy concerns, network connectivity, high cost of implementation. You can also showcase facts, figures, and other relevant content using this PPT layout. Grab it now.
Graphical Representation Of Research IT Univariate Analysis Techniques Icons PDF
This slide depicts the univariate analysis technique for data visualization, including distribution, box and whisker, and the violin plot. Presenting graphical representation of research it univariate analysis techniques icons pdf to provide visual cues and insights. Share and navigate important information on three stages that need your due attention. This template can be used to pitch topics like information, supplies, information, target. In addtion, this PPT design contains high resolution images, graphics, etc, that are easily editable and available for immediate download.
Corporate Audit And Review Team Raci Matrix Icons PDF
This slide indicates roles and responsibilities of corporate audit team. It includes roles like writer, editor, content designer, customer success, product marketing etc. Showcasing this set of slides titled Corporate Audit And Review Team Raci Matrix Icons PDF. The topics addressed in these templates are Management System, Data Protection, Interview Manager. All the content presented in this PPT design is completely editable. Download it and make adjustments in color, background, font etc. as per your unique business setting.
Quantum Key Distribution What Is Quantum Supremacy Icons PDF
This slide defines quantum supremacy and how quantum computers perform faster data processing compared to classic computers. Deliver an awe inspiring pitch with this creative Quantum Key Distribution What Is Quantum Supremacy Icons PDF bundle. Topics like Quantum Computer, Computer Accomplish, Quantum Processor can be discussed with this completely editable template. It is available for immediate download depending on the needs and requirements of the user.
Disaster Recovery Planning In Banking Industry Icons PDF
This slide describes the role of disaster recovery planning in the banking industry and how they are able to perform critical day to day activities through a recovery plan. Deliver and pitch your topic in the best possible manner with this Disaster Recovery Planning In Banking Industry Icons PDF. Use them to share invaluable insights on Data Replication, Business Applications, Systems and impress your audience. This template can be altered and modified as per your expectations. So, grab it now.
Operational Outlook Of Security Awareness Training Software Icons PDF
The purpose of this slide is to showcase the general outlook of cyber security awareness training software. The slide covers information about opened simulations, links clicked, reported, attachments opened, data entered etc. Deliver an awe inspiring pitch with this creative Operational Outlook Of Security Awareness Training Software Icons PDF bundle. Topics like Educate Employees, Dynamic Training, Customized Content can be discussed with this completely editable template. It is available for immediate download depending on the needs and requirements of the user.
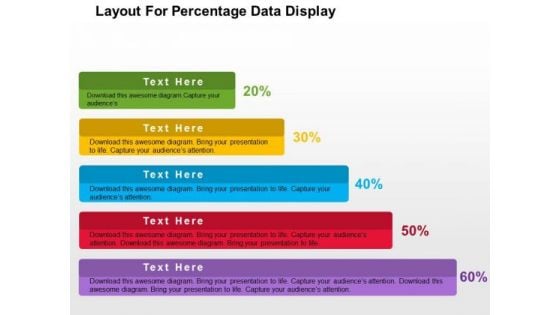
Layout For Precentage Data Display PowerPoint Template
Growth analysis for business can be defined with this business diagram. This slide depicts text boxes in increasing flow. Present your views using this innovative slide and be assured of leaving a lasting impression
Integrated Digital Marketing Strategy Dashboard For Lead Conversion Icons PDF
Following slide illustrates integrated marketing campaign dashboard utilized by organizations to improve business agility and increase operational efficiency. This slide provides data regarding lead conversion by campaign and channel, amount spent per campaign, monthly lead generations, etc. Showcasing this set of slides titled Integrated Digital Marketing Strategy Dashboard For Lead Conversion Icons PDF. The topics addressed in these templates are Total Page Views, Average Session Duration, Conversion. All the content presented in this PPT design is completely editable. Download it and make adjustments in color, background, font etc. as per your unique business setting.
Business Process Redesigning Comparing Business Process Management Software Icons PDF
This slide shows the comparison of business process management software on the basis of cost and features such as data capture, management and analysis, real-time monitoring, easy process modelling, etc. Create an editable Business Process Redesigning Comparing Business Process Management Software Icons PDF that communicates your idea and engages your audience. Whether youre presenting a business or an educational presentation, pre-designed presentation templates help save time. Business Process Redesigning Comparing Business Process Management Software Icons PDF is highly customizable and very easy to edit, covering many different styles from creative to business presentations. Slidegeeks has creative team members who have crafted amazing templates. So, go and get them without any delay.
BI Software Key Features List BI Transformation Toolset Icons PDF
The following slide illustrates the business intelligence suite key attributes such as personalized executive dashboards, location intelligence, and interactive reports. Presenting BI Software Key Features List BI Transformation Toolset Icons PDF to provide visual cues and insights. Share and navigate important information on six stages that need your due attention. This template can be used to pitch topics like Analysis, Personalized Executive Dashboards, Data Layer. In addtion, this PPT design contains high resolution images, graphics, etc, that are easily editable and available for immediate download.
CSR Report On Employees Statistics During Pandemic Icons PDF
This slide illustrates data related to CSR human resources of a corporation. It includes global employees, dough-nut chart of North American employees, global employees by age etc. Showcasing this set of slides titled CSR Report On Employees Statistics During Pandemic Icons PDF. The topics addressed in these templates are Global Employees, Supporting Workforce Transformation, Employees Statistics During Pandemic. All the content presented in this PPT design is completely editable. Download it and make adjustments in color, background, font etc. as per your unique business setting.
B2B Content Marketing Latest Trend Analysis Statistical Icons PDF
This slide shows the graph representing the statistical data related to latest trends emerging in the field of content marketing. It includes trends such as blog posts, email newsletters, case studies, videos, virtual events, infographics etc. Deliver an awe inspiring pitch with this creative B2B Content Marketing Latest Trend Analysis Statistical Icons PDF bundle. Topics like B2b Content Marketing, Latest Trend Analysis Statistical can be discussed with this completely editable template. It is available for immediate download depending on the needs and requirements of the user.
Airtable Capital Funding Pitch Deck Competitive Analysis Icons PDF
This slide covers competitive analysis of cloud database platform for creating and sharing relation data and build up teams to ease workflows. It involves major companies along with its revenue. Boost your pitch with our creative Airtable Capital Funding Pitch Deck Competitive Analysis Icons PDF. Deliver an awe-inspiring pitch that will mesmerize everyone. Using these presentation templates you will surely catch everyones attention. You can browse the ppts collection on our website. We have researchers who are experts at creating the right content for the templates. So you do not have to invest time in any additional work. Just grab the template now and use them.
Comparative Assessment Of Software To Reduce Financial Challenges Icons PDF
Following slide demonstrates financial software comparative analysis conducted by managers to determine best tools for overcoming financial challenges. It includes key elements such as software solutions, financial pain points, rating, pricing and comments. Showcasing this set of slides titled Comparative Assessment Of Software To Reduce Financial Challenges Icons PDF. The topics addressed in these templates are Data Management, Financial Reporting, Financial Planning, Cash Flow Projection. All the content presented in this PPT design is completely editable. Download it and make adjustments in color, background, font etc. as per your unique business setting.
Kpis For Tracking Fleet Information Effectively Icons PDF
This slide showcases factors which fleet data needs to keep track of. This template focuses on increasing uptime and improving conditions for their mobile workforce. It includes information related to vehicle performance, safety behaviour, etc. Persuade your audience using this Kpis For Tracking Fleet Information Effectively Icons PDF. This PPT design covers four stages, thus making it a great tool to use. It also caters to a variety of topics including Predictive Safety Behavior, Vehicle Performance, Inspection Maintenance. Download this PPT design now to present a convincing pitch that not only emphasizes the topic but also showcases your presentation skills.
Biomarker Categorization Roadmap For Digital Biomarkers Development Icons PDF
This slide depicts the roadmap for digital biomarkers development, including gathering detailed patient reports, using neural networks to improve interaction and including AI in data collecting, adding participant-reported health information, and so on. Are you searching for a Biomarker Categorization Roadmap For Digital Biomarkers Development Icons PDF that is uncluttered, straightforward, and original Its easy to edit, and you can change the colors to suit your personal or business branding. For a presentation that expresses how much effort you have put in, this template is ideal. With all of its features, including tables, diagrams, statistics, and lists, its perfect for a business plan presentation. Make your ideas more appealing with these professional slides. Download Biomarker Categorization Roadmap For Digital Biomarkers Development Icons PDF from Slidegeeks today.
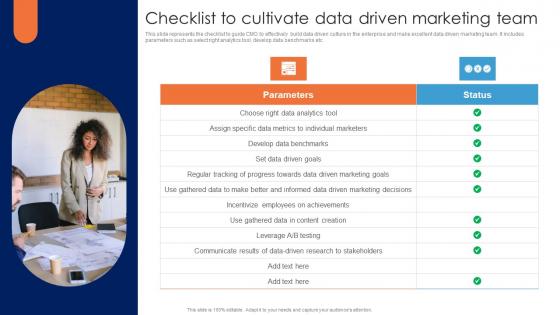
Checklist To Cultivate Data Driven Marketing Guide For Data Driven Advertising Diagrams Pdf
This slide represents the checklist to guide CMO to effectively build data driven culture in the enterprise and make excellent data driven marketing team. It includes parameters such as select right analytics tool, develop data benchmarks etc.Formulating a presentation can take up a lot of effort and time, so the content and message should always be the primary focus. The visuals of the PowerPoint can enhance the presenters message, so our Checklist To Cultivate Data Driven Marketing Guide For Data Driven Advertising Diagrams Pdf was created to help save time. Instead of worrying about the design, the presenter can concentrate on the message while our designers work on creating the ideal templates for whatever situation is needed. Slidegeeks has experts for everything from amazing designs to valuable content, we have put everything into Checklist To Cultivate Data Driven Marketing Guide For Data Driven Advertising Diagrams Pdf This slide represents the checklist to guide CMO to effectively build data driven culture in the enterprise and make excellent data driven marketing team. It includes parameters such as select right analytics tool, develop data benchmarks etc.
Techniques Used For App Mapping In Organization Icons PDF
This slide explains various techniques to help IT teams map interactions and relationships between software applications. It includes details about SNMP, active probing and route analytics. Persuade your audience using this Techniques Used For App Mapping In Organization Icons PDF. This PPT design covers three stages, thus making it a great tool to use. It also caters to a variety of topics including Simple Network Management Protocol, Active Probing, Route Analytics. Download this PPT design now to present a convincing pitch that not only emphasizes the topic but also showcases your presentation skills.
Customer Experience Design Roadmap Ppt Professional Icons PDF
Lay out all the measures for improved customer experience CX with a timeline to keep a track of the progress and implementation.Deliver an awe-inspiring pitch with this creative customer experience design roadmap ppt professional icons pdf. bundle. Topics like business intelligent and web analytics, content management, system user experience can be discussed with this completely editable template. It is available for immediate download depending on the needs and requirements of the user.
Evaluating Competitor Website To Understand Web Traffic Icons PDF
The following slide outlines analyzing the website of most profitable real estate company across globe. The slide covers information about home page, key observations, and website analytics. Present like a pro with Evaluating Competitor Website To Understand Web Traffic Icons PDF Create beautiful presentations together with your team, using our easy-to-use presentation slides. Share your ideas in real-time and make changes on the fly by downloading our templates. So whether you are in the office, on the go, or in a remote location, you can stay in sync with your team and present your ideas with confidence. With Slidegeeks presentation got a whole lot easier. Grab these presentations today.
Client Onboarding Plan Saas Company Customer Onboarding Strategies Icons PDF
This slide provides an overview of the tactics used by SaaS firms for onboarding. Major strategies covered are aligning tasks of various departments, tracking analytics, creating customer persona and personalizing content. Do you have to make sure that everyone on your team knows about any specific topic I yes, then you should give Client Onboarding Plan Saas Company Customer Onboarding Strategies Icons PDF a try. Our experts have put a lot of knowledge and effort into creating this impeccable Client Onboarding Plan Saas Company Customer Onboarding Strategies Icons PDF. You can use this template for your upcoming presentations, as the slides are perfect to represent even the tiniest detail. You can download these templates from the Slidegeeks website and these are easy to edit. So grab these today
Best Practices For Advertising Campaign Managers Icons PDF
This slide depicts the best practices to be adopted by marketers for conducting marketing campaigns to capture audience attention. The best practices covered are defining the brand message, choosing the right management tools, empowering the team and measuring analytics. Are you searching for a Best Practices For Advertising Campaign Managers Icons PDF that is uncluttered, straightforward, and original Its easy to edit, and you can change the colors to suit your personal or business branding. For a presentation that expresses how much effort you have put in, this template is ideal With all of its features, including tables, diagrams, statistics, and lists, its perfect for a business plan presentation. Make your ideas more appealing with these professional slides. Download Best Practices For Advertising Campaign Managers Icons PDF from Slidegeeks today.
Web Hosting Software Company Outline Salesforce Products Icons PDF
This slide highlights the products offering of salesforce which includes sales cloud, service cloud, marketing cloud, commerce cloud, quip, salesforce platform, CRM analytics, experience cloud and work.com. Are you searching for a Web Hosting Software Company Outline Salesforce Products Icons PDF that is uncluttered, straightforward, and original Its easy to edit, and you can change the colors to suit your personal or business branding. For a presentation that expresses how much effort you have put in, this template is ideal. With all of its features, including tables, diagrams, statistics, and lists, its perfect for a business plan presentation. Make your ideas more appealing with these professional slides. Download Web Hosting Software Company Outline Salesforce Products Icons PDF from Slidegeeks today.
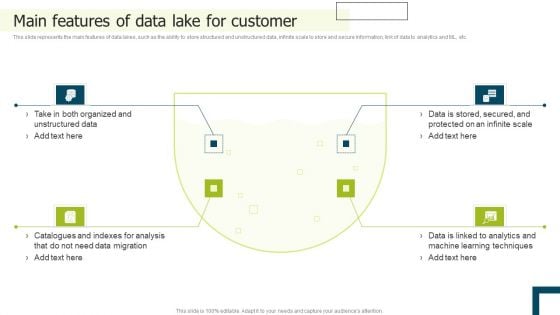
Data Lake Implementation Main Features Of Data Lake For Customer Information PDF
This slide represents the main features of data lakes, such as the ability to store structured and unstructured data, infinite scale to store and secure information, link of data to analytics and ML, etc. Are you searching for a Data Lake Implementation Main Features Of Data Lake For Customer Information PDF that is uncluttered, straightforward, and original Its easy to edit, and you can change the colors to suit your personal or business branding. For a presentation that expresses how much effort youve put in, this template is ideal With all of its features, including tables, diagrams, statistics, and lists, its perfect for a business plan presentation. Make your ideas more appealing with these professional slides. Download Data Lake Implementation Main Features Of Data Lake For Customer Information PDF from Slidegeeks today.
Web Design Learning And Improvement KPI Dashboard Icons Pdf
This slide provides glimpse about facts and figures related to workforce training sessions on website and application development. It includes hours spent, performance, leaderboard, etc. Showcasing this set of slides titled Web Design Learning And Improvement KPI Dashboard Icons Pdf. The topics addressed in these templates are Web Design Learning, Improvement KPI Dashboard, Performance, Leaderboard. All the content presented in this PPT design is completely editable. Download it and make adjustments in color, background, font etc. as per your unique business setting. This slide provides glimpse about facts and figures related to workforce training sessions on website and application development. It includes hours spent, performance, leaderboard, etc.
Swot Analysis Web Designing Platform Fundraising Pitch Deck Icons Pdf
The Swot Analysis Web Designing Platform Fundraising Pitch Deck Icons Pdf is a compilation of the most recent design trends as a series of slides. It is suitable for any subject or industry presentation, containing attractive visuals and photo spots for businesses to clearly express their messages. This template contains a variety of slides for the user to input data, such as structures to contrast two elements, bullet points, and slides for written information. Slidegeeks is prepared to create an impression. Our Swot Analysis Web Designing Platform Fundraising Pitch Deck Icons Pdf are topically designed to provide an attractive backdrop to any subject. Use them to look like a presentation pro.
Track Employee Training Plan KPI Dashboard Icons Pdf
Following slide shows KPI dashboard for tracking employee training plans which help in analyzing where the organization lagging behind in skill development program. It includes the KPI such as training status, budget allocation, monthly cost incurred, etc. Showcasing this set of slides titled Track Employee Training Plan KPI Dashboard Icons Pdf The topics addressed in these templates are Monthly Dashboard, Budget Allocation, Remaining All the content presented in this PPT design is completely editable. Download it and make adjustments in color, background, font etc. as per your unique business setting. Following slide shows KPI dashboard for tracking employee training plans which help in analyzing where the organization lagging behind in skill development program. It includes the KPI such as training status, budget allocation, monthly cost incurred, etc.
Strategic Brand Management KPI Dashboard To Monitor Icons Pdf
Mentioned slide shows the KPI dashboard that can be used to track win and lost sales opportunities. It includes metrics namely won opportunities, lost opportunities, pipeline by territory, total opportunities. This Strategic Brand Management KPI Dashboard To Monitor Icons Pdf from Slidegeeks makes it easy to present information on your topic with precision. It provides customization options, so you can make changes to the colors, design, graphics, or any other component to create a unique layout. It is also available for immediate download, so you can begin using it right away. Slidegeeks has done good research to ensure that you have everything you need to make your presentation stand out. Make a name out there for a brilliant performance. Mentioned slide shows the KPI dashboard that can be used to track win and lost sales opportunities. It includes metrics namely won opportunities, lost opportunities, pipeline by territory, total opportunities.
Nps Reports And Dashboard Icons Slide Ppt Outline Samples PDF
Presenting our innovatively structured nps reports and dashboard icons slide ppt outline samples pdf set of slides. The slides contain a hundred percent editable icons. You can replace these icons without any inconvenience. Therefore, pick this set of slides and create a striking presentation.
Customer Relationship Management Dashboard CRM Application Dashboard Quarter Icons PDF
This graph or chart is linked to excel, and changes automatically based on data. Just left click on it and select Edit Data.Deliver and pitch your topic in the best possible manner with this customer relationship management dashboard crm application dashboard quarter icons pdf. Use them to share invaluable insights on marketing funnel all time, opportunity generation by quarter, active prospects, new prospects, new opportunities and impress your audience. This template can be altered and modified as per your expectations. So, grab it now.
Kpis And Dashboards Vector Icons Ppt Powerpoint Presentation Infographics Outline
This is a kpis and dashboards vector icons ppt powerpoint presentation infographics outline. This is a eight stage process. The stages in this process are dashboard, kpi, metrics.
Cybernetics Implant Performance Tracking Dashboard Cybernetic Integration Icons Pdf
This slide shows the Cybernetics implant performance tracking dashboard. The purpose of this slide is to represent the Information related to the status of Cybernetics implant graphically. Presenting this PowerPoint presentation, titled Cybernetics Implant Performance Tracking Dashboard Cybernetic Integration Icons Pdf with topics curated by our researchers after extensive research. This editable presentation is available for immediate download and provides attractive features when used. Download now and captivate your audience. Presenting this Cybernetics Implant Performance Tracking Dashboard Cybernetic Integration Icons Pdf Our researchers have carefully researched and created these slides with all aspects taken into consideration. This is a completely customizable Cybernetics Implant Performance Tracking Dashboard Cybernetic Integration Icons Pdf that is available for immediate downloading. Download now and make an impact on your audience. Highlight the attractive features available with our PPTs. This slide shows the Cybernetics implant performance tracking dashboard. The purpose of this slide is to represent the Information related to the status of Cybernetics implant graphically.
Fuel Indicator Vector Icons Ppt PowerPoint Presentation File Example File
This is a fuel indicator vector icons ppt powerpoint presentation file example file. This is a three stage process. The stages in this process are fuel gauge, gas gauge, fuel containers.
Content Performance Tracking Dashboard Social Media Platforms Performance Icons Pdf
This slide indicates the content performance tracking dashboard for social media channels providing information regarding the total number of posts, engagement rate, audience sentiments and multiple hashtags performance.Create an editable Content Performance Tracking Dashboard Social Media Platforms Performance Icons Pdf that communicates your idea and engages your audience. Whether you are presenting a business or an educational presentation, pre-designed presentation templates help save time. Content Performance Tracking Dashboard Social Media Platforms Performance Icons Pdf is highly customizable and very easy to edit, covering many different styles from creative to business presentations. Slidegeeks has creative team members who have crafted amazing templates. So, go and get them without any delay. This slide indicates the content performance tracking dashboard for social media channels providing information regarding the total number of posts, engagement rate, audience sentiments and multiple hashtags performance.
Rating Scale To Measure Customer Credit Score Icons PDF
Showcasing this set of slides titled rating scale to measure customer credit score icons pdf. The topics addressed in these templates are rating scale to measure customer credit score. All the content presented in this PPT design is completely editable. Download it and make adjustments in color, background, font etc. as per your unique business setting.
Measuring Influencer Marketing ROI Marketing Dashboard Ppt Professional Icons PDF
Presenting measuring influencer marketing roi marketing dashboard ppt professional icons pdf to provide visual cues and insights. Share and navigate important information on one stage that need your due attention. This template can be used to pitch topics like marketing dashboard. In addition, this PPT design contains high-resolution images, graphics, etc, that are easily editable and available for immediate download.
Ad Word Marketing Strategic Guide For Marketing Program Icons Pdf
This slide showcases a dashboard for managing ad word campaign to assists marketers in optimizing their ads and PPC performance. It highlights element such as sessions, users, page view per sessions, average time on page, conversions, date period, goals completion and top acquisition channels. Create an editable Ad Word Marketing Strategic Guide For Marketing Program Icons Pdf that communicates your idea and engages your audience. Whether you are presenting a business or an educational presentation, pre designed presentation templates help save time. Ad Word Marketing Strategic Guide For Marketing Program Icons Pdf is highly customizable and very easy to edit, covering many different styles from creative to business presentations. Slidegeeks has creative team members who have crafted amazing templates. So, go and get them without any delay. This slide showcases a dashboard for managing ad word campaign to assists marketers in optimizing their ads and PPC performance. It highlights element such as sessions, users, page view per sessions, average time on page, conversions, date period, goals completion and top acquisition channels.
Metric Dashboard Showcasing Implementation Of Digital Advertising Strategies Icons Pdf
This slide represents brand promotion dashboard highlighting performance post digital marketing. It includes sales quantity, return quantity, cost of goods, return amount etc. Get a simple yet stunning designed Metric Dashboard Showcasing Implementation Of Digital Advertising Strategies Icons Pdf. It is the best one to establish the tone in your meetings. It is an excellent way to make your presentations highly effective. So, download this PPT today from Slidegeeks and see the positive impacts. Our easy to edit Metric Dashboard Showcasing Implementation Of Digital Advertising Strategies Icons Pdf can be your go to option for all upcoming conferences and meetings. So, what are you waiting for Grab this template today. This slide represents brand promotion dashboard highlighting performance post digital marketing. It includes sales quantity, return quantity, cost of goods, return amount etc.
Deal Assessment Audit Process Customer Satisfaction Icons PDF
Presenting deal assessment audit process customer satisfaction icons pdf to provide visual cues and insights. Share and navigate important information on three stages that need your due attention. This template can be used to pitch topics like overall satisfaction with service, satisfaction with value for money, overall satisfaction with relationship. In addition, this PPT design contains high-resolution images, graphics, etc, that are easily editable and available for immediate download.
Projection Model Random Forest Technique For Classification Model Icons PDF
This slide represents the random forest technique to implement a classification model that simultaneously works on individual subsets of sample data. It also includes its working and benefits, including multiple input handling, overfitting resistance, and so on. Get a simple yet stunning designed Projection Model Random Forest Technique For Classification Model Icons PDF. It is the best one to establish the tone in your meetings. It is an excellent way to make your presentations highly effective. So, download this PPT today from Slidegeeks and see the positive impacts. Our easy-to-edit Projection Model Random Forest Technique For Classification Model Icons PDF can be your go-to option for all upcoming conferences and meetings. So, what are you waiting for Grab this template today.
Steps To Conduct Staff Skills Gap Analysis Icons PDF
The slide highlights a process to perform team gap analysis for upgrading required skills in the employees. Various steps included are define the type of analysis, outline job roles, identify skills for each role, evaluate current skills, etc. Presenting Steps To Conduct Staff Skills Gap Analysis Icons PDF to dispense important information. This template comprises Seven stages. It also presents valuable insights into the topics including Evaluate Current Skills, Outline Job Roles, Analyse Data. This is a completely customizable PowerPoint theme that can be put to use immediately. So, download it and address the topic impactfully.
Sales Pipeline Analysis Tracking Through Dashboard Icons PDF
Showcasing this set of slides titled sales pipeline analysis tracking through dashboard icons pdf. The topics addressed in these templates are sales pipeline analysis tracking through dashboard. All the content presented in this PPT design is completely editable. Download it and make adjustments in color, background, font etc. as per your unique business setting.
Content Marketing Freelance Metrics Dashboard With Visitor Demographics Icons PDF
Showcasing this set of slides titled Content Marketing Freelance Metrics Dashboard With Visitor Demographics Icons PDF. The topics addressed in these templates are Content Level Metrics, Revenue Generated, Visitor Demographics. All the content presented in this PPT design is completely editable. Download it and make adjustments in color, background, font etc. as per your unique business setting.
Application Performance Dashboard Mobile App Development Advertising Service Icons Pdf
This slide covers application performance in market KPIs and metrics such as impressions, clicks, searches for app, conversion rate etc. Find a pre designed and impeccable Application Performance Dashboard Mobile App Development Advertising Service Icons Pdf. The templates can ace your presentation without additional effort. You can download these easy to edit presentation templates to make your presentation stand out from others. So, what are you waiting for Download the template from Slidegeeks today and give a unique touch to your presentation. This slide covers application performance in market KPIs and metrics such as impressions, clicks, searches for app, conversion rate etc.
Outpatient And Inpatients Trend In Medical Dashboard Icons PDF
Pitch your topic with ease and precision using this Outpatient And Inpatients Trend In Medical Dashboard Icons PDF. This layout presents information on Outpatient And Inpatients Trend In Medical Dashboard. It is also available for immediate download and adjustment. So, changes can be made in the color, design, graphics or any other component to create a unique layout.
Information Technology Transformation Organization Inventory Dashboard Icons PDF
Following slide shows inventory management dashboard. It includes the status of total inventories along with information on how much was received, on hold and shipped. Deliver and pitch your topic in the best possible manner with this information technology transformation organization inventory dashboard icons pdf. Use them to share invaluable insights on inventory dashboard and impress your audience. This template can be altered and modified as per your expectations. So, grab it now.
Sales Dashboard With Numbers To Measure Company Performance Icons PDF
Showcasing this set of slides titled Sales Dashboard With Numbers To Measure Company Performance Icons PDF. The topics addressed in these templates are Marketing, Sales, Revenue. All the content presented in this PPT design is completely editable. Download it and make adjustments in color, background, font etc. as per your unique business setting.
Dashboard For Cash Flow And Financial KPI Ratio Icons PDF
Showcasing this set of slides titled Dashboard For Cash Flow And Financial KPI Ratio Icons PDF. The topics addressed in these templates are Days Sales Outstanding, Days Payable Outstanding, Return On Assets. All the content presented in this PPT design is completely editable. Download it and make adjustments in color, background, font etc. as per your unique business setting.
Transformation KPI Dashboard With Key Metrics And Status Icons PDF
Pitch your topic with ease and precision using this Transformation KPI Dashboard With Key Metrics And Status Icons PDF. This layout presents information on Measure, System Implemented, Innovation. It is also available for immediate download and adjustment. So, changes can be made in the color, design, graphics or any other component to create a unique layout.
Physical Trainer Employee Health Fitness Dashboard Miles Icons PDF
Presenting this set of slides with name physical trainer employee health fitness dashboard miles icons pdf. The topics discussed in these slide is employee health fitness dashboard. This is a completely editable PowerPoint presentation and is available for immediate download. Download now and impress your audience.
Selling Home Property Dashboard Ppt Pictures Icons PDF
Deliver and pitch your topic in the best possible manner with this selling home property dashboard ppt pictures icons pdf. Use them to share invaluable insights on dashboard and impress your audience. This template can be altered and modified as per your expectations. So, grab it now.
Business To Business Advertising Proposal KPI Dashboard Icons PDF
Deliver and pitch your topic in the best possible manner with this business to business advertising proposal kpi dashboard icons pdf. Use them to share invaluable insights on kpi dashboard and impress your audience. This template can be altered and modified as per your expectations. So, grab it now.
Commodity Unique Selling Proposition Online Marketing Dashboard Icons PDF
Show your highlights of your online marketing campaign through our dashboard. Deliver an awe inspiring pitch with this creative commodity unique selling proposition online marketing dashboard icons pdf bundle. Topics like sales, revenue, customers can be discussed with this completely editable template. It is available for immediate download depending on the needs and requirements of the user.
Implementing Marketing Strategies Content Marketing Dashboard For Effective Icons PDF
Purpose of the following slide is to show key metrics that can help the organization to track their content marketing efforts, these metrics are ad cost, visits, cost per click etc.. Whether you have daily or monthly meetings, a brilliant presentation is necessary. Implementing Marketing Strategies Content Marketing Dashboard For Effective Icons PDF can be your best option for delivering a presentation. Represent everything in detail using Implementing Marketing Strategies Content Marketing Dashboard For Effective Icons PDF and make yourself stand out in meetings. The template is versatile and follows a structure that will cater to your requirements. All the templates prepared by Slidegeeks are easy to download and edit. Our research experts have taken care of the corporate themes as well. So, give it a try and see the results.
Customer Attrition In A Bpo - Dashboard Icons PDF
Deliver an awe-inspiring pitch with this creative customer attrition in a bpo - dashboard icons pdf. bundle. Topics like web chart performance, telecom churn overview metrics, customer care call performance, telecom churn overview metrics, monthly revenue lost can be discussed with this completely editable template. It is available for immediate download depending on the needs and requirements of the user.
Phone Tutoring Initiative Dashboard Ppt Infographics Icons PDF
Presenting this set of slides with name phone tutoring initiative dashboard ppt infographics icons pdf. The topics discussed in these slides are low, medium, high. This is a completely editable PowerPoint presentation and is available for immediate download. Download now and impress your audience.
Human Resource Metrics Dashboard Ppt PowerPoint Presentation Layouts Icons PDF
Presenting this set of slides with name human resource metrics dashboard ppt powerpoint presentation layouts icons pdf. The topics discussed in these slide is total applicants, shortlisted candidates, hired candidates, rejected candidates, time to hire, cost to hire. This is a completely editable PowerPoint presentation and is available for immediate download. Download now and impress your audience.
Tracking Energy Consumption KPI Dashboard Delivery Ppt Summary Icons PDF
Deliver an awe inspiring pitch with this creative tracking energy consumption kpi dashboard delivery ppt summary icons pdf bundle. Topics like performance ratio, project delivery, availability factor, savings, production can be discussed with this completely editable template. It is available for immediate download depending on the needs and requirements of the user.
Hotel Management Plan Hospitality Management KPI Dashboard Number Icons PDF
Deliver an awe inspiring pitch with this creative hotel management plan hospitality management kpi dashboard number icons pdf bundle. Topics like recurrent events, average, cost, target can be discussed with this completely editable template. It is available for immediate download depending on the needs and requirements of the user.
Enterprise Management Business Management Dashboards Sales Icons PDF
Deliver and pitch your topic in the best possible manner with this enterprise management business management dashboards sales icons pdf. Use them to share invaluable insights on revenue, customers by region, new customers signups, sales by product category, profit margin and impress your audience. This template can be altered and modified as per your expectations. So, grab it now.
Infrastructure KPI Dashboard Showing Resource Allocation Icons PDF
Deliver an awe-inspiring pitch with this creative infrastructure kpi dashboard showing resource allocation icons pdf bundle. Topics like project financial, resource allocation, delivery timeline, resources can be discussed with this completely editable template. It is available for immediate download depending on the needs and requirements of the user.
Dashboards Key Metrics Of Performance Assessment Icons PDF
Deliver an awe-inspiring pitch with this creative dashboards key metrics of performance assessment icons pdf bundle. Topics like availability, performance, maintenance, delivery adherence, customer complaints can be discussed with this completely editable template. It is available for immediate download depending on the needs and requirements of the user.
Project Administration Bundle Dashboard For Project Budget Tracking Icons PDF
Deliver and pitch your topic in the best possible manner with this Project Administration Bundle Dashboard For Project Budget Tracking Icons PDF. Use them to share invaluable insights on Actual Cost, Planned Cost, Value Difference and impress your audience. This template can be altered and modified as per your expectations. So, grab it now.
Five Years Sales Projection And Analysis Dashboard Icons PDF
This slide defines the dashboard for five years sales forecast and analysis . It includes information related to the estimated and actual sales. Pitch your topic with ease and precision using this Five Years Sales Projection And Analysis Dashboard Icons PDF. This layout presents information on Forecast Value, Forecast Accuracy, Won Opportunities. It is also available for immediate download and adjustment. So, changes can be made in the color, design, graphics or any other component to create a unique layout.
KPI Dashboard Showcasing Product Management Project Completion Status Icons PDF
Persuade your audience using this KPI Dashboard Showcasing Product Management Project Completion Status Icons PDF. This PPT design covers three stages, thus making it a great tool to use. It also caters to a variety of topics including KPI Dashboard Showcasing, Product Management, Project Completion Status . Download this PPT design now to present a convincing pitch that not only emphasizes the topic but also showcases your presentation skills.
Cost And Purchase Order Procurement Dashboard Icons PDF
This slide provides an overview of the cost and purchase order-related performance indicators to improve efficiency and optimize processes. The dashboard includes the cost of the purchase order, cost reduction, savings, procurement ROI and top 5 suppliers. If you are looking for a format to display your unique thoughts, then the professionally designed Cost And Purchase Order Procurement Dashboard Icons PDF is the one for you. You can use it as a Google Slides template or a PowerPoint template. Incorporate impressive visuals, symbols, images, and other charts. Modify or reorganize the text boxes as you desire. Experiment with shade schemes and font pairings. Alter, share or cooperate with other people on your work. Download Cost And Purchase Order Procurement Dashboard Icons PDF and find out how to give a successful presentation. Present a perfect display to your team and make your presentation unforgettable.
Organizational Plan Overview Corporate Financial Performance Tracking Dashboard Icons PDF
This slide provides information regarding dashboard utilized by firm to monitor financial performance. The performance is tracked through revenues generated, vendors associated, profit generated, etc. Here you can discover an assortment of the finest PowerPoint and Google Slides templates. With these templates, you can create presentations for a variety of purposes while simultaneously providing your audience with an eye-catching visual experience. Download Organizational Plan Overview Corporate Financial Performance Tracking Dashboard Icons PDF to deliver an impeccable presentation. These templates will make your job of preparing presentations much quicker, yet still, maintain a high level of quality. Slidegeeks has experienced researchers who prepare these templates and write high-quality content for you. Later on, you can personalize the content by editing the Organizational Plan Overview Corporate Financial Performance Tracking Dashboard Icons PDF.
Digital Insurance Dashboard With Enrollment Status Icons PDF
This slide illustrates digital insurance dashboard with customer enrollment status. It provides information about revenue, enrollment by age, enrollment level, etc. Showcasing this set of slides titled Digital Insurance Dashboard With Enrollment Status Icons PDF. The topics addressed in these templates are Digital Insurance Dashboard With Enrollment Status. All the content presented in this PPT design is completely editable. Download it and make adjustments in color, background, font etc. as per your unique business setting.
HR Dashboard Indicating Weekly Professional Counselling Kpis Icons PDF
This slide illustrates HR career counselling dashboard. It provides information about hours of consultation, satisfaction rate, per consultant rate, popular counselors, etc. Showcasing this set of slides titled HR Dashboard Indicating Weekly Professional Counselling Kpis Icons PDF. The topics addressed in these templates are Specialization, Hours Of Consultation, Popular Counselors. All the content presented in this PPT design is completely editable. Download it and make adjustments in color, background, font etc. as per your unique business setting.
Online Business Simulation Dashboard For Practicing Marketing Strategies Icons PDF
This slide shows business simulation dashboard for strengthening marketing strategy practice. It provides information about marketing mix, budget, product allocation, time allocation, etc. Showcasing this set of slides titled Online Business Simulation Dashboard For Practicing Marketing Strategies Icons PDF. The topics addressed in these templates are Marketing Budget, Product Allocation, Marketing Team Size. All the content presented in this PPT design is completely editable. Download it and make adjustments in color, background, font etc. as per your unique business setting.
Stock Inventory Acquisition Dashboard For Managing Warehouse Operations Icons PDF
This slide showcases dashboard that can help organization to manage and track the warehouse operations. Its key elements are order, volume, inventory, monthly KPIs and global financial performance. Explore a selection of the finest Stock Inventory Acquisition Dashboard For Managing Warehouse Operations Icons PDF here. With a plethora of professionally designed and pre-made slide templates, you can quickly and easily find the right one for your upcoming presentation. You can use our Stock Inventory Acquisition Dashboard For Managing Warehouse Operations Icons PDF to effectively convey your message to a wider audience. Slidegeeks has done a lot of research before preparing these presentation templates. The content can be personalized and the slides are highly editable. Grab templates today from Slidegeeks.
Work From Home Performance Management Dashboard Icons PDF
The following slide outlines a comprehensive key performance indicator KPI dashboard that can be used to showcase employees performance during work from home WFH. Information covered in this slide is related to average result area scores etc. Do you have to make sure that everyone on your team knows about any specific topic. I yes, then you should give Work From Home Performance Management Dashboard Icons PDF a try. Our experts have put a lot of knowledge and effort into creating this impeccable Work From Home Performance Management Dashboard Icons PDF. You can use this template for your upcoming presentations, as the slides are perfect to represent even the tiniest detail. You can download these templates from the Slidegeeks website and these are easy to edit. So grab these today.
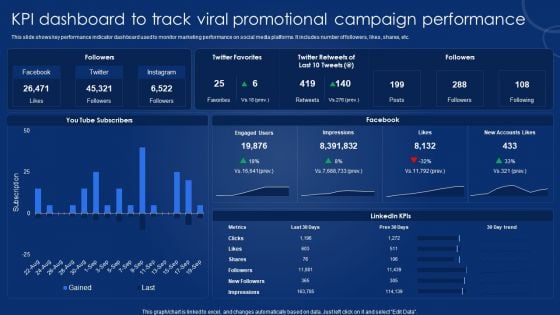
KPI Dashboard To Track Viral Promotional Campaign Performance Icons PDF
IT Security Risk Management And Incident Management Dashboard Icons PDF
This slide displays dashboard to help company in designing initiatives to mitigate cybersecurity risks. It includes kpis such as incident management, patches, compliance, vulnerabilities, etc. Showcasing this set of slides titled IT Security Risk Management And Incident Management Dashboard Icons PDF. The topics addressed in these templates are Compliance, Patches, Incident Management, Vulnerabilities Management, Cybersecurity Initiatives. All the content presented in this PPT design is completely editable. Download it and make adjustments in color, background, font etc. as per your unique business setting.
Intelligent Architecture Table Of Contents Intelligent Architecture Icons PDF
Deliver an awe inspiring pitch with this creative intelligent architecture table of contents intelligent architecture icons pdf bundle. Topics like dashboards, business case, organizations, intelligent infrastructure overview can be discussed with this completely editable template. It is available for immediate download depending on the needs and requirements of the user.
Marketing And Operation KPI Dashboard To Increase Efficiency Icons PDF
This slide covers sales and operations KPI dashboard to increase efficiency. It involves performance, increase in profit, target, monthly profit and quarterly revenue trend. Pitch your topic with ease and precision using this Marketing And Operation KPI Dashboard To Increase Efficiency Icons PDF. This layout presents information on Profit By Monthly, Target, Performance. It is also available for immediate download and adjustment. So, changes can be made in the color, design, graphics or any other component to create a unique layout.
Stock Requirement Plan Dashboard With Inventory Management Icons PDF
The following slide highlights the material requirement planning dashboard with inventory management, It illustrates business overview, inventory management, product sale by region, debtor summary and transaction. Pitch your topic with ease and precision using this Stock Requirement Plan Dashboard With Inventory Management Icons PDF. This layout presents information on Transaction, Debtor Summary, Business Overview. It is also available for immediate download and adjustment. So, changes can be made in the color, design, graphics or any other component to create a unique layout.
Scrum Master Dashboard For Project Management Priority Icons PDF
This slide provides information regarding scrum master dashboard for project management to track overall project progress. Deliver an awe-inspiring pitch with this creative scrum master dashboard for project management priority icons pdf bundle. Topics like projects, key resources, marketing sight, sales pipeline, forecast can be discussed with this completely editable template. It is available for immediate download depending on the needs and requirements of the user.
Devops Frequency And Deployment Performance Dashboard Icons PDF
This template covers DevOps deployment, change in value, lead time customer ticket software performance indicators. Presenting devops frequency and deployment performance dashboard icons pdf to provide visual cues and insights. Share and navigate important information on nine stages that need your due attention. This template can be used to pitch topics like customer, performance. In addtion, this PPT design contains high resolution images, graphics, etc, that are easily editable and available for immediate download.
Social Media Campaign Strategic Guide For Marketing Program Icons Pdf
This slide showcases a dashboard for managing ad social media campaign to assists marketers in tracking success of ads, content engagement and reach. It highlights element such as date period, goals completion all, goals conversion rate, target progress bar, users, sessions, etc. Do you have an important presentation coming up Are you looking for something that will make your presentation stand out from the rest Look no further than Social Media Campaign Strategic Guide For Marketing Program Icons Pdf. With our professional designs, you can trust that your presentation will pop and make delivering it a smooth process. And with Slidegeeks, you can trust that your presentation will be unique and memorable. So why wait Grab Social Media Campaign Strategic Guide For Marketing Program Icons Pdf today and make your presentation stand out from the rest. This slide showcases a dashboard for managing ad social media campaign to assists marketers in tracking success of ads, content engagement and reach. It highlights element such as date period, goals completion all, goals conversion rate, target progress bar, users, sessions, etc.
Generate Digitalization Roadmap For Business Icons Slide Inspiration PDF
Help your business to create an attention grabbing presentation using our generate digitalization roadmap for business digital vitality dashboard diagrams pdf set of slides. The slide contains innovative icons that can be flexibly edited. Choose this generate digitalization roadmap for business digital vitality dashboard diagrams pdf template to create a satisfactory experience for your customers. Go ahead and click the download button.
Dashboard Tracking Warehouse Capacity And Utilization Metrics Icons PDF
This slide represents a dashboard providing an enterprise-level view of warehouse capacity and utilization to enable process improvements. It monitors KPIs such as shelf capacity used by inventory type, storage device, honeycomb percentage, days on hand by inventory type, and by items. Create an editable Dashboard Tracking Warehouse Capacity And Utilization Metrics Icons PDF that communicates your idea and engages your audience. Whether you are presenting a business or an educational presentation, pre-designed presentation templates help save time. Dashboard Tracking Warehouse Capacity And Utilization Metrics Icons PDF is highly customizable and very easy to edit, covering many different styles from creative to business presentations. Slidegeeks has creative team members who have crafted amazing templates. So, go and get them without any delay.
Employee Grievance Handling Process Complaint Call Handling Dashboard Icons PDF
This slide covers the dashboard for call details including KPIs such as total calls, average answered speed, abandon rate, average calls per minute and call resolution. Deliver an awe-inspiring pitch with this creative employee grievance handling process complaint call handling dashboard icons pdf bundle. Topics like complaint call handling dashboard can be discussed with this completely editable template. It is available for immediate download depending on the needs and requirements of the user.
Customer Complaint Handling Process Complaint Call Handling Dashboard Icons PDF
This slide covers the dashboard for call details including KPIs such as total calls, average answered speed, abandon rate, average calls per minute and call resolution. Deliver an awe inspiring pitch with this creative customer complaint handling process complaint call handling dashboard icons pdf bundle. Topics like complaint call handling dashboard can be discussed with this completely editable template. It is available for immediate download depending on the needs and requirements of the user.
Dashboard Related To Construction Management Sector Icons PDF
This slide shows the dashboard or KPI related to construction management which includes construction by region, currency, total projects, project status, project details, etc.Deliver an awe inspiring pitch with this creative dashboard related to construction management sector icons pdf bundle. Topics like dashboard related to construction management can be discussed with this completely editable template. It is available for immediate download depending on the needs and requirements of the user.
CRM Implementation Strategy CRM Implementation Dashboard With Customer Icons PDF
This slide showcases the dashboard for CRM which includes the revenue, marketing expenses, satisfaction rate, conversion funnel, tickets volume by priority, and expected sales this year.Deliver an awe inspiring pitch with this creative CRM Implementation Strategy CRM Implementation Dashboard With Customer Icons PDF bundle. Topics like Conversion Funnel, Customer Satisfaction, Marketing Expenses can be discussed with this completely editable template. It is available for immediate download depending on the needs and requirements of the user.
Dashboard For Tracking Social Media Platforms Icons PDF
This slide covers the KPI dashboard for analyzing social media channels. It includes metrics such as social media followers, Facebook daily reach, Facebook engaged users and page impressions, etc. Deliver an awe inspiring pitch with this creative Dashboard For Tracking Social Media Platforms Icons PDF bundle. Topics like Social Media Followers, Metrics, Awareness can be discussed with this completely editable template. It is available for immediate download depending on the needs and requirements of the user.
Optimize Marketing Pricing Price Optimization Dashboard Distribution Icons PDF
This slide covers the details of price optimization which focuses on price changes, leader, distribution, and benchmark. Deliver an awe inspiring pitch with this creative optimize marketing pricing price optimization dashboard distribution icons pdf bundle. Topics like price benchmark, price leader, distribution of my articles, price changes of sep 1 can be discussed with this completely editable template. It is available for immediate download depending on the needs and requirements of the user.
Cost And Income Optimization Price Optimization Dashboard Icons PDF
This slide covers the details of price optimization which focuses on price changes, leader, distribution, and benchmark. Deliver and pitch your topic in the best possible manner with this cost and income optimization price optimization dashboard icons pdf. Use them to share invaluable insights on distribution articles, price leader, price changes, price benchmark and impress your audience. This template can be altered and modified as per your expectations. So, grab it now.
Business Operational Expenditure Monitoring Dashboard With Budget Analysis Icons PDF
This slide shows operating expenses OPEX monitoring dashboard with budget analysis assisting companies in evaluating funds useful until end of the year. It visually present the organizations operating expenses by time period and sector. Showcasing this set of slides titled Business Operational Expenditure Monitoring Dashboard With Budget Analysis Icons PDF. The topics addressed in these templates are Business Operational, Budget Analysis, Monitoring Dashboard. All the content presented in this PPT design is completely editable. Download it and make adjustments in color, background, font etc. as per your unique business setting.
Financial Procedure Dashboard Indicating Yearly Revenue Analysis Icons PDF
This slide illustrates finance process dashboard indicating yearly revenue analysis which contains gross profit margin, operating profit ratio, net profit, revenue and cost of goods sold cogs operating expenses, etc. It can be referred by company owners who can compare it with previous years performance and make related decisions for future. Showcasing this set of slides titled Financial Procedure Dashboard Indicating Yearly Revenue Analysis Icons PDF. The topics addressed in these templates are Operating Profit Percentage, Net Profit Percentage, Operating Profit Ratio. All the content presented in this PPT design is completely editable. Download it and make adjustments in color, background, font etc. as per your unique business setting.
Workforce Productivity Tracking Report Kpi Dashboard Icons PDF
The following slide presents the KPAs of project work stream for transparency and better decision making. It includes KPIs such as work stream status, priority check, planned vs actual budget etc. Showcasing this set of slides titled Workforce Productivity Tracking Report Kpi Dashboard Icons PDF. The topics addressed in these templates are Initiation Meeting, Resource Assessment, Technological Analysis. All the content presented in this PPT design is completely editable. Download it and make adjustments in color, background, font etc. as per your unique business setting.
Performance Evaluation KPI Dashboard For 360 Degree Review Icons PDF
This slide covers 360 degree employee feedback dashboard. It includes metrics such as highest rated area, lowest rated area, potential blind spots, peer ratings, self rating, gap analysis, etc. Showcasing this set of slides titled Performance Evaluation KPI Dashboard For 360 Degree Review Icons PDF. The topics addressed in these templates are Highest Rated, Lowest Areas, Potential Spots. All the content presented in this PPT design is completely editable. Download it and make adjustments in color, background, font etc. as per your unique business setting.
Finance Metrics Dashboard Illustrating Account Payables Icons PDF
This graph or chart is linked to excel, and changes automatically based on data. Just left click on it and select edit data. Pitch your topic with ease and precision using this Total Income Budget, Total Expenses Balance, Net Profit Quick, Ratio Current Ratio. This layout presents information on Account Payable Age, Average Creditor Days, Cash On Hand. It is also available for immediate download and adjustment. So, changes can be made in the color, design, graphics or any other component to create a unique layout.
Driver Attention Monitoring Software Dashboard For Automotive Vehicles Icons PDF
This slide covers the dashboard representing the automotive vehicles driver monitoring system. It includes details related to content performance, platform wise volume of mentions, media and website overview. Pitch your topic with ease and precision using this Driver Attention Monitoring Software Dashboard For Automotive Vehicles Icons PDF. This layout presents information on Content Performance, Website Overview, Media Overview. It is also available for immediate download and adjustment. So, changes can be made in the color, design, graphics or any other component to create a unique layout.
Overall Marketing Dashboard Showcasing Market Performance Icons PDF
This slide showcases mass marketing dashboard which helps marketers in assessing there business performance. It provides information regarding net promoter score, inbound leads, sales per platform etc. Showcasing this set of slides titled Overall Marketing Dashboard Showcasing Market Performance Icons PDF. The topics addressed in these templates are Standard Customers, Market Share Growth Rate, Customer Locations . All the content presented in this PPT design is completely editable. Download it and make adjustments in color, background, font etc. as per your unique business setting.

 Home
Home