Data Analytics Icons
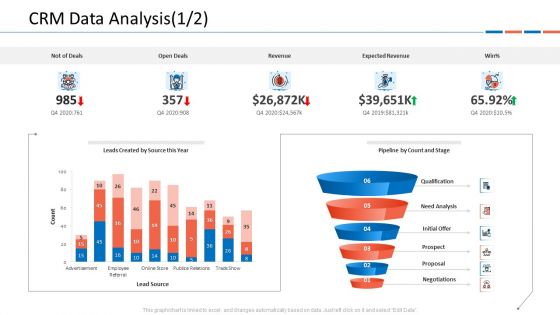
Customer Relationship Management Dashboard CRM Data Analysis Deals Ideas PDF
This graph or chart is linked to excel, and changes automatically based on data. Just left click on it and select Edit Data.Deliver and pitch your topic in the best possible manner with this customer relationship management dashboard crm data analysis deals ideas pdf. Use them to share invaluable insights on v and impress your audience. This template can be altered and modified as per your expectations. So, grab it now.
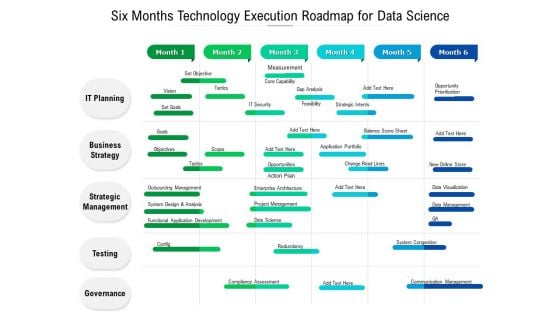
Six Months Technology Execution Roadmap For Data Science Structure
Introducing our six months technology execution roadmap for data science structure. This PPT presentation is Google Slides compatible, therefore, you can share it easily with the collaborators for measuring the progress. Also, the presentation is available in both standard screen and widescreen aspect ratios. So edit the template design by modifying the font size, font type, color, and shapes as per your requirements. As this PPT design is fully editable it can be presented in PDF, JPG and PNG formats.
Comparative Analysis Of Tools For Measuring Effectiveness Of Training Program Icons PDF
This slide covers comparative analysis of tools for measuring effectiveness of training program. It involves features such as analytics dashboard, customized survey templates, data analysis and customized reports. Find highly impressive Comparative Analysis Of Tools For Measuring Effectiveness Of Training Program Icons PDF on Slidegeeks to deliver a meaningful presentation. You can save an ample amount of time using these presentation templates. No need to worry to prepare everything from scratch because Slidegeeks experts have already done a huge research and work for you. You need to download Comparative Analysis Of Tools For Measuring Effectiveness Of Training Program Icons PDF for your upcoming presentation. All the presentation templates are 100 percent editable and you can change the color and personalize the content accordingly. Download now
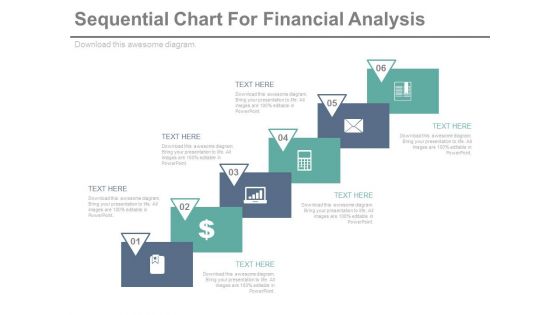
Sequential Steps Chart For Data Analysis Powerpoint Slides
This PowerPoint template has been designed sequential steps chart with icons. This PPT slide can be used to display corporate level financial strategy. You can download finance PowerPoint template to prepare awesome presentations.
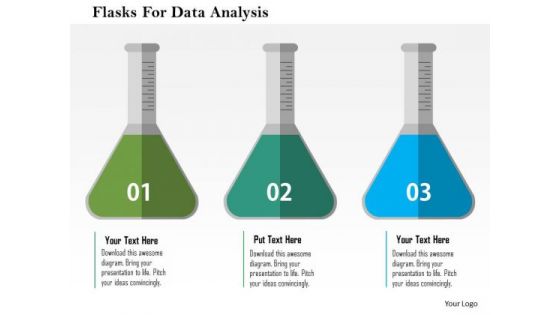
Business Diagram Flasks For Data Analysis Presentation Template
This business diagram displays three flasks. You may use this slide for data analysis. Make your mark with this unique slide. Create an impression that will endure.
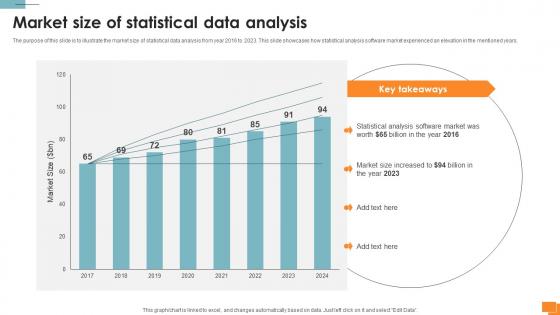
Statistical Tools For Evidence Market Size Of Statistical Data Analysis
The purpose of this slide is to illustrate the market size of statistical data analysis from year 2016 to 2023. This slide showcases how statistical analysis software market experienced an elevation in the mentioned years. Retrieve professionally designed Statistical Tools For Evidence Market Size Of Statistical Data Analysis to effectively convey your message and captivate your listeners. Save time by selecting pre-made slideshows that are appropriate for various topics, from business to educational purposes. These themes come in many different styles, from creative to corporate, and all of them are easily adjustable and can be edited quickly. Access them as PowerPoint templates or as Google Slides themes. You do not have to go on a hunt for the perfect presentation because Slidegeeks got you covered from everywhere. The purpose of this slide is to illustrate the market size of statistical data analysis from year 2016 to 2023. This slide showcases how statistical analysis software market experienced an elevation in the mentioned years.
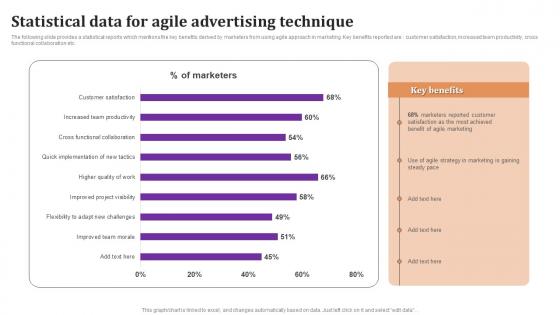
Statistical Data For Agile Advertising Technique Diagrams Pdf
The following slide provides a statistical reports which mentions the key benefits derived by marketers from using agile approach in marketing. Key benefits reported are customer satisfaction, increased team productivity, cross functional collaboration etc. Pitch your topic with ease and precision using this Statistical Data For Agile Advertising Technique Diagrams Pdf This layout presents information on Statistical Data, Agile Advertising, Technique It is also available for immediate download and adjustment. So, changes can be made in the color, design, graphics or any other component to create a unique layout. The following slide provides a statistical reports which mentions the key benefits derived by marketers from using agile approach in marketing. Key benefits reported are customer satisfaction, increased team productivity, cross functional collaboration etc.
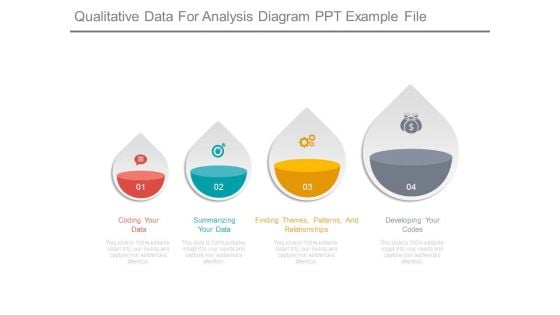
Qualitative Data For Analysis Diagram Ppt Example File
This is a qualitative data for analysis diagram ppt example file. This is a four stage process. The stages in this process are coding your data, summarizing your data, finding themes, patterns, and relationships, developing your codes.
Data Analysis Marketing Ppt PowerPoint Presentation Ideas Examples Cpb
This is a data analysis marketing ppt powerpoint presentation ideas examples cpb. This is a two stage process. The stages in this process are data analysis marketing.

Data Ethics Canvas Overview Responsible Technology Governance Manual Designs Pdf
This slide provides information regarding data ethics canvas as a responsible tech approach that focuses on data sharing and utilization by team. The approach is utilized during project initiation phase by technical professionals and diverse group. Present like a pro with Data Ethics Canvas Overview Responsible Technology Governance Manual Designs Pdf Create beautiful presentations together with your team, using our easy to use presentation slides. Share your ideas in real time and make changes on the fly by downloading our templates. So whether you are in the office, on the go, or in a remote location, you can stay in sync with your team and present your ideas with confidence. With Slidegeeks presentation got a whole lot easier. Grab these presentations today. This slide provides information regarding data ethics canvas as a responsible tech approach that focuses on data sharing and utilization by team. The approach is utilized during project initiation phase by technical professionals and diverse group.
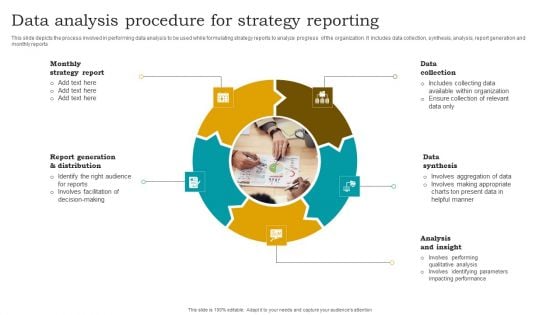
Data Analysis Procedure For Strategy Reporting Designs PDF
This slide depicts the process involved in performing data analysis to be used while formulating strategy reports to analyze progress of the organization. It includes data collection, synthesis, analysis, report generation and monthly reports. Presenting Data Analysis Procedure For Strategy Reporting Designs PDF to dispense important information. This template comprises five stages. It also presents valuable insights into the topics including Data Collection, Data Synthesis, Analysis And Insight. This is a completely customizable PowerPoint theme that can be put to use immediately. So, download it and address the topic impactfully.

Big Data Sources Analysis Concept Diagram Template Powerpoint Slides
This is a big data sources analysis concept diagram template powerpoint slides. This is a eight stage process. The stages in this process are public web, data storage, social media, business app, machine data, sensor, archives.
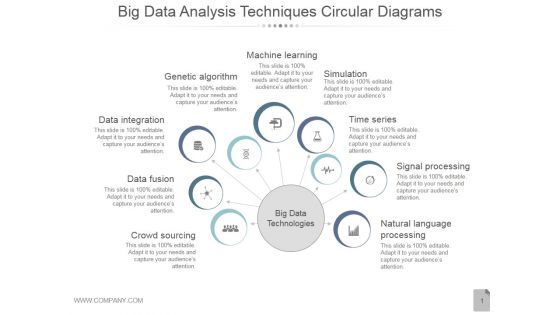
Big Data Analysis Techniques Circular Diagrams Ppt PowerPoint Presentation Shapes
This is a big data analysis techniques circular diagrams ppt powerpoint presentation shapes. This is a nine stage process. The stages in this process are data fusion, data integration, genetic algorithm, machine learning, simulation.
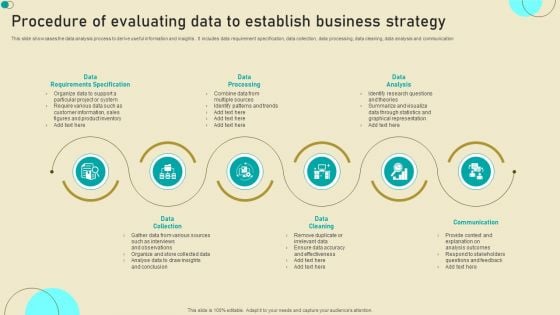
Procedure Of Evaluating Data To Establish Business Strategy Clipart PDF
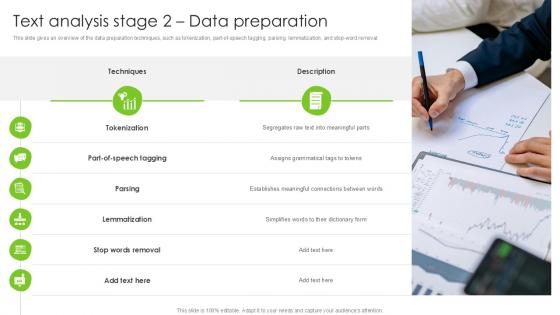
Text Analysis Stage 2 Data Preparation PPT Sample SS
This slide gives an overview of the data preparation techniques, such as tokenization, part-of-speech tagging, parsing, lemmatization, and stop-word removal. Retrieve professionally designed Text Analysis Stage 2 Data Preparation PPT Sample SS to effectively convey your message and captivate your listeners. Save time by selecting pre-made slideshows that are appropriate for various topics, from business to educational purposes. These themes come in many different styles, from creative to corporate, and all of them are easily adjustable and can be edited quickly. Access them as PowerPoint templates or as Google Slides themes. You do not have to go on a hunt for the perfect presentation because Slidegeeks got you covered from everywhere. This slide gives an overview of the data preparation techniques, such as tokenization, part-of-speech tagging, parsing, lemmatization, and stop-word removal.
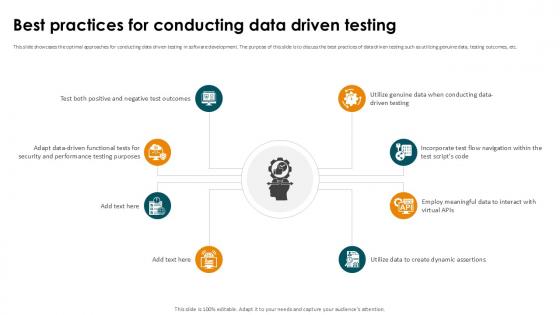
Best Practices For Conducting Data Smoke Testing Ppt Example
This slide showcases the optimal approaches for conducting data driven testing in software development. The purpose of this slide is to discuss the best practices of data driven testing such as utilizing genuine data, testing outcomes, etc. If you are looking for a format to display your unique thoughts, then the professionally designed Best Practices For Conducting Data Smoke Testing Ppt Example is the one for you. You can use it as a Google Slides template or a PowerPoint template. Incorporate impressive visuals, symbols, images, and other charts. Modify or reorganize the text boxes as you desire. Experiment with shade schemes and font pairings. Alter, share or cooperate with other people on your work. Download Best Practices For Conducting Data Smoke Testing Ppt Example and find out how to give a successful presentation. Present a perfect display to your team and make your presentation unforgettable. This slide showcases the optimal approaches for conducting data driven testing in software development. The purpose of this slide is to discuss the best practices of data driven testing such as utilizing genuine data, testing outcomes, etc.
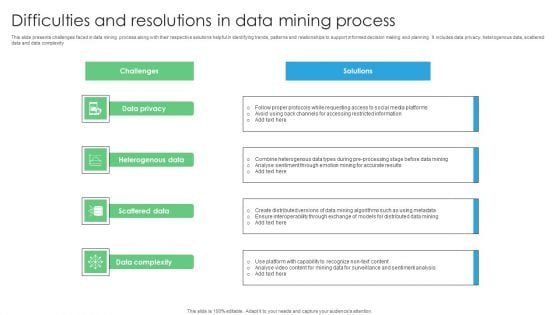
Difficulties And Resolutions In Data Mining Process Diagrams PDF
This slide presents challenges faced in data mining process along with their respective solutions helpful in identifying trends, patterns and relationships to support informed decision making and planning. It includes data privacy, heterogenous data, scattered data and data complexity. Introducing Difficulties And Resolutions In Data Mining Process Diagrams PDF. to increase your presentation threshold. Encompassed with four stages, this template is a great option to educate and entice your audience. Dispence information on Data Privacy, Heterogenous Data, Scattered Data, using this template. Grab it now to reap its full benefits.
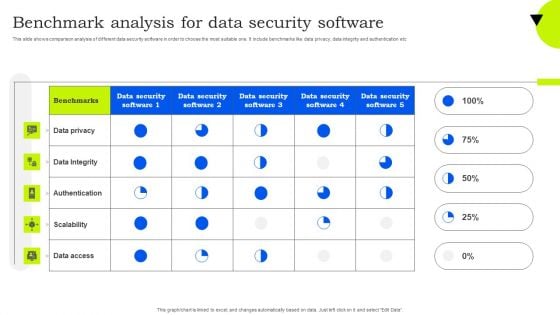
Benchmark Analysis For Data Security Software Mockup PDF
This slide shows comparison analysis of different data security software in order to choose the most suitable one. It include benchmarks like data privacy, data integrity and authentication etc. Showcasing this set of slides titled Benchmark Analysis For Data Security Software Mockup PDF. The topics addressed in these templates are Data Privacy, Data Integrity, Authentication. All the content presented in this PPT design is completely editable. Download it and make adjustments in color, background, font etc. as per your unique business setting.
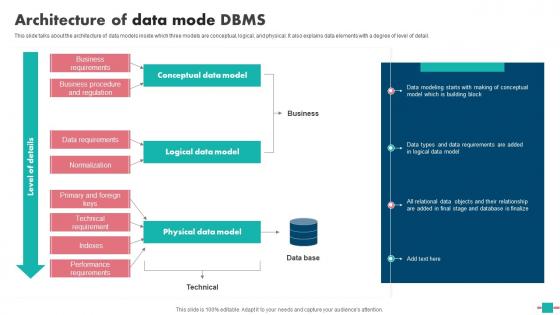
Database Modeling Architecture Of Data Mode DBMs Slides Pdf
This slide talks about the architecture of data models inside which three models are conceptual, logical, and physical. It also explains data elements with a degree of level of detail. Do you know about Slidesgeeks Database Modeling Architecture Of Data Mode DBMs Slides Pdf These are perfect for delivering any kind od presentation. Using it, create PowerPoint presentations that communicate your ideas and engage audiences. Save time and effort by using our pre designed presentation templates that are perfect for a wide range of topic. Our vast selection of designs covers a range of styles, from creative to business, and are all highly customizable and easy to edit. Download as a PowerPoint template or use them as Google Slides themes. This slide talks about the architecture of data models inside which three models are conceptual, logical, and physical. It also explains data elements with a degree of level of detail.
Set Of Informative Data Management Diagram Sample Ppt Presentation
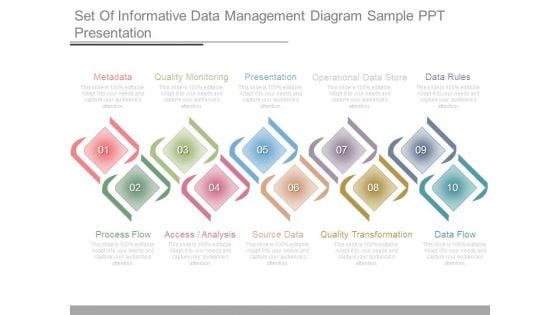
This is a set of informative data management diagram sample ppt presentation. This is a ten stage process. The stages in this process are metadata, quality monitoring, presentation, operational data store, data rules, process flow, access analysis, source data, quality transformation, data flow.
Cloud Migration And Network Performance Data Migration From On Premises
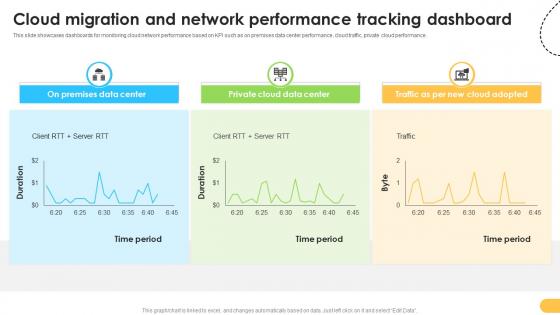
This slide showcases dashboards for monitoring cloud network performance based on KPI such as on premises data center performance, cloud traffic, private cloud performance. Present like a pro with Cloud Migration And Network Performance Data Migration From On Premises. Create beautiful presentations together with your team, using our easy-to-use presentation slides. Share your ideas in real-time and make changes on the fly by downloading our templates. So whether you are in the office, on the go, or in a remote location, you can stay in sync with your team and present your ideas with confidence. With Slidegeeks presentation got a whole lot easier. Grab these presentations today. This slide showcases dashboards for monitoring cloud network performance based on KPI such as on premises data center performance, cloud traffic, private cloud performance.
Effective Data Migration Cloud Migration And Network Performance Tracking
This slide showcases dashboards for monitoring cloud network performance based on KPI such as on premises data center performance, cloud traffic, private cloud performance. Present like a pro with Effective Data Migration Cloud Migration And Network Performance Tracking. Create beautiful presentations together with your team, using our easy-to-use presentation slides. Share your ideas in real-time and make changes on the fly by downloading our templates. So whether you are in the office, on the go, or in a remote location, you can stay in sync with your team and present your ideas with confidence. With Slidegeeks presentation got a whole lot easier. Grab these presentations today. This slide showcases dashboards for monitoring cloud network performance based on KPI such as on premises data center performance, cloud traffic, private cloud performance.
Data Sourcing Strategy Diagram Powerpoint Slide Background Picture
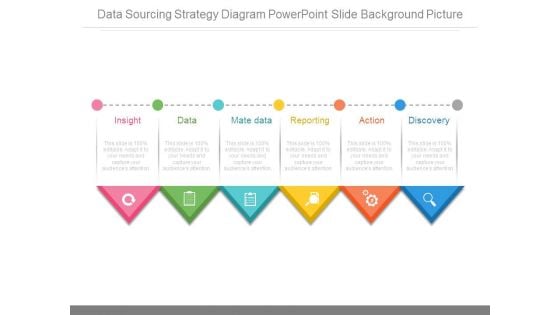
This is a data sourcing strategy diagram powerpoint slide background picture. This is a six stage process. The stages in this process are insight, data, mare data, reporting, action, discovery.
Monthly Consumer Response Strategic Data Analysis Dashboard Graphics PDF
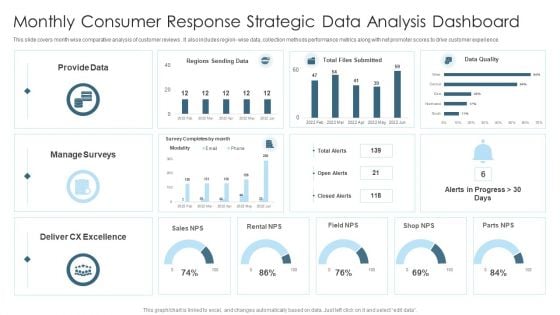
This slide covers month wise comparative analysis of customer reviews . It also includes region wise data, collection methods performance metrics along with net promoter scores to drive customer experience. Showcasing this set of slides titled Monthly Consumer Response Strategic Data Analysis Dashboard Graphics PDF. The topics addressed in these templates are Provide Data, Sales, Manage Surveys. All the content presented in this PPT design is completely editable. Download it and make adjustments in color, background, font etc. as per your unique business setting.
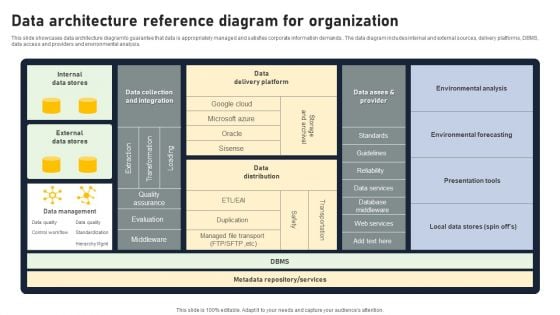
Data Architecture Reference Diagram For Organization Brochure PDF
This slide showcases data architecture diagram to guarantee that data is appropriately managed and satisfies corporate information demands.. The data diagram includes internal and external sources, delivery platforms, DBMS, data access and providers and environmental analysis. Pitch your topic with ease and precision using this Data Architecture Reference Diagram For Organization Brochure PDF. This layout presents information on Internal Data Stores, External Data Stores, Data Delivery Platform. It is also available for immediate download and adjustment. So, changes can be made in the color, design, graphics or any other component to create a unique layout.
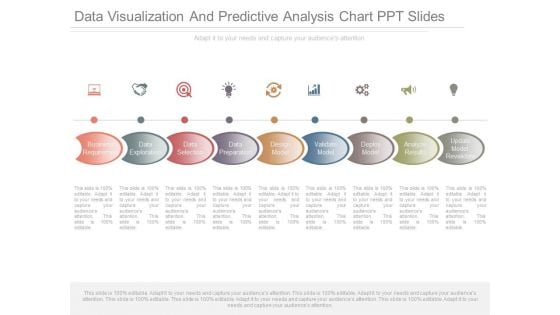
Data Visualization And Predictive Analysis Chart Ppt Slides
This is a data visualization and predictive analysis chart ppt slides. This is a nine stage process. The stages in this process are business requirement, data exploration, data selection, data preparation, design model, validate model, deploy model, analyze results, update model, revalidate.
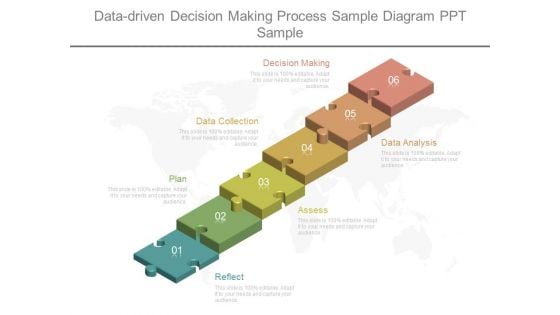
Data Driven Decision Making Process Sample Diagram Ppt Sample
This is a data driven decision making process sample diagram ppt sample. This is a six stage process. The stages in this process are decision making, data collection, plan, reflect, assess, data analysis.
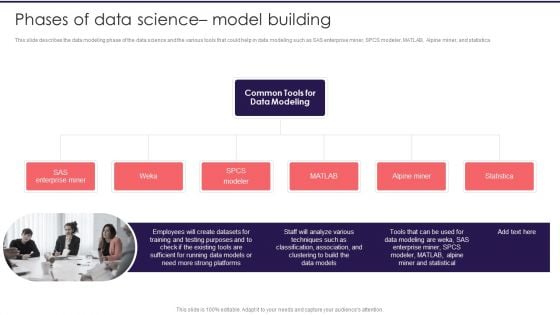
Information Studies Phases Of Data Science Model Building Slides PDF
This slide describes the data modeling phase of the data science and the various tools that could help in data modeling such as SAS enterprise miner, SPCS modeler, MATLAB, Alpine miner, and statistica. This is a Information Studies Phases Of Data Science Model Building Slides PDF template with various stages. Focus and dispense information on six stages using this creative set, that comes with editable features. It contains large content boxes to add your information on topics like Employees, Datasets, Techniques. You can also showcase facts, figures, and other relevant content using this PPT layout. Grab it now.
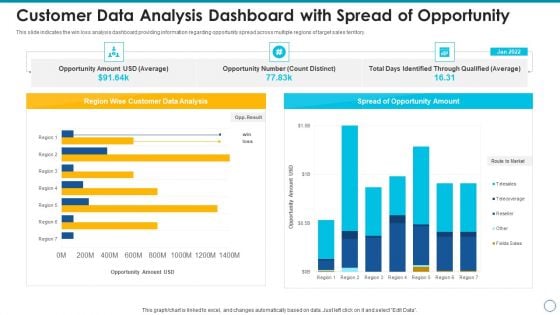
Customer Data Analysis Dashboard With Spread Of Opportunity Professional PDF
This slide indicates the win loss analysis dashboard providing information regarding opportunity spread across multiple regions of target sales territory. Showcasing this set of slides titled customer data analysis dashboard with spread of opportunity professional pdf. The topics addressed in these templates are customer data analysis dashboard with spread of opportunity. All the content presented in this PPT design is completely editable. Download it and make adjustments in color, background, font etc. as per your unique business setting.
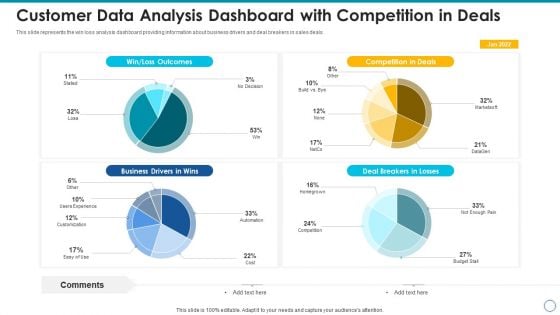
Customer Data Analysis Dashboard With Competition In Deals Infographics PDF
This slide represents the win loss analysis dashboard providing information about business drivers and deal breakers in sales deals. Pitch your topic with ease and precision using this customer data analysis dashboard with competition in deals infographics pdf. This layout presents information on customer data analysis dashboard with competition in deals. It is also available for immediate download and adjustment. So, changes can be made in the color, design, graphics or any other component to create a unique layout.

Effective Data Migration Multi Cloud Migration Progress Status Dashboard
This slide showcases dashboard to track application migration process to cloud platform using KPIs such as scheduled migrations, sources, project duration etc. This Effective Data Migration Multi Cloud Migration Progress Status Dashboard from Slidegeeks makes it easy to present information on your topic with precision. It provides customization options, so you can make changes to the colors, design, graphics, or any other component to create a unique layout. It is also available for immediate download, so you can begin using it right away. Slidegeeks has done good research to ensure that you have everything you need to make your presentation stand out. Make a name out there for a brilliant performance. This slide showcases dashboard to track application migration process to cloud platform using KPIs such as scheduled migrations, sources, project duration etc.

Data Center Infrastructure Management KPI Dashboard Designs PDF
This slide covers data center infrastructure management KPI dashboard. It involves details such as cabinets with free data and power ports, data ports usage per user and items per connected power supplies. Showcasing this set of slides titled Data Center Infrastructure Management KPI Dashboard Designs PDF. The topics addressed in these templates are Data Center Infrastructure, Management KPI Dashboard. All the content presented in this PPT design is completely editable. Download it and make adjustments in color, background, font etc. as per your unique business setting.
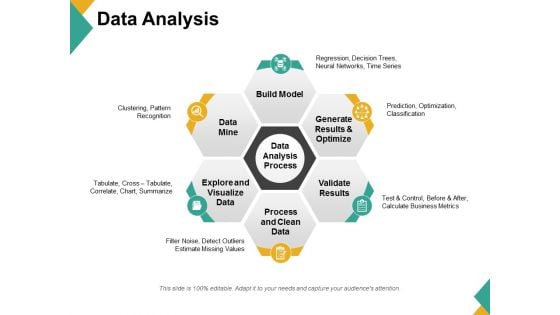
Data Analysis Ppt PowerPoint Presentation Visual Aids Diagrams
This is a data analysis ppt powerpoint presentation visual aids diagrams. This is a six stage process. The stages in this process are build model, generate results and optimize, validate results, process and clean data, explore and visualize data, data mine.
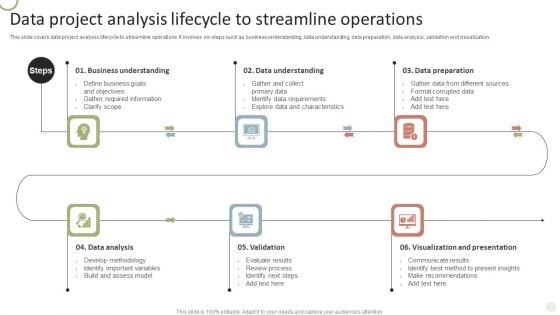
Data Project Analysis Lifecycle To Streamline Operations Diagrams PDF
This slide covers data project analysis lifecycle to streamline operations. It involves six steps such as business understanding, data understanding, data preparation, data analysis, validation and visualization.Persuade your audience using this Data Project Analysis Lifecycle To Streamline Operations Diagrams PDF. This PPT design covers six stages, thus making it a great tool to use. It also caters to a variety of topics including Business Understanding, Data Understanding, Data Preparation. Download this PPT design now to present a convincing pitch that not only emphasizes the topic but also showcases your presentation skills.
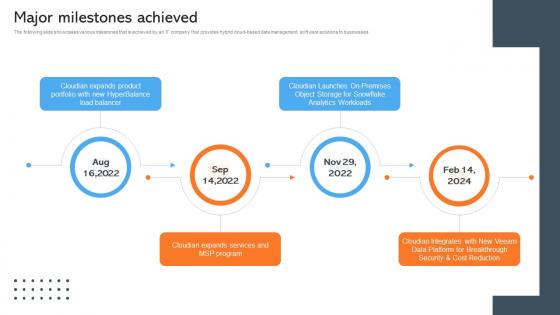
Major Milestones Achieved Data Management Company Investor Funding Pitch Deck
The following slide showcases various milestones that is achieved by an IT company that provides hybrid cloud-based data management software solutions to businesses. If you are looking for a format to display your unique thoughts, then the professionally designed Major Milestones Achieved Data Management Company Investor Funding Pitch Deck is the one for you. You can use it as a Google Slides template or a PowerPoint template. Incorporate impressive visuals, symbols, images, and other charts. Modify or reorganize the text boxes as you desire. Experiment with shade schemes and font pairings. Alter, share or cooperate with other people on your work. Download Major Milestones Achieved Data Management Company Investor Funding Pitch Deck and find out how to give a successful presentation. Present a perfect display to your team and make your presentation unforgettable. The following slide showcases various milestones that is achieved by an IT company that provides hybrid cloud-based data management software solutions to businesses.
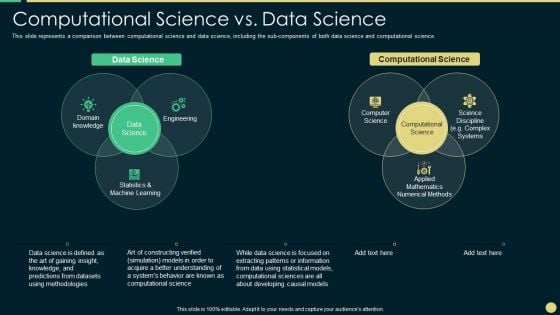
Scientific Computing IT Computational Science Vs Data Science Introduction PDF
This slide represents a comparison between computational science and data science, including the sub-components of both data science and computational science.Presenting scientific computing it computational science vs data science introduction pdf to provide visual cues and insights. Share and navigate important information on three stages that need your due attention. This template can be used to pitch topics like domain knowledge, statistics and machine learning, engineering In addtion, this PPT design contains high resolution images, graphics, etc, that are easily editable and available for immediate download.
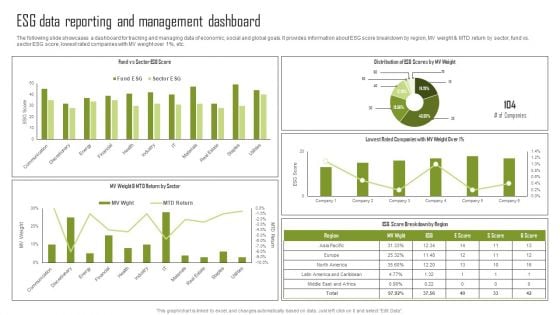
ESG Data Reporting And Management Dashboard Download PDF
The following slide showcases a dashboard for tracking and managing data of economic, social and global goals. It provides information about ESG score breakdown by region, MV weight and MTD return by sector, fund vs. sector ESG score, lowest rated companies with MV weight over 1 percent, etc. Formulating a presentation can take up a lot of effort and time, so the content and message should always be the primary focus. The visuals of the PowerPoint can enhance the presenters message, so our ESG Data Reporting And Management Dashboard Download PDF was created to help save time. Instead of worrying about the design, the presenter can concentrate on the message while our designers work on creating the ideal templates for whatever situation is needed. Slidegeeks has experts for everything from amazing designs to valuable content, we have put everything into ESG Data Reporting And Management Dashboard Download PDF.

SAP Cloud Master Data Governance Architecture Guidelines PDF
The purpose of this slide is to showcase SAPs corporate strategic framework to integrate master data for a harmonized view across all the applications. The key components include central data governance, master data consolidation, and data quality evaluation. Presenting SAP Cloud Master Data Governance Architecture Guidelines PDF to dispense important information. This template comprises Four stages. It also presents valuable insights into the topics including Central Data Governance, Master Data Consolidation, Data Quality Evaluation. This is a completely customizable PowerPoint theme that can be put to use immediately. So, download it and address the topic impactfully.

Data Science Model Ppt PowerPoint Presentation Complete Deck With Slides
This Data Science Model Ppt PowerPoint Presentation Complete Deck With Slides acts as backup support for your ideas, vision, thoughts, etc. Use it to present a thorough understanding of the topic. This PPT slideshow can be utilized for both in-house and outside presentations depending upon your needs and business demands. Entailing sixteen slides with a consistent design and theme, this template will make a solid use case. As it is intuitively designed, it suits every business vertical and industry. All you have to do is make a few tweaks in the content or any other component to design unique presentations. The biggest advantage of this complete deck is that it can be personalized multiple times once downloaded. The color, design, shapes, and other elements are free to modify to add personal touches. You can also insert your logo design in this PPT layout. Therefore a well-thought and crafted presentation can be delivered with ease and precision by downloading this Data Science Model Ppt PowerPoint Presentation Complete Deck With Slides PPT slideshow.
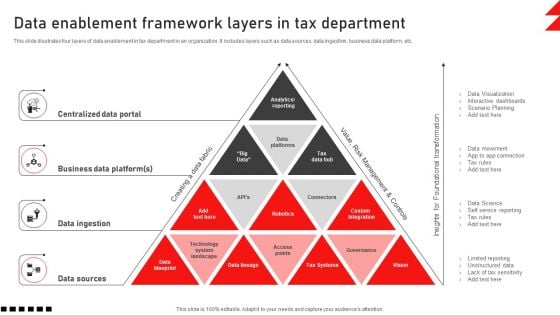
Data Enablement Framework Layers In Tax Department Elements PDF
This slide illustrates four layers of data enablement in tax department in an organization. It includes layers such as data sources, data ingestion, business data platform, etc. Presenting Data Enablement Framework Layers In Tax Department Elements PDF to dispense important information. This template comprises four stages. It also presents valuable insights into the topics including Centralized Data Portal, Business Data Platform, Data Ingestion. This is a completely customizable PowerPoint theme that can be put to use immediately. So, download it and address the topic impactfully.
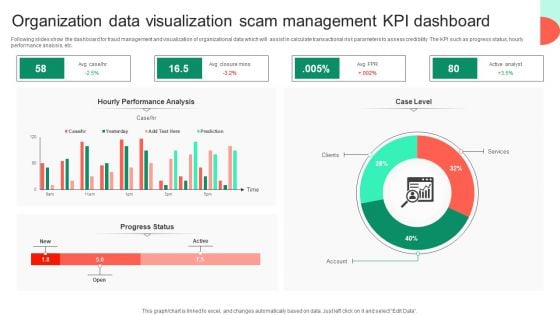
Organization Data Visualization Scam Management KPI Dashboard Rules PDF
Following slides show the dashboard for fraud management and visualization of organizational data which will assist in calculate transactional risk parameters to assess credibility. The KPI such as progress status, hourly performance analysis, etc. Showcasing this set of slides titled Organization Data Visualization Scam Management KPI Dashboard Rules PDF. The topics addressed in these templates are Hourly Performance Analysis, Services, Organization Data Visualization. All the content presented in this PPT design is completely editable. Download it and make adjustments in color, background, font etc. as per your unique business setting.
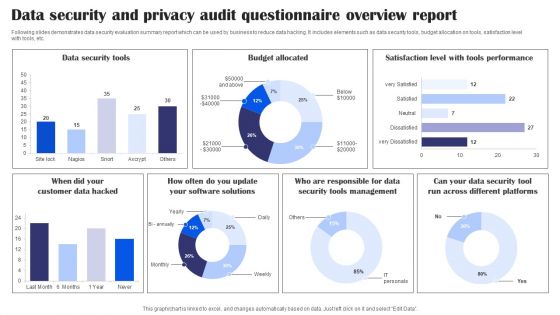
Data Security And Privacy Audit Questionnaire Overview Report Survey SS
Following slides demonstrates data security evaluation summary report which can be used by business to reduce data hacking. It includes elements such as data security tools, budget allocation on tools, satisfaction level with tools, etc. Pitch your topic with ease and precision using this Data Security And Privacy Audit Questionnaire Overview Report Survey SS. This layout presents information on Data Security Tools, Budget Allocated, Tools Performance, Data Security Tools Management. It is also available for immediate download and adjustment. So, changes can be made in the color, design, graphics or any other component to create a unique layout.
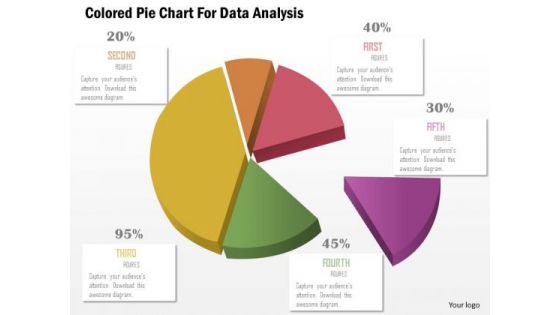
Business Diagram Colored Pie Chart For Data Analysis Presentation Template
This business slide displays pie chart. This diagram is a data visualization tool that gives you a simple way to present statistical information. This slide helps your audience examine and interpret the data you present.
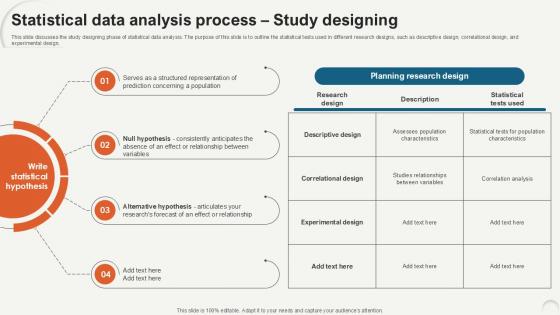
Statistical Data Analysis Process Study Designing Ppt Presentation
This slide discusses the study designing phase of statistical data analysis. The purpose of this slide is to outline the statistical tests used in different research designs, such as descriptive design, correlational design, and experimental design. Do you have to make sure that everyone on your team knows about any specific topic I yes, then you should give Statistical Data Analysis Process Study Designing Ppt Presentation a try. Our experts have put a lot of knowledge and effort into creating this impeccable Statistical Data Analysis Process Study Designing Ppt Presentation. You can use this template for your upcoming presentations, as the slides are perfect to represent even the tiniest detail. You can download these templates from the Slidegeeks website and these are easy to edit. So grab these today This slide discusses the study designing phase of statistical data analysis. The purpose of this slide is to outline the statistical tests used in different research designs, such as descriptive design, correlational design, and experimental design.
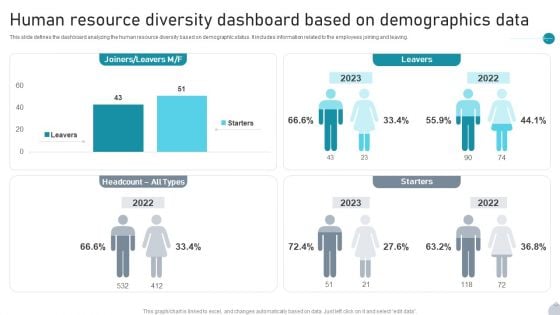
Human Resource Diversity Dashboard Based On Demographics Data Rules PDF
This slide defines the dashboard analyzing the human resource diversity based on demographic status. It includes information related to the employees joining and leaving. Pitch your topic with ease and precision using this Human Resource Diversity Dashboard Based On Demographics Data Rules PDF. This layout presents information on Starters, Leavers, Demographics Data It is also available for immediate download and adjustment. So, changes can be made in the color, design, graphics or any other component to create a unique layout.
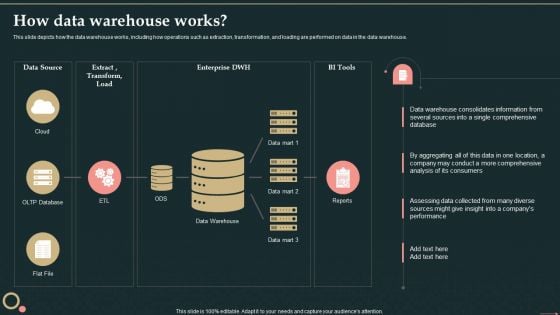
Management Information System How Data Warehouse Works Diagrams PDF
This slide depicts how the data warehouse works, including how operations such as extraction, transformation, and loading are performed on data in the data warehouse.Deliver an awe inspiring pitch with this creative Management Information System How Data Warehouse Works Diagrams PDF bundle. Topics like Data Warehouse, Consolidates Information, Single Comprehensive can be discussed with this completely editable template. It is available for immediate download depending on the needs and requirements of the user.
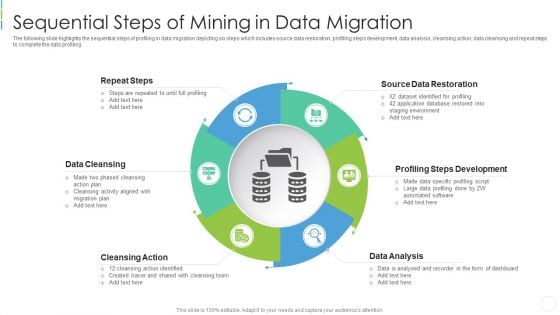
Sequential Steps Of Mining In Data Migration Structure PDF
The following slide highlights the sequential steps of profiling in data migration depicting six steps which includes source data restoration, profiling steps development, data analysis, cleansing action, data cleansing and repeat steps to complete the data profiling Presenting sequential steps of mining in data migration structure pdf to dispense important information. This template comprises six stages. It also presents valuable insights into the topics including data cleansing, cleansing action, repeat steps, source data restoration . This is a completely customizable PowerPoint theme that can be put to use immediately. So, download it and address the topic impactfully.
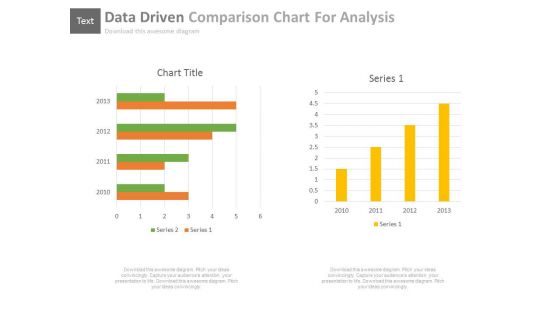
Data Driven Comparison Charts For Analysis Powerpoint Slides
You can download this PowerPoint template to display statistical data and analysis. This PPT slide contains data driven comparison charts. Draw an innovative business idea using this professional diagram.
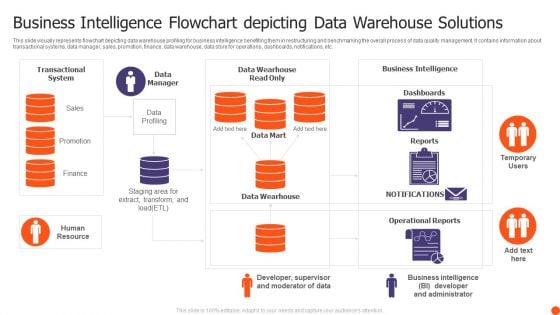
Business Intelligence Flowchart Depicting Data Warehouse Solutions Template PDF
This slide visually represents flowchart depicting data warehouse profiling for business intelligence benefiting them in restructuring and benchmarking the overall process of data quality management. It contains information about transactional systems, data manager, sales, promotion, finance, data warehouse, data store for operations, dashboards, notifications, etc. Presenting Business Intelligence Flowchart Depicting Data Warehouse Solutions Template PDF to dispense important information. This template comprises one stages. It also presents valuable insights into the topics including Transactional System, Data Manager, Business Intelligence. This is a completely customizable PowerPoint theme that can be put to use immediately. So, download it and address the topic impactfully.
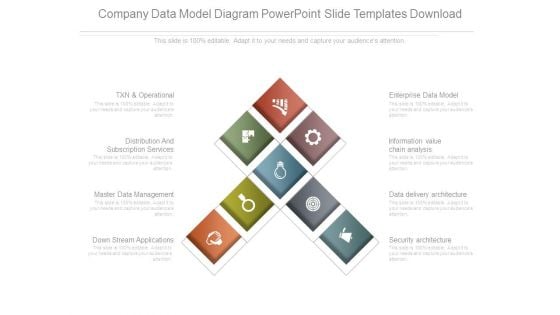
Company Data Model Diagram Powerpoint Slide Templates Download
This is a company data model diagram powerpoint slide templates download. This is a eight stage process. The stages in this process are txn and operational, distribution and subscription services, master data management, down stream applications, enterprise data model, information value chain analysis, data delivery architecture, security architecture.
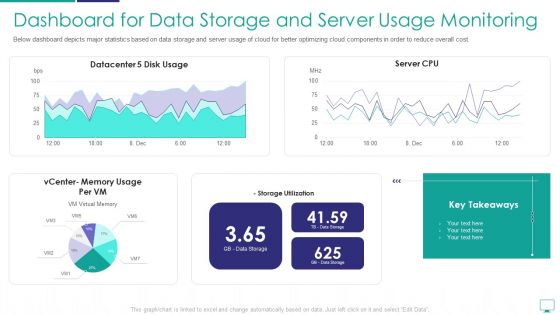
Dashboard For Data Storage And Server Usage Monitoring Mockup PDF
Below dashboard depicts major statistics based on data storage and server usage of cloud for better optimizing cloud components in order to reduce overall cost.Deliver an awe inspiring pitch with this creative dashboard for data storage and server usage monitoring mockup pdf bundle. Topics like dashboard for data storage and server usage monitoring can be discussed with this completely editable template. It is available for immediate download depending on the needs and requirements of the user.
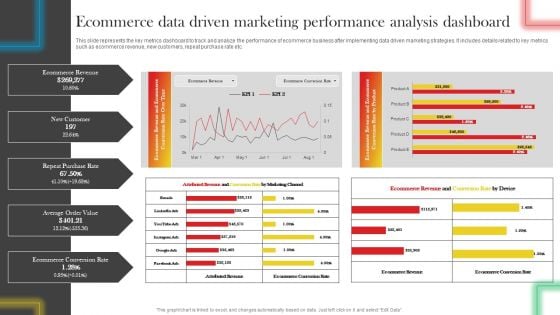
Ecommerce Data Driven Marketing Performance Analysis Dashboard Professional PDF
This slide represents the key metrics dashboard to track and analyze the performance of ecommerce business after implementing data driven marketing strategies. It includes details related to key metrics such as ecommerce revenue, new customers, repeat purchase rate etc. Get a simple yet stunning designed Ecommerce Data Driven Marketing Performance Analysis Dashboard Professional PDF. It is the best one to establish the tone in your meetings. It is an excellent way to make your presentations highly effective. So, download this PPT today from Slidegeeks and see the positive impacts. Our easy-to-edit Ecommerce Data Driven Marketing Performance Analysis Dashboard Professional PDF can be your go-to option for all upcoming conferences and meetings. So, what are you waiting for Grab this template today.
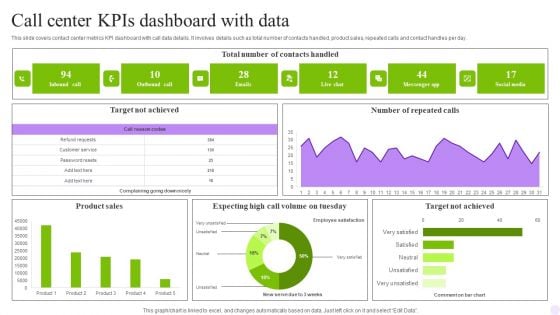
Call Center Kpis Dashboard With Data Graphics PDF
This slide covers contact center team performance metrics KPI dashboard. It involves details such as resolutions, response time, call data management and daily response time. Showcasing this set of slides titled Call Center Kpis Dashboard With Data Graphics PDF. The topics addressed in these templates are Response Time, Data Management, Resolution Rate. All the content presented in this PPT design is completely editable. Download it and make adjustments in color, background, font etc. as per your unique business setting.
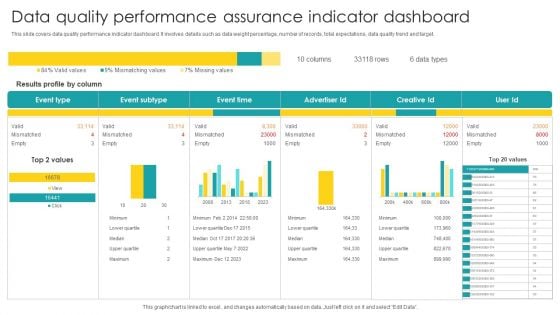
Data Quality Performance Assurance Indicator Dashboard Diagrams PDF
Pitch your topic with ease and precision using this Data Quality Performance Assurance Indicator Dashboard Diagrams PDF. This layout presents information on Data Quality Performance, Assurance Indicator Dashboard. It is also available for immediate download and adjustment. So, changes can be made in the color, design, graphics or any other component to create a unique layout.
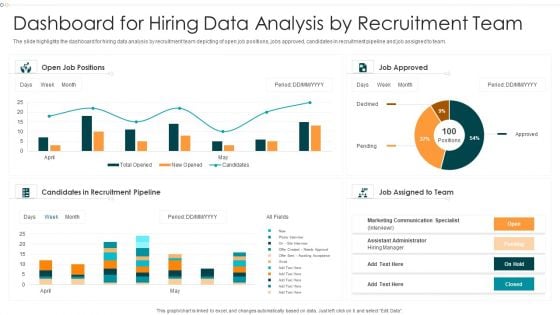
Dashboard For Hiring Data Analysis By Recruitment Team Formats PDF
The slide highlights the dashboard for hiring data analysis by recruitment team depicting of open job positions, jobs approved, candidates in recruitment pipeline and job assigned to team.Pitch your topic with ease and precision using this Dashboard For Hiring Data Analysis By Recruitment Team Formats PDF This layout presents information on Candidates Recruitment, Marketing Communication, Approved It is also available for immediate download and adjustment. So, changes can be made in the color, design, graphics or any other component to create a unique layout.
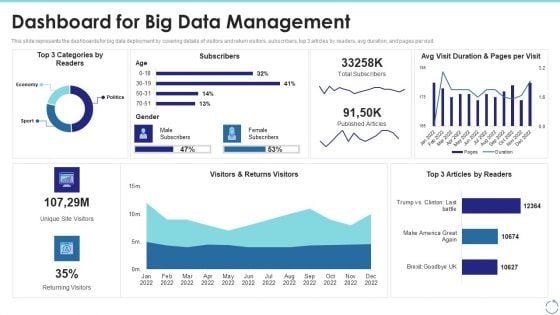
Dashboard For Big Data Management Ppt Outline Elements PDF
This slide represents the dashboards for big data deployment by covering details of visitors and return visitors, subscribers, top 3 articles by readers, avg duration, and pages per visit. Deliver an awe inspiring pitch with this creative dashboard for big data management ppt outline elements pdf bundle. Topics like dashboard for big data management can be discussed with this completely editable template. It is available for immediate download depending on the needs and requirements of the user.
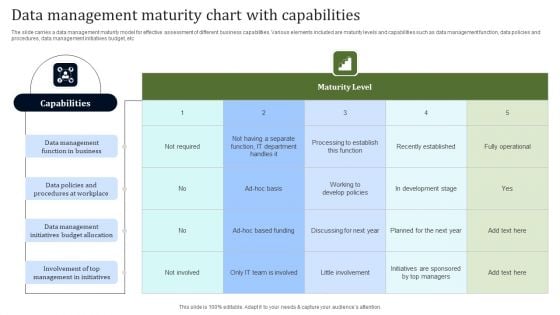
Data Management Maturity Chart With Capabilities Topics PDF
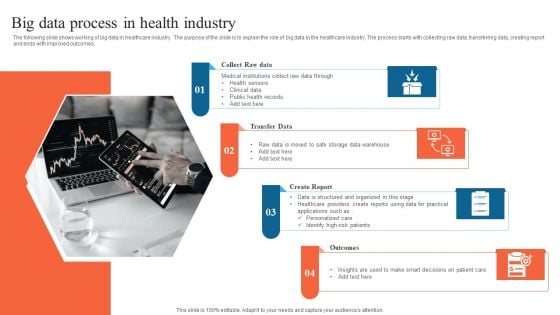
Big Data Process In Health Industry Ideas PDF
The following slide shows working of big data in healthcare industry. The purpose of the slide is to explain the role of big data in the healthcare industry. The process starts with collecting raw data, transferring data, creating report and ends with improved outcomes. Presenting Big Data Process In Health Industry Ideas PDF to dispense important information. This template comprises four stages. It also presents valuable insights into the topics including Collect Raw Data, Transfer Data, Create Report. This is a completely customizable PowerPoint theme that can be put to use immediately. So, download it and address the topic impactfully.
Ppt Slide 6 Approaches To Data Analysis Sales Plan
Get The Doers Into Action. Activate Them With Our PPT Slide 6 Approaches To Data Analysis Sales Plan Powerpoint Templates.

Key Drivers Of Data Protection And Security Mechanism Infographics PDF
The following slide showcases data protection drivers to assist businesses with their legitimate use of personal data. The drivers covered are data location, sensitivity, protection, access and flow.Presenting Key Drivers Of Data Protection And Security Mechanism Infographics PDF to dispense important information. This template comprises five stages. It also presents valuable insights into the topics including Data Location, Data Sensitivity, Data Protection. This is a completely customizable PowerPoint theme that can be put to use immediately. So, download it and address the topic impactfully.


 Continue with Email

 Home
Home


