Data Analytics Icons
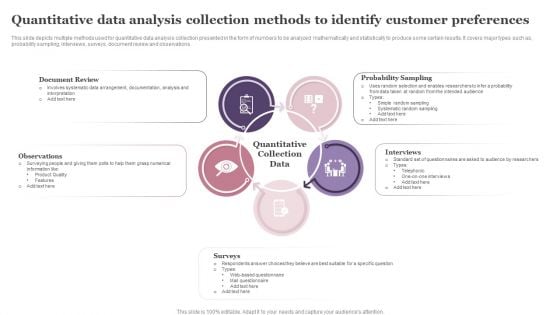
Quantitative Data Analysis Collection Methods To Identify Customer Preferences Topics PDF
This slide depicts multiple methods used for quantitative data analysis collection presented in the form of numbers to be analyzed mathematically and statistically to produce some certain results. It covers major types such as probability sampling, interviews, surveys, document review and observations. Presenting Quantitative Data Analysis Collection Methods To Identify Customer Preferences Topics PDF to dispense important information. This template comprises five stages. It also presents valuable insights into the topics including Document Review, Observations, Probability Sampling, Interviews. This is a completely customizable PowerPoint theme that can be put to use immediately. So, download it and address the topic impactfully.
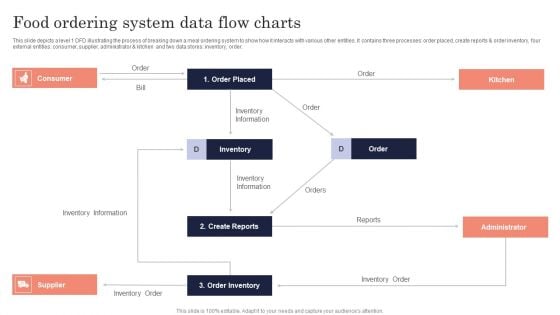
Food Ordering System Data Flow Charts Ppt PowerPoint Presentation File Pictures PDF
This slide depicts a level 1 DFD illustrating the process of breaking down a meal ordering system to show how it interacts with various other entities. It contains three processes order placed, create reports and order inventory, four external entities consumer, supplier, administrator and kitchen and two data stores inventory, order. Presenting Food Ordering System Data Flow Charts Ppt PowerPoint Presentation File Pictures PDF to dispense important information. This template comprises one stages. It also presents valuable insights into the topics including Consumer, Order Placed, Administrator, Inventory. This is a completely customizable PowerPoint theme that can be put to use immediately. So, download it and address the topic impactfully.
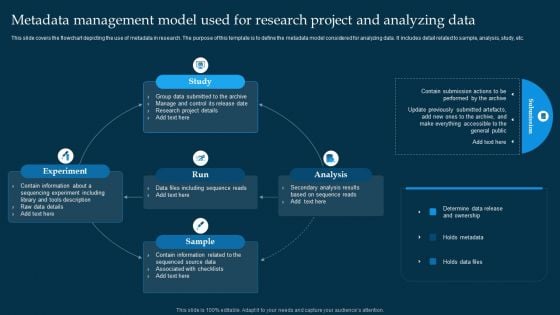
Metadata Management Model Used For Research Project And Analyzing Data Designs PDF
This slide covers the flowchart depicting the use of metadata in research. The purpose of this template is to define the metadata model considered for analyzing data. It includes detail related to sample, analysis, study, etc. Presenting Metadata Management Model Used For Research Project And Analyzing Data Designs PDF to dispense important information. This template comprises five stages. It also presents valuable insights into the topics including Study, Analysis, Sample, Run, Experiment. This is a completely customizable PowerPoint theme that can be put to use immediately. So, download it and address the topic impactfully.
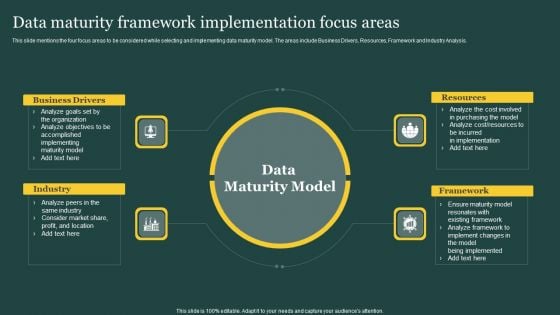
Data Maturity Framework Implementation Focus Areas Ppt PowerPoint Presentation File Information PDF
This slide mentions the four focus areas to be considered while selecting and implementing data maturity model. The areas include Business Drivers, Resources, Framework and Industry Analysis. Presenting Data Maturity Framework Implementation Focus Areas Ppt PowerPoint Presentation File Information PDF to dispense important information. This template comprises four stages. It also presents valuable insights into the topics including Business Drivers, Industry, Resources, Framework. This is a completely customizable PowerPoint theme that can be put to use immediately. So, download it and address the topic impactfully.
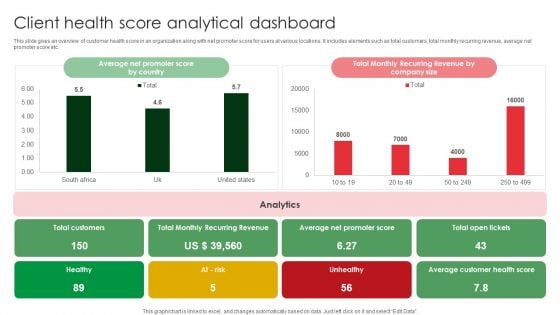
Client Health Score Analytical Dashboard Rules PDF
This slide gives an overview of customer health score in an organization along with net promoter score for users at various locations. It includes elements such as total customers, total monthly recurring revenue, average net promoter score etc. Showcasing this set of slides titled Client Health Score Analytical Dashboard Rules PDF. The topics addressed in these templates are Average Net Promoter, Average Customer Health, Healthy. All the content presented in this PPT design is completely editable. Download it and make adjustments in color, background, font etc. as per your unique business setting.

Technology And Skills Matrix For Data Interpretation And Evaluation Lifecycle Phases Slides PDF
This slide covers the matrix representing technology and skills required for each phase of data analytics and assessment infrastructure lifecycle. It includes four phases of analytics infrastructure lifecycle such as ingestion, data quality and governance, data lake administration and analytics. Presenting Technology And Skills Matrix For Data Interpretation And Evaluation Lifecycle Phases Slides PDF to dispense important information. This template comprises four stages. It also presents valuable insights into the topics including Ingestion, Data Lake Administration, Data Quality And Governance. This is a completely customizable PowerPoint theme that can be put to use immediately. So, download it and address the topic impactfully.
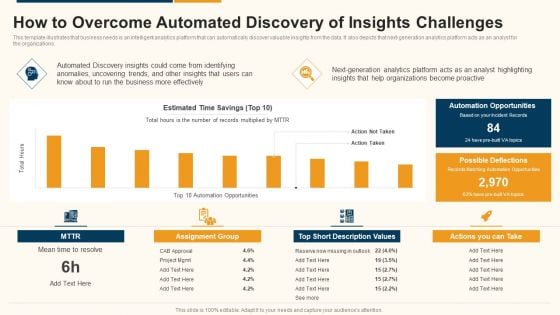
Data Interpretation And Analysis Playbook How To Overcome Automated Discovery Of Insights Challenges Rules PDF
This template illustrates that business needs is an intelligent analytics platform that can automatically discover valuable insights from the data. It also depicts that next-generation analytics platform acts as an analyst for the organizations. Deliver an awe inspiring pitch with this creative data interpretation and analysis playbook how to overcome automated discovery of insights challenges rules pdf bundle. Topics like opportunities, organizations, analytics, business can be discussed with this completely editable template. It is available for immediate download depending on the needs and requirements of the user.
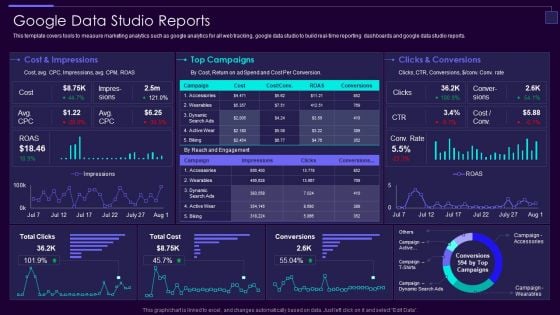
Social Media Brand Promotion Instructions Playbook Google Data Studio Reports Formats PDF
This template covers tools to measure marketing analytics such as google analytics for all web tracking, google data studio to build real-time reporting dashboards and google data studio reports.Deliver an awe inspiring pitch with this creative Social Media Brand Promotion Instructions Playbook Google Data Studio Reports Formats PDF bundle. Topics like Conversions, Cost And Impressions, Top Campaigns can be discussed with this completely editable template. It is available for immediate download depending on the needs and requirements of the user.
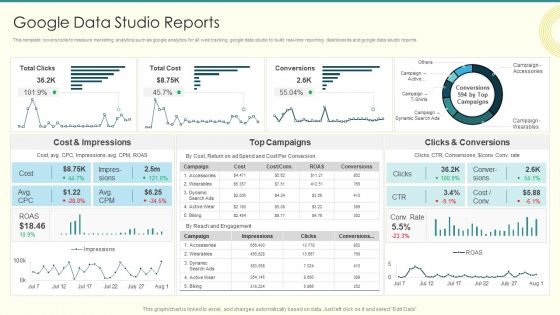
Security And Performance Digital Marketing Google Data Studio Reports Brochure PDF
This template covers tools to measure marketing analytics such as google analytics for all web tracking, google data studio to build real-time reporting dashboards and google data studio reports.Deliver an awe inspiring pitch with this creative Security And Performance Digital Marketing Google Data Studio Reports Brochure PDF bundle. Topics like Impressions, Clicks Conversions, Cost Impressions can be discussed with this completely editable template. It is available for immediate download depending on the needs and requirements of the user.
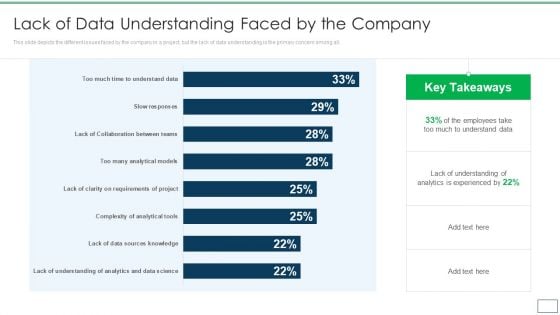
Departments Of Visualization Research Lack Of Data Understanding Faced By The Company Download PDF
This slide depicts the different issues faced by the company in a project, but the lack of data understanding is the primary concern among all.Deliver an awe inspiring pitch with this creative Departments Of Visualization Research Lack Of Data Understanding Faced By The Company Download PDF bundle. Topics like Analytics Is Experienced, Lack Of Understanding, Analytics And Data Science can be discussed with this completely editable template. It is available for immediate download depending on the needs and requirements of the user.
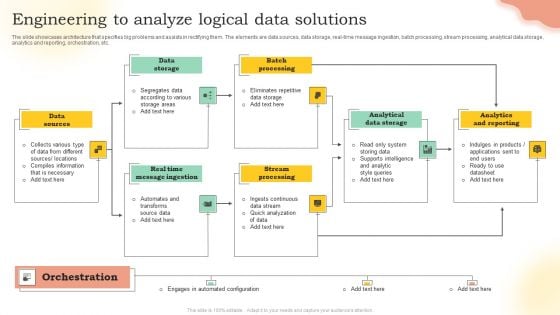
Engineering To Analyze Logical Data Solutions Ppt PowerPoint Presentation Gallery Design Inspiration PDF
The slide showcases architecture that specifies big problems and assists in rectifying them. The elements are data sources, data storage, real-time message ingestion, batch processing, stream processing, analytical data storage, analytics and reporting, orchestration, etc. Presenting Engineering To Analyze Logical Data Solutions Ppt PowerPoint Presentation Gallery Design Inspiration PDF to dispense important information. This template comprises seven stages. It also presents valuable insights into the topics including Data Storage, Batch Processing, Analytical Data Storage, Analytics And Reporting. This is a completely customizable PowerPoint theme that can be put to use immediately. So, download it and address the topic impactfully.
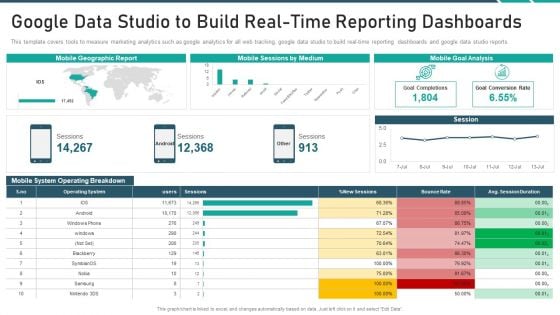
Online Promotion Playbook Google Data Studio To Build Real Time Reporting Dashboards Topics PDF
This template covers tools to measure marketing analytics such as google analytics for all web tracking, google data studio to build real time reporting dashboards and google data studio reports. Deliver and pitch your topic in the best possible manner with this online promotion playbook google data studio to build real time reporting dashboards topics pdf. Use them to share invaluable insights on google data studio to build real time reporting dashboards and impress your audience. This template can be altered and modified as per your expectations. So, grab it now.
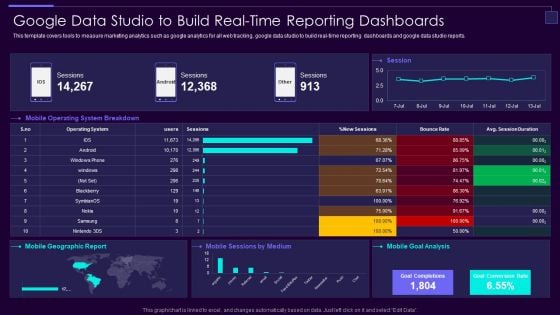
Social Media Brand Promotion Instructions Playbook Google Data Studio To Build Real Time Formats PDF
This template covers tools to measure marketing analytics such as google analytics for all web tracking, google data studio to build real-time reporting dashboards and google data studio reports.Deliver and pitch your topic in the best possible manner with this Social Media Brand Promotion Instructions Playbook Google Data Studio To Build Real Time Formats PDF Use them to share invaluable insights on Data Studio, Build Real Time, Reporting Dashboards and impress your audience. This template can be altered and modified as per your expectations. So, grab it now.
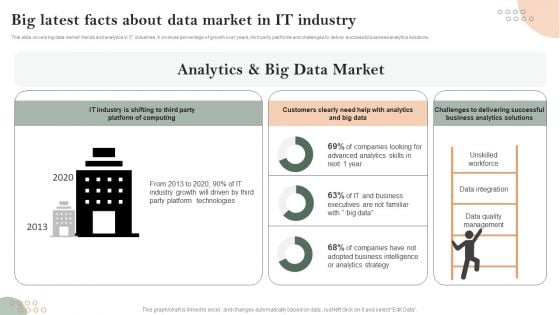
Big Latest Facts About Data Market In IT Industry Pictures PDF
This slide covers big data market trends and analytics in IT industries. It involves percentage of growth over years, third party platforms and challenges to deliver successful business analytics solutions. Showcasing this set of slides titled Big Latest Facts About Data Market In IT Industry Pictures PDF. The topics addressed in these templates are Unskilled Workforce, Data Integration, Data Quality Management. All the content presented in this PPT design is completely editable. Download it and make adjustments in color, background, font etc. as per your unique business setting.
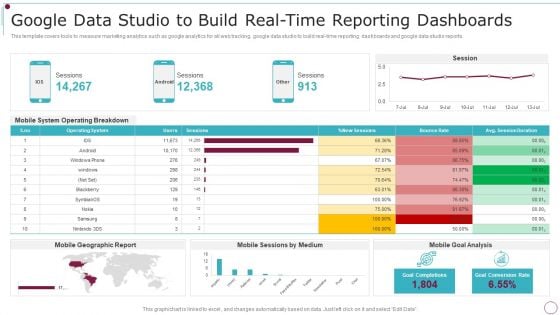
Playbook For Content Advertising Google Data Studio To Build Real Time Reporting Dashboards Formats PDF
This template covers tools to measure marketing analytics such as google analytics for all web tracking, google data studio to build real-time reporting dashboards and google data studio reports. Deliver and pitch your topic in the best possible manner with this Playbook For Content Advertising Google Data Studio To Build Real Time Reporting Dashboards Formats PDF. Use them to share invaluable insights on Mobile System, Operating Breakdown, Geographic Report and impress your audience. This template can be altered and modified as per your expectations. So, grab it now.

Security And Performance Digital Marketing Google Data Studio To Build Realtime Reporting Dashboards Information PDF
This template covers tools to measure marketing analytics such as google analytics for all web tracking, google data studio to build real time reporting dashboards and google data studio reports.Deliver an awe inspiring pitch with this creative Security And Performance Digital Marketing Google Data Studio To Build Realtime Reporting Dashboards Information PDF bundle. Topics like Operating Breakdown, Session Duration, Goal Completions can be discussed with this completely editable template. It is available for immediate download depending on the needs and requirements of the user.

Healthcare Data Mining System Approaches Ppt PowerPoint Presentation Ideas Gridlines PDF
This slide mentions data mining system approaches applicable in medical and healthcare industry. It includes Analytics system, Content system, Deployment system. Persuade your audience using this Healthcare Data Mining System Approaches Ppt PowerPoint Presentation Ideas Gridlines PDF. This PPT design covers three stages, thus making it a great tool to use. It also caters to a variety of topics including Content System, Deployment System, Analytics System. Download this PPT design now to present a convincing pitch that not only emphasizes the topic but also showcases your presentation skills.

Data Assimilation Business Intelligence Trends For Tools Being Used In Industry Ppt Summary Graphics Design PDF
Deliver and pitch your topic in the best possible manner with this data assimilation business intelligence trends for tools being used in industry ppt summary graphics design pdf. Use them to share invaluable insights on self service bi, data visualization, powerful analytics and impress your audience. This template can be altered and modified as per your expectations. So, grab it now.
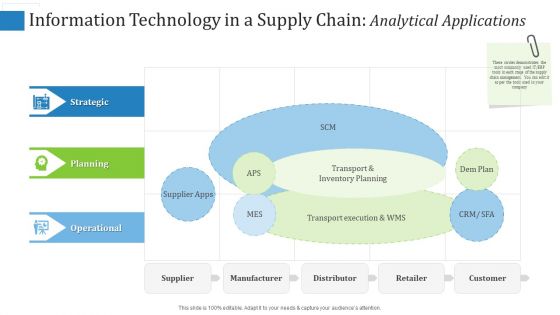
Information Technology In A Supply Chain Analytical Applications Ppt Infographics Pictures PDF
Deliver an awe-inspiring pitch with this creative information technology in a supply chain analytical applications ppt infographics pictures pdf. bundle. Topics like operational, planning, strategic, supplier apps can be discussed with this completely editable template. It is available for immediate download depending on the needs and requirements of the user.
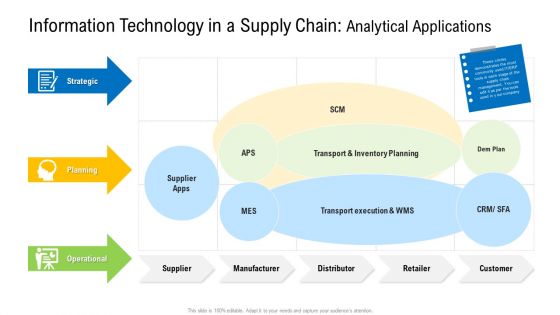
Viable Logistics Network Management Information Technology In A Supply Chain Analytical Applications Ideas PDF
Deliver and pitch your topic in the best possible manner with this viable logistics network management information technology in a supply chain analytical applications ideas pdf. Use them to share invaluable insights on important characteristics of the eoq cost function and impress your audience. This template can be altered and modified as per your expectations. So, grab it now.
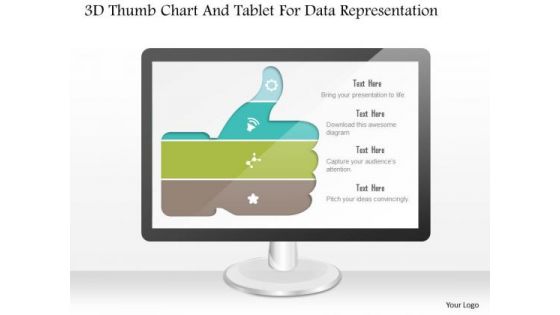
Business Diagram 3d Thumb Chart And Tablet For Data Representation PowerPoint Slide
This business diagram displays graphic of 3d thumb up chart with icons on computer screen. This business slide contains the concept of business data representation. Use this diagram to build professional presentations for your viewers.
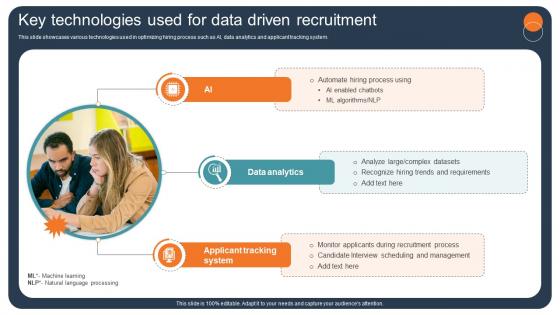
Transforming Recruitment Process Key Technologies Used For Data Driven Recruitment CRP DK SS
This slide showcases various technologies used in optimizing hiring process such as AI, data analytics and applicant tracking system. Retrieve professionally designed Transforming Recruitment Process Key Technologies Used For Data Driven Recruitment CRP DK SS to effectively convey your message and captivate your listeners. Save time by selecting pre-made slideshows that are appropriate for various topics, from business to educational purposes. These themes come in many different styles, from creative to corporate, and all of them are easily adjustable and can be edited quickly. Access them as PowerPoint templates or as Google Slides themes. You do not have to go on a hunt for the perfect presentation because Slidegeeks got you covered from everywhere. This slide showcases various technologies used in optimizing hiring process such as AI, data analytics and applicant tracking system.
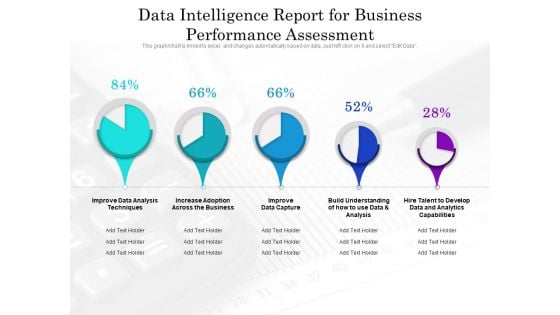
data intelligence report for business performance assessment ppt powerpoint presentation professional smartart pdf
Presenting this set of slides with name data intelligence report for business performance assessment ppt powerpoint presentation professional smartart pdf. The topics discussed in these slides are improve data analysis techniques, increase adoption across the business, improve data capture, build understanding of how to use data and analysis, hire talent to develop data and analytics capabilities. This is a completely editable PowerPoint presentation and is available for immediate download. Download now and impress your audience.
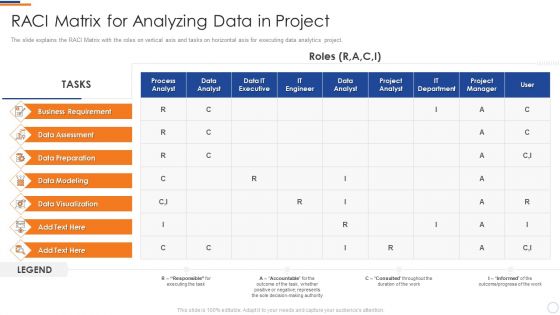
Business Intelligence And Big RACI Matrix For Analyzing Data In Project Themes PDF
The slide explains the RACI Matrix with the roles on vertical axis and tasks on horizontal axis for executing data analytics project. Deliver and pitch your topic in the best possible manner with this business intelligence and big raci matrix for analyzing data in project themes pdf. Use them to share invaluable insights on business requirement, data assessment, data preparation and impress your audience. This template can be altered and modified as per your expectations. So, grab it now.
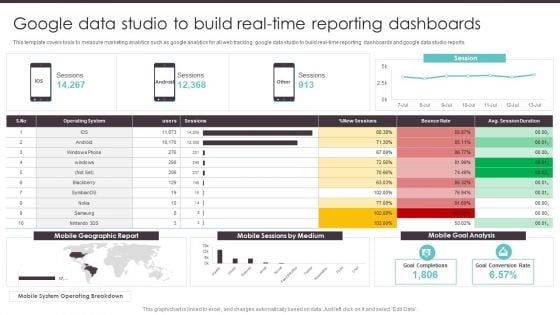
Business To Business Digital Google Data Studio To Build Real Time Reporting Summary PDF
This template covers tools to measure marketing analytics such as google analytics for all web tracking, google data studio to build real-time reporting dashboards and google data studio reports. Find highly impressive Business To Business Digital Google Data Studio To Build Real Time Reporting Summary PDF on Slidegeeks to deliver a meaningful presentation. You can save an ample amount of time using these presentation templates. No need to worry to prepare everything from scratch because Slidegeeks experts have already done a huge research and work for you. You need to download Business To Business Digital Google Data Studio To Build Real Time Reporting Summary PDF for your upcoming presentation. All the presentation templates are 100 percent editable and you can change the color and personalize the content accordingly. Download now.
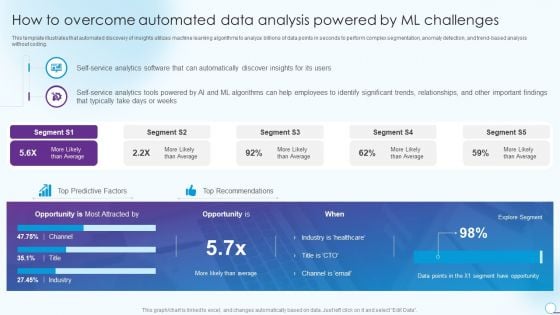
How To Overcome Automated Data Analysis Powered By Ml Challenges Elements PDF
This template illustrates that automated discovery of insights utilizes machine learning algorithms to analyze billions of data points in seconds to perform complex segmentation, anomaly detection, and trend based analysis without coding. Deliver an awe inspiring pitch with this creative How To Overcome Automated Data Analysis Powered By Ml Challenges Elements PDF bundle. Topics like Opportunity, Average, Self Service Analytics can be discussed with this completely editable template. It is available for immediate download depending on the needs and requirements of the user.
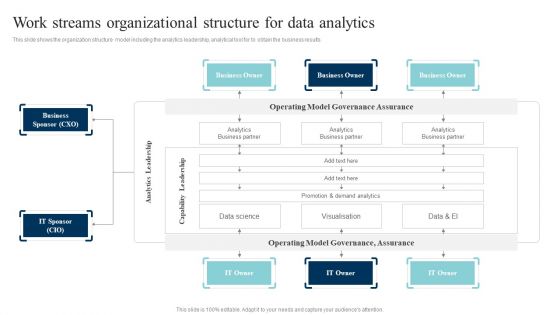
Data Evaluation And Processing Toolkit Work Streams Organizational Structure Sample PDF
This slide shows the organization structure model including the analytics leadership, analytical tool for to obtain the business results. This Data Evaluation And Processing Toolkit Work Streams Organizational Structure Sample PDF from Slidegeeks makes it easy to present information on your topic with precision. It provides customization options, so you can make changes to the colors, design, graphics, or any other component to create a unique layout. It is also available for immediate download, so you can begin using it right away. Slidegeeks has done good research to ensure that you have everything you need to make your presentation stand out. Make a name out there for a brilliant performance.
Team Performance Assessment Ppt Icon
This is a team performance assessment ppt icon. This is a eight stage process. The stages in this process are total rating, awesome replies, ok replies, bad replies, avg reply time, avg first reply time, avg handle time, replies time.
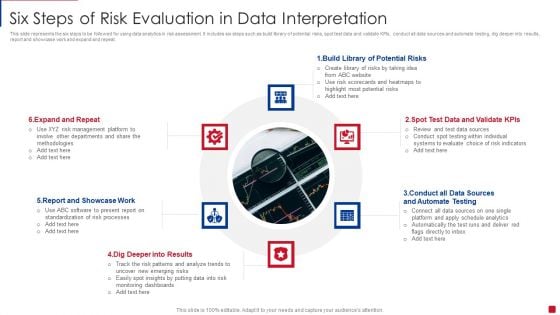
Six Steps Of Risk Evaluation In Data Interpretation Sources Brochure PDF
This slide represents the six steps to be followed for using data analytics in risk assessment. It includes six steps such as build library of potential risks, spot test data and validate KPIs, conduct all data sources and automate testing, dig deeper into results, report and showcase work and expand and repeat. Presenting Six Steps Of Risk Evaluation In Data Interpretation Sources Brochure PDF to dispense important information. This template comprises ten stages. It also presents valuable insights into the topics including Target Personas, Define The Questions, Define The Business Model. This is a completely customizable PowerPoint theme that can be put to use immediately. So, download it and address the topic impactfully.
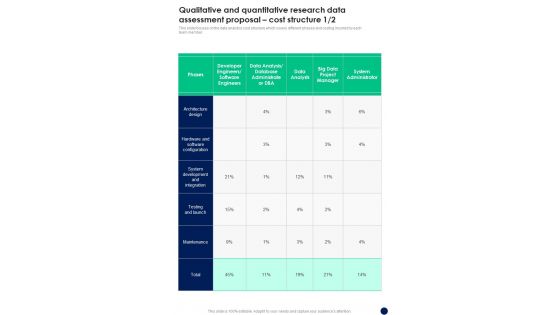
Qualitative And Quantitative Research Data Assessment Proposal Cost Structure One Pager Sample Example Document
This slide focuses on the data analytics cost structure which covers different phases and costing incurred by each team member. Presenting you an exemplary Qualitative And Quantitative Research Data Assessment Proposal Cost Structure One Pager Sample Example Document. Our one pager comprises all the must have essentials of an inclusive document. You can edit it with ease, as its layout is completely editable. With such freedom, you can tweak its design and other elements to your requirements. Download this Qualitative And Quantitative Research Data Assessment Proposal Cost Structure One Pager Sample Example Document brilliant piece now.
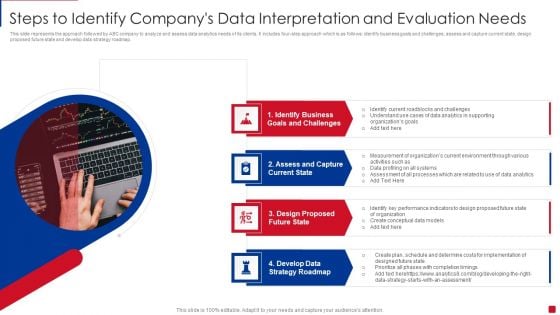
Steps To Identify Companys Data Interpretation And Evaluation Needs Portrait PDF
This slide represents the approach followed by ABC company to analyze and assess data analytics needs of its clients. It includes four step approach which is as follows identify business goals and challenges, assess and capture current state, design proposed future state and develop data strategy roadmap Presenting Steps To Identify Companys Data Interpretation And Evaluation Needs Portrait PDF to dispense important information. This template comprises four stages. It also presents valuable insights into the topics including Assess Current State, Business Goals Challenges, Design Future State. This is a completely customizable PowerPoint theme that can be put to use immediately. So, download it and address the topic impactfully.
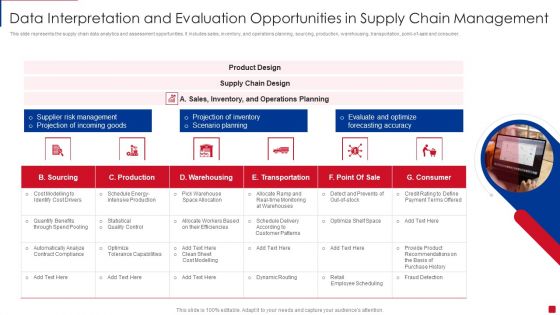
Data Interpretation And Evaluation Opportunities In Supply Chain Management Structure PDF
This slide represents the supply chain data analytics and assessment opportunities. It includes sales, inventory, and operations planning, sourcing, production, warehousing, transportation, point of sale and consumer. Presenting Data Interpretation And Evaluation Opportunities In Supply Chain Management Structure PDF to dispense important information. This template comprises six stages. It also presents valuable insights into the topics including Supplier Risk Management, Projection Of Incoming Goods, Projection Of Inventory. This is a completely customizable PowerPoint theme that can be put to use immediately. So, download it and address the topic impactfully.
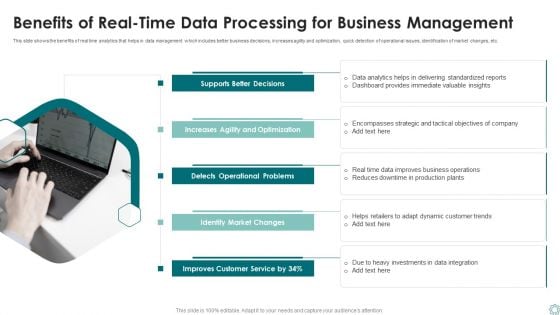
Benefits Of Real Time Data Processing For Business Management Ppt Layouts Show PDF
This slide shows the benefits of real time analytics that helps in data management which includes better business decisions, increases agility and optimization, quick detection of operational issues, identification of market changes, etc. Presenting Benefits Of Real Time Data Processing For Business Management Ppt Layouts Show PDF to dispense important information. This template comprises five stages. It also presents valuable insights into the topics including Supports Better Decisions, Detects Operational Problems, Identify Market Changes. This is a completely customizable PowerPoint theme that can be put to use immediately. So, download it and address the topic impactfully.
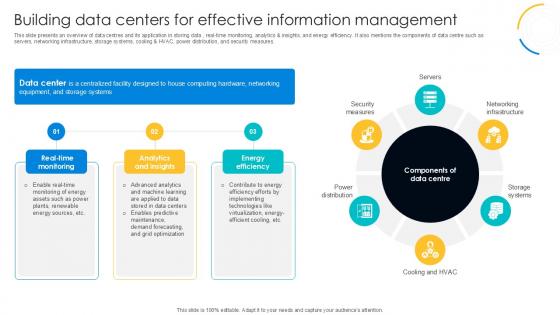
Building Data Centers For Effective Digital Transformation Journey PPT Slide DT SS V
This slide presents an overview of data centres and its application in storing data , real-time monitoring, analytics and insights, and energy efficiency. It also mentions the components of data centre such as servers, networking infrastructure, storage systems, cooling and HVAC, power distribution, and security measures. If you are looking for a format to display your unique thoughts, then the professionally designed Building Data Centers For Effective Digital Transformation Journey PPT Slide DT SS V is the one for you. You can use it as a Google Slides template or a PowerPoint template. Incorporate impressive visuals, symbols, images, and other charts. Modify or reorganize the text boxes as you desire. Experiment with shade schemes and font pairings. Alter, share or cooperate with other people on your work. Download Building Data Centers For Effective Digital Transformation Journey PPT Slide DT SS V and find out how to give a successful presentation. Present a perfect display to your team and make your presentation unforgettable. This slide presents an overview of data centres and its application in storing data , real-time monitoring, analytics and insights, and energy efficiency. It also mentions the components of data centre such as servers, networking infrastructure, storage systems, cooling and HVAC, power distribution, and security measures.
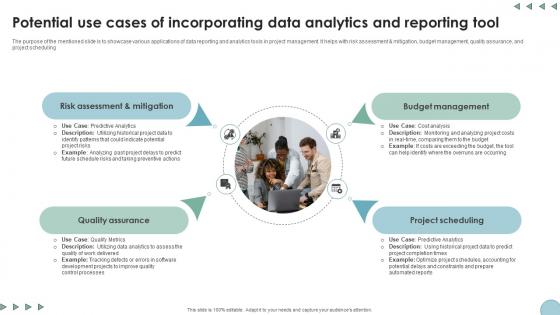
Potential Use Cases Of Incorporating Data Digital Transformation In Project Management
The purpose of the mentioned slide is to showcase various applications of data reporting and analytics tools in project management. It helps with risk assessment and mitigation, budget management, quality assurance, and project scheduling. Are you searching for a Potential Use Cases Of Incorporating Data Digital Transformation In Project Management that is uncluttered, straightforward, and original Its easy to edit, and you can change the colors to suit your personal or business branding. For a presentation that expresses how much effort you have put in, this template is ideal With all of its features, including tables, diagrams, statistics, and lists, its perfect for a business plan presentation. Make your ideas more appealing with these professional slides. Download Potential Use Cases Of Incorporating Data Digital Transformation In Project Management from Slidegeeks today. The purpose of the mentioned slide is to showcase various applications of data reporting and analytics tools in project management. It helps with risk assessment and mitigation, budget management, quality assurance, and project scheduling.

Four Stages Of Strategic Framework For Data Management Strategy Ppt Outline Samples PDF
This slide showcases steps to control and organize business analytics which is increasingly driving decision-making in organizations. It includes information about identify, assess, propose and plot out. Presenting Four Stages Of Strategic Framework For Data Management Strategy Ppt Outline Samples PDF to dispense important information. This template comprises four stages. It also presents valuable insights into the topics including Management Team, Business Goals, Increase Customer. This is a completely customizable PowerPoint theme that can be put to use immediately. So, download it and address the topic impactfully.
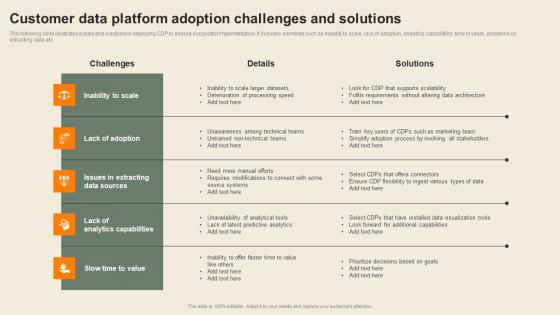
Customer Data Platform Adoption Challenges Usability Of CDP Software Tool Guidelines Pdf
The following slide illustrates issues and solutions in deploying CDP to ensure successful implementation. It includes elements such as inability to scale, lack of adoption, analytics capabilities, time to value, problems on extracting data etc. Whether you have daily or monthly meetings, a brilliant presentation is necessary. Customer Data Platform Adoption Challenges Usability Of CDP Software Tool Guidelines Pdf can be your best option for delivering a presentation. Represent everything in detail using Customer Data Platform Adoption Challenges Usability Of CDP Software Tool Guidelines Pdf and make yourself stand out in meetings. The template is versatile and follows a structure that will cater to your requirements. All the templates prepared by Slidegeeks are easy to download and edit. Our research experts have taken care of the corporate themes as well. So, give it a try and see the results. The following slide illustrates issues and solutions in deploying CDP to ensure successful implementation. It includes elements such as inability to scale, lack of adoption, analytics capabilities, time to value, problems on extracting data etc.
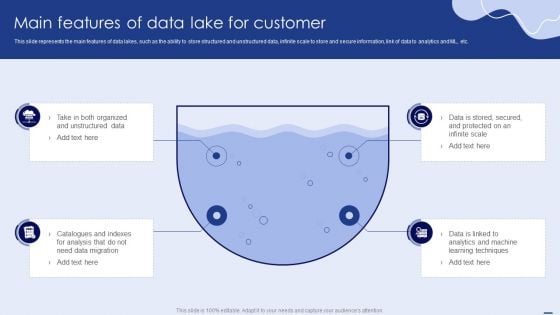
Main Features Of Data Lake For Customer Ppt PowerPoint Presentation Diagram PDF
This slide represents the main features of data lakes, such as the ability to store structured and unstructured data, infinite scale to store and secure information, link of data to analytics and ML, etc. Slidegeeks has constructed Main Features Of Data Lake For Customer Ppt PowerPoint Presentation Diagram PDF after conducting extensive research and examination. These presentation templates are constantly being generated and modified based on user preferences and critiques from editors. Here, you will find the most attractive templates for a range of purposes while taking into account ratings and remarks from users regarding the content. This is an excellent jumping off point to explore our content and will give new users an insight into our top-notch PowerPoint Templates.
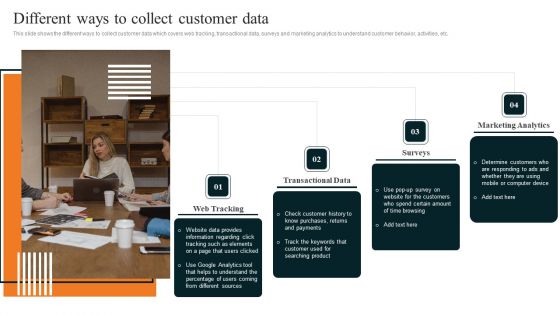
Techniques To Decrease Customer Different Ways To Collect Customer Data Professional PDF
This slide shows the different ways to collect customer data which covers web tracking, transactional data, surveys and marketing analytics to understand customer behavior, activities, etc. Whether you have daily or monthly meetings, a brilliant presentation is necessary. Techniques To Decrease Customer Different Ways To Collect Customer Data Professional PDF can be your best option for delivering a presentation. Represent everything in detail using Techniques To Decrease Customer Different Ways To Collect Customer Data Professional PDF and make yourself stand out in meetings. The template is versatile and follows a structure that will cater to your requirements. All the templates prepared by Slidegeeks are easy to download and edit. Our research experts have taken care of the corporate themes as well. So, give it a try and see the results.
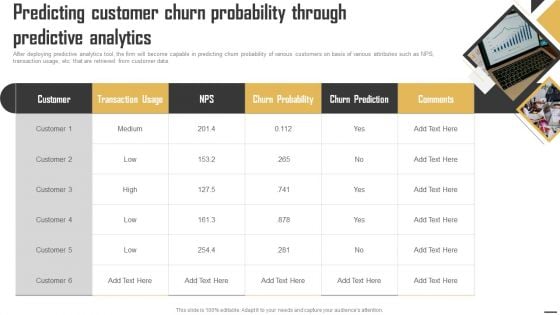
Data Monetization And Management Predicting Customer Churn Probability Through Formats PDF
After deploying predictive analytics tool, the firm will become capable in predicting churn probability of various customers on basis of various attributes such as NPS, transaction usage, etc. that are retrieved from customer data. Are you searching for a Data Monetization And Management Predicting Customer Churn Probability Through Formats PDF that is uncluttered, straightforward, and original Its easy to edit, and you can change the colors to suit your personal or business branding. For a presentation that expresses how much effort youve put in, this template is ideal With all of its features, including tables, diagrams, statistics, and lists, its perfect for a business plan presentation. Make your ideas more appealing with these professional slides. Download Data Monetization And Management Predicting Customer Churn Probability Through Formats PDF from Slidegeeks today.
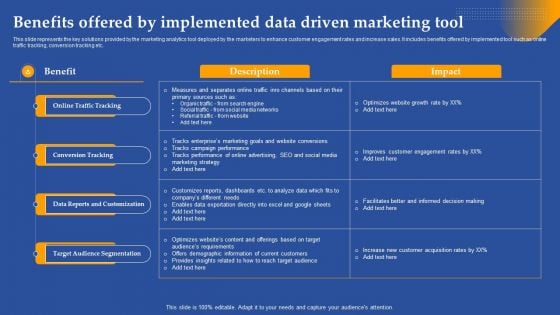
Benefits Offered By Implemented Data Driven Marketing Tool Ppt Inspiration Slides PDF
This slide represents the key solutions provided by the marketing analytics tool deployed by the marketers to enhance customer engagement rates and increase sales. It includes benefits offered by implemented tool such as online traffic tracking, conversion tracking etc. If you are looking for a format to display your unique thoughts, then the professionally designed Benefits Offered By Implemented Data Driven Marketing Tool Ppt Inspiration Slides PDF is the one for you. You can use it as a Google Slides template or a PowerPoint template. Incorporate impressive visuals, symbols, images, and other charts. Modify or reorganize the text boxes as you desire. Experiment with shade schemes and font pairings. Alter, share or cooperate with other people on your work. Download Benefits Offered By Implemented Data Driven Marketing Tool Ppt Inspiration Slides PDF and find out how to give a successful presentation. Present a perfect display to your team and make your presentation unforgettable.
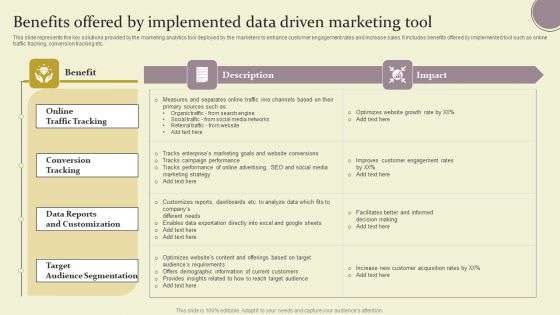
Benefits Offered By Implemented Data Driven Marketing Tool Ppt Ideas Slides PDF
This slide represents the key solutions provided by the marketing analytics tool deployed by the marketers to enhance customer engagement rates and increase sales. It includes benefits offered by implemented tool such as online traffic tracking, conversion tracking etc. If you are looking for a format to display your unique thoughts, then the professionally designed Benefits Offered By Implemented Data Driven Marketing Tool Ppt Ideas Slides PDF is the one for you. You can use it as a Google Slides template or a PowerPoint template. Incorporate impressive visuals, symbols, images, and other charts. Modify or reorganize the text boxes as you desire. Experiment with shade schemes and font pairings. Alter, share or cooperate with other people on your work. Download Benefits Offered By Implemented Data Driven Marketing Tool Ppt Ideas Slides PDF and find out how to give a successful presentation. Present a perfect display to your team and make your presentation unforgettable.
Data Analysis Reports Under Magnifying Glass Ppt Powerpoint Presentation Summary Slideshow
This is a data analysis reports under magnifying glass ppt powerpoint presentation summary slideshow. This is a three stage process. The stages in this process are data visualization icon, data management icon.
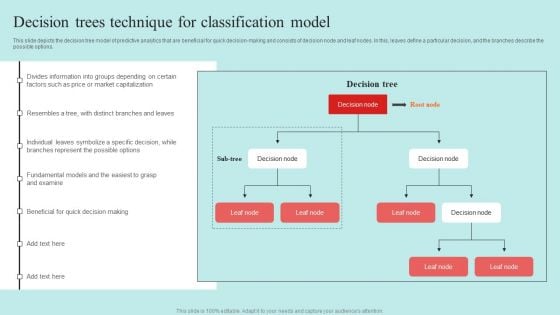
Predictive Data Model Decision Trees Technique For Classification Model Topics PDF
Magnifying Ppt PowerPoint Presentation Icon Layout Ideas
This is a magnifying ppt powerpoint presentation icon layout ideas. This is a five stage process. The stages in this process are magnifying, business, marketing, icons, process.
Magnifying Glass Ppt PowerPoint Presentation Icon Topics
This is a magnifying glass ppt powerpoint presentation icon topics. This is a three stage process. The stages in this process are magnifying glass, technology, business, marketing, icons.
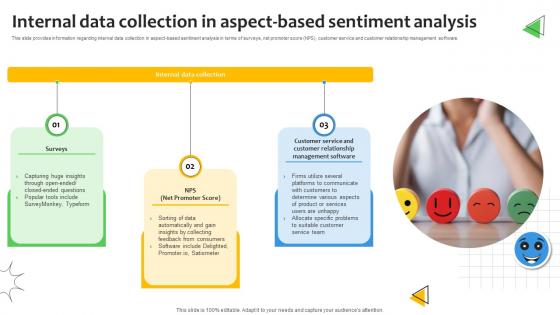
Internal Data Collection In Aspect Based Sentiment Analysis Demystified Understanding AI SS V
This slide provides information regarding internal data collection in aspect-based sentiment analysis in terms of surveys, net promoter score NPS, customer service and customer relationship management software. Presenting this PowerPoint presentation, titled Icons Slide Sentiment Analysis Demystified Understanding Textual Emotions And Opinions AI SS V, with topics curated by our researchers after extensive research. This editable presentation is available for immediate download and provides attractive features when used. Download now and captivate your audience. Presenting this Icons Slide Sentiment Analysis Demystified Understanding Textual Emotions And Opinions AI SS V. Our researchers have carefully researched and created these slides with all aspects taken into consideration. This is a completely customizable Icons Slide Sentiment Analysis Demystified Understanding Textual Emotions And Opinions AI SS V that is available for immediate downloading. Download now and make an impact on your audience. Highlight the attractive features available with our PPTs. This slide provides information regarding internal data collection in aspect-based sentiment analysis in terms of surveys, net promoter score NPS, customer service and customer relationship management software.
Magnifying Glass Ppt PowerPoint Presentation Icon Inspiration
This is a magnifying glass ppt powerpoint presentation icon inspiration. This is a six stage process. The stages in this process are magnifying glass, technology, business, marketing, process.
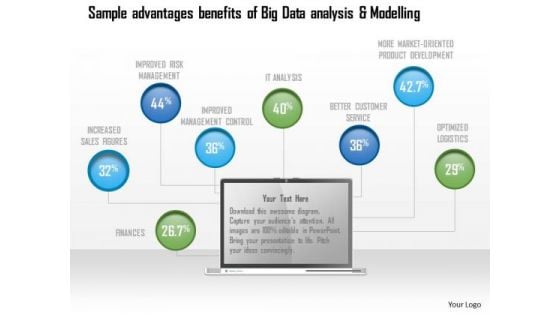
Business Diagram Sample Advantages Benefits Of Big Data Analysis And Modelling Ppt Slide
Explain the concept of sample advantages and benefits of big data analysis with this unique diagram. This slide contains the graphic of data icons. Use this slide to present data analysis and modeling related topics in any presentation.
Successful Quality Assurance Transition Techniques To Enhance Product Quality Aspects Of Qa Transformation In The Company Icons PDF
This slide shows the various aspects of QA Transformation in the company such as enhancing Customer Experience, Lifecycle Automation and Advanced Analytics. Presenting successful quality assurance transition techniques to enhance product quality aspects of qa transformation in the company icons pdf to provide visual cues and insights. Share and navigate important information on three stages that need your due attention. This template can be used to pitch topics like enhancing the customer experience, lifecycle automation, advanced analytics. In addtion, this PPT design contains high resolution images, graphics, etc, that are easily editable and available for immediate download.
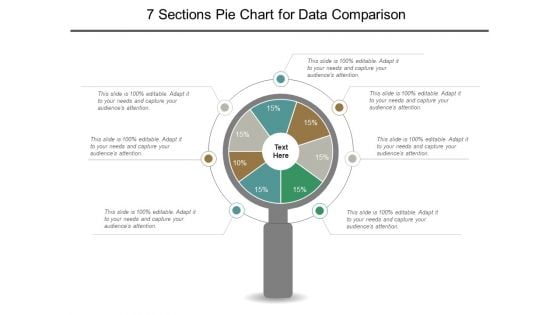
7 Sections Pie Chart For Data Comparison Ppt PowerPoint Presentation File Graphics Template
This is a 7 sections pie chart for data comparison ppt powerpoint presentation file graphics template. This is a seven stage process. The stages in this process are 6 piece pie chart, 6 segment pie chart, 6 parts pie chart.
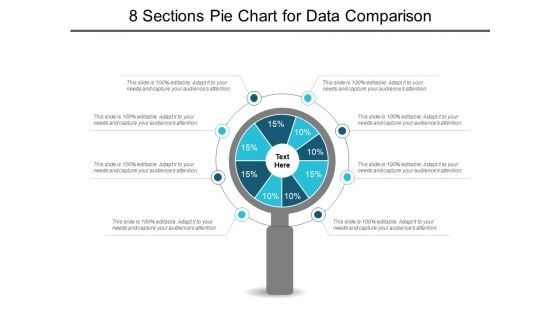
8 Sections Pie Chart For Data Comparison Ppt PowerPoint Presentation Show Slideshow
This is a 8 sections pie chart for data comparison ppt powerpoint presentation show slideshow. This is a eight stage process. The stages in this process are 6 piece pie chart, 6 segment pie chart, 6 parts pie chart.
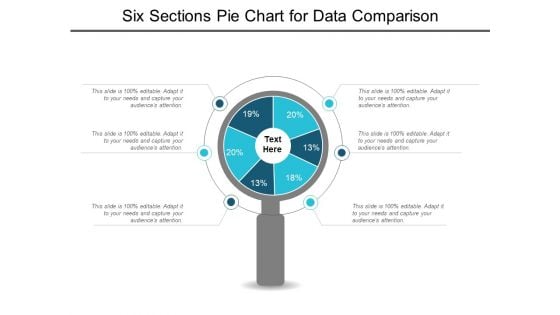
Six Sections Pie Chart For Data Comparison Ppt PowerPoint Presentation Styles Graphics Example
This is a six sections pie chart for data comparison ppt powerpoint presentation styles graphics example. This is a six stage process. The stages in this process are 6 piece pie chart, 6 segment pie chart, 6 parts pie chart.
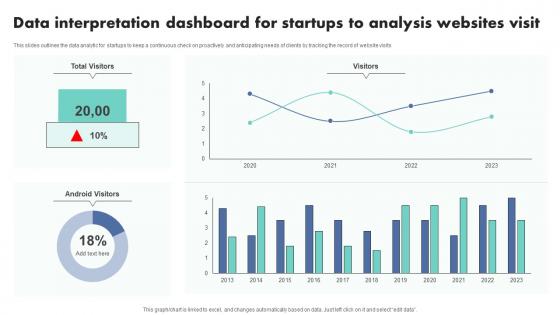
Data Interpretation Dashboard For Startups To Analysis Websites Visit Themes Pdf
This slides outlines the data analytic for startups to keep a continuous check on proactively and anticipating needs of clients by tracking the record of website visits.Showcasing this set of slides titled Data Interpretation Dashboard For Startups To Analysis Websites Visit Themes Pdf The topics addressed in these templates are Data Interpretation, Dashboard Startups, Analysis Websites Visit All the content presented in this PPT design is completely editable. Download it and make adjustments in color, background, font etc. as per your unique business setting. This slides outlines the data analytic for startups to keep a continuous check on proactively and anticipating needs of clients by tracking the record of website visits.
Data Interpretation And Analysis Playbook Ppt PowerPoint Presentation Complete Deck With Slides
This complete deck acts as a great communication tool. It helps you in conveying your business message with personalized sets of graphics, icons etc. Comprising a set of thirty nine slides, this complete deck can help you persuade your audience. It also induces strategic thinking as it has been thoroughly researched and put together by our experts. Not only is it easily downloadable but also editable. The color, graphics, theme any component can be altered to fit your individual needs. So grab it now.
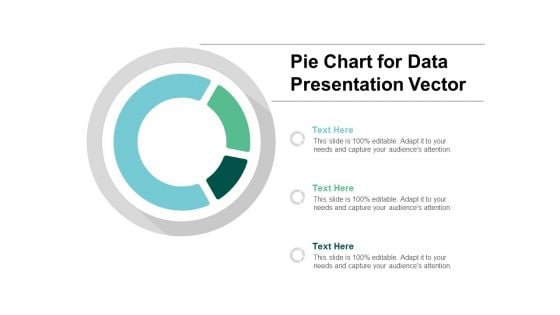
Pie Chart For Data Presentation Vector Ppt PowerPoint Presentation Summary Files
Presenting this set of slides with name pie chart for data presentation vector ppt powerpoint presentation summary files. The topics discussed in these slides are data visualization icon, research analysis, business focus. This is a completely editable PowerPoint presentation and is available for immediate download. Download now and impress your audience.
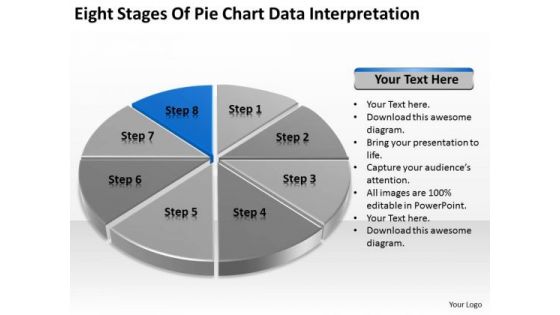
Eight Stages Of Pie Chart Data Interpretation Detailed Business Plan PowerPoint Templates
We present our eight stages of pie chart data interpretation detailed business plan PowerPoint templates.Download and present our Competition PowerPoint Templates because You can Stir your ideas in the cauldron of our PowerPoint Templates and Slides. Cast a magic spell on your audience. Download and present our Marketing PowerPoint Templates because You should Kick up a storm with our PowerPoint Templates and Slides. The heads of your listeners will swirl with your ideas. Download and present our Arrows PowerPoint Templates because Your ideas provide food for thought. Our PowerPoint Templates and Slides will help you create a dish to tickle the most discerning palate. Present our Circle Charts PowerPoint Templates because You can Stir your ideas in the cauldron of our PowerPoint Templates and Slides. Cast a magic spell on your audience. Download our Business PowerPoint Templates because You can Score a slam dunk with our PowerPoint Templates and Slides. Watch your audience hang onto your every word.Use these PowerPoint slides for presentations relating to chart, graph, pie, 3d, diagram, graphic, icon, control, business, data, profit, market, sales, display, corporate, concept, render, success, presentation, finance, report, marketing, accounting, management, piece, strategy, money, growth, company, competition, progress, account, sheet, part, information, investment, improvement, banking, index, financial, reflect, results, performance, exchange. The prominent colors used in the PowerPoint template are Blue, Black, Gray. Exult in the comfort of our Eight Stages Of Pie Chart Data Interpretation Detailed Business Plan PowerPoint Templates. Experience the convenience they deliver.
Issues And Impact Of Failure Mode And Effects Analysis Dashboard Process Failure Mode Effects Analysis PFMEA Icons PDF
Deliver and pitch your topic in the best possible manner with this Issues And Impact Of Failure Mode And Effects Analysis Dashboard Process Failure Mode Effects Analysis PFMEA Icons PDF. Use them to share invaluable insights on Operator Instructions, Operator Instructions, Recommended Actions and impress your audience. This template can be altered and modified as per your expectations. So, grab it now.
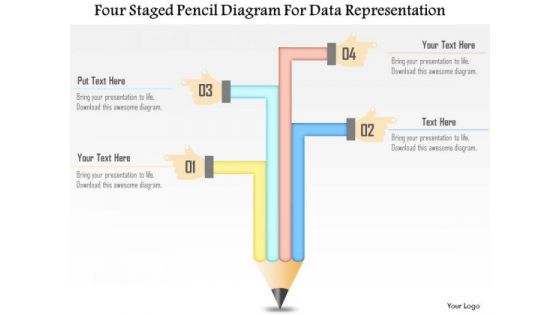
Business Diagram Four Staged Pencil Diagram For Data Representation Presentation Template
This business diagram has been designed with four staged pencil chart. This slide suitable for data representation. You can also use this slide to present four steps of any business process. Use this diagram to present your views in a wonderful manner.
Analysis Plan For E Commerce Promotion Tactics Content Performance Tracking Dashboard For Social Media Channels Icons PDF
This slide indicates the content performance tracking dashboard for social media channels providing information regarding the total number of posts, engagement rate, audience sentiments and multiple hashtags performance. Formulating a presentation can take up a lot of effort and time, so the content and message should always be the primary focus. The visuals of the PowerPoint can enhance the presenters message, so our Analysis Plan For E Commerce Promotion Tactics Content Performance Tracking Dashboard For Social Media Channels Icons PDF was created to help save time. Instead of worrying about the design, the presenter can concentrate on the message while our designers work on creating the ideal templates for whatever situation is needed. Slidegeeks has experts for everything from amazing designs to valuable content, we have put everything into Analysis Plan For E Commerce Promotion Tactics Content Performance Tracking Dashboard For Social Media Channels Icons PDF
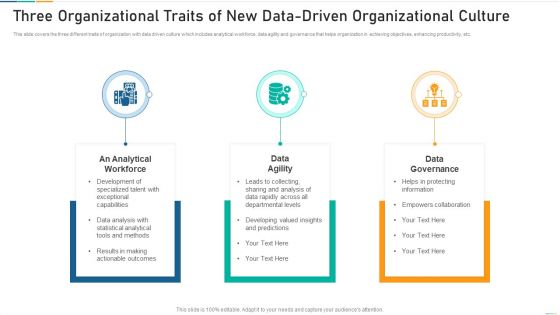
Three Organizational Traits Of New Data Driven Organizational Culture Themes PDF
Persuade your audience using this three organizational traits of new data driven organizational culture themes pdf. This PPT design covers three stages, thus making it a great tool to use. It also caters to a variety of topics including data agility, data governance, an analytical workforce. Download this PPT design now to present a convincing pitch that not only emphasizes the topic but also showcases your presentation skills.
Table Of Contents For Providing HR Service To Improve Management Capabilities And Organizing HR Workflow Procedure Icons PDF
Deliver and pitch your topic in the best possible manner with this table of contents for providing hr service to improve management capabilities and organizing hr workflow procedure icons pdf. Use them to share invaluable insights on technical components, human resources services, dashboard, hr service delivery model and impress your audience. This template can be altered and modified as per your expectations. So, grab it now.
Case Competition Inflated Fuel Price In Logistics Firm Logistics Dashboard For XYZ Logistic Company Product Icons PDF
The slide shows the logistic measurement dashboard for measuring order status, total orders, overdue shipments, global financial performance etc. Deliver and pitch your topic in the best possible manner with this case competition inflated fuel price in logistics firm logistics dashboard for xyz logistic company product icons pdf. Use them to share invaluable insights on overdue to ship, overdue shipments, open pos, late vendor shipments and impress your audience. This template can be altered and modified as per your expectations. So, grab it now.
Acquiring Clients Through Search Engine And Native Ads Dashboard To Track Website Traffic During Performance Icons PDF
This slide showcases dashboard that can help marketers to track the website traffic during execution of performance marketing activities. Its key elements are organic sessions, organic page views, inorganic sessions by month etc. Slidegeeks is here to make your presentations a breeze with Acquiring Clients Through Search Engine And Native Ads Dashboard To Track Website Traffic During Performance Icons PDF With our easy to use and customizable templates, you can focus on delivering your ideas rather than worrying about formatting. With a variety of designs to choose from, you are sure to find one that suits your needs. And with animations and unique photos, illustrations, and fonts, you can make your presentation pop. So whether you are giving a sales pitch or presenting to the board, make sure to check out Slidegeeks first.
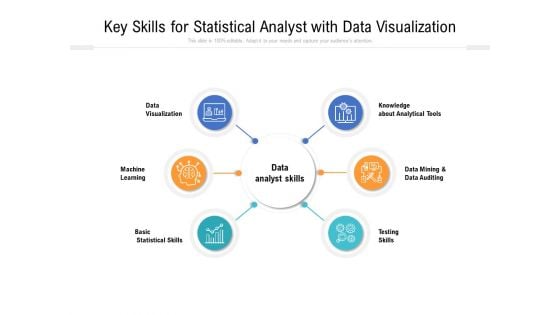
Key Skills For Statistical Analyst With Data Visualization Ppt PowerPoint Presentation Gallery Elements PDF
Presenting key skills for statistical analyst with data visualization ppt powerpoint presentation gallery elements pdf. to dispense important information. This template comprises six stages. It also presents valuable insights into the topics including machine, learning, statistical skills analyst, testing skills, analytical tools, knowledge. This is a completely customizable PowerPoint theme that can be put to use immediately. So, download it and address the topic impactfully.

Business Diagram 3d Pie Chart With Arrows For Data Representation PowerPoint Slide
This business slide displays pie chart with timeline graphics. This diagram has been designed with graphic of with four arrows representing yearly data. Use this diagram, in your presentations to display process steps, stages, for business management.
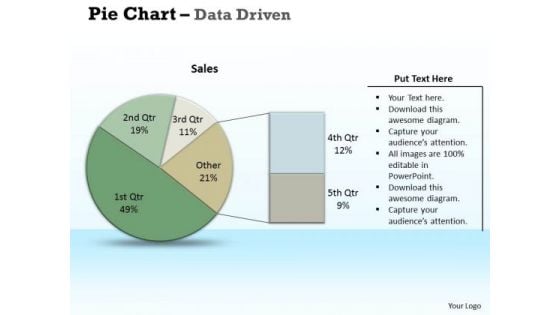
Examples Of Data Analysis Market Driven Pie Chart Research PowerPoint Slides Templates
Chalk It Up With Our examples of data analysis market driven pie chart research powerpoint slides Templates . Add To The Credits Of Your Ideas.
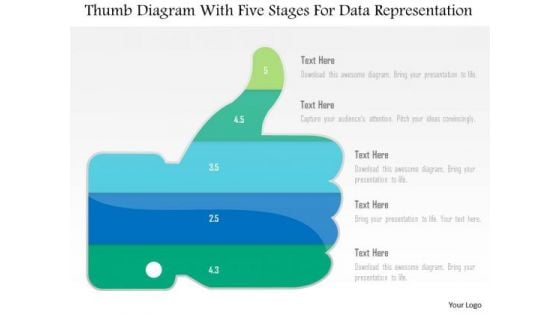
Business Diagram Thumb Diagram With Five Stages For Data Representation PowerPoint Slide
This business diagram displays thumb up with five stages. This diagram contains text boxes for data representation. Use this diagram to display business process workflows in any presentations.
Personal Data Visualization On Computer Screen Ppt PowerPoint Presentation Show Layout Ideas
Presenting this set of slides with name personal data visualization on computer screen ppt powerpoint presentation show layout ideas. This is a one stage process. The stages in this process are data visualization icon, research analysis, business focus. This is a completely editable PowerPoint presentation and is available for immediate download. Download now and impress your audience.

Business Diagram Data Driven Pie Chart Inside The Magnifier PowerPoint Slide
This business slide displays 3d colorful pie graph with magnifier. This diagram is a data visualization tool that gives you a simple way to present statistical information. This slide helps your audience examine and interpret the data you present.
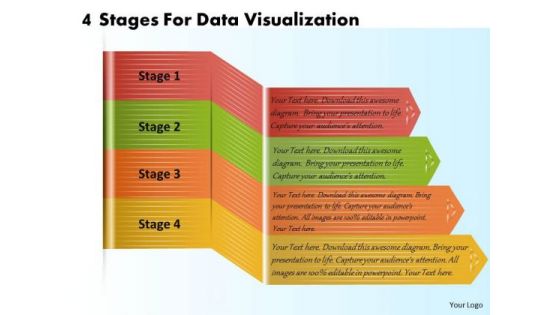
Business Plan And Strategy 4 Stages For Data Visualization Strategic Planning Template Ppt Slide
Your Listeners Will Never Doodle. Our business plan and strategy 4 stages for data visualization strategic planning template ppt slide Powerpoint Templates Will Hold Their Concentration. Do The One Thing With Your Thoughts. Uphold Custom With Our Process and Flows Powerpoint Templates.
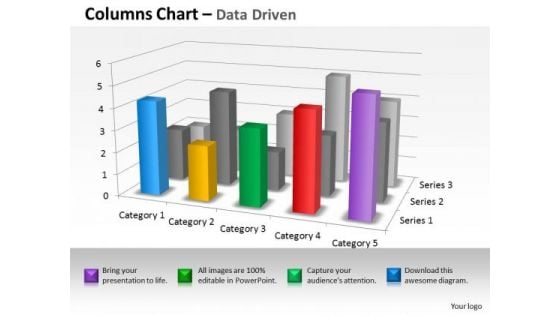
Quantitative Data Analysis 3d Interpretation Of Statistical Quality Control PowerPoint Templates
Land The Idea With Our quantitative data analysis 3d interpretation of statistical quality control Powerpoint Templates . Help It Grow With Your Thoughts.
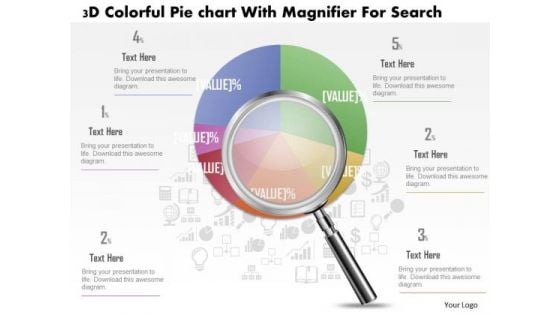
Business Diagram 3d Colorful Pie Graph With Magnifier Data Search PowerPoint Slide
This business slide displays 3d colorful pie graph with magnifier. This diagram is a data visualization tool that gives you a simple way to present statistical information. This slide helps your audience examine and interpret the data you present.
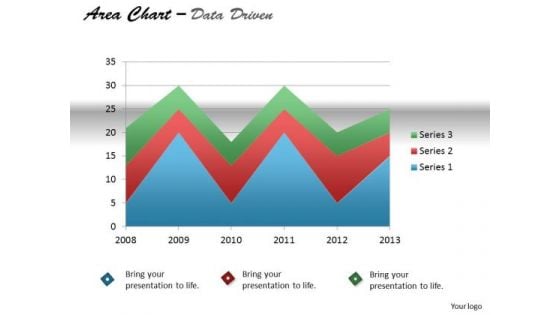
Quantitative Data Analysis Driven Display Series With Area Chart PowerPoint Slides Templates
Our quantitative data analysis driven display series with area chart powerpoint slides Templates Enjoy Drama. They Provide Entertaining Backdrops.
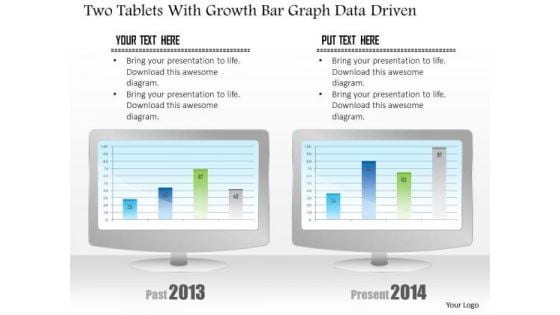
Business Diagram Two Tablets With Growth Bar Graph Data Driven PowerPoint Slide
This business diagram has been designed with comparative charts on tablets. This slide suitable for data representation. You can also use this slide to present business reports and information. Use this diagram to present your views in a wonderful manner.
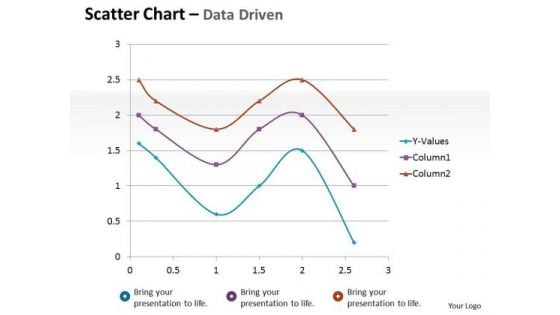
Financial Data Analysis Driven Scatter Chart Mathematical Diagram PowerPoint Slides Templates
Dominate Proceedings With Your Ideas. Our financial data analysis driven scatter chart mathematical diagram powerpoint slides Templates Will Empower Your Thoughts.
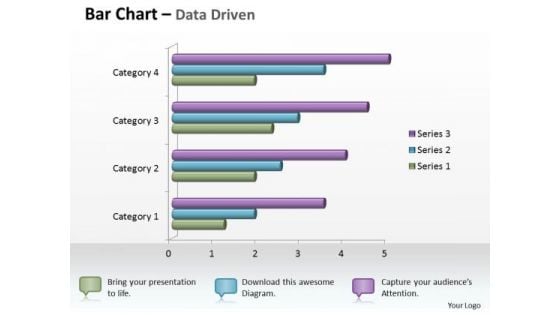
Data Analysis In Excel 3d Bar Chart For Business Statistics PowerPoint Templates
Knock On The Door To Success With Our data analysis in excel 3d bar chart for business statistics Powerpoint Templates . Be Assured Of Gaining Entry.
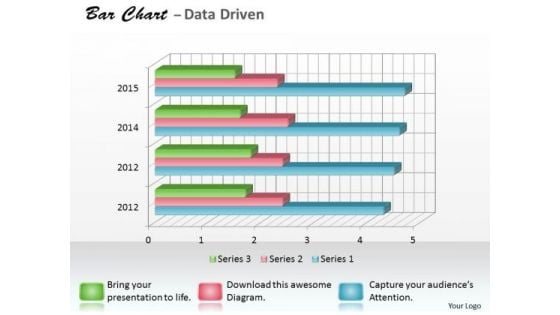
Data Analysis Programs 3d Bar Chart For Research In Statistics PowerPoint Templates
Draw It Out On Our data analysis programs 3d bar chart for research in statistics Powerpoint Templates . Provide Inspiration To Your Colleagues.
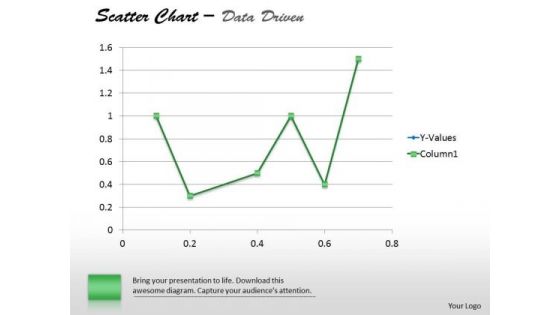
Financial Data Analysis Driven Demonstrate Statistics With Scatter Chart PowerPoint Slides Templates
Establish The Dominance Of Your Ideas. Our financial data analysis driven demonstrate statistics with scatter chart powerpoint slides Templates Will Put Them On Top.
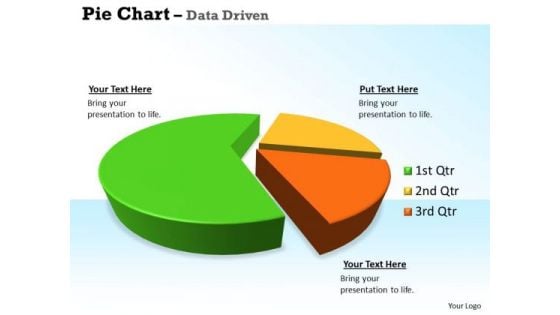
Quantitative Data Analysis 3d Pie Chart For Business Statistics PowerPoint Templates
Our quantitative data analysis 3d pie chart for business statistics Powerpoint Templates Allow You To Do It With Ease. Just Like Picking The Low Hanging Fruit.
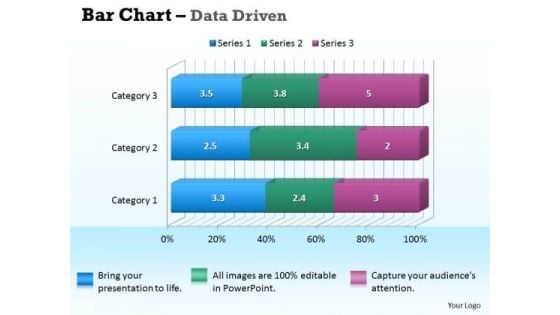
Data Analysis In Excel 3d Bar Chart For Business Information PowerPoint Templates
Our data analysis in excel 3d bar chart for business information Powerpoint Templates Deliver At Your Doorstep. Let Them In For A Wonderful Experience.
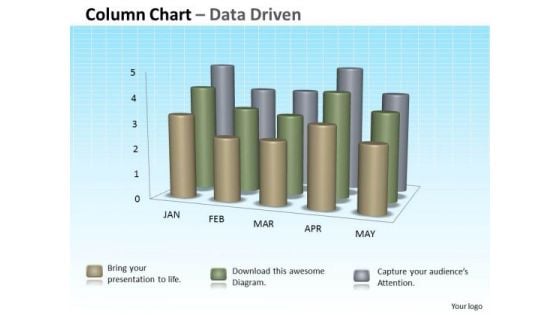
Data Analysis In Excel 3d Column Chart For Sets Of Information PowerPoint Templates
Double The Impact With Our data analysis in excel 3d column chart for sets of information Powerpoint Templates . Your Thoughts Will Have An Imposing Effect.
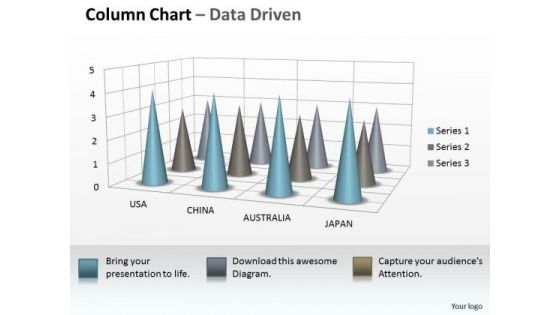
Data Analysis On Excel 3d Chart To Incorporate Business Information PowerPoint Templates
Our data analysis on excel 3d chart to incorporate business information Powerpoint Templates Allow You To Do It With Ease. Just Like Picking The Low Hanging Fruit.
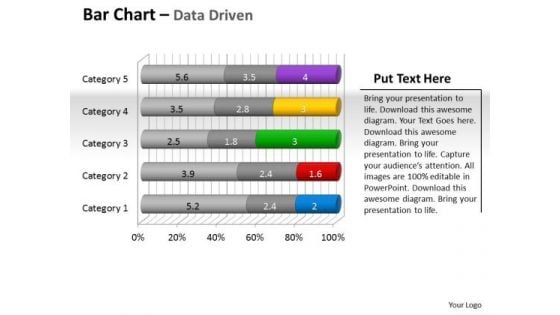
Data Analysis Programs 3d Bar Chart To Put Information PowerPoint Templates
Draw Up Your Agenda On Our data analysis programs 3d bar chart to put information Powerpoint Templates . Coax Your Audience Into Acceptance.
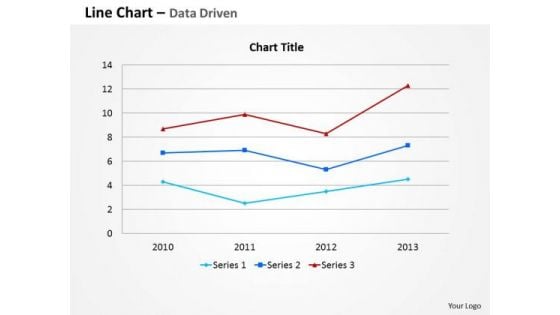
Data Analysis Template Driven Line Chart For Business Information PowerPoint Slides Templates
Your Thoughts Are Dripping With Wisdom. Lace It With Our data analysis template driven line chart for business information powerpoint slides Templates .
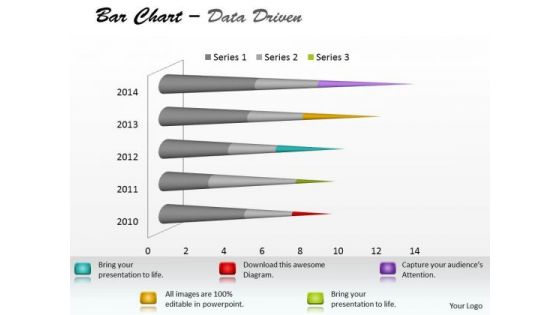
Microsoft Excel Data Analysis Bar Chart To Communicate Information PowerPoint Templates
With Our microsoft excel data analysis bar chart to communicate information Powerpoint Templates You Will Be Doubly Sure. They Possess That Stamp Of Authority.

Data Analysis Excel 3d Pie Chart For Marketing Process PowerPoint Templates
Our data analysis excel 3d pie chart for marketing process Powerpoint Templates Team Are A Dogged Lot. They Keep At It Till They Get It Right.
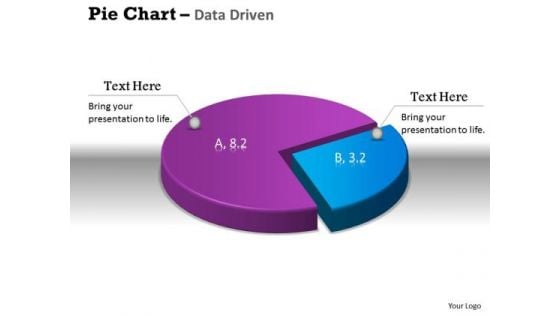
Data Analysis Excel 3d Pie Chart Shows Relative Size Of PowerPoint Templates
Get The Doers Into Action. Activate Them With Our data analysis excel 3d pie chart shows relative size of Powerpoint Templates.
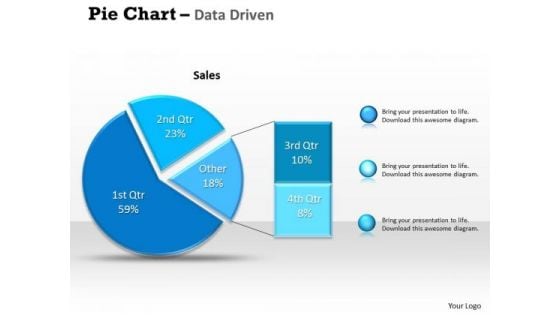
Data Analysis Excel Driven Percentage Breakdown Pie Chart PowerPoint Slides Templates
Be A Donor Of Great Ideas. Display Your Charity On Our data analysis excel driven percentage breakdown pie chart powerpoint slides Templates.
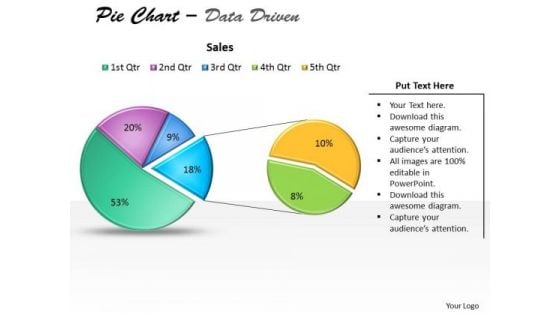
Data Analysis Excel Driven Pie Chart For Business Stratregy PowerPoint Slides Templates
Open Up Doors That Lead To Success. Our data analysis excel driven pie chart for business stratregy powerpoint slides Templates Provide The Handles.

Data Analysis Excel Driven Pie Chart For Easy Comparison PowerPoint Slides Templates
Our data analysis excel driven pie chart for easy comparison powerpoint slides Templates Abhor Doodling. They Never Let The Interest Flag.
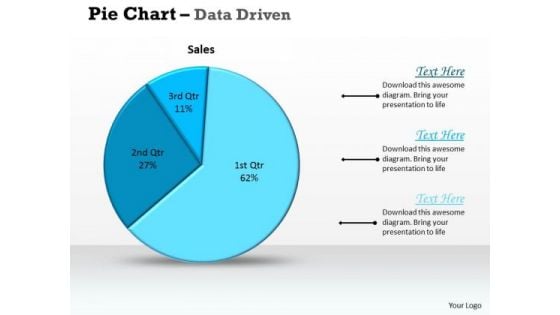
Data Analysis Excel Driven Pie Chart For Sales Process PowerPoint Slides Templates
Deliver The Right Dose With Our data analysis excel driven pie chart for sales process powerpoint slides Templates . Your Ideas Will Get The Correct Illumination.
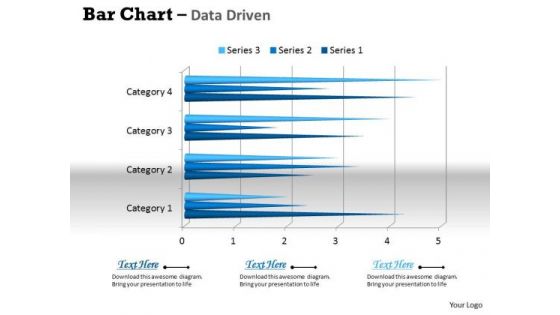
Data Analysis In Excel 3d Bar Chart For Business Trends PowerPoint Templates
Connect The Dots With Our data analysis in excel 3d bar chart for business trends Powerpoint Templates . Watch The Whole Picture Clearly Emerge.
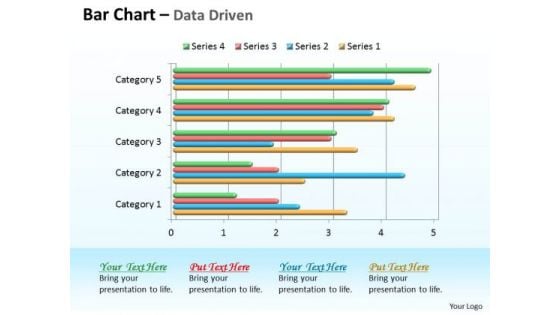
Data Analysis In Excel 3d Bar Chart For Comparison Of Time Series PowerPoint Templates
Double Your Chances With Our data analysis in excel 3d bar chart for comparison of time series Powerpoint Templates . The Value Of Your Thoughts Will Increase Two-Fold.
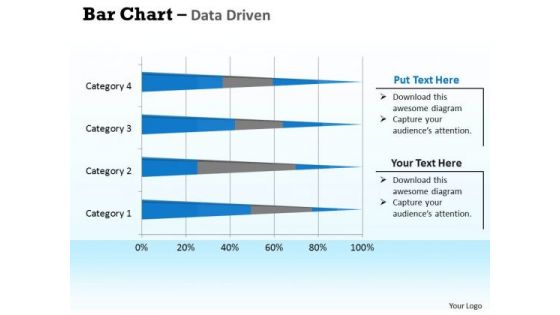
Data Analysis In Excel 3d Bar Chart For Interpretation PowerPoint Templates
Double Up Our data analysis in excel 3d bar chart for interpretation Powerpoint Templates With Your Thoughts. They Will Make An Awesome Pair.
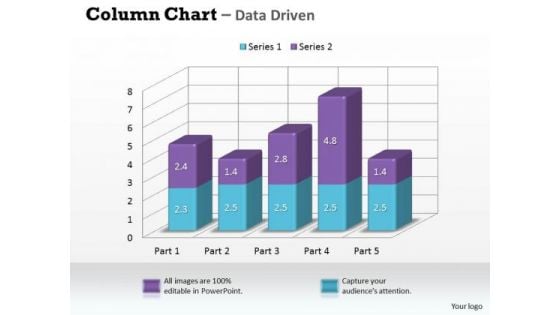
Data Analysis In Excel 3d Column Chart For Market Surveys PowerPoint Templates
Our data analysis in excel 3d column chart for market surveys Powerpoint Templates Leave No One In Doubt. Provide A Certainty To Your Views.
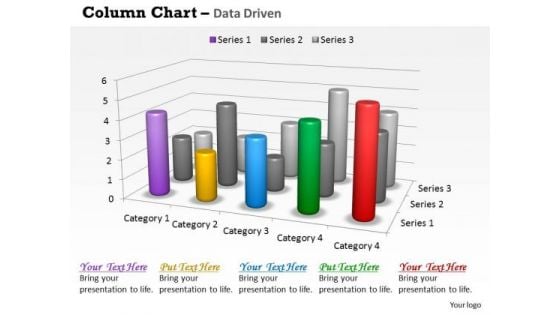
Data Analysis In Excel 3d Survey For Sales Chart PowerPoint Templates
Good Camaraderie Is A Key To Teamwork. Our data analysis in excel 3d survey for sales chart Powerpoint Templates Can Be A Cementing Force.
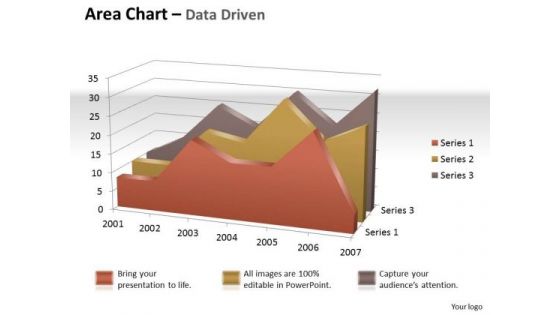
Data Analysis In Excel 3d Visual Display Of Area Chart PowerPoint Templates
Brace Yourself, Arm Your Thoughts. Prepare For The Hustle With Our data analysis in excel 3d visual display of area chart Powerpoint Templates .
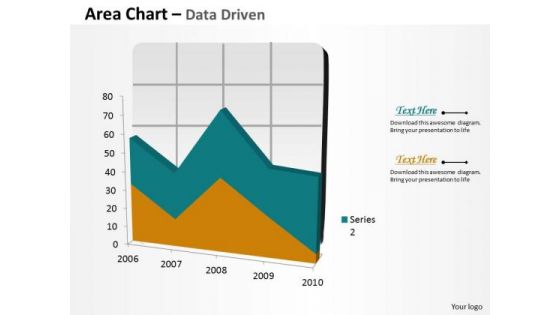
Data Analysis In Excel Area Chart For Business Process PowerPoint Templates
Your Grasp Of Economics Is Well Known. Help Your Audience Comprehend Issues With Our data analysis in excel area chart for business process Powerpoint Templates .
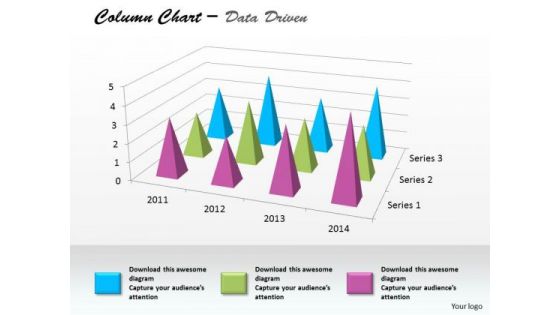
Data Analysis In Excel Column Chart For Business Project PowerPoint Templates
Edit Your Work With Our data analysis in excel column chart for business project Powerpoint Templates . They Will Help You Give The Final Form.
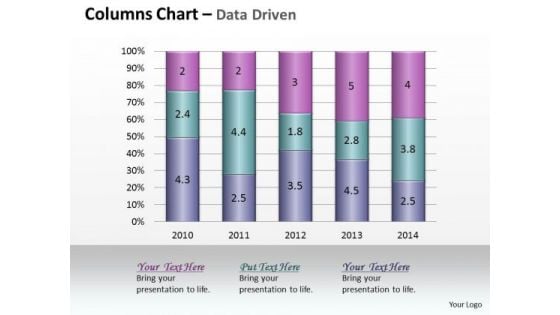
Data Analysis In Excel Column Chart Of Various Fields PowerPoint Templates
Land The Idea With Our data analysis in excel column chart of various fields Powerpoint Templates . Help It Grow With Your Thoughts.
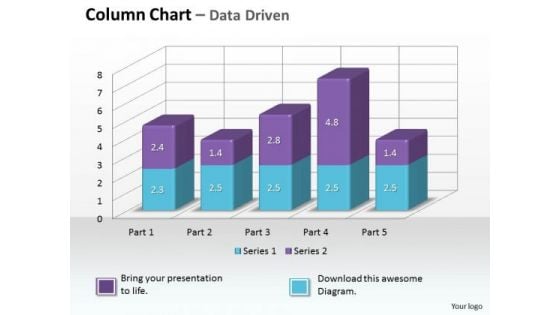
Data Analysis On Excel 3d Chart To Monitor Business Process PowerPoint Templates
Make Some Dough With Our data analysis on excel 3d chart to monitor business process Powerpoint Templates . Your Assets Will Rise Significantly.
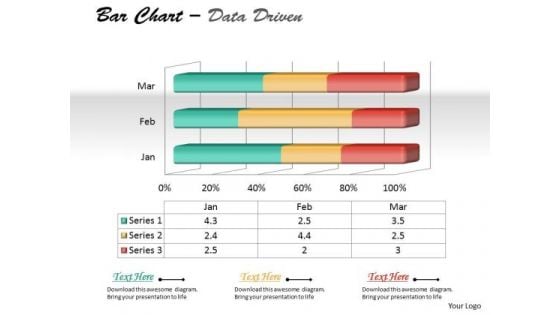
Data Analysis On Excel 3d Chart To Represent Quantitative Differences PowerPoint Templates
Draft It Out On Our data analysis on excel 3d chart to represent quantitative differences Powerpoint Templates . Give The Final Touches With Your Ideas.
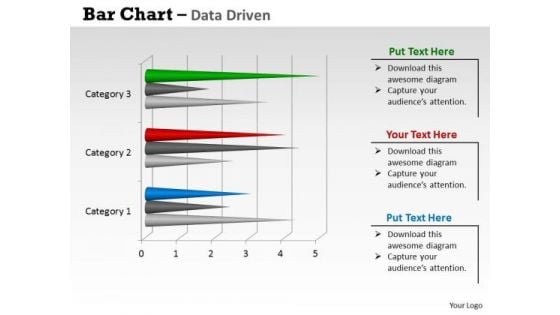
Data Analysis On Excel 3d Chart With Sets Of PowerPoint Templates
Reduce The Drag With Our data analysis on excel 3d chart with sets of Powerpoint Templates . Give More Lift To Your Thoughts.
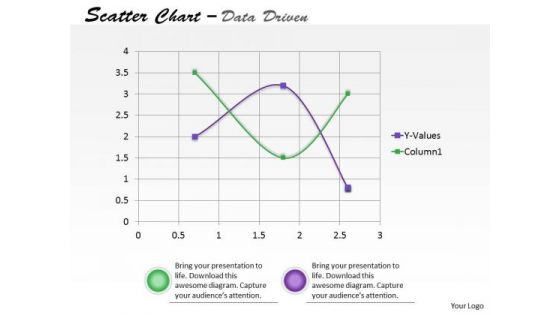
Data Analysis On Excel Driven Scatter Chart To Predict Future Movements PowerPoint Slides Templates
Our data analysis on excel driven scatter chart to predict future movements powerpoint slides Templates Enjoy Drama. They Provide Entertaining Backdrops.
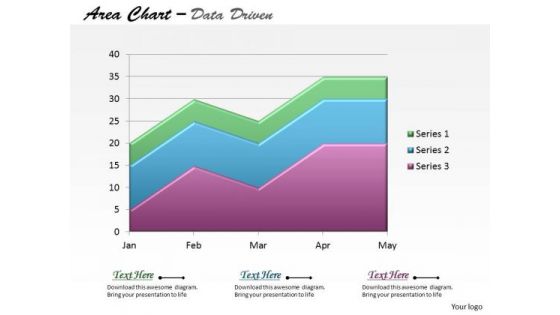
Data Analysis On Excel Driven Stacked Area Chart PowerPoint Slides Templates
Be The Dramatist With Our data analysis on excel driven stacked area chart powerpoint slides Templates . Script Out The Play Of Words.
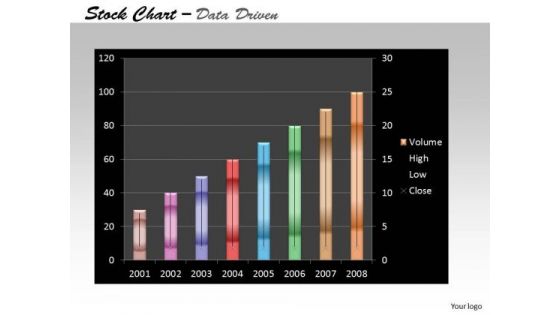
Data Analysis On Excel Driven Stock Chart For Business Growth PowerPoint Slides Templates
Add Some Dramatization To Your Thoughts. Our data analysis on excel driven stock chart for business growth powerpoint slides Templates Make Useful Props.
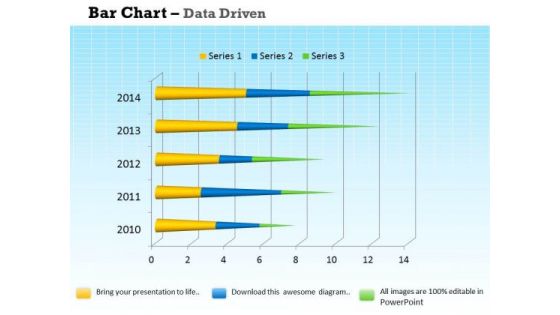
Data Analysis Programs 3d Bar Chart For Market Surveys PowerPoint Templates
Draw On The Experience Of Our data analysis programs 3d bar chart for market surveys Powerpoint Templates . They Imbibe From Past Masters.
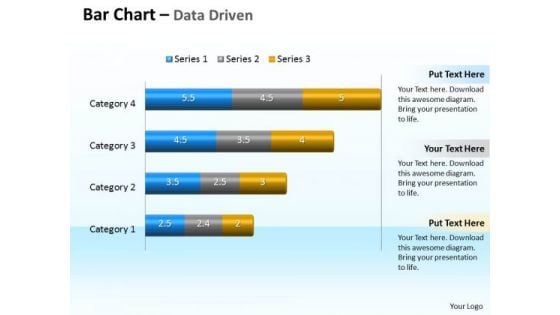
Data Analysis Programs 3d Bar Chart To Compare Categories PowerPoint Templates
Discover Decisive Moments With Our data analysis programs 3d bar chart to compare categories Powerpoint Templates . They Help Make That Crucial Difference.
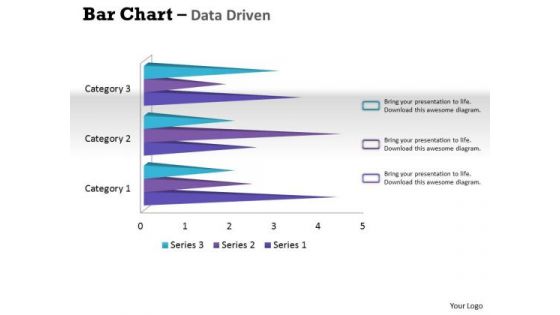
Data Analysis Techniques 3d Bar Chart For Financial Solutions PowerPoint Templates
Make Your Dreams A Reality With Our data analysis techniques 3d bar chart for financial solutions Powerpoint Templates . Your Ideas Will Begin To Take Shape.

Data Analysis Template Driven Express Business Facts Pie Chart PowerPoint Slides Templates
Display Your Drive On Our data analysis template driven express business facts pie chart powerpoint slides Templates . Invigorate The Audience With Your Fervor.
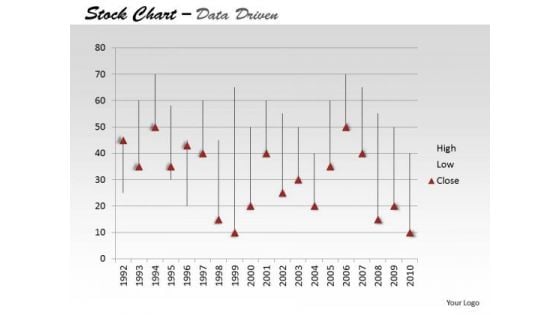
Data Analysis Template Driven Ineract With Stock Chart PowerPoint Slides Templates
Drive Your Passion With Our data analysis template driven ineract with stock chart powerpoint slides Templates . Steer Yourself To Achieve Your Aims.
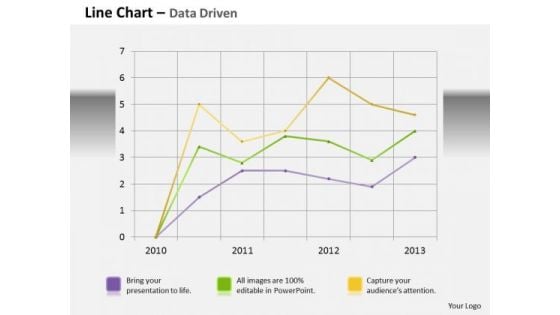
Data Analysis Template Driven Line Chart Business Graph PowerPoint Slides Templates
Bottle Your Thoughts In Our data analysis template driven line chart business graph powerpoint slides Templates . Pass It Around For Your Audience To Sip.
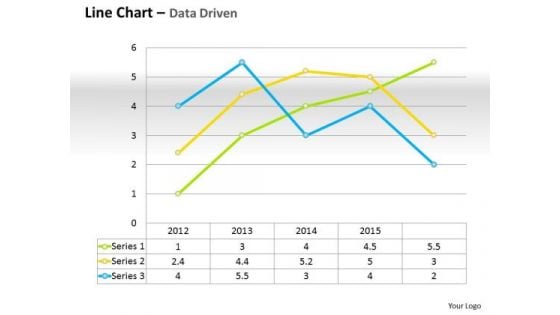
Data Analysis Template Driven Line Chart For Business Performance PowerPoint Slides Templates
Do Not Allow Things To Drift. Ring In Changes With Our data analysis template driven line chart for business performance powerpoint slides Templates .
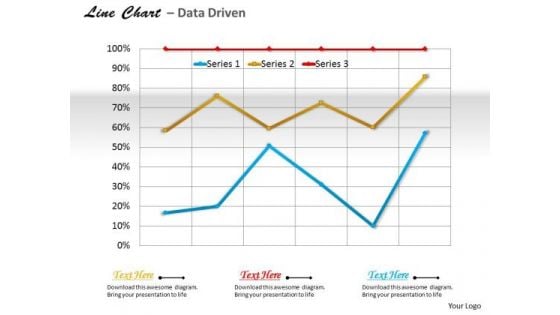
Data Analysis Template Driven Line Chart For Business Trends PowerPoint Slides Templates
Use Our data analysis template driven line chart for business trends powerpoint slides Templates As The Bit. Drill Your Thoughts Into Their Minds.
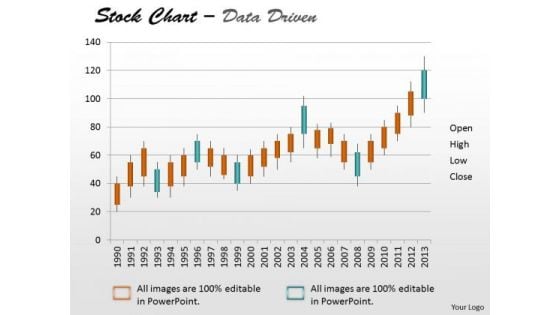
Data Analysis Template Driven Stock Chart For Market Trends PowerPoint Slides Templates
Drive Your Team Along The Road To Success. Take The Wheel With Our data analysis template driven stock chart for market trends powerpoint slides Templates .
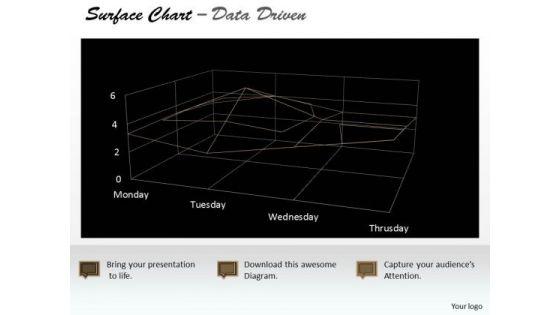
Data Analysis Template Driven Surface Chart Indicating Areas PowerPoint Slides Templates
Highlight Your Drive With Our data analysis template driven surface chart indicating areas powerpoint slides Templates . Prove The Fact That You Have Control.
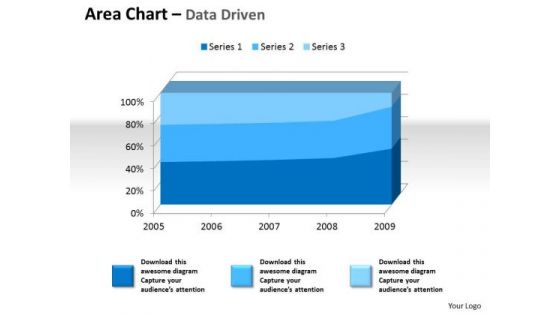
Examples Of Data Analysis Market 3d Area Chart For Quantiative PowerPoint Templates
Drum It Up With Our examples of data analysis market 3d area chart for quantiative Powerpoint Templates . Your Thoughts Will Raise The Tempo.
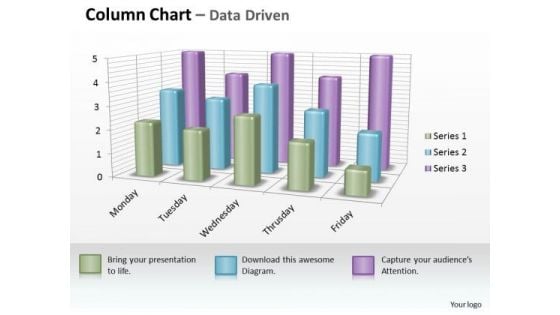
Examples Of Data Analysis Market 3d Business Inspection Procedure Chart PowerPoint Templates
However Dry Your Topic Maybe. Make It Catchy With Our examples of data analysis market 3d business inspection procedure chart Powerpoint Templates .
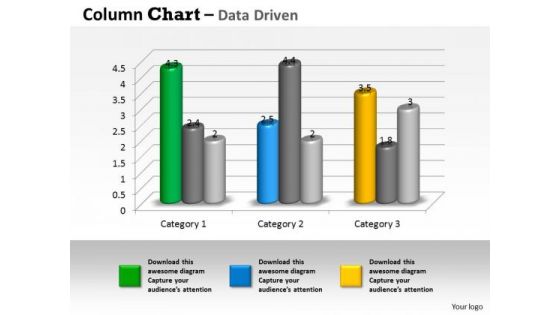
Examples Of Data Analysis Market 3d Business Trend Series Chart PowerPoint Templates
Duct It Through With Our examples of data analysis market 3d business trend series chart Powerpoint Templates . Your Ideas Will Reach Into Their Minds Intact.

 Home
Home