Data Analytics Icons
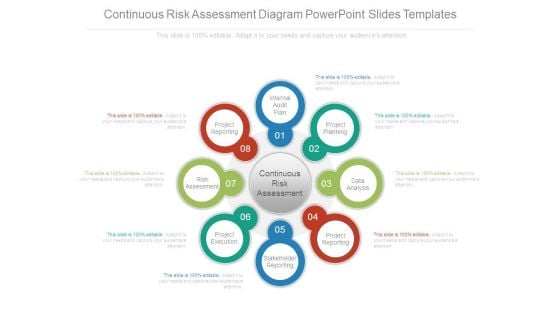
Continuous Risk Assessment Diagram Powerpoint Slides Templates
This is a continuous risk assessment diagram powerpoint slides templates. This is a eight stage process. The stages in this process are internal audit plan, project planning, data analysis, project reporting, stakeholder reporting, project execution, risk assessment, project reporting.
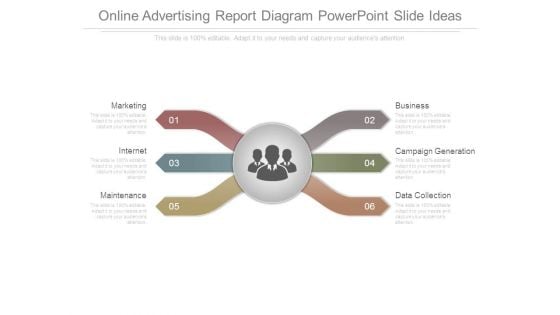
Online Advertising Report Diagram Powerpoint Slide Ideas
This is a online advertising report diagram powerpoint slide ideas. This is a six stage process. The stages in this process are marketing, internet, maintenance, business, campaign generation, data collection.
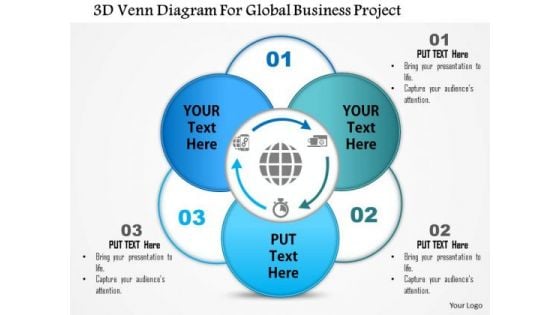
Business Diagram 3d Venn Diagram For Global Business Project Presentation Template
This business diagram displays 3d Venn diagram. This editable slide is suitable to present business reports. Use this diagram for business and finance related topics and display complete data analysis in your presentation.
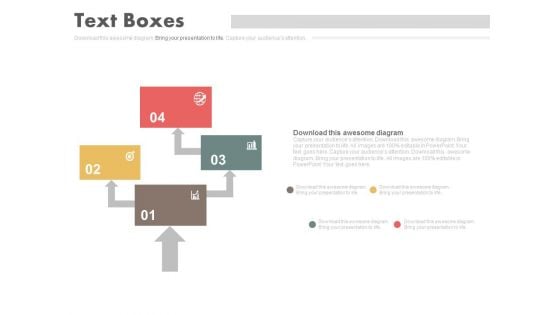
Four Steps Arrow Chart Design Powerpoint Slides
This PowerPoint template has been designed with four steps arrow chart. This PPT slide can be used to prepare presentations for marketing reports and also for financial data analysis. You can download finance PowerPoint template to prepare awesome presentations.
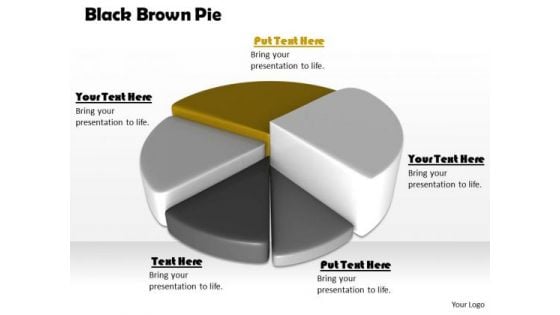
Stock Photo Black Brown Pie Chart For Business Result PowerPoint Slide
This high quality image is designed with pie chart. Use this image to make business reports. Use this outstanding image in presentations relating to data analysis and reports. Go ahead and add charm to your presentations.
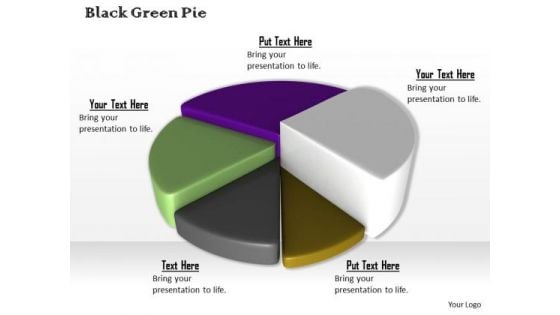
Stock Photo Colorful 3d Pie Chart For Business Result PowerPoint Slide
This high quality image is designed with pie chart. Use this image to make business reports. Use this outstanding image in presentations relating to data analysis and reports. Go ahead and add charm to your presentations.
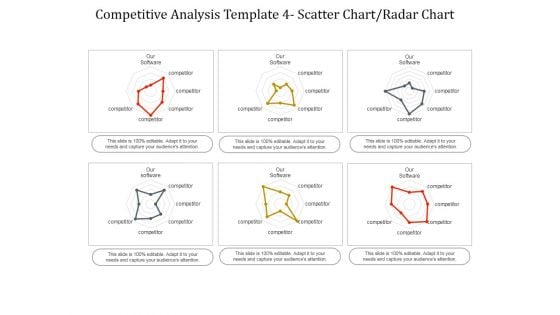
Competitive Analysis Scatter Chart Radar Chart Ppt PowerPoint Presentation Infographics
This is a competitive analysis scatter chart radar chart ppt powerpoint presentation infographics. This is a eight stage process. The stages in this process are users interface, data import, example, pricing, support, update, tutorials, easy to use.
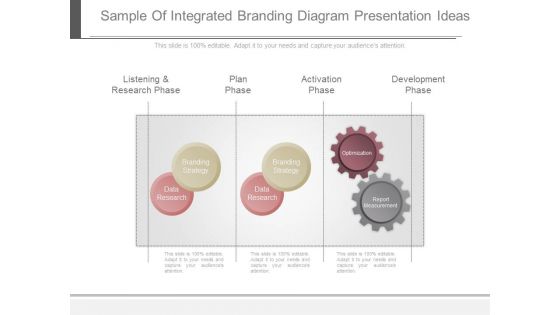
Sample Of Integrated Branding Diagram Presentation Ideas
This is a sample of integrated branding diagram presentation ideas. This is a three stage process. The stages in this process are listening and research phase, plan phase, activation phase, development phase, branding strategy, data research, optimization, report measurement.
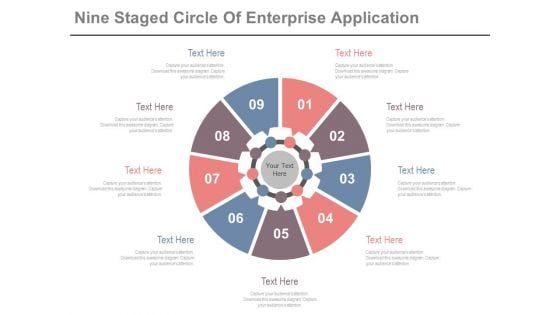
Circle Diagram For Business Marketing Mix Powerpoint Slides
This PowerPoint template has been designed with nine steps circle chart. This PPT slide can be used to prepare presentations for profit growth report and also for financial data analysis. You can download finance PowerPoint template to prepare awesome presentations.
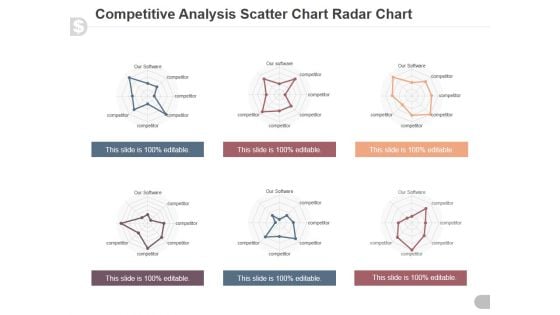
Competitive Analysis Scatter Chart Radar Chart Ppt PowerPoint Presentation Model
This is a competitive analysis scatter chart radar chart ppt powerpoint presentation model. This is a eight stage process. The stages in this process are users interface, data import, example, pricing, support, update, tutorials, easy to use.
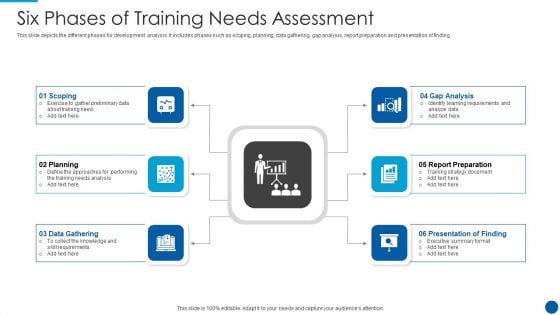
Six Phases Of Training Needs Assessment Professional PDF
This slide depicts the different phases for development analysis. It includes phases such as scoping, planning, data gathering, gap analysis, report preparation and presentation of finding. Presenting six phases of training needs assessment professional pdf to dispense important information. This template comprises six stages. It also presents valuable insights into the topics including planning, gap analysis, data gathering. This is a completely customizable PowerPoint theme that can be put to use immediately. So, download it and address the topic impactfully.
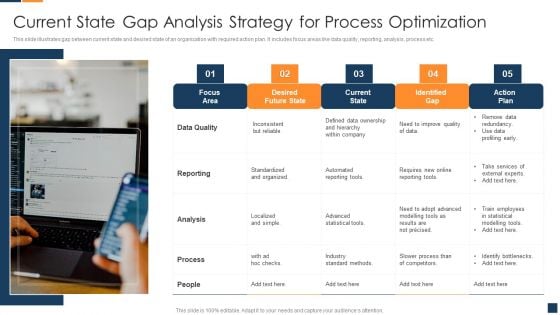
Current State Gap Analysis Strategy For Process Optimization Diagrams PDF
This slide illustrates gap between current state and desired state of an organization with required action plan. It includes focus areas like data quality, reporting, analysis, process etc. Presenting Current State Gap Analysis Strategy For Process Optimization Diagrams PDF to dispense important information. This template comprises five stages. It also presents valuable insights into the topics including Data Quality, Reporting, Analysis. This is a completely customizable PowerPoint theme that can be put to use immediately. So, download it and address the topic impactfully.
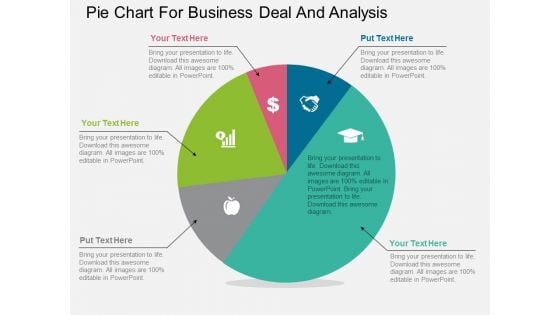
Pie Chart For Business Deal And Analysis Powerpoint Template
Our above PPT slide contains diagram of pentagon infographic. It helps to display steps of corporate marketing. Use this diagram to impart more clarity to data and to create more sound impact on viewers.
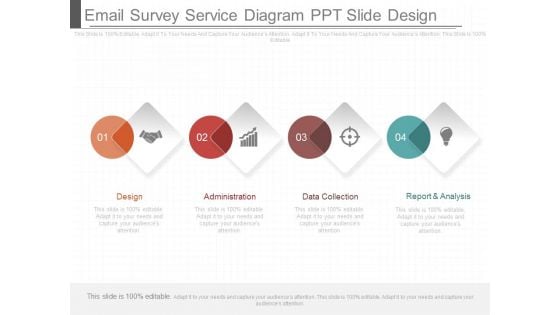
Email Survey Service Diagram Ppt Slide Design
This is a email survey service diagram ppt slide design. This is a four stage process. The stages in this process are design, administration, data collection, report and analysis.
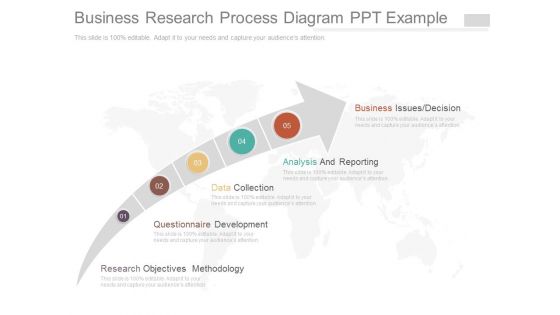
Business Research Process Diagram Ppt Example
This is a business research process diagram ppt example. This is a five stage process. The stages in this process are business issues decision, analysis and reporting, data collection, questionnaire development, research objectives methodology.
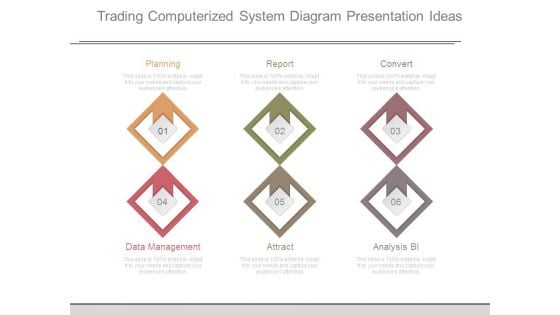
Trading Computerized System Diagram Presentation Ideas
This is a trading computerized system diagram presentation ideas. This is a six stage process. The stages in this process are planning, report, convert, data management, attract, analysis bi.
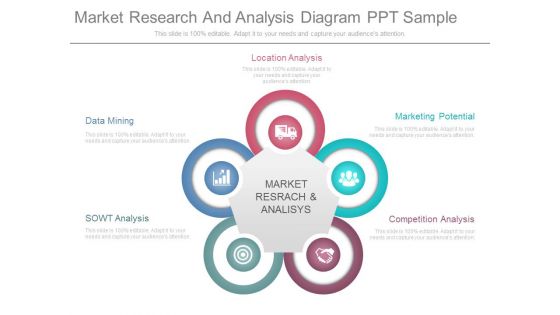
Market Research And Analysis Diagram Ppt Sample
This is a market research and analysis diagram ppt sample. This is a five stage process. The stages in this process are location analysis, data mining, sowt analysis, market research and analysis, competition analysis, marketing potential.
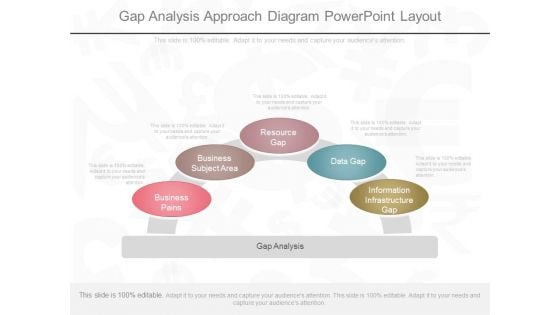
Gap Analysis Approach Diagram Powerpoint Layout
This is a gap analysis approach diagram powerpoint layout. This is a five stage process. The stages in this process are information infrastructure gap, data gap, resource gap, business subject area, business pains.
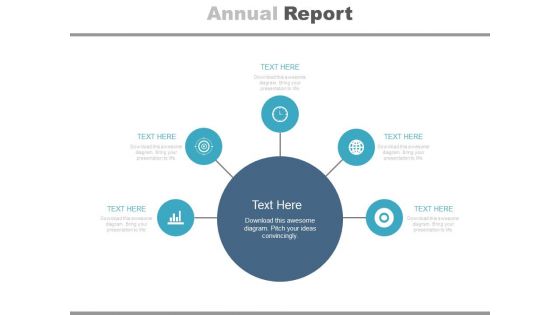
Diagram For Market Research Analysis Powerpoint Slides
This PowerPoint template has been designed with circular infographic diagram. It can be used to display steps for market research and also for financial data analysis. You can download finance PowerPoint template to prepare awesome presentations.
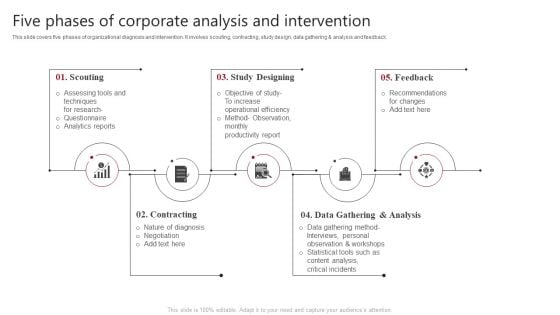
Five Phases Of Corporate Analysis And Intervention Clipart PDF
This slide covers five phases of organizational diagnosis and intervention. It involves scouting, contracting, study design, data gathering and analysis and feedback. Presenting Five Phases Of Corporate Analysis And Intervention Clipart PDF to dispense important information. This template comprises five stages. It also presents valuable insights into the topics including Contracting, Data Gathering, Analysis. This is a completely customizable PowerPoint theme that can be put to use immediately. So, download it and address the topic impactfully.
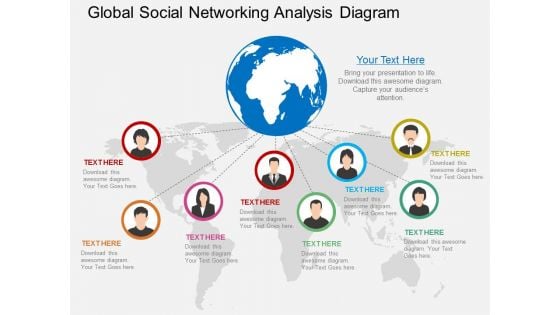
Global Social Networking Analysis Diagram Powerpoint Template
Our above PowerPoint slide contains diagram of globe with people pictures. Download this business slide to illustrate social networking. Use this diagram to impart more clarity to data and to create more sound impact on viewers.
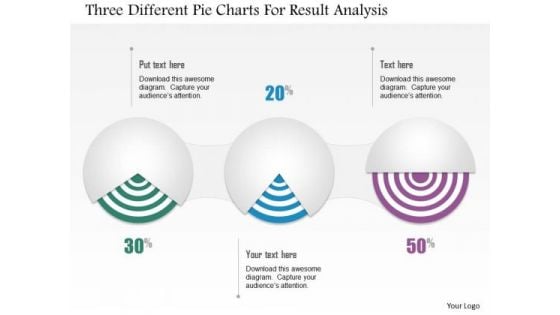
Business Diagram Three Different Pie Charts For Result Analysis Presentation Template
Three different pie charts are used to designed this power point template slide. This PPT slide contains the concept of result analysis. Use this PPT slide for your data and process related presentations.
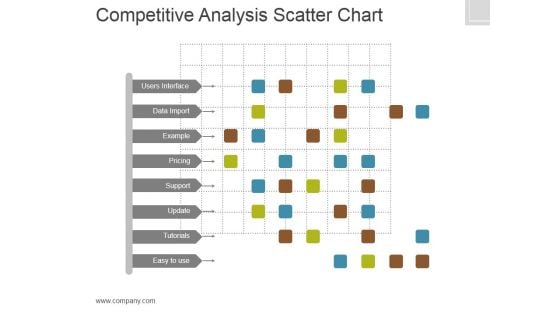
Competitive Analysis Template 6 Scatter Chart Ppt PowerPoint Presentation Slides
This is a competitive analysis template 6 scatter chart ppt powerpoint presentation slides. This is a eight stage process. The stages in this process are users interface, data import, example, pricing, support, update, tutorials, easy to use, table.
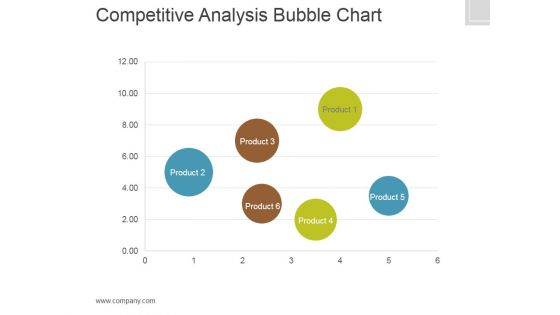
Competitive Analysis Template 7 Bubble Chart Ppt PowerPoint Presentation Deck
This is a competitive analysis template 7 bubble chart ppt powerpoint presentation deck. This is a six stage process. The stages in this process are users interface, data import, example, pricing, support, update, tutorials, easy to use, table.
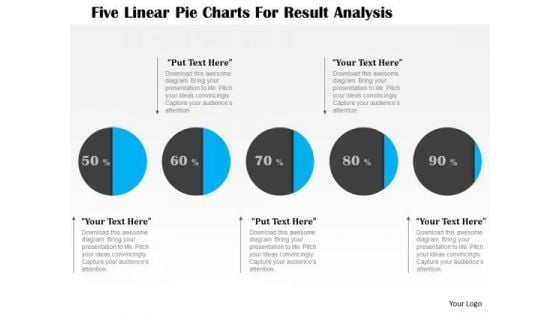
Business Diagram Five Linear Pie Charts For Result Analysis Presentation Template
This business diagram displays graphic of five staged process flow diagram. This PPT slide contains the concept of business data representation. Use this diagram to build professional presentation for your viewers.
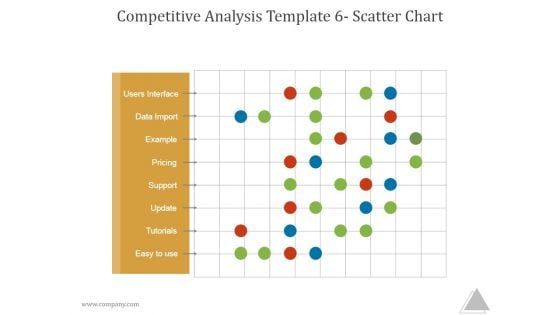
Competitive Analysis Template 6 Scatter Chart Ppt PowerPoint Presentation Shapes
This is a competitive analysis template 6 scatter chart ppt powerpoint presentation shapes. This is a one stage process. The stages in this process are users interface, data import, example, pricing, support update, tutorials, easy to use.
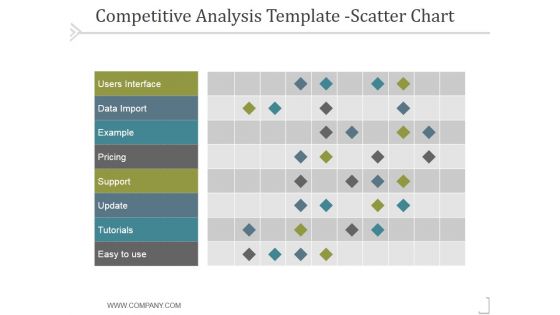
Competitive Analysis Scatter Chart Template 2 Ppt PowerPoint Presentation Files
This is a competitive analysis scatter chart template 2 ppt powerpoint presentation files. This is a nine stage process. The stages in this process are users interface, data import, example, pricing, support, update.
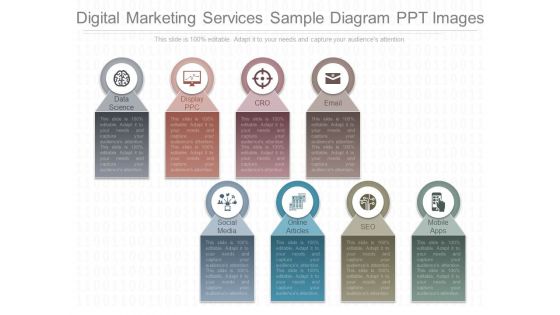
Digital Marketing Services Sample Diagram Ppt Images
This is a digital marketing services sample diagram ppt images. This is a eight stage process. The stages in this process are data science, display ppc, cro, email, social media, online articles, seo, mobile apps.
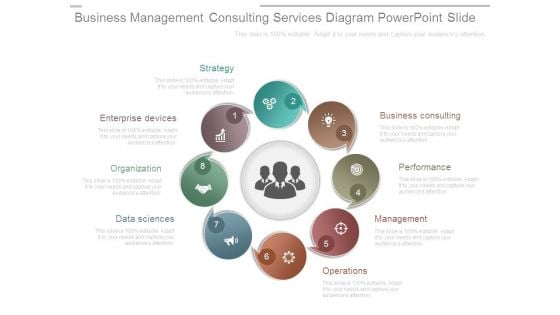
Business Management Consulting Services Diagram Powerpoint Slide
This is a business management consulting services diagram powerpoint slide. This is a eight stage process. The stages in this process are strategy, business consulting, performance, management, operations, data sciences, organization, enterprise devices.
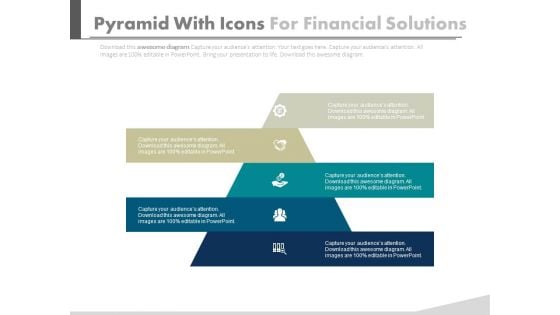
Pyramid For Financial Accounting Information Powerpoint Slides
This PowerPoint template has been designed with graphics of pyramid chart. This PPT slide can be used to prepare presentations for profit growth report and also for financial data analysis. You can download finance PowerPoint template to prepare awesome presentations.
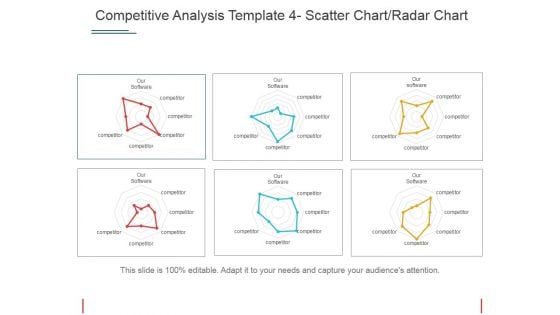
Competitive Analysis Scatter Chart Radar Chart Ppt PowerPoint Presentation Portfolio Templates
This is a competitive analysis scatter chart radar chart ppt powerpoint presentation portfolio templates. This is a eight stage process. The stages in this process are users interface, data import, example, pricing, support.
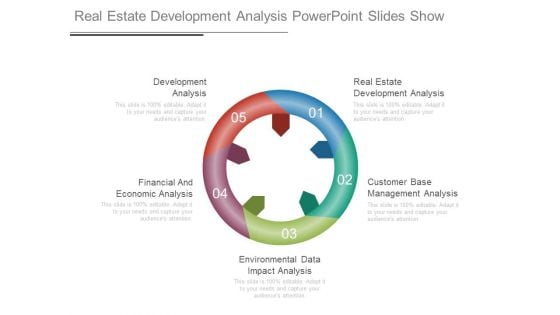
Real Estate Development Analysis Powerpoint Slides Show
This is a real estate development analysis powerpoint slides show. This is a five stage process. The stages in this process are development analysis, financial and economic analysis, environmental data impact analysis, customer base management analysis, real estate development analysis.

Stock Photo Golden Dollar Symbol With Pie Graph PowerPoint Slide
This Power Point template has been crafted with graphic of golden dollar symbol and pie chart on a tablet. Display the concept of financial data analysis with this image. Use this image to present financial reports in business presentations.
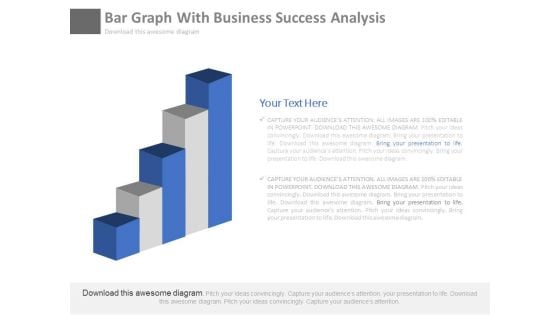
Bar Graph For Marketing Research Process Powerpoint Slides
This PowerPoint template has been designed with diagram of bar graph. This PPT slide can be used to prepare presentations for profit growth report and also for financial data analysis. You can download finance PowerPoint template to prepare awesome presentations.
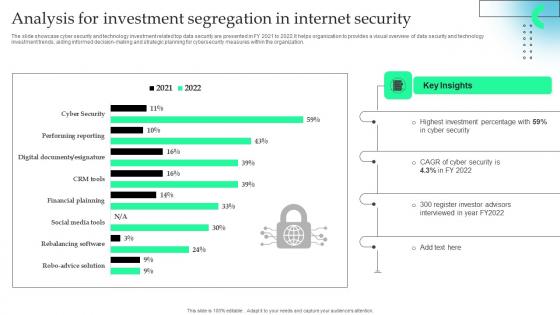
Analysis For Investment Segregation In Internet Security Formats Pdf
The slide showcase cyber security and technology investment related top data security are presented in FY 2021 to 2022.It helps organization to provides a visual overview of data security and technology investment trends, aiding informed decision making and strategic planning for cybersecurity measures within the organization.Pitch your topic with ease and precision using this Analysis For Investment Segregation In Internet Security Formats Pdf This layout presents information on Highest Investment, Register Investor Advisors, Key Insights It is also available for immediate download and adjustment. So, changes can be made in the color, design, graphics or any other component to create a unique layout. The slide showcase cyber security and technology investment related top data security are presented in FY 2021 to 2022.It helps organization to provides a visual overview of data security and technology investment trends, aiding informed decision making and strategic planning for cybersecurity measures within the organization.
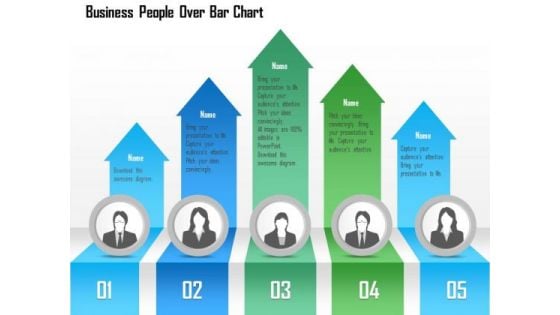
Business Diagram Business People Over Bar Chart PowerPoint Template
This Power Point template has been designed with graphic of business people and bar chart. This PPT contains the concept of result analysis and business data display. Use this PPT slide for your business and marketing related presentations.
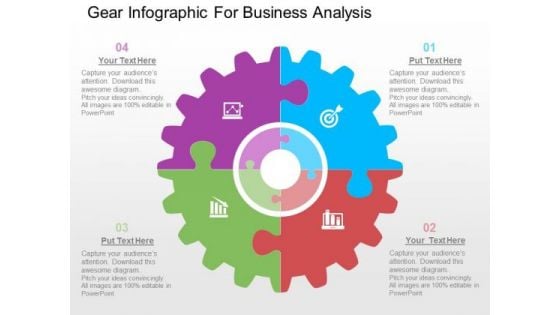
Gear Infographic For Business Analysis PowerPoint Templates
Our above slide contains diagram of gear infographic. This gear infographic slide helps to exhibit business analysis. Use this diagram to impart more clarity to data and to create more sound impact on viewers.
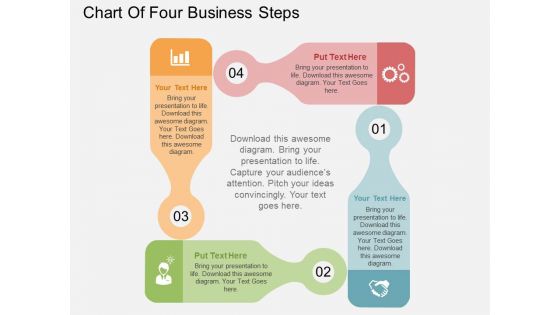
Chart Of Four Business Steps Powerpoint Templates
This business diagram displays flow of four business steps. This editable slide is suitable to present growth management. Use this diagram for business and finance related topics and display complete data analysis in your presentation.

Business Diagram Seven Staged Circular Ribbon Text Box Diagram Presentation Template
This Power Point template slide has been used to display the concept of business data analysis. This PPT slide contains the graphic of seven staged circular ribbon style text boxes. Use this PPT slide for your business presentations.
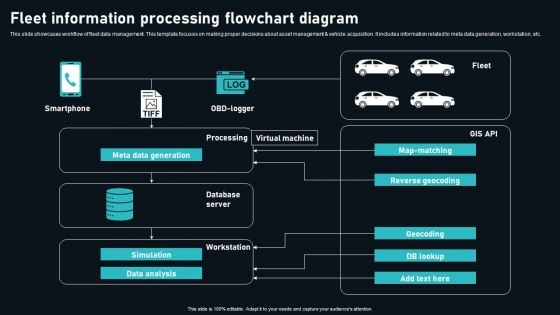
Fleet Information Processing Flowchart Diagram Themes PDF
This slide showcases workflow of fleet data management. This template focuses on making proper decisions about asset management and vehicle acquisition. It includes information related to meta data generation, workstation, etc. Showcasing this set of slides titled Fleet Information Processing Flowchart Diagram Themes PDF. The topics addressed in these templates are Smartphone, Processing, Virtual Machine. All the content presented in this PPT design is completely editable. Download it and make adjustments in color, background, font etc. as per your unique business setting.
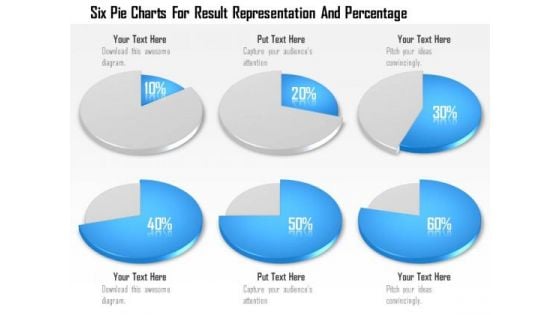
Business Diagram Six Pie Charts For Result Representation And Percentage Presentation Template
Display the concept of result analysis in your business presentation. This PPT slide contains the graphic of six pie charts. Use this PPT slide for your business and marketing data related presentations.
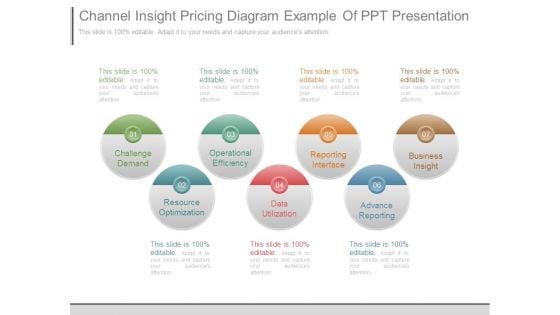
Channel Insight Pricing Diagram Example Of Ppt Presentation
This is a channel insight pricing diagram example of ppt presentation. This is a seven stage process. The stages in this process are challenge demand, operational efficiency, reporting interface, business insight, resource optimization, data utilization, advance reporting.
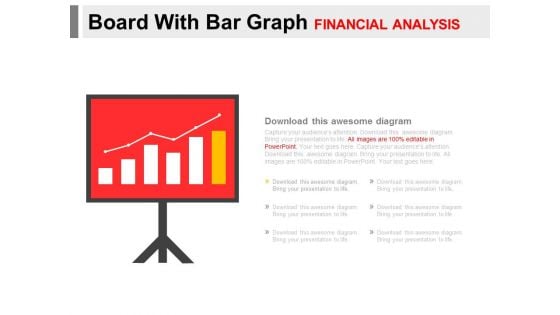
Board With Bar Graph For Financial Analysis Powerpoint Slides
You can download this PowerPoint template to display statistical data and analysis. This PPT slide contains display board with bar graph. Draw an innovative business idea using this professional diagram.
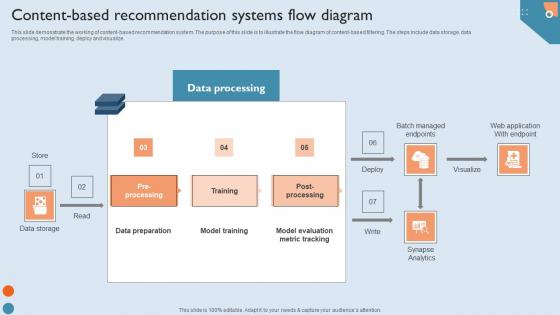
Recommendation Techniques Content Based Recommendation Systems Flow Diagram Demonstration PDF
This slide demonstrate the working of content-based recommendation system. The purpose of this slide is to illustrate the flow diagram of content-based filtering. The steps include data storage, data processing, model training, deploy and visualize. This Recommendation Techniques Content Based Recommendation Systems Flow Diagram Demonstration PDF is perfect for any presentation, be it in front of clients or colleagues. It is a versatile and stylish solution for organizing your meetings. The Recommendation Techniques Content Based Recommendation Systems Flow Diagram Demonstration PDF features a modern design for your presentation meetings. The adjustable and customizable slides provide unlimited possibilities for acing up your presentation. Slidegeeks has done all the homework before launching the product for you. So, do not wait, grab the presentation templates today This slide demonstrate the working of content-based recommendation system. The purpose of this slide is to illustrate the flow diagram of content-based filtering. The steps include data storage, data processing, model training, deploy and visualize.
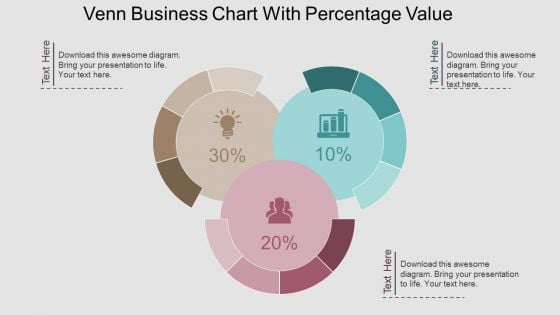
Venn Business Chart With Percentage Value Powerpoint Template
This PPT slide contains Venn business chart with percentage values. This PPT diagram is suitable to present data comparison and analysis. Enlighten others on the process with this innovative PowerPoint template.
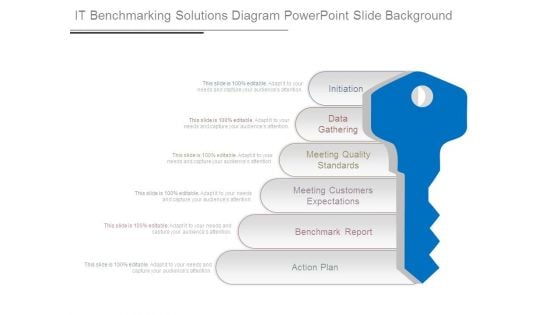
It Benchmarking Solutions Diagram Powerpoint Slide Background
This is a it benchmarking solutions diagram powerpoint slide background. This is a six stage process. The stages in this process are initiation, data gathering, meeting quality standards, meeting customers expectations, benchmark report, action plan.
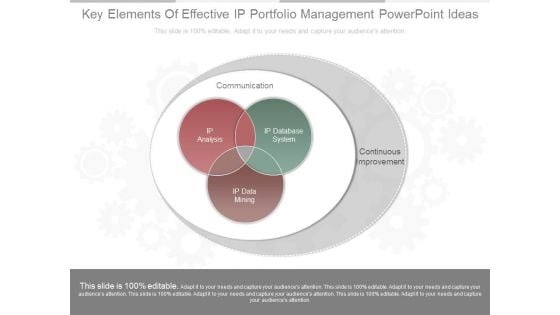
Key Elements Of Effective Ip Portfolio Management Powerpoint Ideas
This is a key elements of effective ip portfolio management powerpoint ideas. This is a three stage process. The stages in this process are communication, continuous improvement, ip analysis, ip database system, ip data mining.
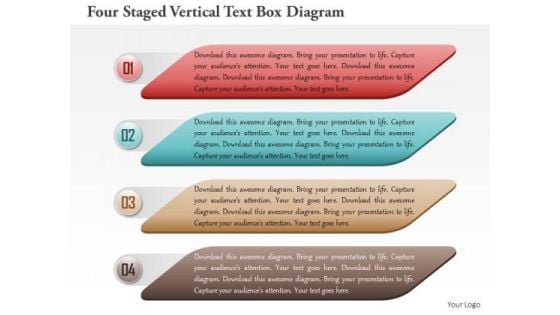
Business Diagram Four Staged Vertical Text Box Diagram Presentation Template
This PPT slide contains the concept of business data analysis. This Power Point template slide has been designed with graphic of four staged vertical text boxes diagram. Use this PPT slide and build an innovative presentation for your viewers.
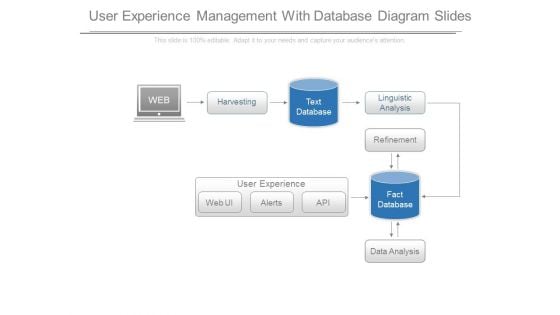
User Experience Management With Database Diagram Slides
This is a user experience management with database diagram slides. This is a six stage process. The stages in this process are web, harvesting, text database, linguistic analysis, refinement, fact database, data analysis, web ui, alerts, api, user experience.
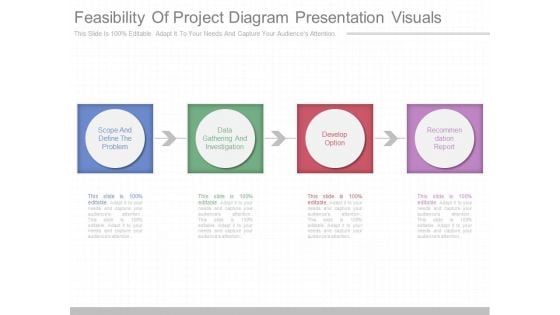
Feasibility Of Project Diagram Presentation Visuals
This is a feasibility of project diagram presentation visuals. This is a four stage process. The stages in this process are scope and define the problem, data gathering and investigation, develop option, recommendation report.
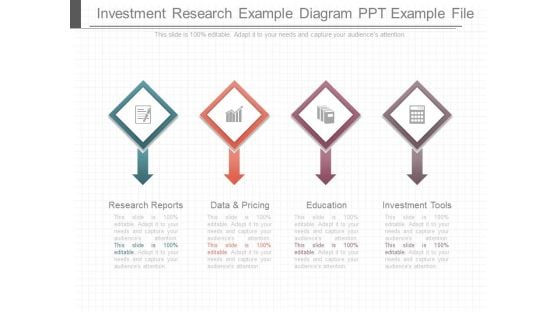
Investment Research Example Diagram Ppt Example File
This is a investment research example diagram ppt example file. This is a four stage process. The stages in this process are research reports, data and pricing, education, investment tools.
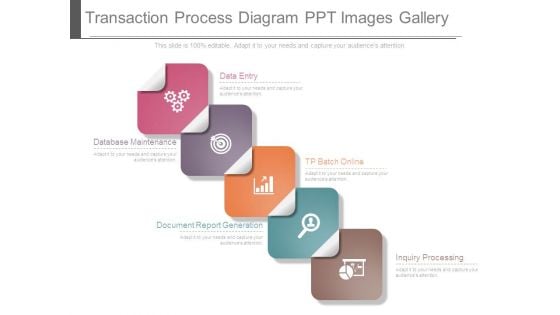
Transaction Process Diagram Ppt Images Gallery
This is a transaction process diagram ppt images gallery. This is a five stage process. The stages in this process are data entry, tp batch online, database maintenance, document report generation, inquiry processing.
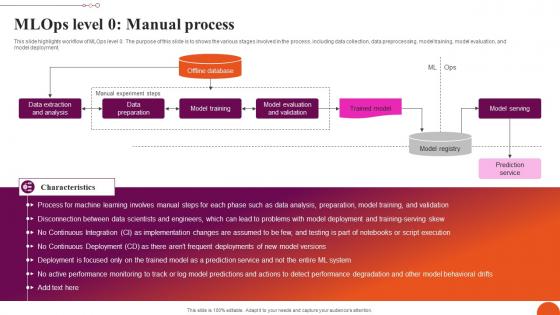
MLOps Level 0 Manual Process Exploring Machine Learning Operations Themes Pdf
This slide highlights workflow of MLOps level 0. The purpose of this slide is to shows the various stages involved in the process, including data collection, data preprocessing, model training, model evaluation, and model deployment. Make sure to capture your audiences attention in your business displays with our gratis customizable MLOps Level 0 Manual Process Exploring Machine Learning Operations Themes Pdf. These are great for business strategies, office conferences, capital raising or task suggestions. If you desire to acquire more customers for your tech business and ensure they stay satisfied, create your own sales presentation with these plain slides. This slide highlights workflow of MLOps level 0. The purpose of this slide is to shows the various stages involved in the process, including data collection, data preprocessing, model training, model evaluation, and model deployment.
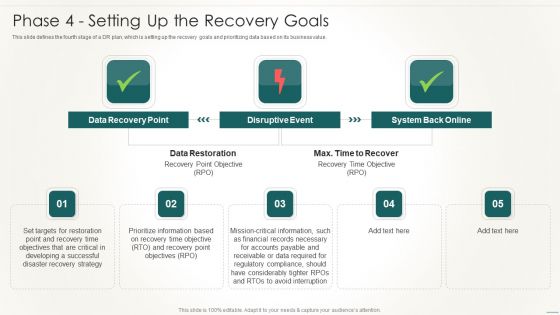
Information Technology Disaster Resilience Plan Phase 4 Setting Up The Recovery Goals Infographics PDF
This slide defines the fourth stage of a DR plan, which is setting up the recovery goals and prioritizing data based on its business value.Deliver and pitch your topic in the best possible manner with this Information Technology Disaster Resilience Plan Phase 4 Setting Up The Recovery Goals Infographics PDF. Use them to share invaluable insights on Data Recovery, Disruptive Event, System Back and impress your audience. This template can be altered and modified as per your expectations. So, grab it now.
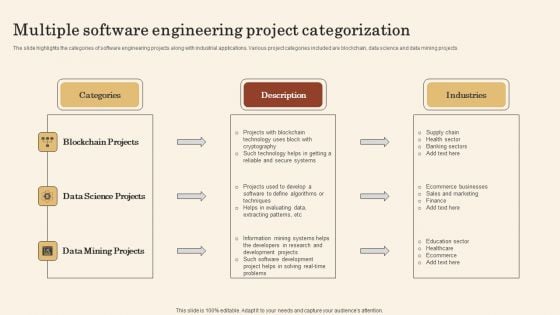
Multiple Software Engineering Project Categorization Pictures PDF
The slide highlights the categories of software engineering projects along with industrial applications. Various project categories included are blockchain, data science and data mining projects. Presenting Multiple Software Engineering Project Categorization Pictures PDF to dispense important information. This template comprises three stages. It also presents valuable insights into the topics including Description, Industries, Categories. This is a completely customizable PowerPoint theme that can be put to use immediately. So, download it and address the topic impactfully.
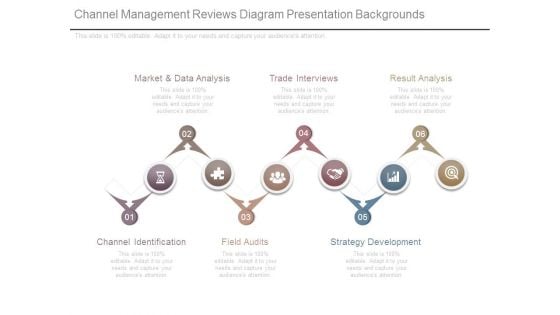
Channel Management Reviews Diagram Presentation Backgrounds
This is a channel management reviews diagram presentation backgrounds. This is a six stage process. The stages in this process are channel identification, market and data analysis, trade interviews, result analysis, strategy development, field audits.
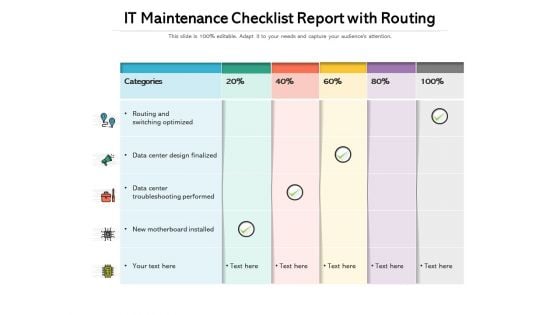
It Maintenance Checklist Report With Routing Ppt PowerPoint Presentation Professional Themes PDF
Showcasing this set of slides titled it maintenance checklist report with routing ppt powerpoint presentation professional themes pdf. The topics addressed in these templates are routing and switching optimized, data center design finalized, data center troubleshooting performed, new motherboard installed. All the content presented in this PPT design is completely editable. Download it and make adjustments in color, background, font etc. as per your unique business setting.
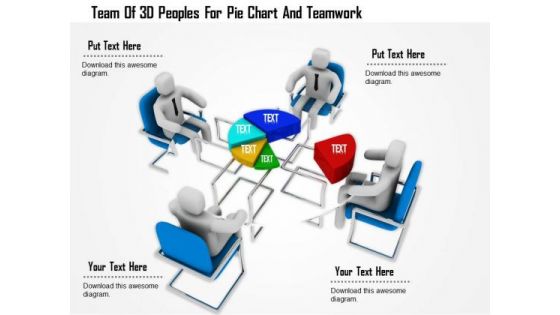
Team Of 3d Peoples For Pie Chart And Teamwork
This Power Point template has been designed with graphic of 3d team forming a pie chart. In this slide team is displaying data analysis. Use this editable slide to build innovative presentation for your viewers.
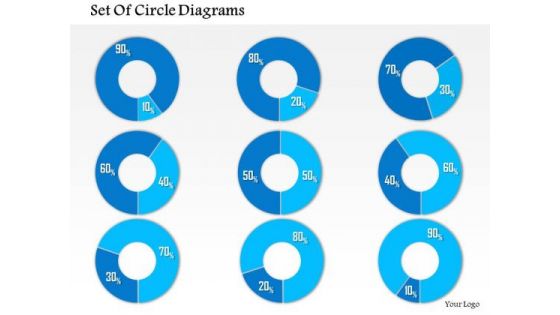
Business Framework 10 Percent To 90 Percent PowerPoint Presentation
This business diagram has been designed with graphic of multiple pie graphs. This diagram slide contains the concept of result analysis with percentage values. Use this diagram to present and compare data in an impressive manner
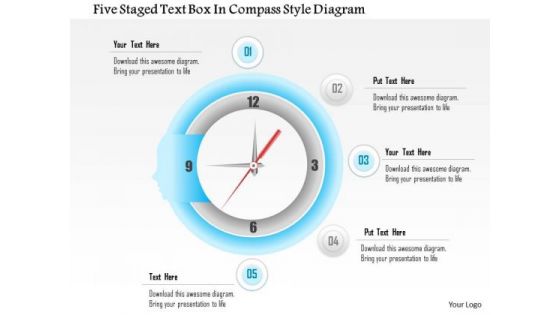
Business Diagram Five Staged Text Box In Compass Style Diagram Presentation Template
This Power Point template slide has been designed with graphic of five staged text boxes. This PPT slide contains the compass style diagram. This PPT slide can display data analysis. Use this PPT slide for your business presentations.


 Continue with Email

 Home
Home


