Data Analytics Icons
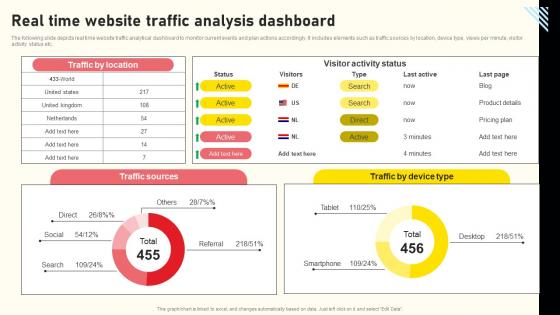
Effective Real Time Marketing Principles Real Time Website Traffic Analysis Dashboard Graphics Pdf
The following slide depicts real time website traffic analytical dashboard to monitor current events and plan actions accordingly. It includes elements such as traffic sources by location, device type, views per minute, visitor activity status etc. Present like a pro with Effective Real Time Marketing Principles Real Time Website Traffic Analysis Dashboard Graphics Pdf Create beautiful presentations together with your team, using our easy-to-use presentation slides. Share your ideas in real-time and make changes on the fly by downloading our templates. So whether you are in the office, on the go, or in a remote location, you can stay in sync with your team and present your ideas with confidence. With Slidegeeks presentation got a whole lot easier. Grab these presentations today. The following slide depicts real time website traffic analytical dashboard to monitor current events and plan actions accordingly. It includes elements such as traffic sources by location, device type, views per minute, visitor activity status etc.
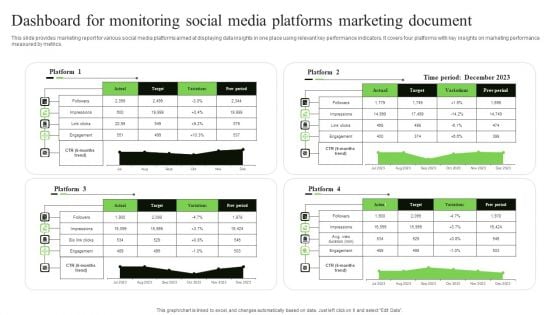
Dashboard For Monitoring Social Media Platforms Marketing Document Slides PDF
This slide provides marketing report for various social media platforms aimed at displaying data insights in one place using relevant key performance indicators. It covers four platforms with key insights on marketing performance measured by metrics. Showcasing this set of slides titled Dashboard For Monitoring Social Media Platforms Marketing Document Slides PDF. The topics addressed in these templates are Impressions, Engagement, Target. All the content presented in this PPT design is completely editable. Download it and make adjustments in color, background, font etc. as per your unique business setting.
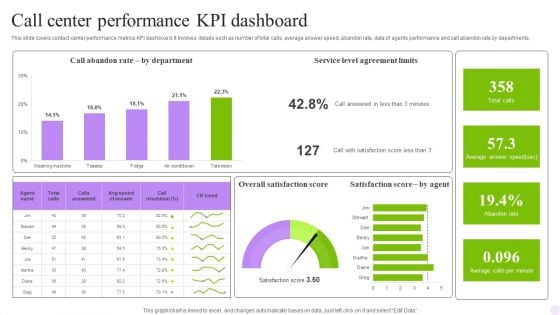
Call Center Performance KPI Dashboard Formats PDF
This slide covers contact center performance metrics KPI dashboard. It involves details such as number of total calls, average answer speed, abandon rate, data of agents performance and call abandon rate by departments. Showcasing this set of slides titled Call Center Performance KPI Dashboard Formats PDF. The topics addressed in these templates are Department, Dashboard, Agreement Limits. All the content presented in this PPT design is completely editable. Download it and make adjustments in color, background, font etc. as per your unique business setting.
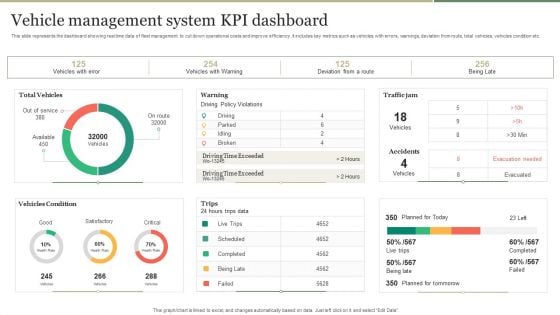
Vehicle Management System KPI Dashboard Introduction PDF
This slide represents the dashboard showing real time data of fleet management to cut down operational costs and improve efficiency. It includes key metrics such as vehicles with errors, warnings, deviation from route, total vehicles, vehicles condition etc. Pitch your topic with ease and precision using this Vehicle Management System KPI Dashboard Introduction PDF. This layout presents information on Vehicle Management System, KPI Dashboard. It is also available for immediate download and adjustment. So, changes can be made in the color, design, graphics or any other component to create a unique layout.
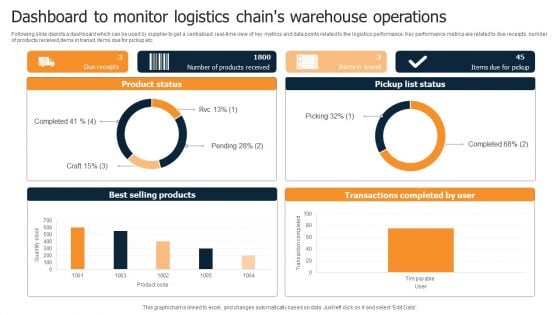
Dashboard To Monitor Logistics Chains Warehouse Operations Diagrams PDF
Following slide depicts a dashboard which can be used by supplier to get a centralized, real-time view of key metrics and data points related to the logistics performance. Key performance metrics are related to due receipts, number of products received,items in transit, items due for pickup etc. Pitch your topic with ease and precision using this Dashboard To Monitor Logistics Chains Warehouse Operations Diagrams PDF. This layout presents information on Product Status, Pickup List Status, Best Selling Products. It is also available for immediate download and adjustment. So, changes can be made in the color, design, graphics or any other component to create a unique layout.

Info Security Compliance Dashboard Of Information Security Ppt PowerPoint Presentation File Graphics Download PDF
This slide depicts the cyber security compliance report on how data and hardware are monitored in different categories such as standard, regulation, and asset type control. Deliver an awe inspiring pitch with this creative info security compliance dashboard of information security ppt powerpoint presentation file graphics download pdf bundle. Topics like compliance dashboard, asset type control, control issues by standard, control issues by regulation can be discussed with this completely editable template. It is available for immediate download depending on the needs and requirements of the user.
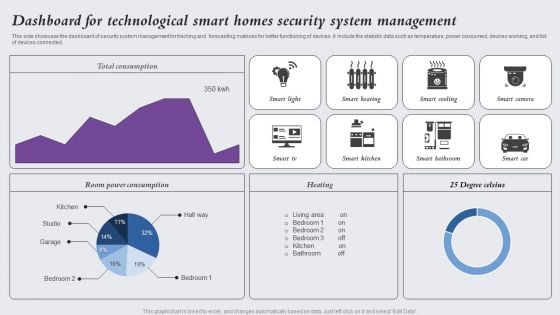
Dashboard For Technological Smart Homes Security System Management Designs PDF
This side showcase the dashboard of security system management for tracking and forecasting matrices for better functioning of devices. It include the statistic data such as temperature, power consumed, devices working, and list of devices connected. Showcasing this set of slides titled Dashboard For Technological Smart Homes Security System Management Designs PDF. The topics addressed in these templates are Smart Light, Smart Heating, Smart Cooling. All the content presented in this PPT design is completely editable. Download it and make adjustments in color, background, font etc. as per your unique business setting.
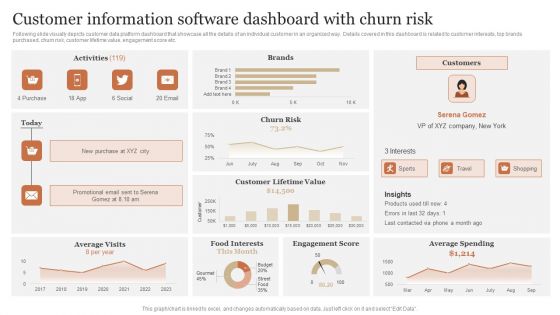
Customer Information Software Dashboard With Churn Risk Information PDF
Following slide visually depicts customer data platform dashboard that showcase all the details of an individual customer in an organized way. Details covered in this dashboard is related to customer interests, top brands purchased, churn risk, customer lifetime value, engagement score etc. Pitch your topic with ease and precision using this Customer Information Software Dashboard With Churn Risk Information PDF. This layout presents information on Customer Lifetime, Engagement Score, Average Spending. It is also available for immediate download and adjustment. So, changes can be made in the color, design, graphics or any other component to create a unique layout.

Manufactured Products Sales Performance Monitoring Dashboard Information PDF
This slide shows the dashboard the data related to the sales performance of the products manufactured by the organization in order to effectively measure and monitor the performance of the sales team. It shows details related to revenue generated and units sold etc.Pitch your topic with ease and precision using this Manufactured Products Sales Performance Monitoring Dashboard Information PDF. This layout presents information on Monthly Revenue, Manufactured Products, Sales Performance Monitoring. It is also available for immediate download and adjustment. So, changes can be made in the color, design, graphics or any other component to create a unique layout.

Property Administration System Dashboard For Rental Property Management Inspiration PDF
This slide represents dashboard of real estate management system helpful for management of rental property. It includes data related to total revenue, monthly rents collected, no .of tenants and occupied units etc. Showcasing this set of slides titled property administration system dashboard for rental property management inspiration pdf. The topics addressed in these templates are property administration system dashboard for rental property management. All the content presented in this PPT design is completely editable. Download it and make adjustments in color, background, font etc. as per your unique business setting.
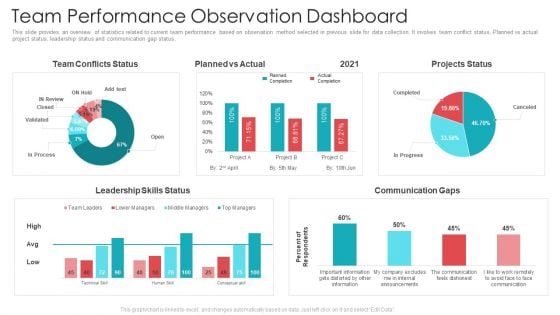
Official Team Collaboration Plan Team Performance Observation Dashboard Background PDF
This slide provides an overview of statistics related to current team performance based on observation method selected in previous slide for data collection. It involves team conflict status, Planned vs actual project status, leadership status and communication gap status. Deliver an awe-inspiring pitch with this creative official team collaboration plan team performance observation dashboard background pdf bundle. Topics like leadership skills status, team conflicts status, communication gaps can be discussed with this completely editable template. It is available for immediate download depending on the needs and requirements of the user.
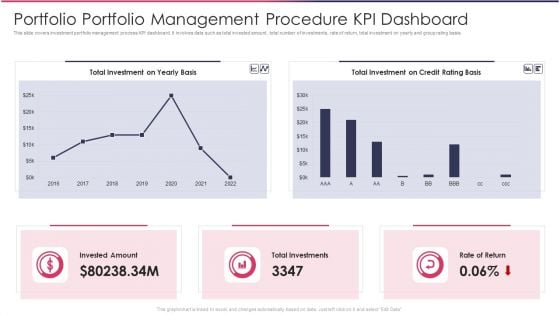
Portfolio Portfolio Management Procedure KPI Dashboard Demonstration PDF
This slide covers investment portfolio management process KPI dashboard. It involves data such as total invested amount, total number of investments, rate of return, total investment on yearly and group rating basis.Showcasing this set of slides titled Portfolio Portfolio Management Procedure KPI Dashboard Demonstration PDF The topics addressed in these templates are Total Investment, Credit Basis, Total Investments All the content presented in this PPT design is completely editable. Download it and make adjustments in color, background, font etc. as per your unique business setting.
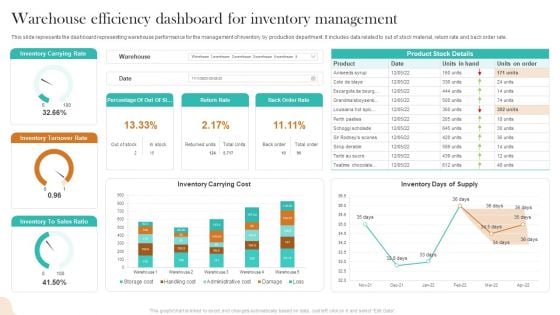
Warehouse Efficiency Dashboard For Inventory Management Infographics PDF
This slide represents the dashboard representing warehouse performance for the management of inventory by production department. It includes data related to out of stock material, return rate and back order rate. Showcasing this set of slides titled Warehouse Efficiency Dashboard For Inventory Management Infographics PDF. The topics addressed in these templates are Inventory Carrying Rate, Inventory Turnover Rate, Inventory Carrying Cost. All the content presented in this PPT design is completely editable. Download it and make adjustments in color, background, font etc. as per your unique business setting.
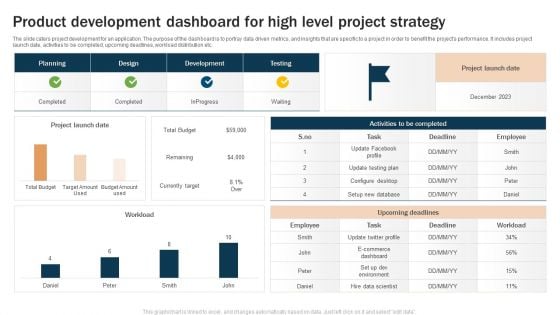
Product Development Dashboard For High Level Project Strategy Microsoft PDF
The slide caters project development for an application. The purpose of the dashboard is to portray data driven metrics, and insights that are specific to a project in order to benefit the projects performance. It includes project launch date, activities to be completed, upcoming deadlines, workload distribution etc. Showcasing this set of slides titled Product Development Dashboard For High Level Project Strategy Microsoft PDF. The topics addressed in these templates are Upcoming Deadlines, Project Launch, Upcoming Deadlines. All the content presented in this PPT design is completely editable. Download it and make adjustments in color, background, font etc. as per your unique business setting.
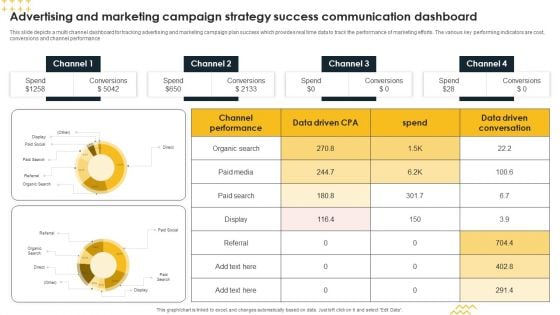
Advertising And Marketing Campaign Strategy Success Communication Dashboard Inspiration PDF
This slide depicts a multi channel dashboard for tracking advertising and marketing campaign plan success which provides real time data to track the performance of marketing efforts. The various key performing indicators are cost, conversions and channel performance Showcasing this set of slides titled Advertising And Marketing Campaign Strategy Success Communication Dashboard Inspiration PDF. The topics addressed in these templates are Conversions, Spend, Channel. All the content presented in this PPT design is completely editable. Download it and make adjustments in color, background, font etc. as per your unique business setting.
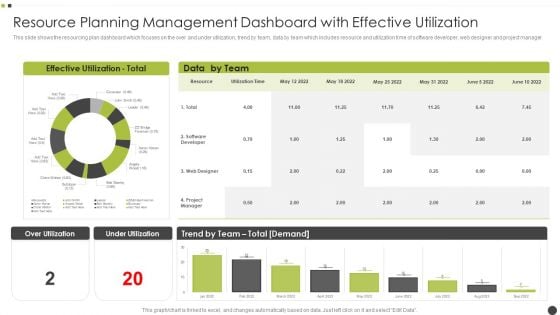
Resource Planning Management Dashboard With Effective Utilization Mockup PDF
This slide shows the resourcing plan dashboard which focuses on the over and under utilization, trend by team, data by team which includes resource and utilization time of software developer, web designer and project manager. Pitch your topic with ease and precision using this Resource Planning Management Dashboard With Effective Utilization Mockup PDF. This layout presents information on Web Designer, Software Developer, Team. It is also available for immediate download and adjustment. So, changes can be made in the color, design, graphics or any other component to create a unique layout.
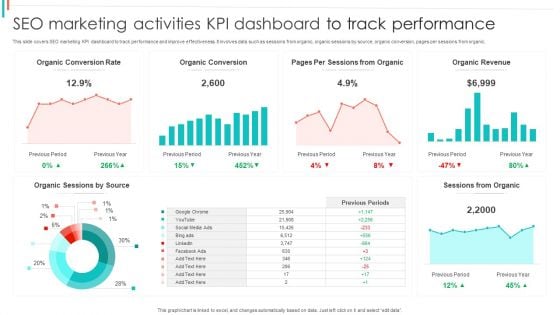
SEO Marketing Activities KPI Dashboard To Track Performance Brochure PDF
This slide covers SEO marketing KPI dashboard to track performance and improve effectiveness. It involves data such as sessions from organic, organic sessions by source, organic conversion, pages per sessions from organic.Pitch your topic with ease and precision using this SEO Marketing Activities KPI Dashboard To Track Performance Brochure PDF. This layout presents information on Organic Conversion, Sessions Organic, Organic Revenue. It is also available for immediate download and adjustment. So, changes can be made in the color, design, graphics or any other component to create a unique layout.
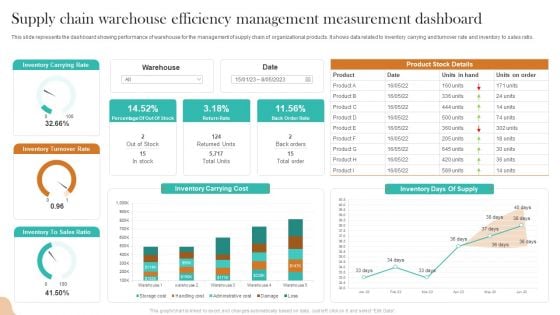
Supply Chain Warehouse Efficiency Management Measurement Dashboard Inspiration PDF
This slide represents the dashboard showing performance of warehouse for the management of supply chain of organizational products. It shows data related to inventory carrying and turnover rate and inventory to sales ratio. Pitch your topic with ease and precision using this Supply Chain Warehouse Efficiency Management Measurement Dashboard Inspiration PDF. This layout presents information on Inventory Carrying Rate, Inventory Turnover Rate, Inventory Carrying Cost. It is also available for immediate download and adjustment. So, changes can be made in the color, design, graphics or any other component to create a unique layout.
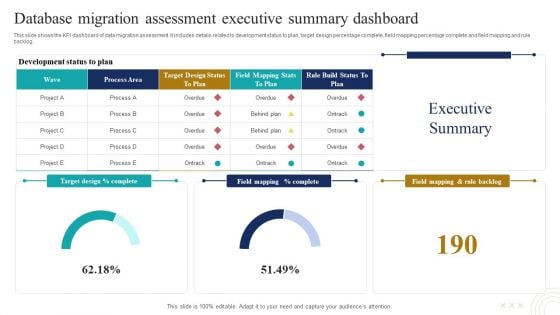
Database Migration Assessment Executive Summary Dashboard Mockup PDF
This slide shows the KPI dashboard of data migration assessment. It includes details related to development status to plan, target design percentage complete, field mapping percentage complete and field mapping and rule backlog. Pitch your topic with ease and precision using this Database Migration Assessment Executive Summary Dashboard Mockup PDF. This layout presents information on Wave, Process Area, Rule Build Status Plan. It is also available for immediate download and adjustment. So, changes can be made in the color, design, graphics or any other component to create a unique layout

Virtual Performance Management And Monitoring Dashboard Pictures PDF
Following slide illustrates remote performance dashboard utilized by organizations to monitor active issues and stay ahead of problems. This slide provides data regarding issues, problematic servers, unmonitored devices, server status, reboot time, etc. Pitch your topic with ease and precision using this Virtual Performance Management And Monitoring Dashboard Pictures PDF. This layout presents information on Total Devices, Devices With Problem, Regular Safety Check Problems. It is also available for immediate download and adjustment. So, changes can be made in the color, design, graphics or any other component to create a unique layout.
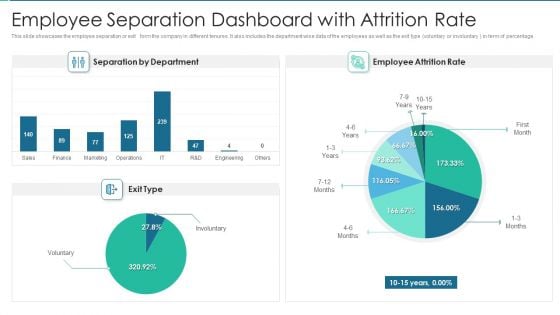
Employee Separation Dashboard With Attrition Rate Elements PDF
This slide showcases the employee separation or exit form the company in different tenures. It also includes the department wise data of the employees as well as the exit type voluntary or involuntary in term of percentage.Showcasing this set of slides titled Employee Separation Dashboard With Attrition Rate Elements PDF The topics addressed in these templates are Separation By Department, Employee Attrition Rate All the content presented in this PPT design is completely editable. Download it and make adjustments in color, background, font etc. as per your unique business setting.
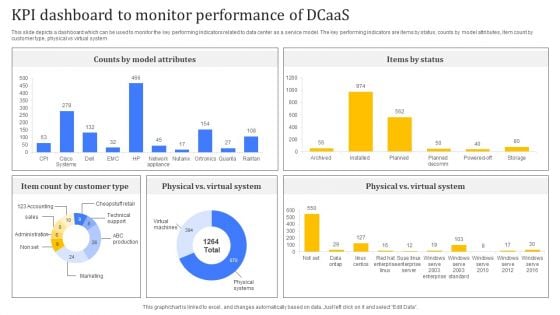
KPI Dashboard To Monitor Performance Of Dcaas Pictures PDF
Following slide highlights major benefits of applying data center as a service to business operations which can be used by businesses looking to modernize their IT infrastructure. Major benefits are in terms of scalability, flexibility, cost effectiveness, and security. Pitch your topic with ease and precision using this KPI Dashboard To Monitor Performance Of Dcaas Pictures PDF. This layout presents information on Customer Type, Counts By Model Attributes, Items By Status. It is also available for immediate download and adjustment. So, changes can be made in the color, design, graphics or any other component to create a unique layout.
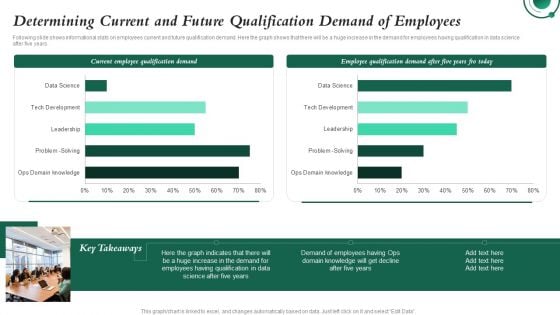
Determining Current And Future Qualification Demand Investment In Latest Technology To Ensure Formats PDF
Following slide shows informational stats on employees current and future qualification demand. Here the graph shows that there will be a huge increase in the demand for employees having qualification in data science after five years.Want to ace your presentation in front of a live audience Our Determining Current And Future Qualification Demand Investment In Latest Technology To Ensure Formats PDF can help you do that by engaging all the users towards you.. Slidegeeks experts have put their efforts and expertise into creating these impeccable powerpoint presentations so that you can communicate your ideas clearly. Moreover, all the templates are customizable, and easy-to-edit and downloadable. Use these for both personal and commercial use.

SEO Marketing Dashboard Key Tactics To Drive Better Sales High Performance Themes PDF
This slide covers SEO marketing KPI dashboard to drive better sales performance. It involves data such as sessions from organic, organic sessions by source, organic conversion, pages per sessions from organic. Showcasing this set of slides titled SEO Marketing Dashboard Key Tactics To Drive Better Sales High Performance Themes PDF. The topics addressed in these templates are Sessions From Organic, Organic Revenue, Organic Conversion Rate. All the content presented in this PPT design is completely editable. Download it and make adjustments in color, background, font etc. as per your unique business setting.
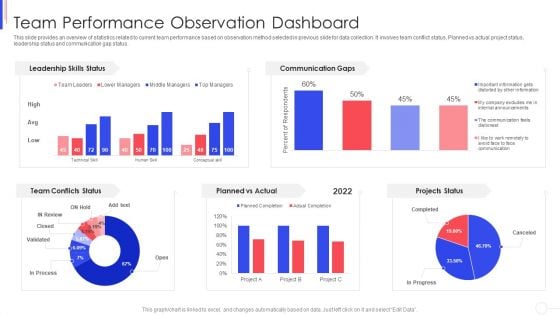
Strategy To Improve Team Proficiency Team Performance Observation Dashboard Diagrams PDF
This slide provides an overview of statistics related to current team performance based on observation method selected in previous slide for data collection. It involves team conflict status, Planned vs actual project status, leadership status and communication gap status. Deliver an awe inspiring pitch with this creative proficiency team performance observation dashboard diagrams pdf bundle. Topics like team performance observation dashboard can be discussed with this completely editable template. It is available for immediate download depending on the needs and requirements of the user.
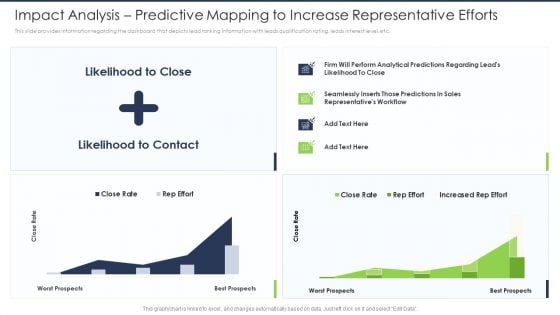
Lead Scoring AI Model Impact Analysis Predictive Mapping To Increase Representative Efforts Ppt Slides Objects PDF
This slide provides information regarding the dashboard that depicts lead ranking information with leads qualification rating, leads interest level, etc. Deliver and pitch your topic in the best possible manner with this lead scoring ai model impact analysis predictive mapping to increase representative efforts ppt slides objects pdf. Use them to share invaluable insights on workflow, sales, perform, analytical and impress your audience. This template can be altered and modified as per your expectations. So, grab it now.
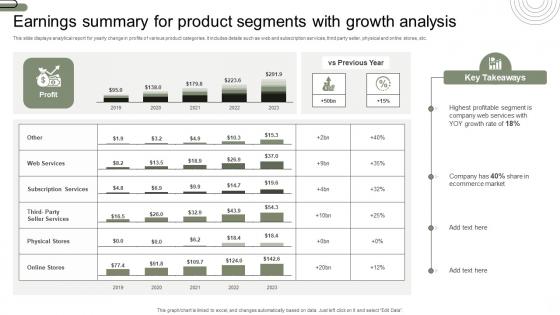
Earnings Summary For Product Segments With Growth Analysis Infographics Pdf
This slide displays analytical report for yearly change in profits of various product categories. It includes details such as web and subscription services, third party seller, physical and online stores, etc. Pitch your topic with ease and precision using this Earnings Summary For Product Segments With Growth Analysis Infographics Pdf. This layout presents information on Earnings Summary, Product Segments, Growth Analysis. It is also available for immediate download and adjustment. So, changes can be made in the color, design, graphics or any other component to create a unique layout. This slide displays analytical report for yearly change in profits of various product categories. It includes details such as web and subscription services, third party seller, physical and online stores, etc.
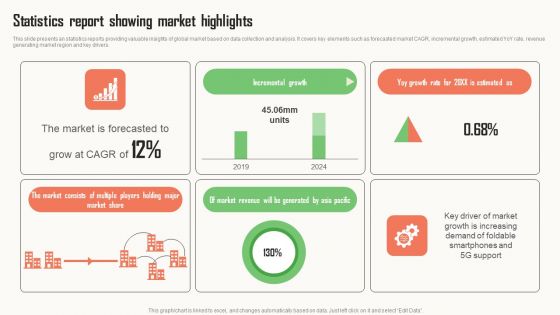
Strategic Market Insight Implementation Guide Statistics Report Showing Market Highlights Themes PDF
This slide presents an statistics reports providing valuable insights of global market based on data collection and analysis. It covers key elements such as forecasted market CAGR, incremental growth, estimated YoY rate, revenue generating market region and key drivers. From laying roadmaps to briefing everything in detail, our templates are perfect for you. You can set the stage with your presentation slides. All you have to do is download these easy to edit and customizable templates. Strategic Market Insight Implementation Guide Statistics Report Showing Market Highlights Themes PDF will help you deliver an outstanding performance that everyone would remember and praise you for. Do download this presentation today.
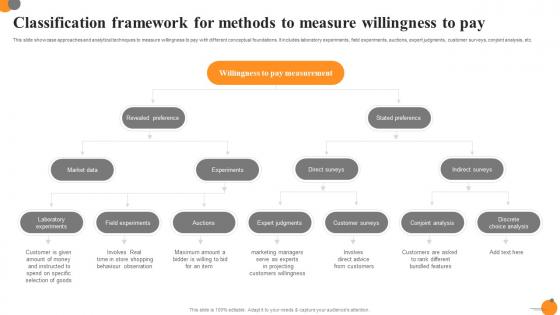
Classification Framework For Methods To Measure Willingness To Pay Ppt Layouts Demonstration Pdf
This slide showcase approaches and analytical techniques to measure willingness to pay with different conceptual foundations. It includes laboratory experiments, field experiments, auctions, expert judgments, customer surveys, conjoint analysis, etc. Showcasing this set of slides titled Classification Framework For Methods To Measure Willingness To Pay Ppt Layouts Demonstration Pdf. The topics addressed in these templates are Field Experiments, Auctions, Expert Judgments. All the content presented in this PPT design is completely editable. Download it and make adjustments in color, background, font etc. as per your unique business setting. This slide showcase approaches and analytical techniques to measure willingness to pay with different conceptual foundations. It includes laboratory experiments, field experiments, auctions, expert judgments, customer surveys, conjoint analysis, etc.
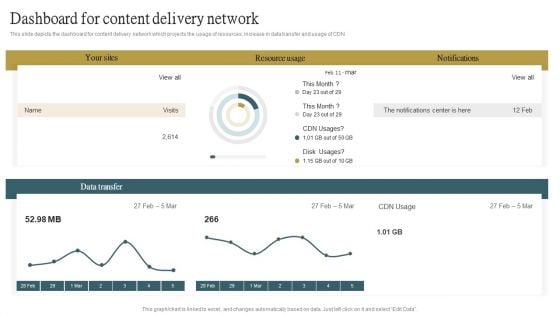
Dashboard For Content Delivery Network Ppt PowerPoint Presentation File Styles PDF
This slide depicts the dashboard for content delivery network which projects the usage of resources, increase in data transfer and usage of CDN. From laying roadmaps to briefing everything in detail, our templates are perfect for you. You can set the stage with your presentation slides. All you have to do is download these easy to edit and customizable templates. Dashboard For Content Delivery Network Ppt PowerPoint Presentation File Styles PDF will help you deliver an outstanding performance that everyone would remember and praise you for. Do download this presentation today.
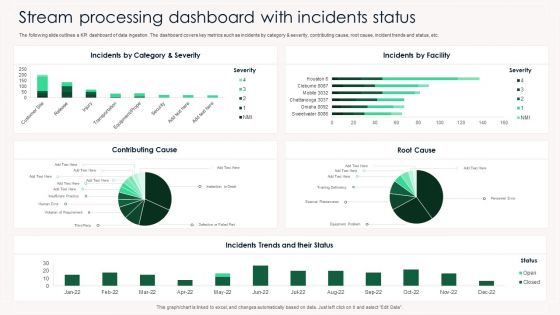
Stream Processing Dashboard With Incidents Status Ppt PowerPoint Presentation Gallery Portrait PDF
The following slide outlines a KPI dashboard of data ingestion. The dashboard covers key metrics such as incidents by category and severity, contributing cause, root cause, incident trends and status, etc. Showcasing this set of slides titled Stream Processing Dashboard With Incidents Status Ppt PowerPoint Presentation Gallery Portrait PDF. The topics addressed in these templates are Incidens, Category And Severity, Incidents By Facility, Contributing Cause. All the content presented in this PPT design is completely editable. Download it and make adjustments in color, background, font etc. as per your unique business setting.
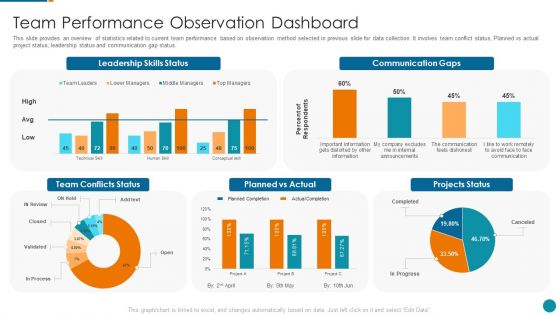
Strategic Procedure To Improve Employee Efficiency Team Performance Observation Dashboard Formats PDF
This slide provides an overview of statistics related to current team performance based on observation method selected in previous slide for data collection. It involves team conflict status, Planned vs actual project status, leadership status and communication gap status.Deliver an awe inspiring pitch with this creative strategic procedure to improve employee efficiency team performance observation dashboard formats pdf bundle. Topics like leadership skills status, communication gaps, planned vs actual can be discussed with this completely editable template. It is available for immediate download depending on the needs and requirements of the user.
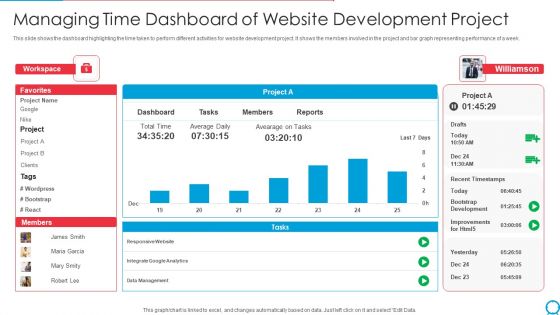
Managing Time Dashboard Of Website Development Project Ppt PowerPoint Presentation Gallery Outline PDF
This slide shows the dashboard highlighting the time taken to perform different activities for website development project. It shows the members involved in the project and bar graph representing performance of a week. Showcasing this set of slides titled managing time dashboard of website development project ppt powerpoint presentation gallery outline pdf. The topics addressed in these templates are workspace, project, data management, recent timestamps. All the content presented in this PPT design is completely editable. Download it and make adjustments in color, background, font etc. as per your unique business setting.
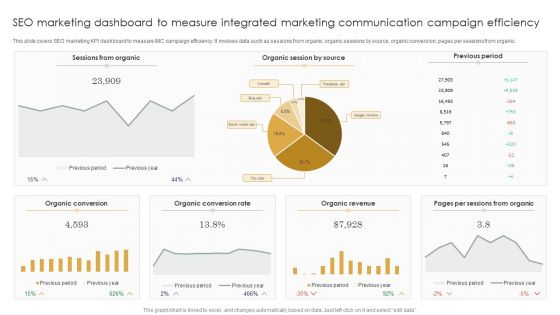
SEO Marketing Dashboard To Measure Integrated Marketing Communication Campaign Efficiency Brochure PDF
This slide covers SEO marketing KPI dashboard to measure IMC campaign efficiency. It involves data such as sessions from organic, organic sessions by source, organic conversion, pages per sessions from organic. Showcasing this set of slides titled SEO Marketing Dashboard To Measure Integrated Marketing Communication Campaign Efficiency Brochure PDF. The topics addressed in these templates are Sessions Organic, Organic Session Source, Previous Period, Organic Revenue. All the content presented in this PPT design is completely editable. Download it and make adjustments in color, background, font etc. as per your unique business setting.

Dashboard To Analyze City Ecological And Carbon Footprints Consumption Mockup PDF
This slide illustrates the dashboard to analyze ecological and carbon footprint of a city. The purpose of this template is to provide layout to analyze footprint data and define measures to protect environment. It includes metrics related to carbon emissions, usage of air, water and energy. Showcasing this set of slides titled Dashboard To Analyze City Ecological And Carbon Footprints Consumption Mockup PDF. The topics addressed in these templates are Installing Rooftop Photovoltaic, Using Mass Transport, Composting. All the content presented in this PPT design is completely editable. Download it and make adjustments in color, background, font etc. as per your unique business setting.
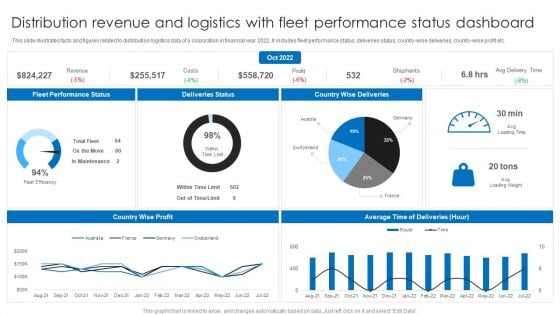
Distribution Revenue And Logistics With Fleet Performance Status Dashboard Ppt Layouts Background PDF
This slide illustrates facts and figures related to distribution logistics data of a corporation in financial year 2022. It includes fleet performance status, deliveries status, country-wise deliveries, country-wise profit etc. Pitch your topic with ease and precision using this Distribution Revenue And Logistics With Fleet Performance Status Dashboard Ppt Layouts Background PDF. This layout presents information on Deliveries Status, Country Wise Deliveries, Fleet Performance Status. It is also available for immediate download and adjustment. So, changes can be made in the color, design, graphics or any other component to create a unique layout.
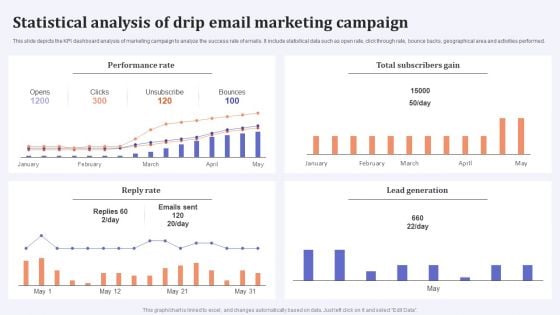
Statistical Analysis Of Drip Email Marketing Campaign Microsoft PDF
This slide depicts the KPI dashboard analysis of marketing campaign to analyze the success rate of emails. It include statistical data such as open rate, click through rate, bounce backs, geographical area and activities performed. Showcasing this set of slides titled Statistical Analysis Of Drip Email Marketing Campaign Microsoft PDF. The topics addressed in these templates are Performance Rate, Total Subscribers Gain, Reply Rate. All the content presented in this PPT design is completely editable. Download it and make adjustments in color, background, font etc. as per your unique business setting.

Construct Project Feasibility Analysis Report Ppt PowerPoint Presentation Complete Deck With Slides
This Construct Project Feasibility Analysis Report Ppt PowerPoint Presentation Complete Deck With Slides is designed to help you retain your audiences attention. This content ready PowerPoint Template enables you to take your audience on a journey and share information in a way that is easier to recall. It helps you highlight the crucial parts of your work so that the audience does not get saddled with information download. This forty nine slide PPT Deck comes prepared with the graphs and charts you could need to showcase your information through visuals. You only need to enter your own data in them. Download this editable PowerPoint Theme and walk into that meeting with confidence.
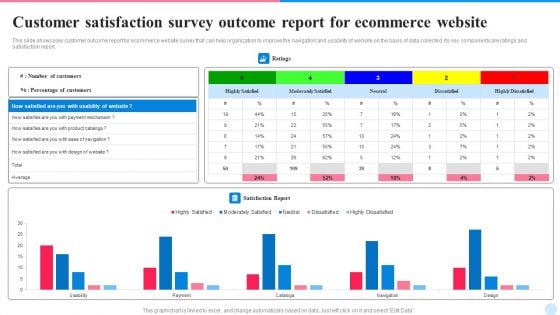
Customer Satisfaction Survey Outcome Report For Ecommerce Website Themes PDF
This slide showcases customer outcome report for ecommerce website survey that can help organization to improve the navigation and usability of website on the basis of data collected. Its key components are ratings and satisfaction report. Pitch your topic with ease and precision using this Customer Satisfaction Survey Outcome Report For Ecommerce Website Themes PDF. This layout presents information on Customer Satisfaction, Survey Outcome Report, Ecommerce Website. It is also available for immediate download and adjustment. So, changes can be made in the color, design, graphics or any other component to create a unique layout.
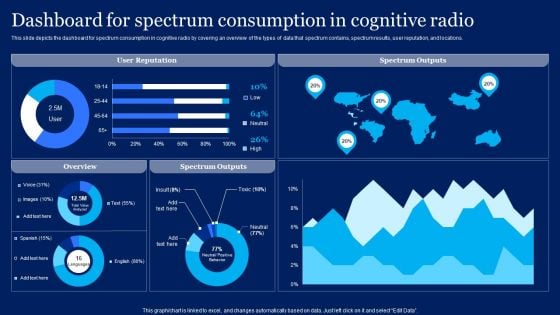
Cognitive Sensor Network Dashboard For Spectrum Consumption In Cognitive Radio Introduction PDF
This slide depicts the dashboard for spectrum consumption in cognitive radio by covering an overview of the types of data that spectrum contains, spectrum results, user reputation, and locations. Find a pre designed and impeccable Cognitive Sensor Network Dashboard For Spectrum Consumption In Cognitive Radio Introduction PDF. The templates can ace your presentation without additional effort. You can download these easy to edit presentation templates to make your presentation stand out from others. So, what are you waiting for Download the template from Slidegeeks today and give a unique touch to your presentation.

Life Science And Healthcare Solutions Company Profile Ppt PowerPoint Presentation Complete Deck With Slides
This Life Science And Healthcare Solutions Company Profile Ppt PowerPoint Presentation Complete Deck With Slides is designed to help you retain your audiences attention. This content-ready PowerPoint Template enables you to take your audience on a journey and share information in a way that is easier to recall. It helps you highlight the crucial parts of your work so that the audience does not get saddled with information download. This fifty four-slide PPT Deck comes prepared with the graphs and charts you could need to showcase your information through visuals. You only need to enter your own data in them. Download this editable PowerPoint Theme and walk into that meeting with confidence.
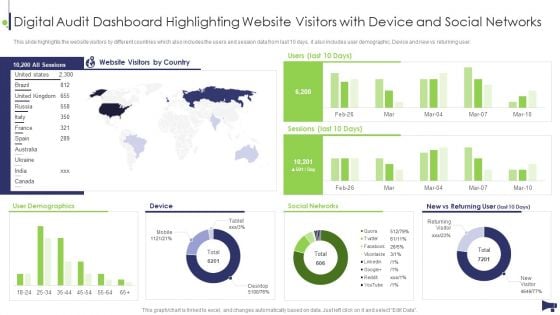
Website And Social Media Digital Audit Dashboard Highlighting Website Visitors With Device Rules PDF
This slide highlights the website visitors by different countries which also includes the users and session data from last 10 days, it also includes user demographic. Device and new vs returning user. Deliver an awe inspiring pitch with this creative Website And Social Media Digital Audit Dashboard Highlighting Website Visitors With Device Rules PDF bundle. Topics like Website Visitors Country, User Demographics, Social Networks can be discussed with this completely editable template. It is available for immediate download depending on the needs and requirements of the user.
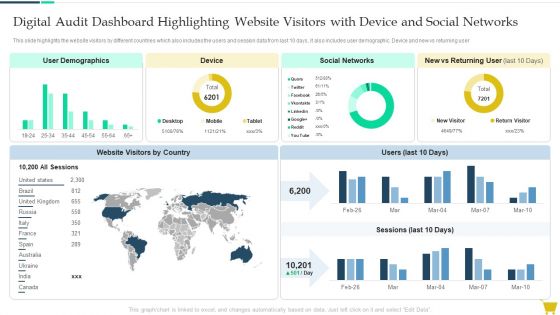
Digital Audit Dashboard Highlighting Website Visitors With Device And Social Networks Guidelines PDF
This slide highlights the website visitors by different countries which also includes the users and session data from last 10 days, it also includes user demographic. Device and new vs returning user. Deliver and pitch your topic in the best possible manner with this Digital Audit Dashboard Highlighting Website Visitors With Device And Social Networks Guidelines PDF. Use them to share invaluable insights on Device, Social Networks, User Demographics and impress your audience. This template can be altered and modified as per your expectations. So, grab it now.
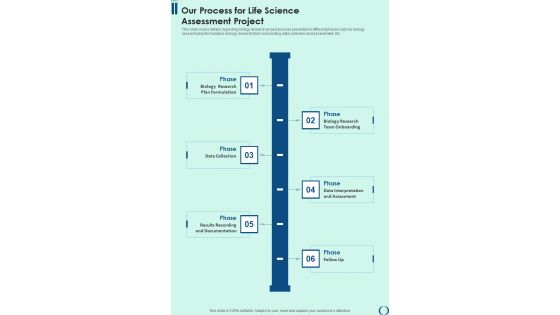
Our Process For Life Science Assessment Project One Pager Sample Example Document
This slide covers details regarding biology research project process presented in different phases such as biology research plan formulation, biology research team onboarding, data collection and assessment, etc. Presenting you an exemplary Our Process For Life Science Assessment Project One Pager Sample Example Document. Our one-pager comprises all the must-have essentials of an inclusive document. You can edit it with ease, as its layout is completely editable. With such freedom, you can tweak its design and other elements to your requirements. Download this Our Process For Life Science Assessment Project One Pager Sample Example Document brilliant piece now.
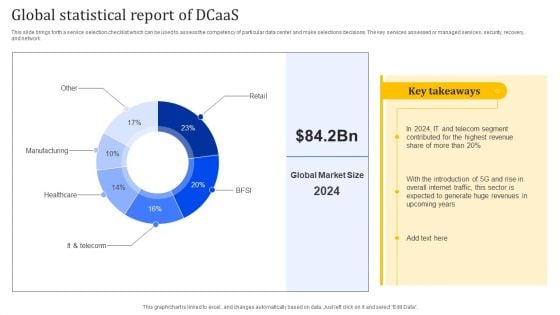
Global Statistical Report Of Dcaas Portrait PDF
This slide brings forth a service selection checklist which can be used to assess the competency of particular data center and make selections decisions. The key services assessed or managed services, security, recovery, and network. Showcasing this set of slides titled Global Statistical Report Of Dcaas Portrait PDF. The topics addressed in these templates are Manufacturing, Healthcare, Global Statistical. All the content presented in this PPT design is completely editable. Download it and make adjustments in color, background, font etc. as per your unique business setting.
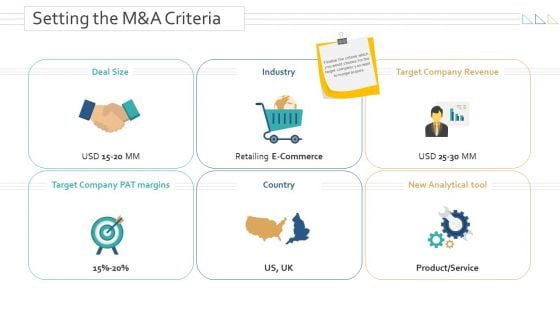
Amalgamation Acquisitions Setting The M And A Criteria Diagrams PDF
This is a amalgamation acquisitions setting the m and a criteria diagrams pdf template with various stages. Focus and dispense information on six stages using this creative set, that comes with editable features. It contains large content boxes to add your information on topics like target company revenue, analytical tool, product, service. You can also showcase facts, figures, and other relevant content using this PPT layout. Grab it now.

Navigating B2B Sales CRM Systems Overview Types And Benefits SA SS V
This slide presents the overview of customer relationship management CRM systems. It include various types of CRM systems such as operational CRM, analytical CRM and collaborative CRM. Are you searching for a Navigating B2B Sales CRM Systems Overview Types And Benefits SA SS V that is uncluttered, straightforward, and original Its easy to edit, and you can change the colors to suit your personal or business branding. For a presentation that expresses how much effort you have put in, this template is ideal With all of its features, including tables, diagrams, statistics, and lists, its perfect for a business plan presentation. Make your ideas more appealing with these professional slides. Download Navigating B2B Sales CRM Systems Overview Types And Benefits SA SS V from Slidegeeks today. This slide presents the overview of customer relationship management CRM systems. It include various types of CRM systems such as operational CRM, analytical CRM and collaborative CRM.
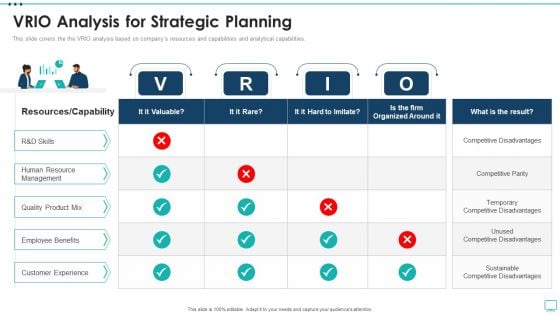
Strategic Business Plan Effective Tools VRIO Analysis For Strategic Planning Themes PDF
This slide covers the the VRIO analysis based on companys resources and capabilities and analytical capabilities. Deliver and pitch your topic in the best possible manner with this strategic business plan effective tools vrio analysis for strategic planning themes pdf. Use them to share invaluable insights on human resource management, quality product mix, employee benefits, customer experience and impress your audience. This template can be altered and modified as per your expectations. So, grab it now.
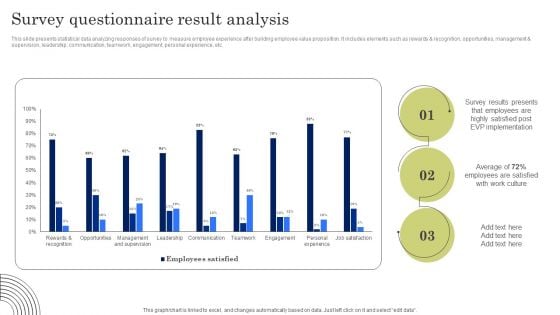
Survey Questionnaire Result Analysis Themes PDF
This slide presents statistical data analyzing responses of survey to measure employee experience after building employee value proposition. It includes elements such as rewards and recognition, opportunities, management and supervision, leadership, communication, teamwork, engagement, personal experience, etc. Boost your pitch with our creative Survey Questionnaire Result Analysis Themes PDF. Deliver an awe-inspiring pitch that will mesmerize everyone. Using these presentation templates you will surely catch everyones attention. You can browse the ppts collection on our website. We have researchers who are experts at creating the right content for the templates. So you do not have to invest time in any additional work. Just grab the template now and use them.
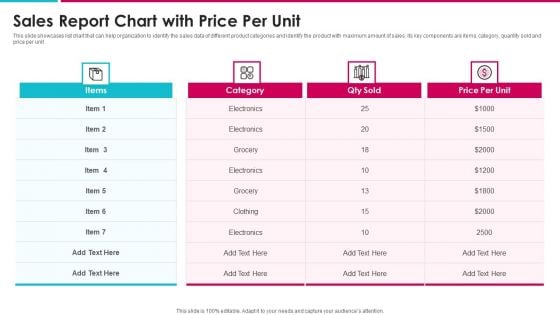
Sales Report Chart With Price Per Unit Information PDF
This slide showcases list chart that can help organization to identify the sales data of different product categories and identify the product with maximum amount of sales. Its key components are items, category, quantity sold and price per unit Showcasing this set of slides titled sales report chart with price per unit information pdf. The topics addressed in these templates are sales report chart with price per unit. All the content presented in this PPT design is completely editable. Download it and make adjustments in color, background, font etc. as per your unique business setting.
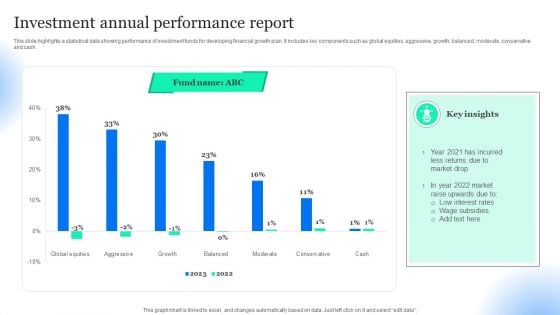
Investment Annual Performance Report Pictures PDF
This slide highlights a statistical data showing performance of investment funds for developing financial growth plan. It includes key components such as global equities, aggressive, growth, balanced, moderate, conservative and cash. Pitch your topic with ease and precision using this Investment Annual Performance Report Pictures PDF. This layout presents information on Low Interest Rates, Wage Subsidies, Returns Due Market Drop. It is also available for immediate download and adjustment. So, changes can be made in the color, design, graphics or any other component to create a unique layout.
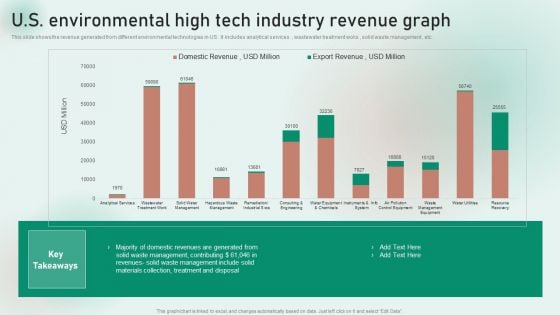
U S Environmental High Tech Industry Revenue Graph Professional PDF
This slide shows the revenue generated from different environmental technologies in US . It includes analytical services , wastewater treatment woks , solid waste management , etc. Showcasing this set of slides titled U S Environmental High Tech Industry Revenue Graph Professional PDF. The topics addressed in these templates are Management, Materials Collection, Revenues. All the content presented in this PPT design is completely editable. Download it and make adjustments in color, background, font etc. as per your unique business setting.
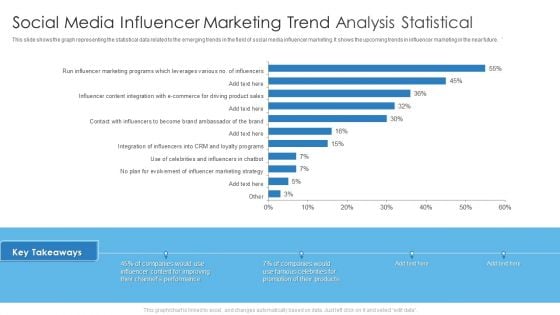
Social Media Influencer Marketing Trend Analysis Statistical Themes PDF
This slide shows the graph representing the statistical data related to the emerging trends in the field of social media influencer marketing. It shows the upcoming trends in influencer marketing in the near future. Deliver an awe inspiring pitch with this creative Social Media Influencer Marketing Trend Analysis Statistical Themes PDF bundle. Topics like Social Media Influencer, Marketing Trend Analysis Statistical can be discussed with this completely editable template. It is available for immediate download depending on the needs and requirements of the user.
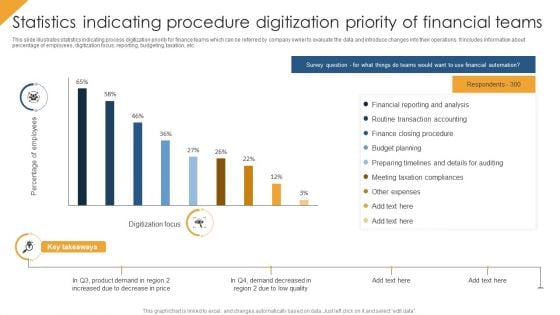
Statistics Indicating Procedure Digitization Priority Of Financial Teams Themes PDF
This slide illustrates statistics indicating process digitization priority for finance teams which can be referred by company owner to evaluate the data and introduce changes into their operations. It includes information about percentage of employees, digitization focus, reporting, budgeting, taxation, etc. Showcasing this set of slides titled Statistics Indicating Procedure Digitization Priority Of Financial Teams Themes PDF. The topics addressed in these templates are Budget Planning, Financial Reporting And Analysis, Other Expenses. All the content presented in this PPT design is completely editable. Download it and make adjustments in color, background, font etc. as per your unique business setting.
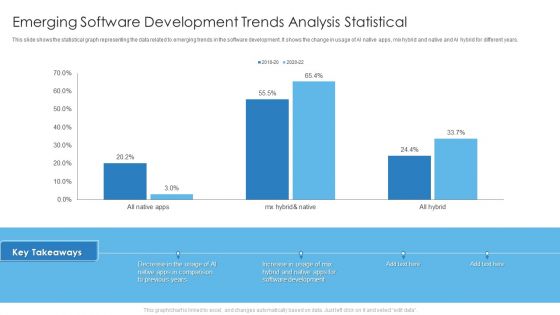
Emerging Software Development Trends Analysis Statistical Diagrams PDF
This slide shows the statistical graph representing the data related to emerging trends in the software development. It shows the change in usage of AI native apps, mix hybrid and native and AI hybrid for different years. Deliver and pitch your topic in the best possible manner with this Emerging Software Development Trends Analysis Statistical Diagrams PDF. Use them to share invaluable insights on Emerging Software Development, Trends Analysis Statistical and impress your audience. This template can be altered and modified as per your expectations. So, grab it now.
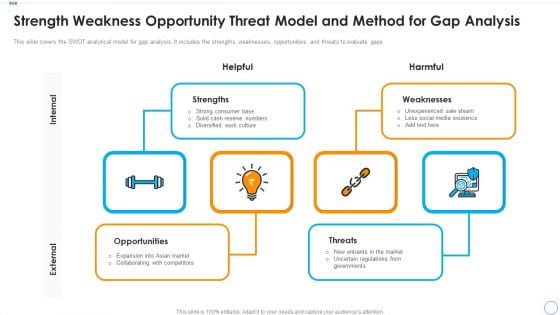
Strength Weakness Opportunity Threat Model And Method For Gap Analysis Designs PDF
This slide covers the SWOT analytical model for gap analysis. It includes the strengths, weaknesses, opportunities, and threats to evaluate gaps. Presenting strength weakness opportunity threat model and method for gap analysis designs pdf to dispense important information. This template comprises four stages. It also presents valuable insights into the topics including strengths, opportunities, weaknesses. This is a completely customizable PowerPoint theme that can be put to use immediately. So, download it and address the topic impactfully.
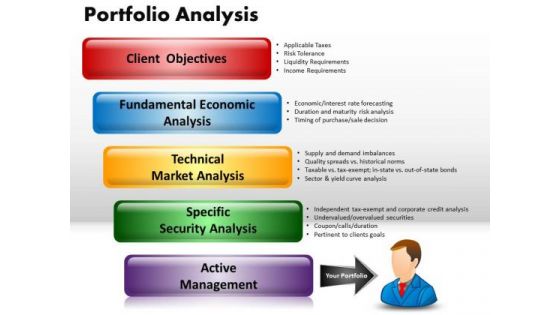
PowerPoint Templates Process Portfolio Analysis Ppt Themes
PowerPoint Templates Process Portfolio Analysis PPT Themes-These high quality powerpoint pre-designed slides and powerpoint templates have been carefully created by our professional team to help you impress your audience. All slides have been created and are 100% editable in powerpoint. Each and every property of any graphic - color, size, orientation, shading, outline etc. can be modified to help you build an effective powerpoint presentation. Any text can be entered at any point in the powerpoint template or slide. Simply DOWNLOAD, TYPE and PRESENT! Put up the facts and figures on our PowerPoint Templates Process Portfolio Analysis Ppt Themes. Display the data for everyone's consumption.
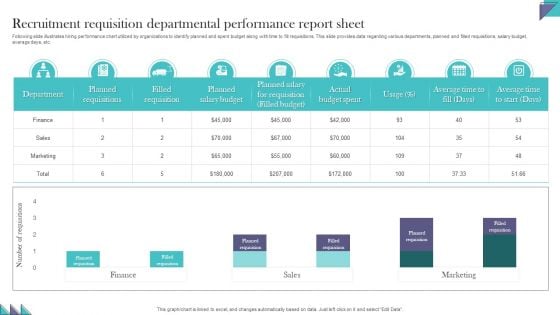
Recruitment Requisition Departmental Performance Report Sheet Demonstration PDF
Following slide illustrates hiring performance chart utilized by organizations to identify planned and spent budget along with time to fill requisitions. This slide provides data regarding various departments, planned and filled requisitions, salary budget, average days, etc. Pitch your topic with ease and precision using this Recruitment Requisition Departmental Performance Report Sheet Demonstration PDF. This layout presents information on Recruitment Requisition, Departmental Performance, Report Sheet. It is also available for immediate download and adjustment. So, changes can be made in the color, design, graphics or any other component to create a unique layout.
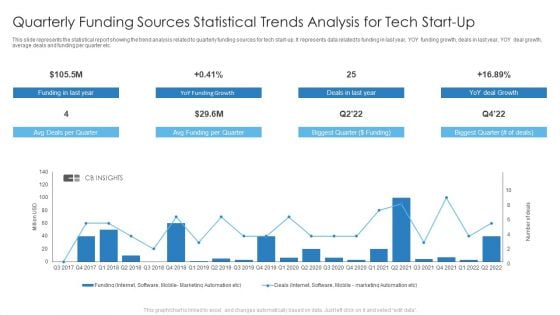
Quarterly Funding Sources Statistical Trends Analysis For Tech Start Up Download PDF
This slide represents the statistical report showing the trend analysis related to quarterly funding sources for tech start-up. It represents data related to funding in last year, YOY funding growth, deals in last year, YOY deal growth, average deals and funding per quarter etc. Deliver an awe inspiring pitch with this creative Quarterly Funding Sources Statistical Trends Analysis For Tech Start Up Download PDF bundle. Topics like Funding Growth, Biggest Quarter, Avg Funding Per Quarter can be discussed with this completely editable template. It is available for immediate download depending on the needs and requirements of the user.
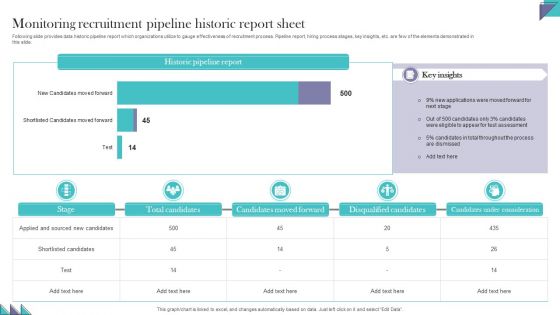
Monitoring Recruitment Pipeline Historic Report Sheet Pictures PDF
Following slide provides data historic pipeline report which organizations utilize to gauge effectiveness of recruitment process. Pipeline report, hiring process stages, key insights, etc. are few of the elements demonstrated in this slide. Pitch your topic with ease and precision using this Monitoring Recruitment Pipeline Historic Report Sheet Pictures PDF. This layout presents information on Candidates Moved Forward, Disqualified Candidates, Candidates Under Consideration. It is also available for immediate download and adjustment. So, changes can be made in the color, design, graphics or any other component to create a unique layout
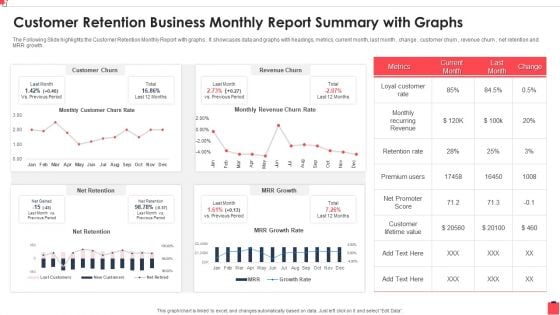
Customer Retention Business Monthly Report Summary With Graphs Guidelines PDF
The Following Slide highlights the Customer Retention Monthly Report with graphs . It showcases data and graphs with headings, metrics, current month, last month , change , customer churn , revenue churn , net retention and MRR growth. Showcasing this set of slides titled Customer Retention Business Monthly Report Summary With Graphs Guidelines PDF The topics addressed in these templates are Recurring Revenue, Customer Churn, Promoter Score All the content presented in this PPT design is completely editable. Download it and make adjustments in color, background, font etc. as per your unique business setting.
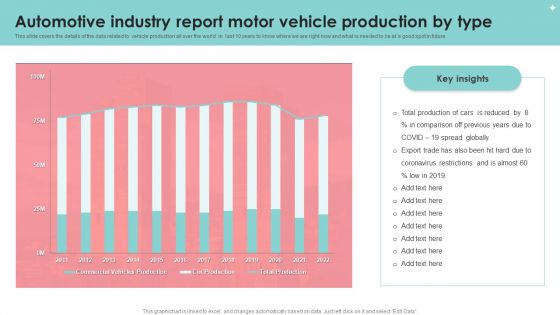
Automotive Industry Report Motor Vehicle Production By Type Portrait PDF
This slide covers the details of the data related to vehicle production all over the world in last 10 years to know where we are right now and what is needed to be at a good spot in future. Pitch your topic with ease and precision using this Automotive Industry Report Motor Vehicle Production By Type Portrait PDF. This layout presents information on Automotive Industry Report, Motor Vehicle Production. It is also available for immediate download and adjustment. So, changes can be made in the color, design, graphics or any other component to create a unique layout.
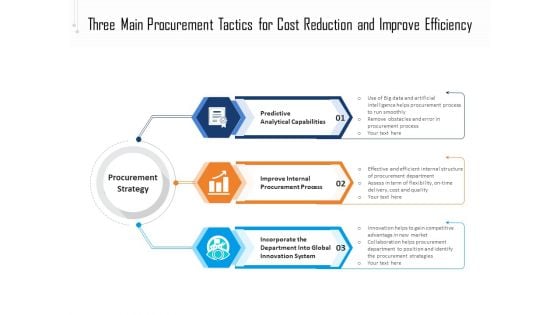
Three Main Procurement Tactics For Cost Reduction And Improve Efficiency Ppt PowerPoint Presentation File Deck PDF
Presenting three main procurement tactics for cost reduction and improve efficiency ppt powerpoint presentation file deck pdf to dispense important information. This template comprises three stages. It also presents valuable insights into the topics including predictive analytical capabilities, improve internal procurement process, incorporate the department into global innovation system. This is a completely customizable PowerPoint theme that can be put to use immediately. So, download it and address the topic impactfully.
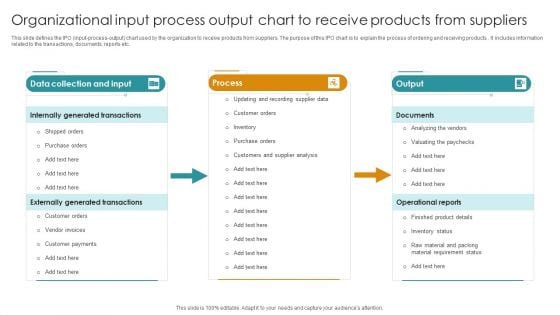
Organizational Input Process Output Chart To Receive Products From Suppliers Topics PDF
This slide defines the IPO input-process-output chart used by the organization to receive products from suppliers. The purpose of this IPO chart is to explain the process of ordering and receiving products . It includes information related to the transactions, documents, reports etc. Pitch your topic with ease and precision using this Organizational Input Process Output Chart To Receive Products From Suppliers Topics PDF. This layout presents information on Data Collection And Input, Process, Output. It is also available for immediate download and adjustment. So, changes can be made in the color, design, graphics or any other component to create a unique layout.
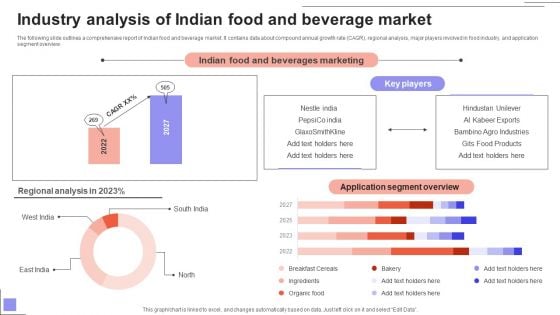
Overview Of The Food Industry Analysis Of Indian Food And Beverage Market Pictures PDF
The following slide outlines a comprehensive report of Indian food and beverage market. It contains data about compound annual growth rate CAGR, regional analysis, major players involved in food industry, and application segment overview. There are so many reasons you need a Overview Of The Food Industry Analysis Of Indian Food And Beverage Market Pictures PDF. The first reason is you can not spend time making everything from scratch, Thus, Slidegeeks has made presentation templates for you too. You can easily download these templates from our website easily.

Executive Report Ppt PowerPoint Presentation Complete Deck With Slides
This Executive Report Ppt PowerPoint Presentation Complete Deck With Slides is designed to help you retain your audiences attention. This content ready PowerPoint Template enables you to take your audience on a journey and share information in a way that is easier to recall. It helps you highlight the crucial parts of your work so that the audience does not get saddled with information download. This fourteen slide PPT Deck comes prepared with the graphs and charts you could need to showcase your information through visuals. You only need to enter your own data in them. Download this editable PowerPoint Theme and walk into that meeting with confidence.
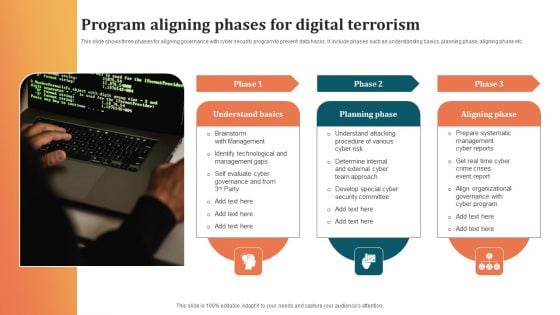
Program Aligning Phases For Digital Terrorism Infographics PDF
This slide shows three phases for aligning governance with cyber security program to prevent data hacks. It include phases such as understanding basics, planning phase, aligning phase etc. Persuade your audience using this Program Aligning Phases For Digital Terrorism Infographics PDF. This PPT design covers three stages, thus making it a great tool to use. It also caters to a variety of topics including Planning Phase, Aligning Phase, Understand Basics. Download this PPT design now to present a convincing pitch that not only emphasizes the topic but also showcases your presentation skills.
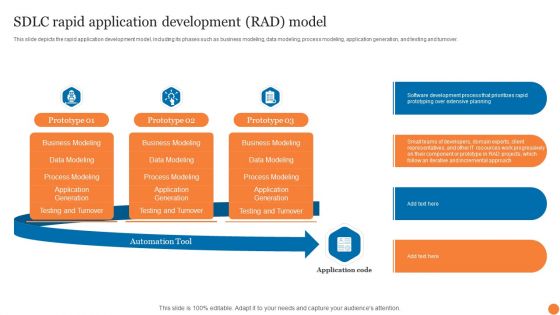
SDLC Rapid Application Development Rad Model Phases Of Software Development Procedure Sample PDF
This slide depicts the rapid application development model, including its phases such as business modeling, data modeling, process modeling, application generation, and testing and turnover.Welcome to our selection of the SDLC Rapid Application Development Rad Model Phases Of Software Development Procedure Sample PDF. These are designed to help you showcase your creativity and bring your sphere to life. Planning and Innovation are essential for any business that is just starting out. This collection contains the designs that you need for your everyday presentations. All of our PowerPoints are 100precent editable, so you can customize them to suit your needs. This multi-purpose template can be used in various situations. Grab these presentation templates today.
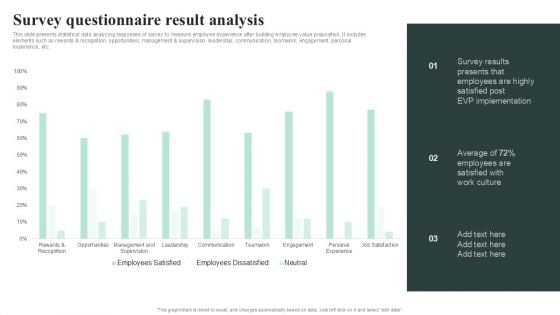
Survey Questionnaire Result Analysis Demonstration PDF
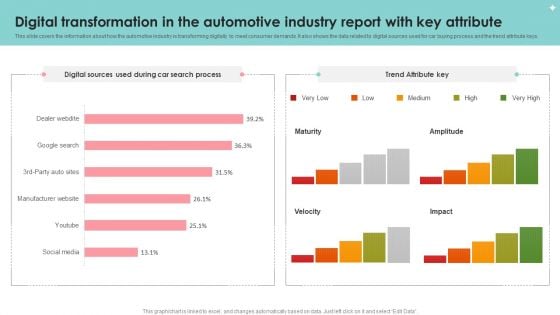
Digital Transformation In The Automotive Industry Report With Key Attribute Slides PDF
This slide covers the information about how the automotive industry is transforming digitally to meet consumer demands. It also shows the data related to digital sources used for car buying process and the trend attribute keys. Pitch your topic with ease and precision using this Digital Transformation In The Automotive Industry Report With Key Attribute Slides PDF. This layout presents information on Digital Transformation, Automotive Industry Report, Key Attribute. It is also available for immediate download and adjustment. So, changes can be made in the color, design, graphics or any other component to create a unique layout.
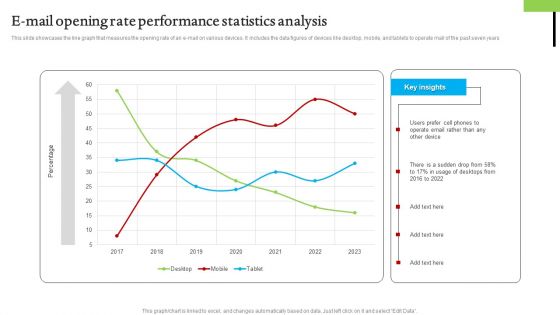
E Mail Opening Rate Performance Statistics Analysis Mockup PDF
This slide showcases the line graph that measures the opening rate of an e-mail on various devices. It includes the data figures of devices like desktop, mobile, and tablets to operate mail of the past seven years. Showcasing this set of slides titled E Mail Opening Rate Performance Statistics Analysis Mockup PDF. The topics addressed in these templates are E Mail Opening Rate, Performance Statistics Analysis. All the content presented in this PPT design is completely editable. Download it and make adjustments in color, background, font etc. as per your unique business setting.
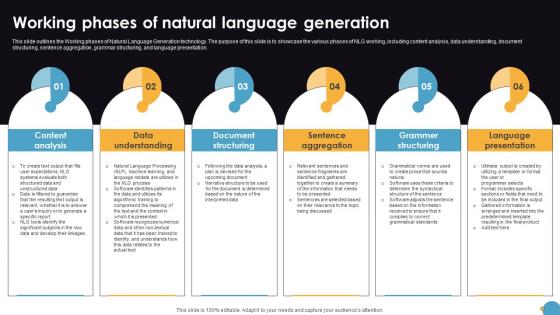
Working Phases Of Natural Language Generation Natural Language Automation
This slide outlines the Working phases of Natural Language Generation technology. The purpose of this slide is to showcase the various phases of NLG working, including content analysis, data understanding, document structuring, sentence aggregation, grammar structuring, and language presentation. Are you in need of a template that can accommodate all of your creative concepts This one is crafted professionally and can be altered to fit any style. Use it with Google Slides or PowerPoint. Include striking photographs, symbols, depictions, and other visuals. Fill, move around, or remove text boxes as desired. Test out color palettes and font mixtures. Edit and save your work, or work with colleagues. Download Working Phases Of Natural Language Generation Natural Language Automation and observe how to make your presentation outstanding. Give an impeccable presentation to your group and make your presentation unforgettable. This slide outlines the Working phases of Natural Language Generation technology. The purpose of this slide is to showcase the various phases of NLG working, including content analysis, data understanding, document structuring, sentence aggregation, grammar structuring, and language presentation.
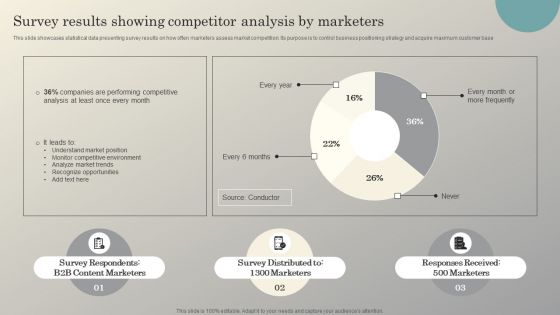
Steps To Conduct Competitor Analysis Survey Results Showing Competitor Analysis Mockup PDF
This slide showcases statistical data presenting survey results on how often marketers assess market competition. Its purpose is to control business positioning strategy and acquire maximum customer base. Want to ace your presentation in front of a live audience Our Steps To Conduct Competitor Analysis Survey Results Showing Competitor Analysis Mockup PDF can help you do that by engaging all the users towards you. Slidegeeks experts have put their efforts and expertise into creating these impeccable powerpoint presentations so that you can communicate your ideas clearly. Moreover, all the templates are customizable, and easy-to-edit and downloadable. Use these for both personal and commercial use.
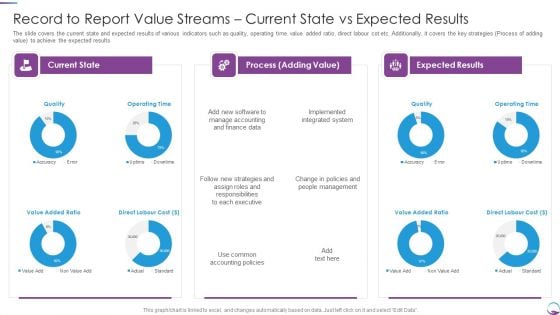
Record To Report Value Streams Current State Vs Expected Results Professional PDF
The slide covers the current state and expected results of various indicators such as quality, operating time, value added ratio, direct labour cot etc. Additionally, it covers the key strategies Process of adding value to achieve the expected results. Deliver and pitch your topic in the best possible manner with this Record To Report Value Streams Current State Vs Expected Results Professional PDF. Use them to share invaluable insights on Management, Strategies, Executive, Finance Data and impress your audience. This template can be altered and modified as per your expectations. So, grab it now.
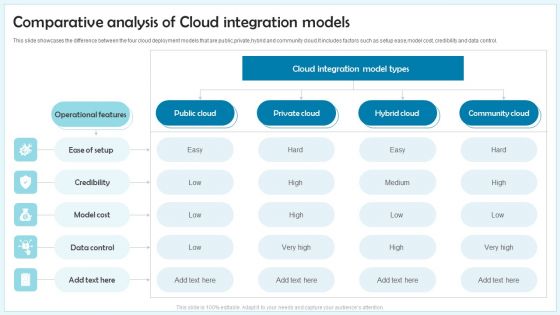
Comparative Analysis Of Cloud Integration Models Ppt Slides Diagrams PDF
This slide showcases the difference between the four cloud deployment models that are public,private,hybrid and community cloud.It includes factors such as setup ease,model cost, credibility and data control. Showcasing this set of slides titled Comparative Analysis Of Cloud Integration Models Ppt Slides Diagrams PDF. The topics addressed in these templates are Cloud Integration, Model Types, Private Cloud, Hybrid Cloud, Community Cloud. All the content presented in this PPT design is completely editable. Download it and make adjustments in color, background, font etc. as per your unique business setting.

Financial Evaluation Report For Construction Project Ppt PowerPoint Presentation Complete Deck With Slides
This Financial Evaluation Report For Construction Project Ppt PowerPoint Presentation Complete Deck With Slides is designed to help you retain your audiences attention. This content-ready PowerPoint Template enables you to take your audience on a journey and share information in a way that is easier to recall. It helps you highlight the crucial parts of your work so that the audience does not get saddled with information download. This fourty three slide PPT Deck comes prepared with the graphs and charts you could need to showcase your information through visuals. You only need to enter your own data in them. Download this editable PowerPoint Theme and walk into that meeting with confidence.

Logistics Transport Company Financial Report Ppt PowerPoint Presentation Complete Deck With Slides
This Logistics Transport Company Financial Report Ppt PowerPoint Presentation Complete Deck With Slides is designed to help you retain your audiences attention. This content-ready PowerPoint Template enables you to take your audience on a journey and share information in a way that is easier to recall. It helps you highlight the crucial parts of your work so that the audience does not get saddled with information download. This eighteen slide PPT Deck comes prepared with the graphs and charts you could need to showcase your information through visuals. You only need to enter your own data in them. Download this editable PowerPoint Theme and walk into that meeting with confidence.

Customer Market Analysis Of Technological Smart Homes Devices Summary PDF
This side showcase the statistical data of stakeholders market of intelligent devices which help analyst to identify user base of smart home in next 5 years. It include matrices of devices such as smart speaker, camera, big appliances, smoke detector and gateways. Showcasing this set of slides titled Customer Market Analysis Of Technological Smart Homes Devices Summary PDF. The topics addressed in these templates are Smart Speaker Customer, Assistant Compatibility Gas, Security System. All the content presented in this PPT design is completely editable. Download it and make adjustments in color, background, font etc. as per your unique business setting.
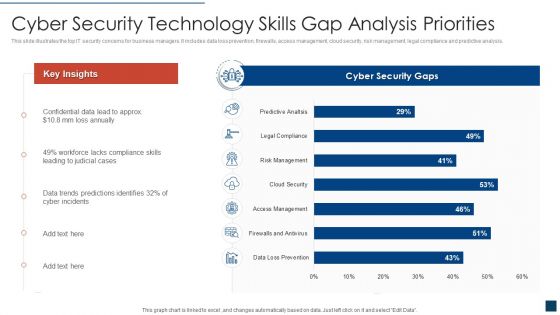
Cyber Security Technology Skills Gap Analysis Priorities Clipart PDF
This slide illustrates the top IT security concerns for business managers. It includes data loss prevention, firewalls, access management, cloud security, risk management, legal compliance and predictive analysis. Showcasing this set of slides titled cyber security technology skills gap analysis priorities clipart pdf. The topics addressed in these templates are cyber security technology skills gap analysis priorities. All the content presented in this PPT design is completely editable. Download it and make adjustments in color, background, font etc. as per your unique business setting.
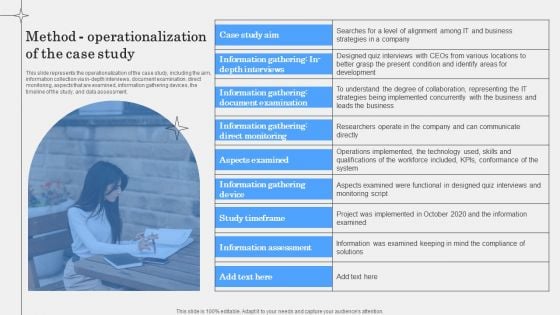
IT Alignment Phases In Business Method Operationalization Of The Case Study Sample PDF
This slide represents the operationalization of the case study, including the aim, information collection via in depth interviews, document examination, direct monitoring, aspects that are examined, information gathering devices, the timeline of the study, and data assessment. From laying roadmaps to briefing everything in detail, our templates are perfect for you. You can set the stage with your presentation slides. All you have to do is download these easy to edit and customizable templates. IT Alignment Phases In Business Method Operationalization Of The Case Study Sample PDF will help you deliver an outstanding performance that everyone would remember and praise you for. Do download this presentation today.
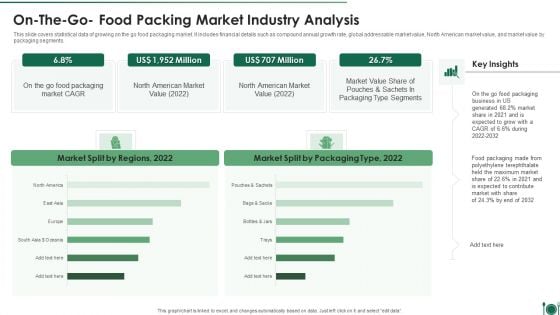
On The Go Food Packing Market Industry Analysis Designs PDF
This slide covers statistical data of growing on the go food packaging market. It includes financial details such as compound annual growth rate, global addressable market value, North American market value, and market value by packaging segments.Showcasing this set of slides titled On The Go Food Packing Market Industry Analysis Designs PDF. The topics addressed in these templates are On The Go Food Packing Market Industry Analysis. All the content presented in this PPT design is completely editable. Download it and make adjustments in color, background, font etc. as per your unique business setting.
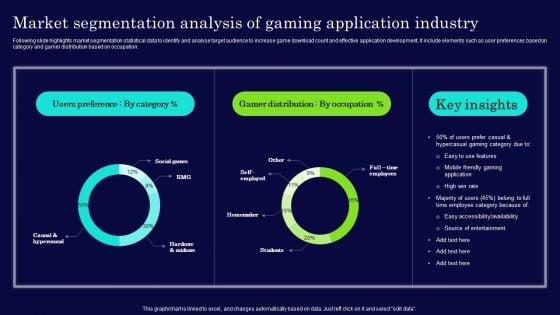
Market Segmentation Analysis Of Gaming Application Industry Download PDF
Following slide highlights market segmentation statistical data to identify and analyse target audience to increase game download count and effective application development. It include elements such as user preferences based on category and gamer distribution based on occupation. Showcasing this set of slides titled Market Segmentation Analysis Of Gaming Application Industry Download PDF. The topics addressed in these templates are Source Of Entertainment, Gaming Application Industry, Market Segmentation Analysis. All the content presented in this PPT design is completely editable. Download it and make adjustments in color, background, font etc. as per your unique business setting.
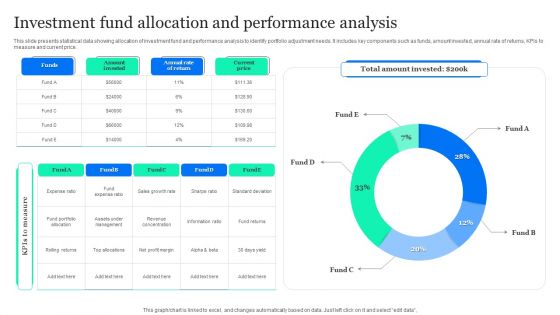
Investment Fund Allocation And Performance Analysis Designs PDF
This slide presents statistical data showing allocation of investment fund and performance analysis to identify portfolio adjustment needs. It includes key components such as funds, amount invested, annual rate of returns, KPIs to measure and current price. Pitch your topic with ease and precision using this Investment Fund Allocation And Performance Analysis Designs PDF. This layout presents information on Amount Invested, Annual Rate Return, Current Price. It is also available for immediate download and adjustment. So, changes can be made in the color, design, graphics or any other component to create a unique layout.
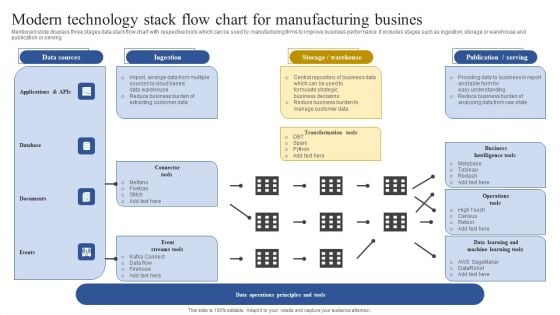
Modern Technology Stack Flow Chart For Manufacturing Busines Topics PDF
Mentioned slide displays three stages data stack flow chart with respective tools which can be sued by manufacturing firms to improve business performance. It includes stages such as ingestion, storage or warehouse and publication or serving. Pitch your topic with ease and precision using this Modern Technology Stack Flow Chart For Manufacturing Busines Topics PDF. This layout presents information on Database, Applications, Documents. It is also available for immediate download and adjustment. So, changes can be made in the color, design, graphics or any other component to create a unique layout.
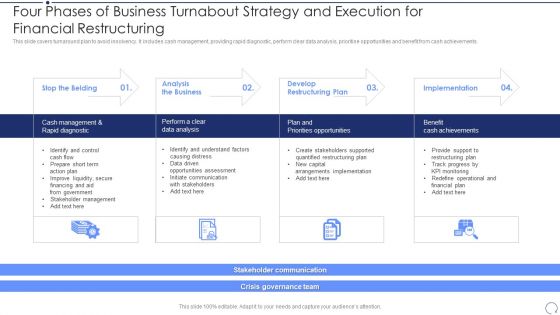
Four Phases Of Business Turnabout Strategy And Execution For Financial Restructuring Clipart PDF
This slide covers turnaround plan to avoid insolvency. It includes cash management, providing rapid diagnostic, perform clear data analysis, prioritise opportunities and benefit from cash achievements.Presenting Four Phases Of Business Turnabout Strategy And Execution For Financial Restructuring Clipart PDF to dispense important information. This template comprises four stages. It also presents valuable insights into the topics including Analysis The Business, Develop Restructuring, Implementation. This is a completely customizable PowerPoint theme that can be put to use immediately. So, download it and address the topic impactfully.
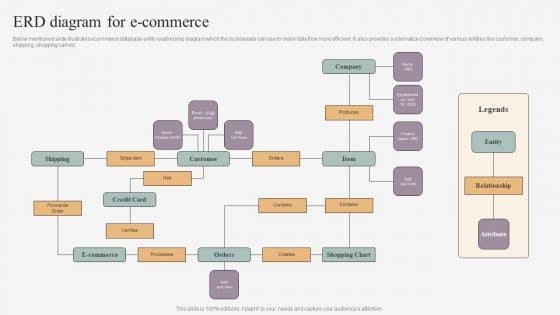
ERD Diagram For E Commerce Infographics PDF
Below mentioned slide illustrates ecommerce database entity relationship diagram which the businesses can use to make data flow more efficient. It also provides systematized overview of various entities like customer, company, shipping, shopping cart etc. Showcasing this set of slides titled ERD Diagram For E Commerce Infographics PDF. The topics addressed in these templates are Shipping, Customer, Company, Entity, Shopping Chart, Credit Card, Relationship. All the content presented in this PPT design is completely editable. Download it and make adjustments in color, background, font etc. as per your unique business setting.

AI Logistics Management Automated Framework Themes PDF
The purpose of this slide is to showcase an automated workflow that compiles logistics data and forecasts operational outcomes by running different scenarios. Key components include plan, serve, source, deliver and make. Pitch your topic with ease and precision using this AI Logistics Management Automated Framework Themes PDF. This layout presents information on Demand Forecasting, Risk Analysis, Budget Analysis. It is also available for immediate download and adjustment. So, changes can be made in the color, design, graphics or any other component to create a unique layout.
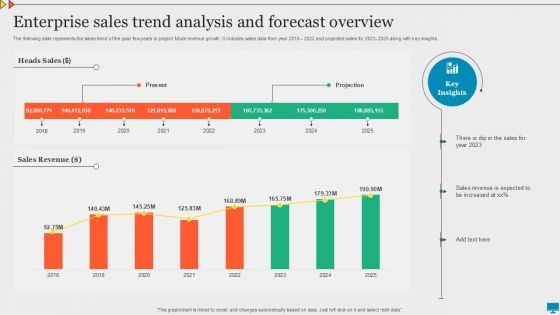
Enterprise Sales Trend Analysis And Forecast Overview Summary PDF

Enhance Profit Client Journey Analysis Customer Shopping Behavior Sample PDF
Track shoppers behavior during different days and weeks. If particular days are most profitable weekends for example marketing campaigns should exploit the data to increase revenue for the company. Deliver and pitch your topic in the best possible manner with this enhance profit client journey analysis customer shopping behavior sample pdf. Use them to share invaluable insights on purchase hour of the day value, purchase day of the week value, purchase day of the month value, purchase month of the year value and impress your audience. This template can be altered and modified as per your expectations. So, grab it now.
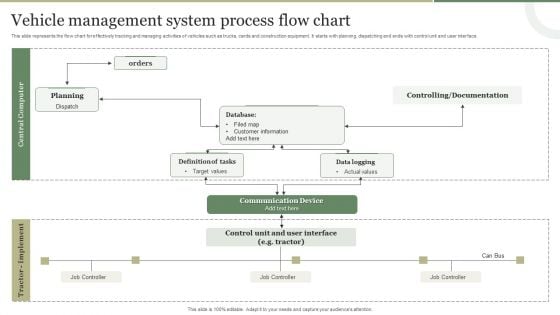
Vehicle Management System Process Flow Chart Introduction PDF
This slide represents the flow chart for effectively tracking and managing activities of vehicles such as trucks, cards and construction equipment. It starts with planning, dispatching end ends with control unit and user interface. Showcasing this set of slides titled Vehicle Management System Process Flow Chart Introduction PDF. The topics addressed in these templates are Central Computer, Communication Device, Data Logging. All the content presented in this PPT design is completely editable. Download it and make adjustments in color, background, font etc. as per your unique business setting.
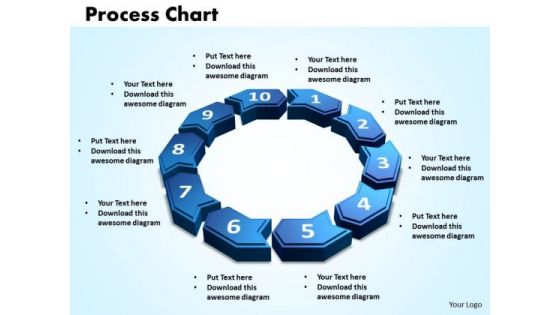
PowerPoint Slides Process Charts Success Ppt Presentation
PowerPoint Slides process charts Success PPT Presentation-More than one sector can be presented with this power point slides. This PPT presentation can be used to present the data of a complete year to the audience-Chart, circle, circular, circulation, concept, connection, continuity, correlate, course, cycle, cyclic, diagram, direction, duplicate, flow, four, iterate, manage, method, presentation, procedure, process, recycle, refresh, relate, repeat, repetition, report, review, ring, rotation, round, sequence, simple, stage, step, strategy, success, system, work flow-PowerPoint Slides process charts Success PPT Presentation Get a close look at our excellent PowerPoint Slides Process Charts Success Ppt Presentation. Just ask your mouse to 'go fetch 'em'.
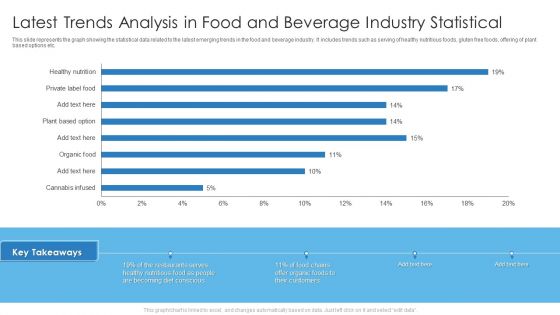
Latest Trends Analysis In Food And Beverage Industry Statistical Graphics PDF
This slide represents the graph showing the statistical data related to the latest emerging trends in the food and beverage industry. It includes trends such as serving of healthy nutritious foods, gluten free foods, offering of plant based options etc. Deliver and pitch your topic in the best possible manner with this Latest Trends Analysis In Food And Beverage Industry Statistical Graphics PDF. Use them to share invaluable insights on Latest Trends Analysis, Food And Beverage, Industry Statistical and impress your audience. This template can be altered and modified as per your expectations. So, grab it now.
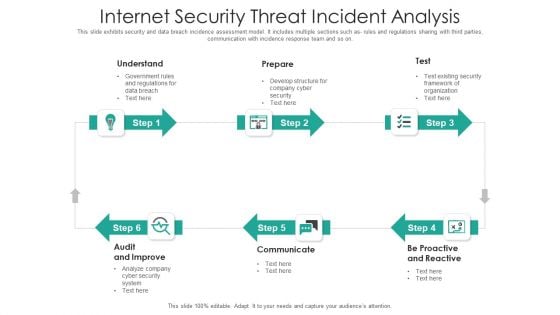
Internet Security Threat Incident Analysis Mockup PDF
This slide exhibits security and data breach incidence assessment model. It includes multiple sections such as- rules and regulations sharing with third parties, communication with incidence response team and so on. Presenting internet security threat incident analysis mockup pdf to dispense important information. This template comprises six stages. It also presents valuable insights into the topics including proactive and reactive, communicate, audit and improve. This is a completely customizable PowerPoint theme that can be put to use immediately. So, download it and address the topic impactfully.
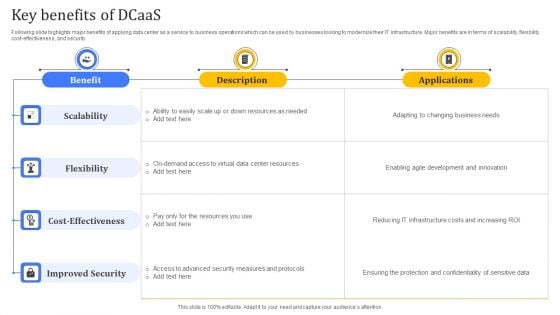
Key Benefits Of Dcaas Diagrams PDF
This slide depicts a dashboard which can be used to monitor the key performing indicators related to data center as a service model. The key performing indicators are items by status, counts by model attributes, item count by customer type, physical vs virtual system Showcasing this set of slides titled Key Benefits Of Dcaas Diagrams PDF. The topics addressed in these templates are Scalability, Flexibility, Cost Effectiveness, Improved Security. All the content presented in this PPT design is completely editable. Download it and make adjustments in color, background, font etc. as per your unique business setting.
Robotic Process Automation Metrics Tracker With Work Item Statistics Information PDF
This slide covers the RPA dashboard for analysing process data status. It also includes process details such as run success rate, inputs, processing, fail, output, robotic run minutes, total value generated, work items processed. Pitch your topic with ease and precision using this Robotic Process Automation Metrics Tracker With Work Item Statistics Information PDF. This layout presents information on Robotic Process Automation, Metrics Tracker, Work Item Statistics. It is also available for immediate download and adjustment. So, changes can be made in the color, design, graphics or any other component to create a unique layout.
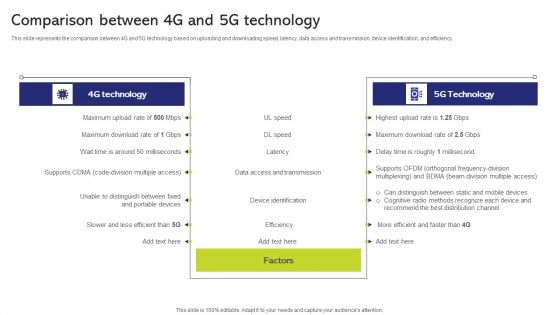
5G And 4G Networks Comparative Analysis Comparison Between 4G And 5G Technology Diagrams PDF
This slide represents the comparison between 4G and 5G technology based on uploading and downloading speed, latency, data access and transmission, device identification, and efficiency. This is a 5G And 4G Networks Comparative Analysis Comparison Between 4G And 5G Technology Diagrams PDF template with various stages. Focus and dispense information on two stages using this creative set, that comes with editable features. It contains large content boxes to add your information on topics like 4G Technology, 5G Technology. You can also showcase facts, figures, and other relevant content using this PPT layout. Grab it now.
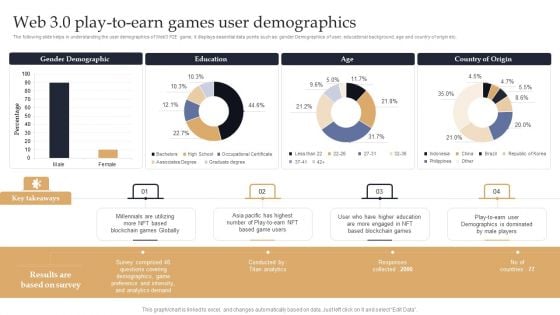
Web 3 0 Blockchain Based P2E Mobile Game Sector Report Promotional Plan Web 3 0 Play To Earn Games Introduction PDF
The following slide helps in understanding the user demographics of Web3 P2E game, it displays essential data points such as gender Demographics of user, educational background, age and country of origin etc. The best PPT templates are a great way to save time, energy, and resources. Slidegeeks have 100 percent editable powerpoint slides making them incredibly versatile. With these quality presentation templates, you can create a captivating and memorable presentation by combining visually appealing slides and effectively communicating your message. Download Web 3 0 Blockchain Based P2E Mobile Game Sector Report Promotional Plan Web 3 0 Play To Earn Games Introduction PDF from Slidegeeks and deliver a wonderful presentation.
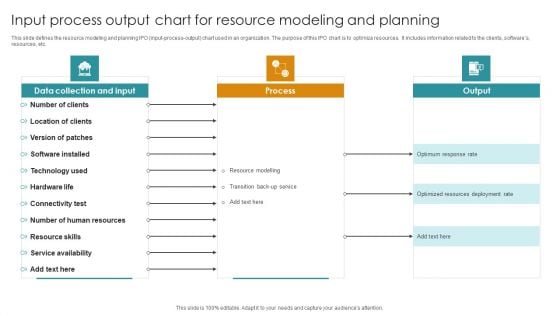
Input Process Output Chart For Resource Modeling And Planning Background PDF
This slide defines the resource modeling and planning IPO input-process-output chart used in an organization. The purpose of this IPO chart is to optimize resources. It includes information related to the clients, softwares, resources, etc. Showcasing this set of slides titled Input Process Output Chart For Resource Modeling And Planning Background PDF. The topics addressed in these templates are Data Collection And Input, Process, Output. All the content presented in this PPT design is completely editable. Download it and make adjustments in color, background, font etc. as per your unique business setting.
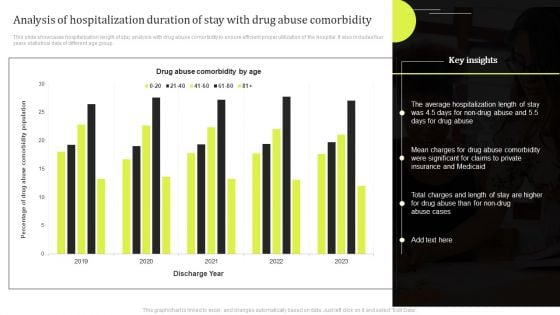
Analysis Of Hospitalization Duration Of Stay With Drug Abuse Comorbidity Demonstration PDF
This slide showcases hospitalization length of stay analysis with drug abuse comorbidity to ensure efficient proper utilization of the hospital. It also includes four years statistical data of different age group . Showcasing this set of slides titled Analysis Of Hospitalization Duration Of Stay With Drug Abuse Comorbidity Demonstration PDF. The topics addressed in these templates are Analysis Of Hospitalization Duration, Drug Abuse Comorbidity. All the content presented in this PPT design is completely editable. Download it and make adjustments in color, background, font etc. as per your unique business setting.
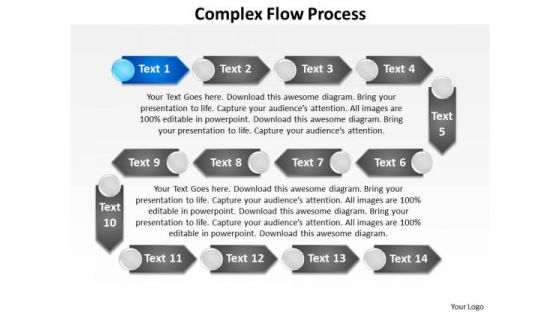
Ppt Complex Flow Business Process PowerPoint Presentation Chart Templates
PPT complex flow business process powerpoint presentation chart Templates-This data flow diagram represents processing requirements of a program and the information flows .This diagram can be used during the analysis of requirements for complex systems. This diagram is designed to attract the attention of your audience-PPT complex flow business process powerpoint presentation chart Templates-Advice, Analyze, Arrow, Background, Business, Chart, Concept, Creativity, Decision, Design, Determination, Diagram, Draw, Education, Flowchart, Graphic, Idea, Means, Method, Office, Plan, Pointing, Presentation, Process, Sign, Strategy, Technology Our Ppt Complex Flow Business Process PowerPoint Presentation Chart Templates are quite alluring. They embody the X-factor.
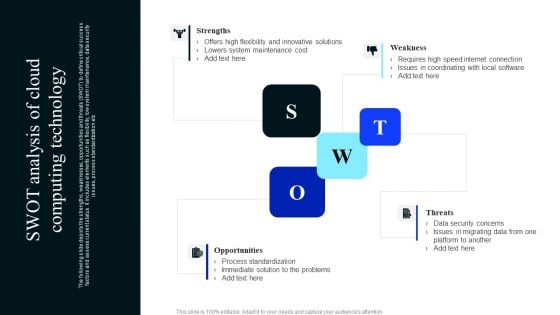
SWOT Analysis Of Cloud Computing Technology Download PDF
The following slide depicts the strengths, weaknesses, opportunities and threats SWOT to define critical success factors and assess current status. It includes elements such as flexibility, low system maintenance, data security issues, process standardization etc. Presenting SWOT Analysis Of Cloud Computing Technology Download PDF to dispense important information. This template comprises four stages. It also presents valuable insights into the topics including Strengths, Weakness, Threats, Opportunities. This is a completely customizable PowerPoint theme that can be put to use immediately. So, download it and address the topic impactfully.
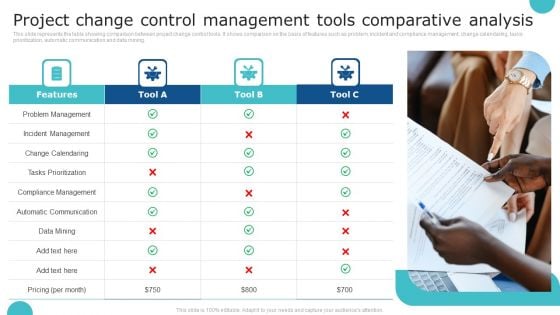
Project Change Control Management Tools Comparative Analysis Information PDF
This slide represents the table showing comparison between project change control tools. It shows comparison on the basis of features such as problem, incident and compliance management, change calendaring, tasks prioritization, automatic communication and data mining. Presenting Project Change Control Management Tools Comparative Analysis Information PDF to dispense important information. This template comprises four stages. It also presents valuable insights into the topics including Compliance Management, Automatic Communication, Incident Management. This is a completely customizable PowerPoint theme that can be put to use immediately. So, download it and address the topic impactfully.
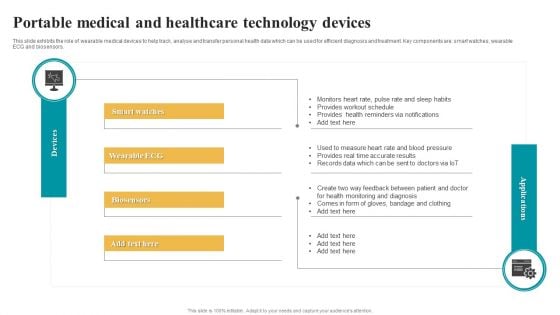
Portable Medical And Healthcare Technology Devices Diagrams PDF
This slide exhibits the role of wearable medical devices to help track, analyse and transfer personal health data which can be used for efficient diagnosis and treatment. Key components are smart watches, wearable ECG and biosensors.Pitch your topic with ease and precision using this Portable Medical And Healthcare Technology Devices Diagrams PDF. This layout presents information on Health Reminders, Accurate Results, Monitoring Diagnosis. It is also available for immediate download and adjustment. So, changes can be made in the color, design, graphics or any other component to create a unique layout.
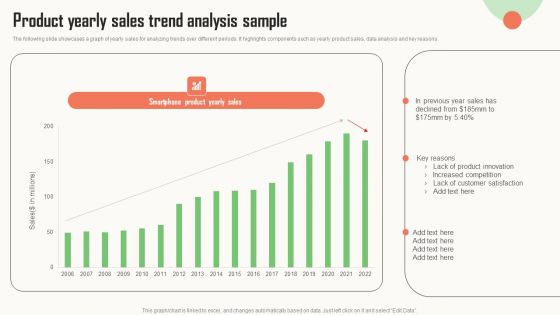
Strategic Market Insight Implementation Guide Product Yearly Sales Trend Analysis Sample Clipart PDF
The following slide showcases a graph of yearly sales for analyzing trends over different periods. It highlights components such as yearly product sales, data analysis and key reasons. Slidegeeks is one of the best resources for PowerPoint templates. You can download easily and regulate Strategic Market Insight Implementation Guide Product Yearly Sales Trend Analysis Sample Clipart PDF for your personal presentations from our wonderful collection. A few clicks is all it takes to discover and get the most relevant and appropriate templates. Use our Templates to add a unique zing and appeal to your presentation and meetings. All the slides are easy to edit and you can use them even for advertisement purposes.
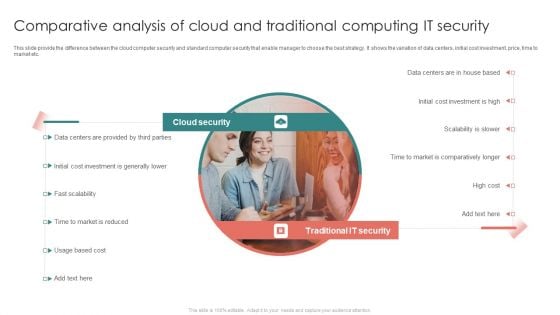
Comparative Analysis Of Cloud And Traditional Computing It Security Diagrams PDF
This slide provide the difference between the cloud computer security and standard computer security that enable manager to choose the best strategy. It shows the variation of data centers, initial cost investment, price, time to market etc.Persuade your audience using this Comparative Analysis Of Cloud And Traditional Computing It Security Diagrams PDF. This PPT design covers one stage, thus making it a great tool to use. It also caters to a variety of topics including Provided Parties, Initial Cost Investment, Comparatively Longer. Download this PPT design now to present a convincing pitch that not only emphasizes the topic but also showcases your presentation skills.
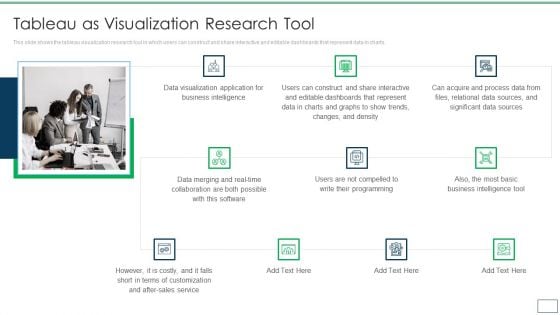
Departments Of Visualization Research Tableau As Visualization Research Tool Demonstration PDF
This slide shows the tableau visualization research tool in which users can construct and share interactive and editable dashboards that represent data in charts.Presenting Departments Of Visualization Research Tableau As Visualization Research Tool Demonstration PDF to provide visual cues and insights. Share and navigate important information on ten stages that need your due attention. This template can be used to pitch topics like Business Intelligence, Dashboards That Represent, Business Intelligence In addtion, this PPT design contains high resolution images, graphics, etc, that are easily editable and available for immediate download.
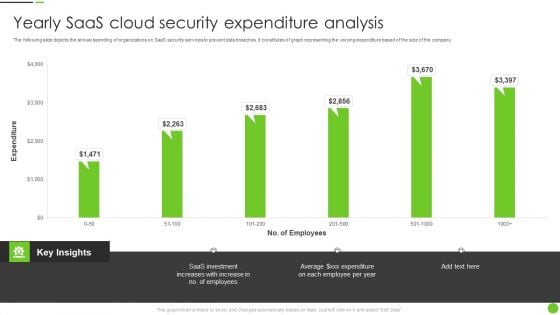
Yearly Saas Cloud Security Expenditure Analysis Ppt PowerPoint Presentation File Deck PDF
The following slide depicts the annual spending of organizations on SaaS security services to prevent data breaches. It constitutes of graph representing the varying expenditure based of the size of the company. Pitch your topic with ease and precision using this Yearly Saas Cloud Security Expenditure Analysis Ppt PowerPoint Presentation File Deck PDF. This layout presents information on Saas Investment, Employees. It is also available for immediate download and adjustment. So, changes can be made in the color, design, graphics or any other component to create a unique layout.

Cost Breakdown For Conducting Marketing Research Formats PDF
This slide covers cost breakdown for conducting market research more efficiently. It involves key elements such as reporting, project initiation, research design, field work and data analysis. If your project calls for a presentation, then Slidegeeks is your go-to partner because we have professionally designed, easy-to-edit templates that are perfect for any presentation. After downloading, you can easily edit Cost Breakdown For Conducting Marketing Research Formats PDF and make the changes accordingly. You can rearrange slides or fill them with different images. Check out all the handy templates
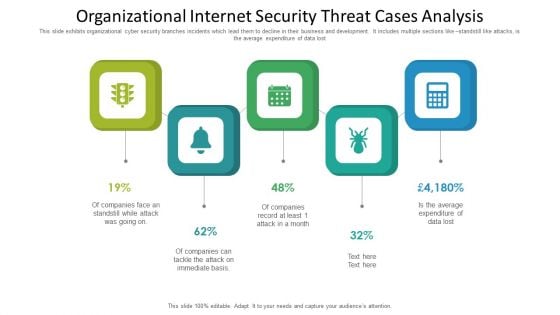
Organizational Internet Security Threat Cases Analysis Information PDF
This slide exhibits organizational cyber security branches incidents which lead them to decline in their business and development. It includes multiple sections like standstill like attacks, is the average expenditure of data lost. Presenting organizational internet security threat cases analysis information pdf to dispense important information. This template comprises five stages. It also presents valuable insights into the topics including organizational internet security threat cases analysis. This is a completely customizable PowerPoint theme that can be put to use immediately. So, download it and address the topic impactfully.

Employee Training And Development Program Schedule With Status Diagrams PDF
The purpose of this slide is to showcase the training calendar that outlines important details in order to conduct training sessions efficiently. The various key attributes include training topic, mode of training, training time, completion date and status. Showcasing this set of slides titled Employee Training And Development Program Schedule With Status Diagrams PDF. The topics addressed in these templates are Portfolio Management Tool, Project Management Fundamental, Data Science. All the content presented in this PPT design is completely editable. Download it and make adjustments in color, background, font etc. as per your unique business setting.
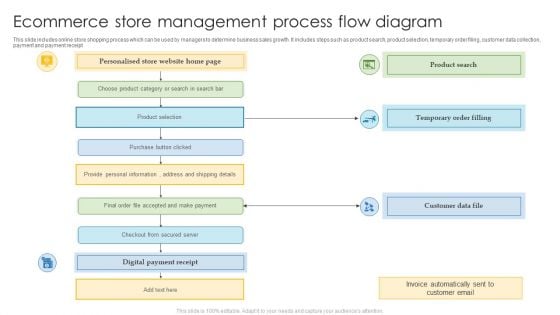
Ecommerce Store Management Process Flow Diagram Structure PDF
This slide includes online store shopping process which can be used by managers to determine business sales growth. It includes steps such as product search, product selection, temporary order filing, customer data collection, payment and payment receipt. Showcasing this set of slides titled Ecommerce Store Management Process Flow Diagram Structure PDF. The topics addressed in these templates are Invoice Automatically, Digital Payment, Personal Information. All the content presented in this PPT design is completely editable. Download it and make adjustments in color, background, font etc. as per your unique business setting.
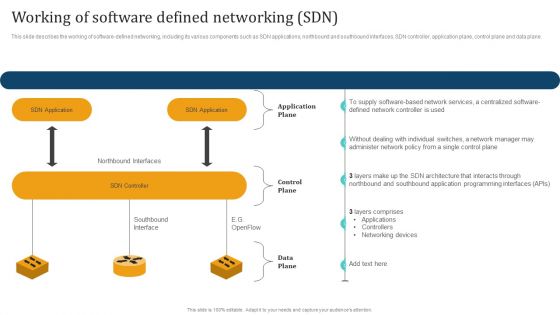
Empowering Network Agility Through SDN Working Of Software Defined Networking SDN Diagrams PDF
This slide describes the working of software defined networking, including its various components such as SDN applications, northbound and southbound interfaces, SDN controller, application plane, control plane and data plane. that communicate your ideas and engage audiences. Save time and effort by using our pre designed presentation templates that are perfect for a wide range of topic. Our vast selection of designs covers a range of styles, from creative to business, and are all highly customizable and easy to edit. Download as a PowerPoint template or use them as Google Slides themes.
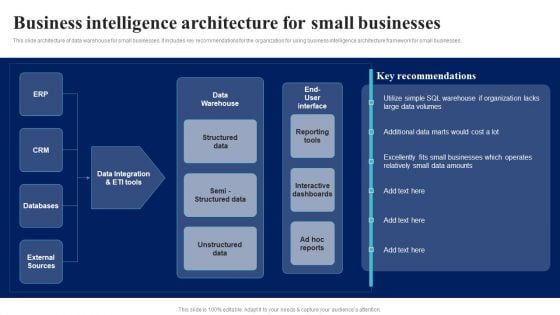
BI Implementation To Enhance Hiring Process Business Intelligence Architecture For Small Businesses Themes PDF
This slide architecture of data warehouse for small businesses. It includes key recommendations for the organization for using business intelligence architecture framework for small businesses.Present like a pro with BI Implementation To Enhance Hiring Process Business Intelligence Architecture For Small Businesses Themes PDF Create beautiful presentations together with your team, using our easy-to-use presentation slides. Share your ideas in real-time and make changes on the fly by downloading our templates. So whether you are in the office, on the go, or in a remote location, you can stay in sync with your team and present your ideas with confidence. With Slidegeeks presentation got a whole lot easier. Grab these presentations today.

Steps Of Sales Analysis To Improve Product Performance Rules PDF
This slide showcase sale analysis steps enhance product performance which help in finding vital trends, overview of data and increase accuracy for future decision making process. It include steps such as number, business, process, pricing, metrices and services.Presenting Steps Of Sales Analysis To Improve Product Performance Rules PDF to dispense important information. This template comprises six stages. It also presents valuable insights into the topics including Number, Pricing Of Product. This is a completely customizable PowerPoint theme that can be put to use immediately. So, download it and address the topic impactfully.
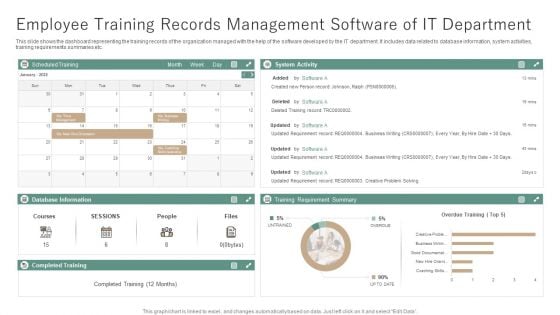
Employee Training Records Management Software Of IT Department Ppt File Layout PDF
This slide shows the dashboard representing the training records of the organization managed with the help of the software developed by the IT department. It includes data related to database information, system activities, training requirements summaries etc. Showcasing this set of slides titled Employee Training Records Management Software Of IT Department Ppt File Layout PDF. The topics addressed in these templates are Scheduled Training, Database Information, Completed Training. All the content presented in this PPT design is completely editable. Download it and make adjustments in color, background, font etc. as per your unique business setting.
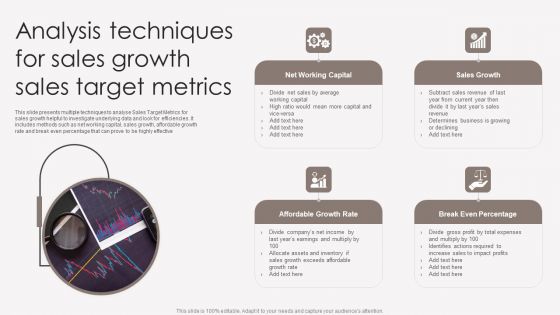
Analysis Techniques For Sales Growth Sales Target Metrics Pictures PDF
This slide presents multiple techniques to analyse Sales Target Metrics for sales growth helpful to investigate underlying data and look for efficiencies. It includes methods such as net working capital, sales growth, affordable growth rate and break even percentage that can prove to be highly effective. Presenting Analysis Techniques For Sales Growth Sales Target Metrics Pictures PDF to dispense important information. This template comprises four stages. It also presents valuable insights into the topics including Net Working Capital, Affordable Growth Rate, Break Even Percentage. This is a completely customizable PowerPoint theme that can be put to use immediately. So, download it and address the topic impactfully.
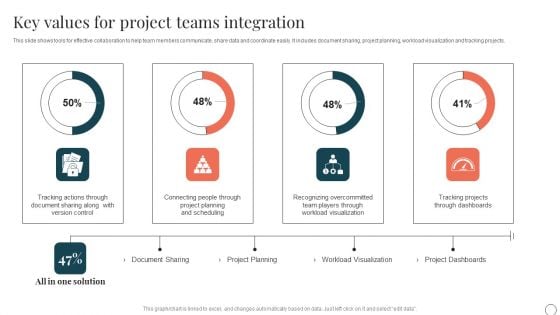
Key Values For Project Teams Integration Ppt PowerPoint Presentation File Files PDF
This slide shows tools for effective collaboration to help team members communicate, share data and coordinate easily. It includes document sharing, project planning, workload visualization and tracking projects. Showcasing this set of slides titled Key Values For Project Teams Integration Ppt PowerPoint Presentation File Files PDF. The topics addressed in these templates are Project Planning, Workload Visualization, Project Dashboards. All the content presented in this PPT design is completely editable. Download it and make adjustments in color, background, font etc. as per your unique business setting.
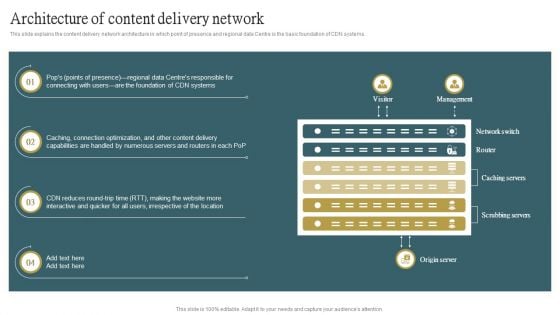
Architecture Of Content Delivery Network Ppt PowerPoint Presentation Diagram Templates PDF
This slide explains the content delivery network architecture in which point of presence and regional data Centre is the basic foundation of CDN systems. Create an editable Architecture Of Content Delivery Network Ppt PowerPoint Presentation Diagram Templates PDF that communicates your idea and engages your audience. Whether you are presenting a business or an educational presentation, pre designed presentation templates help save time. Architecture Of Content Delivery Network Ppt PowerPoint Presentation Diagram Templates PDF is highly customizable and very easy to edit, covering many different styles from creative to business presentations. Slidegeeks has creative team members who have crafted amazing templates. So, go and get them without any delay.
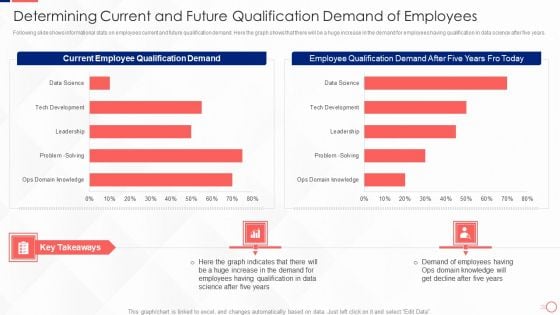
Investing In Tech Innovation Determining Current And Future Qualification Demand Graphics PDF
Following slide shows informational stats on employees current and future qualification demand. Here the graph shows that there will be a huge increase in the demand for employees having qualification in data science after five years. Deliver an awe inspiring pitch with this creative Investing In Tech Innovation Determining Current And Future Qualification Demand Graphics PDF bundle. Topics like Current Employee Qualification Demand, Employee Qualification, Demand After Five Years can be discussed with this completely editable template. It is available for immediate download depending on the needs and requirements of the user.
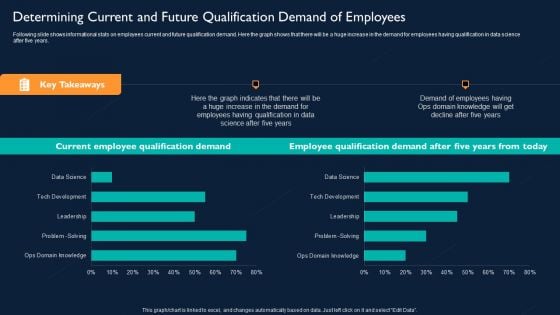
Determining Current And Future Qualification Demand Of Employees Graphics PDF
Following slide shows informational stats on employees current and future qualification demand. Here the graph shows that there will be a huge increase in the demand for employees having qualification in data science after five years. Deliver an awe inspiring pitch with this creative Determining Current And Future Qualification Demand Employees Graphics PDF bundle. Topics like Determining Current, Future Qualification Demand Of Employees can be discussed with this completely editable template. It is available for immediate download depending on the needs and requirements of the user.

 Home
Home