Data Analytics Icons
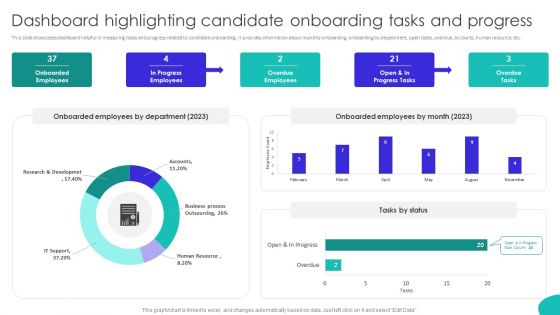
Improving Technology Based Dashboard Highlighting Candidate Onboarding Tasks Information PDF
This slide showcases dashboard helpful in measuring tasks and progress related to candidate onboarding. It provides information about monthly onboarding, onboarding by department, open tasks, overdue, accounts, human resource, etc. Slidegeeks is here to make your presentations a breeze with Improving Technology Based Dashboard Highlighting Candidate Onboarding Tasks Information PDF With our easy-to-use and customizable templates, you can focus on delivering your ideas rather than worrying about formatting. With a variety of designs to choose from, youre sure to find one that suits your needs. And with animations and unique photos, illustrations, and fonts, you can make your presentation pop. So whether youre giving a sales pitch or presenting to the board, make sure to check out Slidegeeks first.
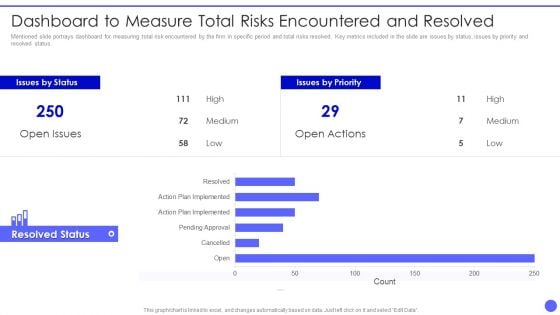
Info Safety And ISO 27001 Dashboard To Measure Total Risks Encountered Slides PDF
Mentioned slide portrays dashboard for measuring total risk encountered by the firm in specific period and total risks resolved. Key metrics included in the slide are issues by status, issues by priority and resolved status. Deliver an awe inspiring pitch with this creative Info Safety And ISO 27001 Dashboard To Measure Total Risks Encountered Slides PDF bundle. Topics like Issues by Status, Resolved Status, High, Medium, Low can be discussed with this completely editable template. It is available for immediate download depending on the needs and requirements of the user.
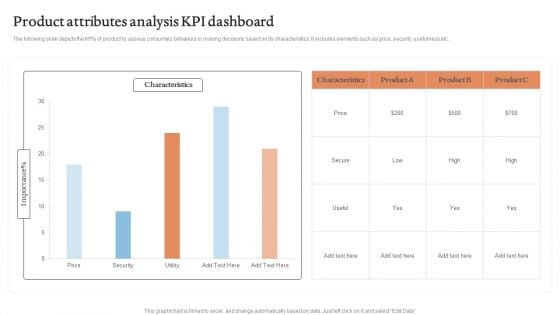
Product Attributes Analysis KPI Dashboard Graphics PDF
The following slide depicts the KPIs of product to assess consumers behaviour in making decisions based on its characteristics. It includes elements such as price, security, usefulness etc.Showcasing this set of slides titled Product Attributes Analysis KPI Dashboard Graphics PDF. The topics addressed in these templates are Characteristics, Product Attributes, Analysis KPI Dashboard. All the content presented in this PPT design is completely editable. Download it and make adjustments in color, background, font etc. as per your unique business setting.
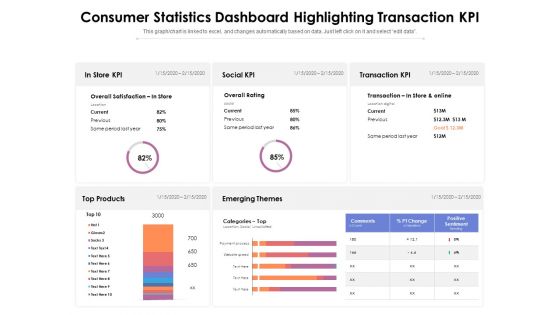
Consumer Statistics Dashboard Highlighting Transaction KPI Ppt PowerPoint Presentation Gallery Graphics Design PDF
Presenting this set of slides with name consumer statistics dashboard highlighting transaction kpi ppt powerpoint presentation gallery graphics design pdf. The topics discussed in these slides are transaction, social, process. This is a completely editable PowerPoint presentation and is available for immediate download. Download now and impress your audience.
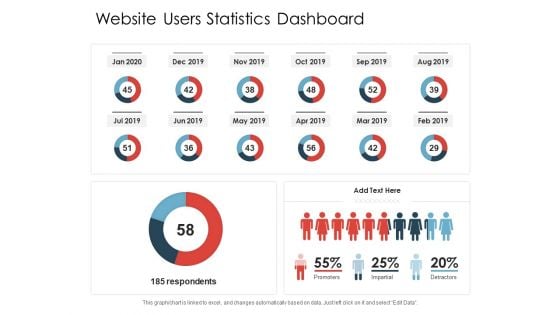
Website Users Statistics Dashboard Ppt PowerPoint Presentation Gallery Design Inspiration PDF
Presenting this set of slides with name website users statistics dashboard ppt powerpoint presentation gallery design inspiration pdf. The topics discussed in these slides are promoters, impartial, detractors. This is a completely editable PowerPoint presentation and is available for immediate download. Download now and impress your audience.

Employee Statistics Dashboard With Satisfaction Survey Result Ppt PowerPoint Presentation Portfolio Slide Download PDF
Presenting this set of slides with name employee statistics dashboard with satisfaction survey result ppt powerpoint presentation portfolio slide download pdf. The topics discussed in these slides are satisfaction survey result, employee age breakdown, employee turnover rate, employee absenteeism, employee status, employee gender split. This is a completely editable PowerPoint presentation and is available for immediate download. Download now and impress your audience.
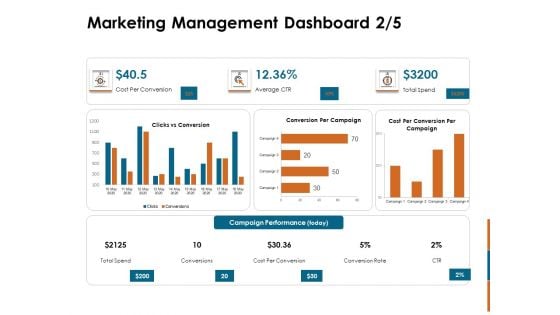
Key Statistics Of Marketing Marketing Management Dashboard Cost Ppt PowerPoint Presentation Infographics Slideshow PDF
Deliver an awe-inspiring pitch with this creative key statistics of marketing marketing management dashboard cost ppt powerpoint presentation infographics slideshow pdf bundle. Topics like cost per conversion, campaign performance, conversion rate, conversions, total speed, average ctr can be discussed with this completely editable template. It is available for immediate download depending on the needs and requirements of the user.
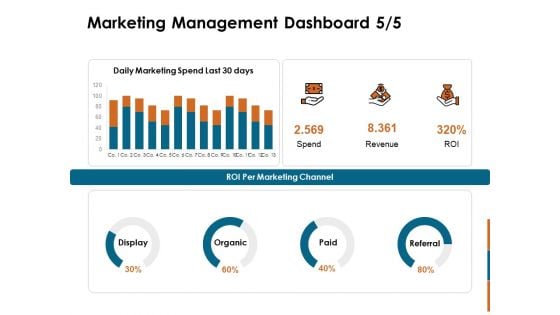
Key Statistics Of Marketing Marketing Management Dashboard Spend Ppt PowerPoint Presentation Portfolio Slide Portrait PDF
Deliver an awe-inspiring pitch with this creative key statistics of marketing marketing management dashboard spend ppt powerpoint presentation portfolio slide portrait pdf bundle. Topics like display, organic, paid, referral, roi per marketing channel, spend, revenue, roi can be discussed with this completely editable template. It is available for immediate download depending on the needs and requirements of the user.
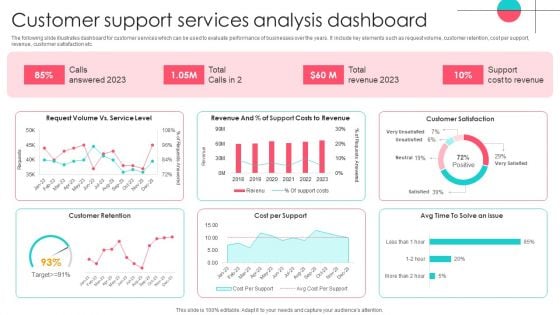
Customer Support Services Analysis Dashboard Template PDF
The following slide illustrates dashboard for customer services which can be used to evaluate performance of businesses over the years. It include key elements such as request volume, customer retention, cost per support, revenue, customer satisfaction etc. Showcasing this set of slides titled Customer Support Services Analysis Dashboard Template PDF. The topics addressed in these templates are Customer Support Services, Analysis Dashboard. All the content presented in this PPT design is completely editable. Download it and make adjustments in color, background, font etc. as per your unique business setting.

Monthly Product Sales Analysis Dashboard Infographics PDF
This slide illustrates a dashboard for product sales review to measure to help business monitor and improve productivity, employee engagement and meet revenue targets. It covers product names with sales reps, lead conversion, response time and outbound calls. Showcasing this set of slides titled Monthly Product Sales Analysis Dashboard Infographics PDF. The topics addressed in these templates are Lead Conversion Rate, Outbound Calls, Sales Analysis Dashboard. All the content presented in this PPT design is completely editable. Download it and make adjustments in color, background, font etc. as per your unique business setting.
Various Campaigns Performance Analysis Dashboard Template PDF
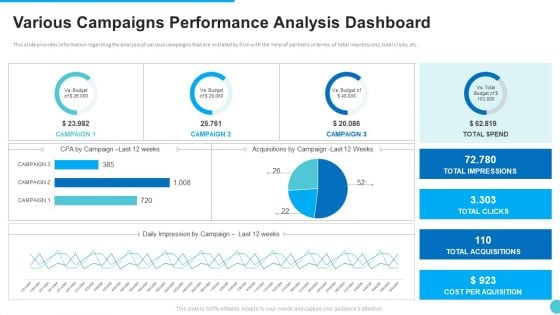
This slide provides information regarding the analysis of various campaigns that are initiated by firm with the help of partners in terms of total impressions, total clicks, etc. Deliver an awe-inspiring pitch with this creative various campaigns performance analysis dashboard template pdf. bundle. Topics like various campaigns performance analysis dashboard can be discussed with this completely editable template. It is available for immediate download depending on the needs and requirements of the user.
Information Technology Expenditure Summary Dashboard Ppt PowerPoint Presentation Diagram Graph Charts PDF
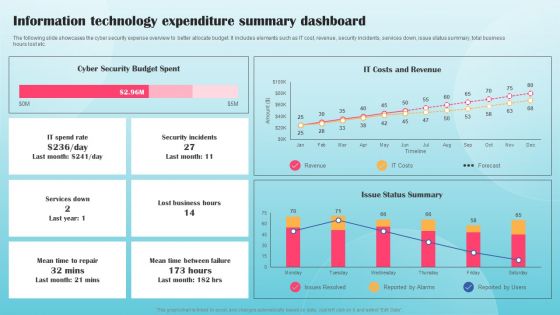
The following slide showcases the cyber security expense overview to better allocate budget. It includes elements such as IT cost, revenue, security incidents, services down, issue status summary, total business hours lost etc. This Information Technology Expenditure Summary Dashboard Ppt PowerPoint Presentation Diagram Graph Charts PDF from Slidegeeks makes it easy to present information on your topic with precision. It provides customization options, so you can make changes to the colors, design, graphics, or any other component to create a unique layout. It is also available for immediate download, so you can begin using it right away. Slidegeeks has done good research to ensure that you have everything you need to make your presentation stand out. Make a name out there for a brilliant performance.
Business Charts Marketing Sales PowerPoint Templates Ppt Backgrounds For Slides
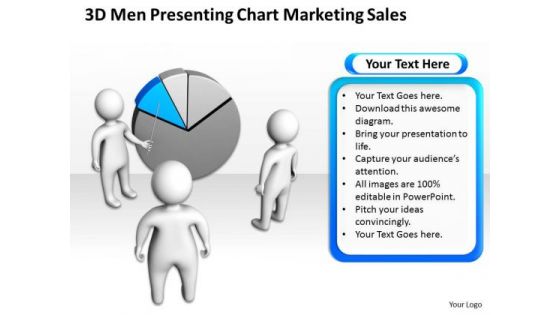
We present our business charts marketing sales PowerPoint templates PPT backgrounds for slides.Download our Communication PowerPoint Templates because Our PowerPoint Templates and Slides will weave a web of your great ideas. They are gauranteed to attract even the most critical of your colleagues. Download our Business PowerPoint Templates because Our PowerPoint Templates and Slides will effectively help you save your valuable time. They are readymade to fit into any presentation structure. Download our Success PowerPoint Templates because You are an avid believer in ethical practices. Highlight the benefits that accrue with our PowerPoint Templates and Slides. Download and present our People PowerPoint Templates because Our PowerPoint Templates and Slides are aesthetically designed to attract attention. We gaurantee that they will grab all the eyeballs you need. Present our Shapes PowerPoint Templates because It will Raise the bar of your Thoughts. They are programmed to take you to the next level.Use these PowerPoint slides for presentations relating to 3d, Arrow, Business, Businessman, Cartoon, Character, Chart, Concept, Corporate, Data, Development, Diagram, Display, Figure, Finance, Financial, Graph, Graphic, Green, Growth, Guy, Human, Icon, Idea, Illustration, Information, Investment, Isolated, Market, Marketing, Men, Office, Part, People, Person, Pie, Presentation, Professional, Progress, Red, Reflection, Report, Shape, Shiny, Sign, Success. The prominent colors used in the PowerPoint template are Blue, Gray, White. Presenters tell us our business charts marketing sales PowerPoint templates PPT backgrounds for slides are aesthetically designed to attract attention. We guarantee that they will grab all the eyeballs you need. PowerPoint presentation experts tell us our Concept PowerPoint templates and PPT Slides will help them to explain complicated concepts. Professionals tell us our business charts marketing sales PowerPoint templates PPT backgrounds for slides are specially created by a professional team with vast experience. They diligently strive to come up with the right vehicle for your brilliant Ideas. People tell us our Cartoon PowerPoint templates and PPT Slides will make the presenter successul in his career/life. The feedback we get is that our business charts marketing sales PowerPoint templates PPT backgrounds for slides provide great value for your money. Be assured of finding the best projection to highlight your words. Customers tell us our Business PowerPoint templates and PPT Slides provide great value for your money. Be assured of finding the best projection to highlight your words. Attain promotions with our Business Charts Marketing Sales PowerPoint Templates Ppt Backgrounds For Slides. You will come out on top.
Key Statistics Of Marketing Marketing Management Dashboard Rate Ppt PowerPoint Presentation Show Graphics Template PDF
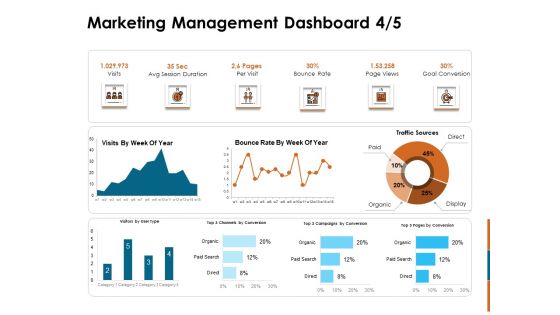
Deliver and pitch your topic in the best possible manner with this key statistics of marketing marketing management dashboard rate ppt powerpoint presentation show graphics template pdf. Use them to share invaluable insights on visits, avg session duration, per visit, bounce rate, page views, goal conversion and impress your audience. This template can be altered and modified as per your expectations. So, grab it now.
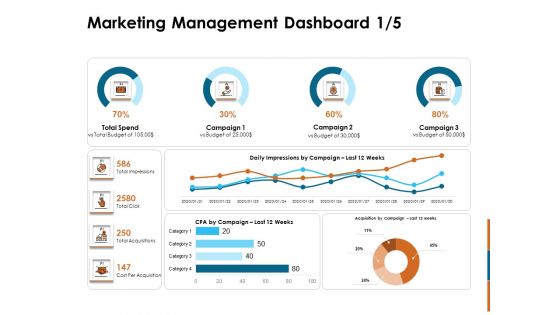
Key Statistics Of Marketing Marketing Management Dashboard Ppt PowerPoint Presentation Slides Templates PDF
Deliver and pitch your topic in the best possible manner with this key statistics of marketing marketing management dashboard ppt powerpoint presentation slides templates pdf. Use them to share invaluable insights on total impressions, total click, total acquisitions, cost per acquisition, total spend, acquisition campaign last 12 weeks and impress your audience. This template can be altered and modified as per your expectations. So, grab it now.
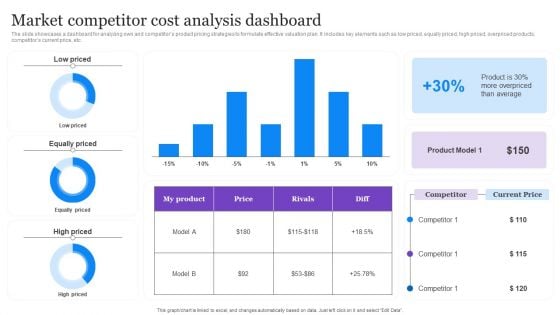
Market Competitor Cost Analysis Dashboard Graphics PDF
The slide showcases a dashboard for analyzing own and competitors product pricing strategies to formulate effective valuation plan. It includes key elements such as low priced, equally priced, high priced, overpriced products, competitors current price, etc. Pitch your topic with ease and precision using this Market Competitor Cost Analysis Dashboard Graphics PDF. This layout presents information on Average, Product Model, Cost Analysis Dashboard. It is also available for immediate download and adjustment. So, changes can be made in the color, design, graphics or any other component to create a unique layout.
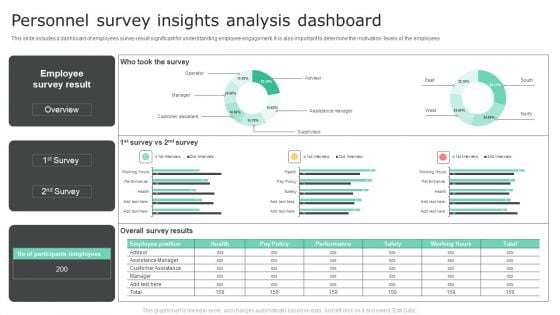
Personnel Survey Insights Analysis Dashboard Inspiration PDF
This slide includes a dashboard of employees survey result significant for understanding employee engagement. It is also important to determine the motivation levels of the employees. Pitch your topic with ease and precision using this Personnel Survey Insights Analysis Dashboard Inspiration PDF. This layout presents information on Employee Survey Result, Overall Survey Results. It is also available for immediate download and adjustment. So, changes can be made in the color, design, graphics or any other component to create a unique layout.

Continuous Improvement And Innovation Strategies For SMEs DT SS V
This slide presents a strategy for continuous improvement and innovation of digital transformation in SMEs. It includes agile mindset, investment in digital skills, lean and six sigma methodologies, cloud and SaaS adoption, rapid prototyping and MVPs, and data-driven decision making.If you are looking for a format to display your unique thoughts, then the professionally designed Continuous Improvement And Innovation Strategies For SMEs DT SS V is the one for you. You can use it as a Google Slides template or a PowerPoint template. Incorporate impressive visuals, symbols, images, and other charts. Modify or reorganize the text boxes as you desire. Experiment with shade schemes and font pairings. Alter, share or cooperate with other people on your work. Download Continuous Improvement And Innovation Strategies For SMEs DT SS V and find out how to give a successful presentation. Present a perfect display to your team and make your presentation unforgettable. This slide presents a strategy for continuous improvement and innovation of digital transformation in SMEs. It includes agile mindset, investment in digital skills, lean and six sigma methodologies, cloud and SaaS adoption, rapid prototyping and MVPs, and data-driven decision making.
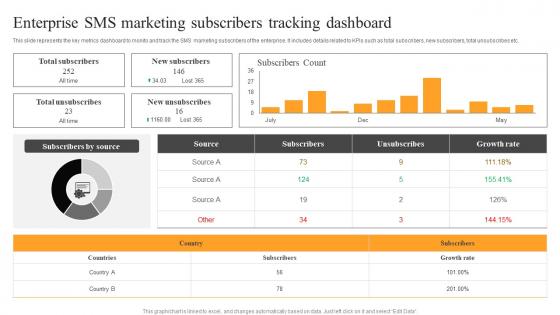
Enterprise SMS Marketing Subscribers Text Message Advertising Solutions Enhancing Diagrams Pdf
This slide represents the key metrics dashboard to monito and track the SMS marketing subscribers of the enterprise. It includes details related to KPIs such as total subscribers, new subscribers, total unsubscribes etc. Are you in need of a template that can accommodate all of your creative concepts This one is crafted professionally and can be altered to fit any style. Use it with Google Slides or PowerPoint. Include striking photographs, symbols, depictions, and other visuals. Fill, move around, or remove text boxes as desired. Test out color palettes and font mixtures. Edit and save your work, or work with colleagues. Download Enterprise SMS Marketing Subscribers Text Message Advertising Solutions Enhancing Diagrams Pdf and observe how to make your presentation outstanding. Give an impeccable presentation to your group and make your presentation unforgettable. This slide represents the key metrics dashboard to monito and track the SMS marketing subscribers of the enterprise. It includes details related to KPIs such as total subscribers, new subscribers, total unsubscribes etc.
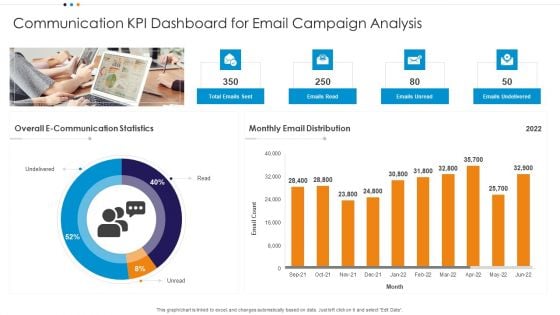
Communication KPI Dashboard For Email Campaign Analysis Microsoft PDF
Showcasing this set of slides titled Communication KPI Dashboard For Email Campaign Analysis Microsoft PDF The topics addressed in these templates are E Communication, Statistics Email Distribution, Campaign Analysis All the content presented in this PPT design is completely editable. Download it and make adjustments in color, background, font etc. as per your unique business setting.
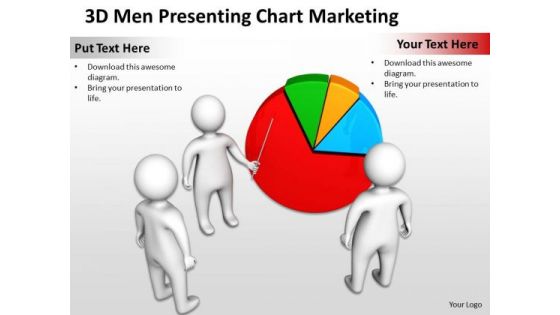
Business Charts Presenting Pie Marketing PowerPoint Templates Ppt Backgrounds For Slides
We present our business charts presenting pie marketing PowerPoint templates PPT backgrounds for slides.Present our Finance PowerPoint Templates because Our PowerPoint Templates and Slides offer you the widest possible range of options. Present our Business PowerPoint Templates because you can Break through with our PowerPoint Templates and Slides. Bring down the mental barriers of your audience. Use our Success PowerPoint Templates because Your ideas provide food for thought. Our PowerPoint Templates and Slides will help you create a dish to tickle the most discerning palate. Download and present our Marketing PowerPoint Templates because Timeline crunches are a fact of life. Meet all deadlines using our PowerPoint Templates and Slides. Use our Arrows PowerPoint Templates because Our PowerPoint Templates and Slides will give you great value for your money. Be assured of finding the best projection to highlight your words. Use these PowerPoint slides for presentations relating to 3d, Arrow, Business, Businessman, Cartoon, Character, Chart, Concept, Corporate, Data, Development, Diagram, Display, Figure, Finance, Financial, Graph, Graphic, Green, Growth, Guy, Human, Icon, Idea, Illustration, Information, Investment, Isolated, Market, Marketing, Men, Office, Part, People, Person, Pie, Presentation, Professional, Progress, Red, Reflection, Report, Shape, Shiny, Sign, Success. The prominent colors used in the PowerPoint template are Green, Red, White. Presenters tell us our business charts presenting pie marketing PowerPoint templates PPT backgrounds for slides are designed to make your presentations professional. PowerPoint presentation experts tell us our Concept PowerPoint templates and PPT Slides are topically designed to provide an attractive backdrop to any subject. Professionals tell us our business charts presenting pie marketing PowerPoint templates PPT backgrounds for slides are designed by a team of presentation professionals. People tell us our Concept PowerPoint templates and PPT Slides are designed by a team of presentation professionals. The feedback we get is that our business charts presenting pie marketing PowerPoint templates PPT backgrounds for slides help you meet deadlines which are an element of today's workplace. Just browse and pick the slides that appeal to your intuitive senses. Customers tell us our Chart PowerPoint templates and PPT Slides provide you with a vast range of viable options. Select the appropriate ones and just fill in your text. Thwart problems with our Business Charts Presenting Pie Marketing PowerPoint Templates Ppt Backgrounds For Slides. Download without worries with our money back guaranteee.
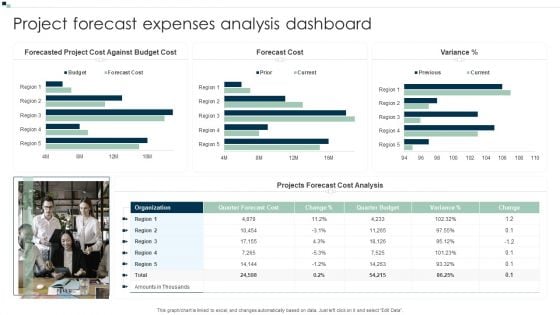
Project Forecast Expenses Analysis Dashboard Template PDF
Pitch your topic with ease and precision using this Project Forecast Expenses Analysis Dashboard Template PDF. This layout presents information on Forecast Cost, Projects Forecast Cost Analysis, Organization. It is also available for immediate download and adjustment. So, changes can be made in the color, design, graphics or any other component to create a unique layout.
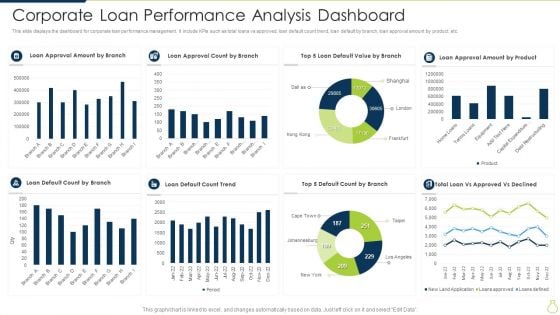
Corporate Loan Performance Analysis Dashboard Slides PDF
This slide displays the dashboard for corporate loan performance management. It include KPIs such as total loans vs approved, loan default count trend, loan default by branch, loan approval amount by product, etc. Showcasing this set of slides titled Corporate Loan Performance Analysis Dashboard Slides PDF. The topics addressed in these templates are Loan Default Count Trend, Loan Approval Count By Branch, Loan Approval Amount By Product. All the content presented in this PPT design is completely editable. Download it and make adjustments in color, background, font etc. as per your unique business setting.
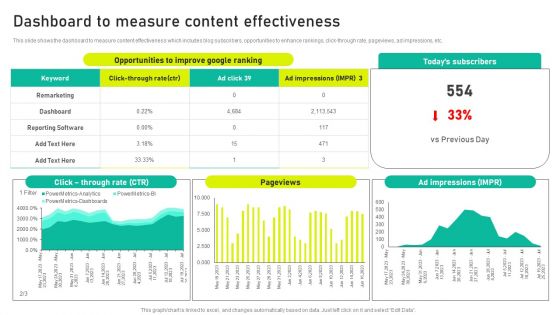
Dashboard To Measure Content Effectiveness Ppt Ideas Diagrams PDF
This slide shows the dashboard to measure content effectiveness which includes blog subscribers, opportunities to enhance rankings, click-through rate, pageviews, ad impressions, etc. Coming up with a presentation necessitates that the majority of the effort goes into the content and the message you intend to convey. The visuals of a PowerPoint presentation can only be effective if it supplements and supports the story that is being told. Keeping this in mind our experts created Dashboard To Measure Content Effectiveness Ppt Ideas Diagrams PDF to reduce the time that goes into designing the presentation. This way, you can concentrate on the message while our designers take care of providing you with the right template for the situation.
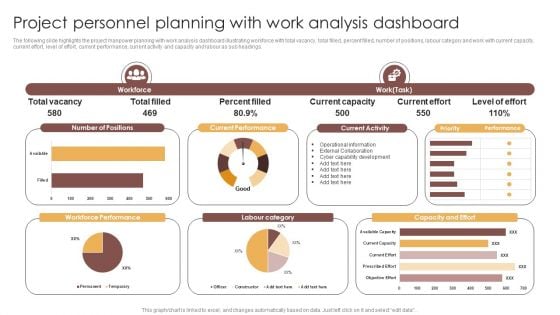
Project Personnel Planning With Work Analysis Dashboard Information PDF
The following slide highlights the project manpower planning with work analysis dashboard illustrating workforce with total vacancy, total filled, percent filled, number of positions, labour category and work with current capacity, current effort, level of effort, current performance, current activity and capacity and labour as sub headings. Showcasing this set of slides titled Project Personnel Planning With Work Analysis Dashboard Information PDF. The topics addressed in these templates are Number Of Positions, Current Performance, Current Activity, Labour Category. All the content presented in this PPT design is completely editable. Download it and make adjustments in color, background, font etc. as per your unique business setting.
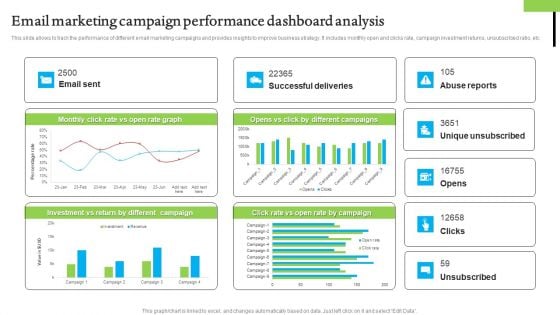
Email Marketing Campaign Performance Dashboard Analysis Information PDF
This slide allows to track the performance of different email marketing campaigns and provides insights to improve business strategy. It includes monthly open and clicks rate, campaign investment returns, unsubscribed ratio, etc. Showcasing this set of slides titled Email Marketing Campaign Performance Dashboard Analysis Information PDF. The topics addressed in these templates are Performance Dashboard Analysis, Email Marketing Campaign. All the content presented in this PPT design is completely editable. Download it and make adjustments in color, background, font etc. as per your unique business setting.
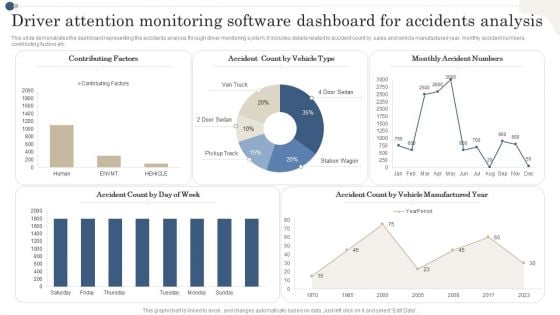
Driver Attention Monitoring Software Dashboard For Accidents Analysis Diagrams PDF
This slide demonstrates the dashboard representing the accidents analysis through driver monitoring system. It includes details related to accident count by sales and vehicle manufactured year, monthly accident numbers, contributing factors etc. Showcasing this set of slides titled Driver Attention Monitoring Software Dashboard For Accidents Analysis Diagrams PDF. The topics addressed in these templates are Contributing Factors,Vehicle Type, Monthly Accident Numbers. All the content presented in this PPT design is completely editable. Download it and make adjustments in color, background, font etc. as per your unique business setting.
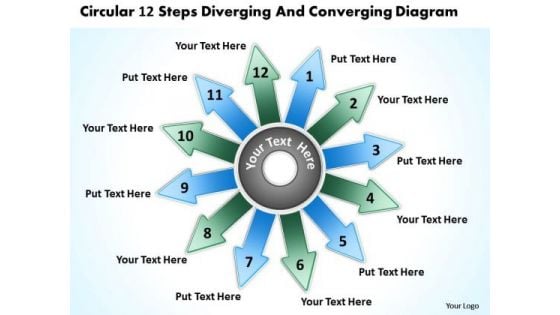
Circular 12 Steps Diverging And Converging Diagram Ppt Process PowerPoint Slides
We present our circular 12 steps diverging and converging diagram ppt Process PowerPoint Slides.Use our Arrows PowerPoint Templates because it will demonstrate the strength of character under severe stress. Shine the torch ahead and bring the light to shine on all. Use our Circle Charts PowerPoint Templates because this PPt slide helps you to measure key aspects of the current process and collect relevant data. Present our Shapes PowerPoint Templates because you have configured your targets, identified your goals as per priority and importance. Use our Business PowerPoint Templates because this slide will fire away with all the accuracy at your command. Download and present our Flow Charts PowerPoint Templates because this slide brings grey areas to the table and explain in detail you assessment of the need for care to ensure continued smooth progress.Use these PowerPoint slides for presentations relating to arrows, business, chart, circle, company, concept, continuity, continuous, cycle, dependency, diagram, direction, dynamic, endless, feeds, graph, iteration, iterative, method, path, phase, presentation, process, production, progress, progression, report, rotation, sequence, succession, vector. The prominent colors used in the PowerPoint template are Green, Blue, Gray. Presenters tell us our circular 12 steps diverging and converging diagram ppt Process PowerPoint Slides are readymade to fit into any presentation structure. You can be sure our continuity PowerPoint templates and PPT Slides are designed to make your presentations professional. Professionals tell us our circular 12 steps diverging and converging diagram ppt Process PowerPoint Slides are Bright. People tell us our continuous PowerPoint templates and PPT Slides are Festive. People tell us our circular 12 steps diverging and converging diagram ppt Process PowerPoint Slides are Tasteful. Professionals tell us our continuous PowerPoint templates and PPT Slides are Nostalgic. Encourage teams with our Circular 12 Steps Diverging And Converging Diagram Ppt Process PowerPoint Slides. Download without worries with our money back guaranteee.
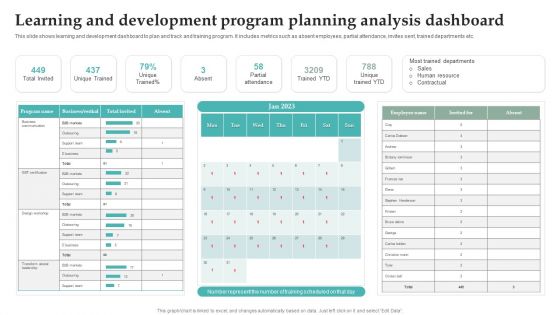
Learning And Development Program Planning Analysis Dashboard Information PDF
This slide shows learning and development dashboard to plan and track and training program. It includes metrics such as absent employees, partial attendance, invites sent, trained departments etc. Showcasing this set of slides titled Learning And Development Program Planning Analysis Dashboard Information PDF. The topics addressed in these templates are Partial Attendance, Trained YTD, Unique Trained YTD. All the content presented in this PPT design is completely editable. Download it and make adjustments in color, background, font etc. as per your unique business setting.
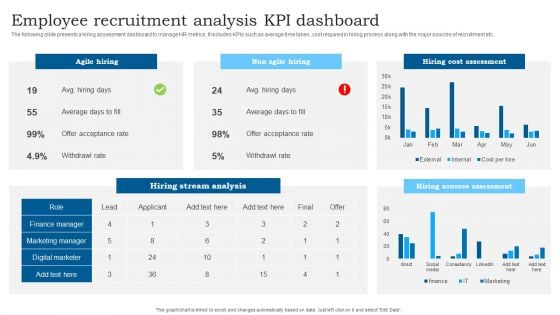
Employee Recruitment Analysis KPI Dashboard Slides PDF
The following slide presents a hiring assessment dashboard to manage HR metrics. It includes KPIs such as average time taken, cost required in hiring process along with the major sources of recruitment etc. Pitch your topic with ease and precision using this Employee Recruitment Analysis KPI Dashboard Slides PDF. This layout presents information on Agile Hiring, Non Agile Hiring, Hiring Cost Assessment. It is also available for immediate download and adjustment. So, changes can be made in the color, design, graphics or any other component to create a unique layout.
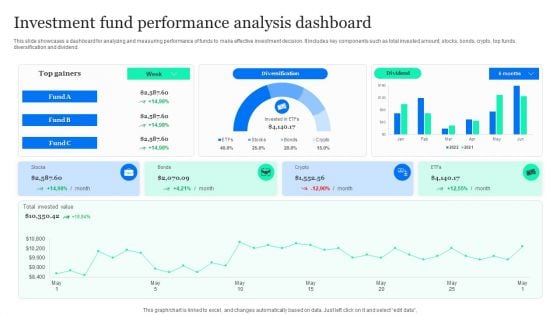
Investment Fund Performance Analysis Dashboard Professional PDF
This slide showcases a dashboard for analyzing and measuring performance of funds to make effective investment decision. It includes key components such as total invested amount, stocks, bonds, crypto, top funds, diversification and dividend. Pitch your topic with ease and precision using this Investment Fund Performance Analysis Dashboard Professional PDF. This layout presents information on Diversification, Invested Value, Bonds. It is also available for immediate download and adjustment. So, changes can be made in the color, design, graphics or any other component to create a unique layout.
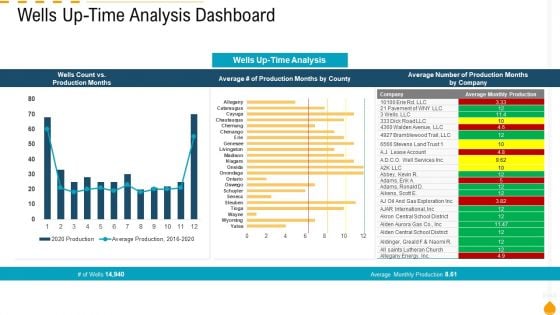
Wells Up Time Analysis Dashboard Elements PDF
Deliver an awe inspiring pitch with this creative wells up time analysis dashboard elements pdf bundle. Topics like wells up time analysis dashboard, can be discussed with this completely editable template. It is available for immediate download depending on the needs and requirements of the user.
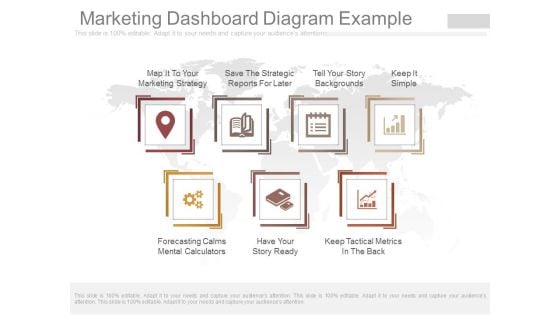
Marketing Dashboard Diagram Example
This is a marketing dashboard diagram example. This is a seven stage process. The stages in this process are map it to your marketing strategy, save the strategic reports for later, tell your story backgrounds, keep it simple, forecasting calms mental calculators, have your story ready, keep tactical metrics in the back.
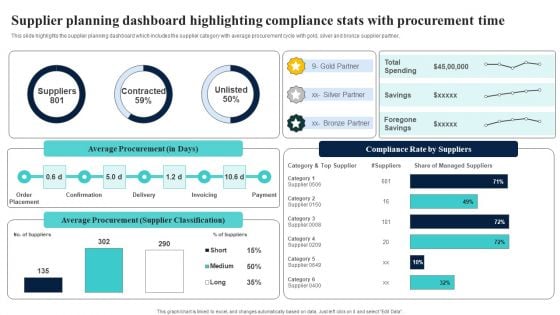
Supplier Planning Dashboard Highlighting Compliance Stats With Procurement Time Elements PDF
This slide highlights the supplier planning dashboard which includes the supplier category with average procurement cycle with gold, silver and bronze supplier partner. Here you can discover an assortment of the finest PowerPoint and Google Slides templates. With these templates, you can create presentations for a variety of purposes while simultaneously providing your audience with an eye catching visual experience. Download Supplier Planning Dashboard Highlighting Compliance Stats With Procurement Time Elements PDF to deliver an impeccable presentation. These templates will make your job of preparing presentations much quicker, yet still, maintain a high level of quality. Slidegeeks has experienced researchers who prepare these templates and write high quality content for you. Later on, you can personalize the content by editing the Supplier Planning Dashboard Highlighting Compliance Stats With Procurement Time Elements PDF.
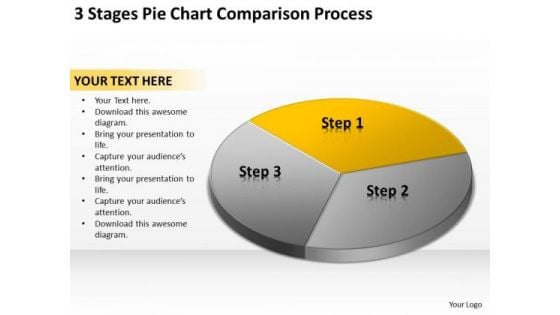
3 Stages Pie Chart Comparison Process Example Of Business Plans PowerPoint Slides
We present our 3 stages pie chart comparison process example of business plans PowerPoint Slides.Download our Marketing PowerPoint Templates because You have gained great respect for your brilliant ideas. Use our PowerPoint Templates and Slides to strengthen and enhance your reputation. Use our Finance PowerPoint Templates because You are working at that stage with an air of royalty. Let our PowerPoint Templates and Slides be the jewels in your crown. Present our Arrows PowerPoint Templates because Our PowerPoint Templates and Slides offer you the widest possible range of options. Download our Circle Charts PowerPoint Templates because You can Create a matrix with our PowerPoint Templates and Slides. Feel the strength of your ideas click into place. Download and present our Business PowerPoint Templates because You can Zap them with our PowerPoint Templates and Slides. See them reel under the impact.Use these PowerPoint slides for presentations relating to Pie, chart, process, menu, website, network, statistics, item, junction, corporate, business, plan, presentation, template, circle, brochure, data, report, marketing, different, management, graph, modern, connection, sphere, options, strategy, catalog, world, spherical, segments, text, company, banner, information, navigation, structure, parts, globe, arrows, communication. The prominent colors used in the PowerPoint template are Yellow, Black, Gray. Create the right environment for prosperity. Fashion the right conditions with our 3 Stages Pie Chart Comparison Process Example Of Business Plans PowerPoint Slides.
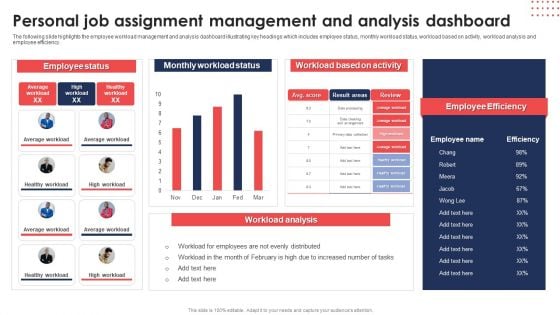
Personal Job Assignment Management And Analysis Dashboard Diagrams PDF
The following slide highlights the employee workload management and analysis dashboard illustrating key headings which includes employee status, monthly workload status, workload based on activity, workload analysis and employee efficiency. Pitch your topic with ease and precision using thisPersonal Job Assignment Management And Analysis Dashboard Diagrams PDF. This layout presents information on Employee Status, Monthly Workload Status, Workload Based Activity. It is also available for immediate download and adjustment. So, changes can be made in the color, design, graphics or any other component to create a unique layout.
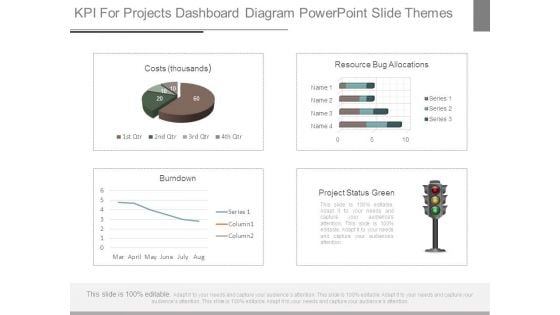
Kpi For Projects Dashboard Diagram Powerpoint Slide Themes
This is a kpi for projects dashboard diagram powerpoint slide themes. This is a four stage process. The stages in this process are project status green, costs thousands, resource bug allocations, burndown.
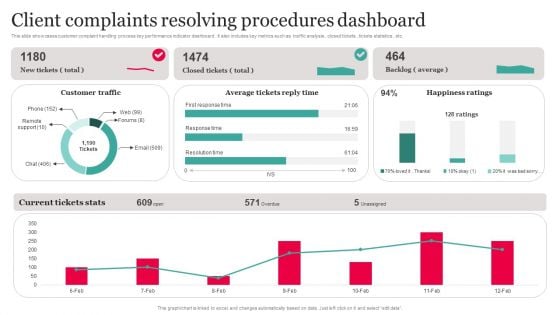
Client Complaints Resolving Procedures Dashboard Download PDF
This slide showcases customer complaint handling process key performance indicator dashboard. It also includes key metrics such as traffic analysis , closed tickets , tickets statistics , etc. Showcasing this set of slides titled Client Complaints Resolving Procedures Dashboard Download PDF The topics addressed in these templates are Customer Traffic, Average Tickets Reply Time, Resolving Procedures Dashboard. All the content presented in this PPT design is completely editable. Download it and make adjustments in color, background, font etc. as per your unique business setting.
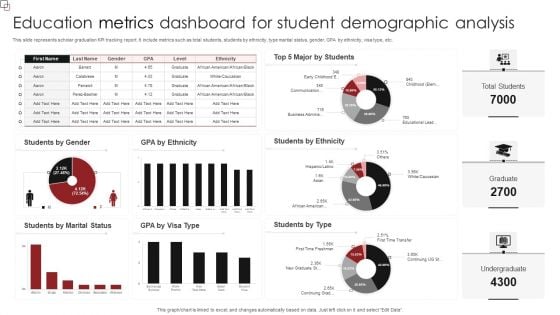
Education Metrics Dashboard For Student Demographic Analysis Diagrams PDF
This slide represents scholar graduation KPI tracking report. It include metrics such as total students, students by ethnicity, type marital status, gender, GPA by ethnicity, visa type, etc. Showcasing this set of slides titled Education Metrics Dashboard For Student Demographic Analysis Diagrams PDF. The topics addressed in these templates are Students Ethnicity, Students Type, Students Marital Status. All the content presented in this PPT design is completely editable. Download it and make adjustments in color, background, font etc. as per your unique business setting.
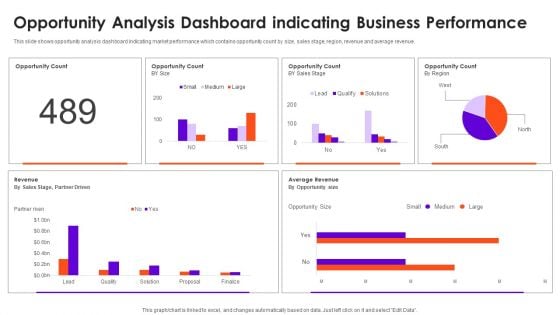
Opportunity Analysis Dashboard Indicating Business Performance Information Rules PDF
This slide shows opportunity analysis dashboard indicating market performance which contains opportunity count by size, sales stage, region, revenue and average revenue. Pitch your topic with ease and precision using this Opportunity Analysis Dashboard Indicating Business Performance Information Rules PDF. This layout presents information on Opportunity Count, Revenue, Sales. It is also available for immediate download and adjustment. So, changes can be made in the color, design, graphics or any other component to create a unique layout.

PowerPoint Business 3d Man And Blue Folder Slides
We present our powerpoint business 3d man and blue folder Slides.Present our Computer PowerPoint Templates because Our PowerPoint Templates and Slides offer you the needful to organise your thoughts. Use them to list out your views in a logical sequence. Use our Business PowerPoint Templates because You are working at that stage with an air of royalty. Let our PowerPoint Templates and Slides be the jewels in your crown. Use our Symbol PowerPoint Templates because You should Bet on your luck with our PowerPoint Templates and Slides. Be assured that you will hit the jackpot. Use our Technology PowerPoint Templates because These PowerPoint Templates and Slides will give the updraft to your ideas. See them soar to great heights with ease. Present our Symbol PowerPoint Templates because These PowerPoint Templates and Slides will give the updraft to your ideas. See them soar to great heights with ease.Use these PowerPoint slides for presentations relating to 3d, Archives, Arranging, Blue, Bureaucracy, Character, Collection, Computer, Data, Different, Digitally, Directory, Document, Figure, File, Folder, Generated, Group, Guy, Human, Icon, Illustration, Information, Isolated, Men, One, Order, Organization, Organized, Paper, Paperwork, People, Person, Portfolio, Puppet, Red, Reflection, Render, Report, Row, Storage, Supported, Symbol, Unique. The prominent colors used in the PowerPoint template are Blue, Red, White. We assure you our powerpoint business 3d man and blue folder Slides are the best it can get when it comes to presenting. Use our Collection PowerPoint templates and PPT Slides are effectively colour coded to prioritise your plans They automatically highlight the sequence of events you desire. We assure you our powerpoint business 3d man and blue folder Slides will save the presenter time. Professionals tell us our Collection PowerPoint templates and PPT Slides will help them to explain complicated concepts. The feedback we get is that our powerpoint business 3d man and blue folder Slides are specially created by a professional team with vast experience. They diligently strive to come up with the right vehicle for your brilliant Ideas. You can be sure our Arranging PowerPoint templates and PPT Slides will help them to explain complicated concepts. Create alliances with our PowerPoint Business 3d Man And Blue Folder Slides. Generate familiarity within your team.
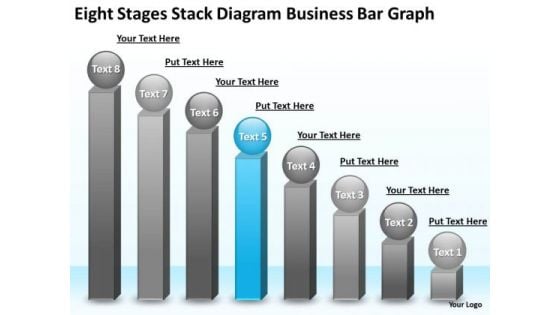
Diagram Free Business PowerPoint Templates Bar Graph Online Plan Slides
We present our diagram free business powerpoint templates bar graph online plan Slides.Download our Marketing PowerPoint Templates because Our PowerPoint Templates and Slides provide you with a vast range of viable options. Select the appropriate ones and just fill in your text. Download our Finance PowerPoint Templates because Our PowerPoint Templates and Slides team portray an attitude of elegance. Personify this quality by using them regularly. Use our Spheres PowerPoint Templates because Our PowerPoint Templates and Slides are Clear and concise. Use them and dispel any doubts your team may have. Download and present our Shapes PowerPoint Templates because Our PowerPoint Templates and Slides are created with admirable insight. Use them and give your group a sense of your logical mind. Download our Business PowerPoint Templates because Our PowerPoint Templates and Slides are conceived by a dedicated team. Use them and give form to your wondrous ideas.Use these PowerPoint slides for presentations relating to Graph, chart, bar, business, arrow, growth, profit, progress, diagram, vector, success, forecasting, achievement, business, sign, symbol, finance, data, goal, report, marketing, analyzing, abstract, illustration, economic, sale, investment, improvement, statistic, financial. The prominent colors used in the PowerPoint template are Gray, Blue, Black. Become a contributor with our Diagram Free Business PowerPoint Templates Bar Graph Online Plan Slides. You will come out on top.
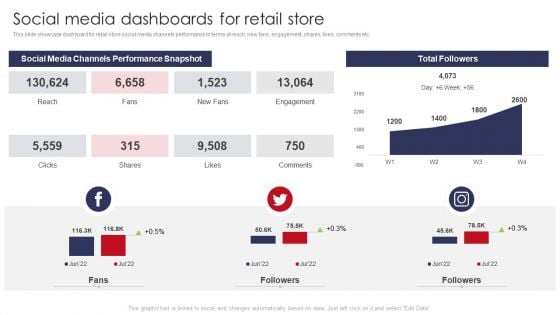
Social Media Dashboards For Retail Store Retail Outlet Operations Performance Evaluation Inspiration PDF
This slide showcase dashboard for retail store social media channels performance in terms of reach, new fans, engagement, shares, likes, comments etc.Deliver an awe inspiring pitch with this creative Social Media Dashboards For Retail Store Retail Outlet Operations Performance Evaluation Inspiration PDF bundle. Topics like Social Media, Channels Performance, Snapshot can be discussed with this completely editable template. It is available for immediate download depending on the needs and requirements of the user.
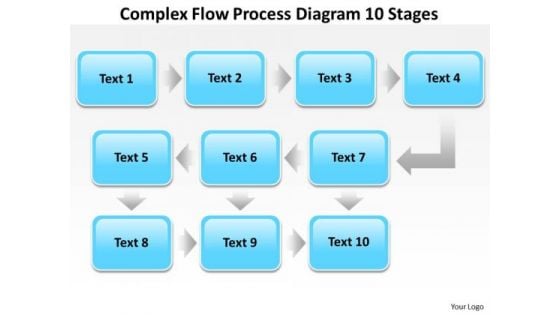
Business Strategy Formulation Complex Flow Process Diagram 10 Stages
We present our business strategy formulation complex flow process diagram 10 stages.Download and present our Communication PowerPoint Templates because You can Raise a toast with our PowerPoint Templates and Slides. Spread good cheer amongst your audience. Present our Business PowerPoint Templates because Our PowerPoint Templates and Slides are topically designed to provide an attractive backdrop to any subject. Present our Boxes PowerPoint Templates because It will let you Set new benchmarks with our PowerPoint Templates and Slides. They will keep your prospects well above par. Present our Arrows PowerPoint Templates because Our PowerPoint Templates and Slides ensures Effective communication. They help you put across your views with precision and clarity. Download and present our Shapes PowerPoint Templates because Our PowerPoint Templates and Slides offer you the widest possible range of options.Use these PowerPoint slides for presentations relating to Arrow, Banner, Boxes, Brochure, Business, Catalog, Chart, Circle, Communication, Company, Connection, Corporate, Data, Diagram, Different, Graph, Illustration, Information, Item, Junction, Management, Marketing, Menu, Modern, Multicolored, Navigation, Network, Note, Options, Parts, Pie, Plan, Presentation, Process, Report, Schematic, Segments, Sphere, Spherical, Statistics, Strategy, Structure, Tab, Template. The prominent colors used in the PowerPoint template are Blue, Gray, White. Our Business Strategy Formulation Complex Flow Process Diagram 10 Stages make excellent accessories. Your thoughts will don that designer look.
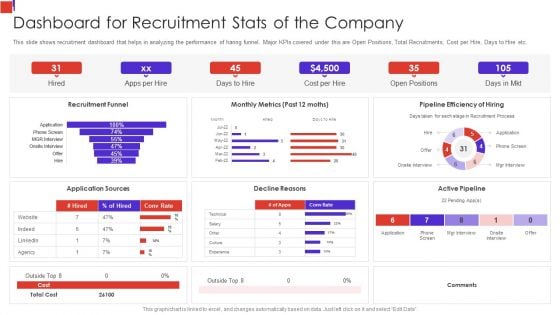
Outline Of Employee Recruitment Dashboard For Recruitment Stats Of The Company Formats PDF
This slide shows recruitment dashboard that helps in analyzing the performance of haring funnel. Major KPIs covered under this are Open Positions, Total Recruitments, Cost per Hire, Days to Hire etc.Deliver and pitch your topic in the best possible manner with this Outline Of Employee Recruitment Dashboard For Recruitment Stats Of The Company Formats PDF Use them to share invaluable insights on Dashboard For Recruitment, Stats Of The Company, Decline Reasons and impress your audience. This template can be altered and modified as per your expectations. So, grab it now.
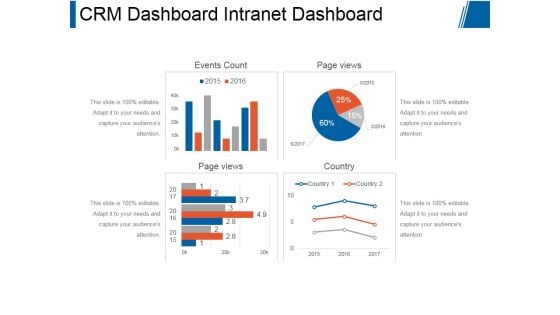
Crm Dashboard Intranet Dashboard Ppt PowerPoint Presentation Model
This is a crm dashboard intranet dashboard ppt powerpoint presentation model. This is a four stage process. The stages in this process are events count, page views, page views, country.
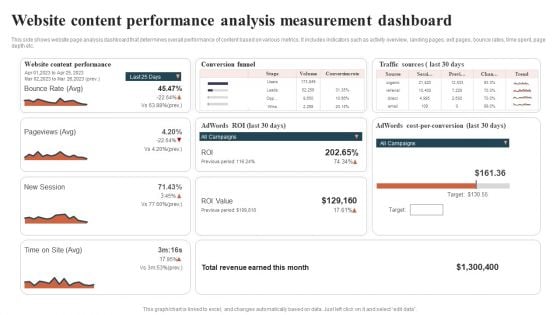
Website Content Performance Analysis Measurement Dashboard Guidelines PDF
This side shows website page analysis dashboard that determines overall performance of content based on various metrics. It includes indicators such as activity overview, landing pages, exit pages, bounce rates, time spent, page depth etc. Showcasing this set of slides titled Website Content Performance Analysis Measurement Dashboard Guidelines PDF. The topics addressed in these templates are Conversion Funnel, Traffic Sources, Total Revenue. All the content presented in this PPT design is completely editable. Download it and make adjustments in color, background, font etc. as per your unique business setting.

Project Planning And Risk Analysis Template Ppt PowerPoint Presentation Styles Layout Ideas
This is a project planning and risk analysis template ppt powerpoint presentation styles layout ideas. This is a five stage process. The stages in this process are project analysis, project review, project performance management.
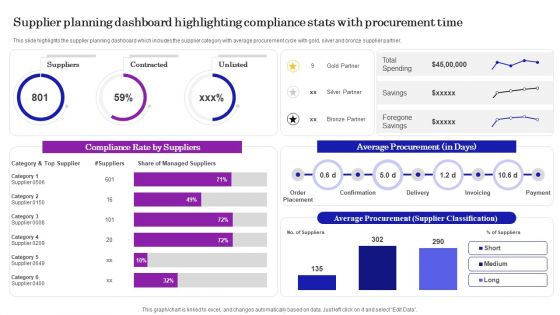
Supplier Planning Dashboard Highlighting Compliance Stats With Procurement Time Inspiration PDF
This slide highlights the supplier planning dashboard which includes the supplier category with average procurement cycle with gold, silver and bronze supplier partner. Presenting this PowerPoint presentation, titled Supplier Planning Dashboard Highlighting Compliance Stats With Procurement Time Inspiration PDF, with topics curated by our researchers after extensive research. This editable presentation is available for immediate download and provides attractive features when used. Download now and captivate your audience. Presenting this Supplier Planning Dashboard Highlighting Compliance Stats With Procurement Time Inspiration PDF. Our researchers have carefully researched and created these slides with all aspects taken into consideration. This is a completely customizable Supplier Planning Dashboard Highlighting Compliance Stats With Procurement Time Inspiration PDF that is available for immediate downloading. Download now and make an impact on your audience. Highlight the attractive features available with our PPTs.
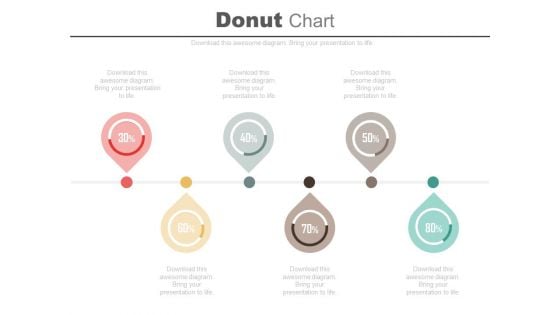
Six Pointers Percentage Timeline Diagram Powerpoint Slides
Profitability indicator ratios have been displayed this business slide. This PowerPoint template contains linear pointers timeline diagram. Use this professional diagram slide to build an exclusive presentation.
Massively Parallel Processing Database PowerPoint Templates Ppt Backgrounds For Slides
We present our massively parallel processing database PowerPoint templates PPT backgrounds for slides.Download and present our Arrows PowerPoint Templates because Our PowerPoint Templates and Slides are effectively colour coded to prioritise your plans They automatically highlight the sequence of events you desire. Download our Business PowerPoint Templates because you should Whip up a frenzy with our PowerPoint Templates and Slides. They will fuel the excitement of your team. Download and present our Marketing PowerPoint Templates because our PowerPoint Templates and Slides are the string of your bow. Fire of your ideas and conquer the podium. Present our Shapes PowerPoint Templates because you should Whip up a frenzy with our PowerPoint Templates and Slides. They will fuel the excitement of your team. Download and present our Success PowerPoint Templates because You will get more than you ever bargained for. Use these PowerPoint slides for presentations relating to abstract, account, achievement, arrow, background, business, calculation, company, data, design, development, diagram, document, earnings, finance, future, gain, global, graph, graphic, grow, growth, icon, ideas, illustration, information, isolated, marketing, money, number, office, part, pie, plan, presentation, profit, progress, reflection, report, results, rise, shiny, sign, statistic, success, symbol, vector. The prominent colors used in the PowerPoint template are Blue navy, Blue, White. People tell us our massively parallel processing database PowerPoint templates PPT backgrounds for slides are incredible easy to use. People tell us our calculation PowerPoint templates and PPT Slides will make the presenter look like a pro even if they are not computer savvy. Presenters tell us our massively parallel processing database PowerPoint templates PPT backgrounds for slides are designed by professionals We assure you our background PowerPoint templates and PPT Slides are specially created by a professional team with vast experience. They diligently strive to come up with the right vehicle for your brilliant Ideas. Presenters tell us our massively parallel processing database PowerPoint templates PPT backgrounds for slides look good visually. Professionals tell us our company PowerPoint templates and PPT Slides are incredible easy to use. Present your views with our Massively Parallel Processing Database PowerPoint Templates Ppt Backgrounds For Slides. You will come out on top.
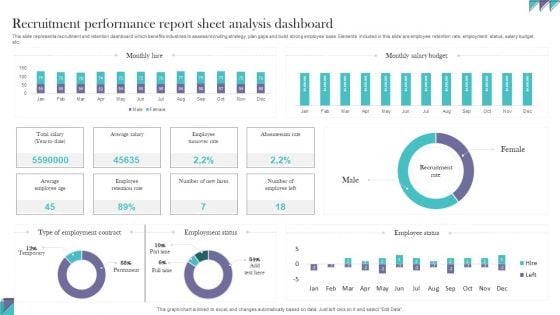
Recruitment Performance Report Sheet Analysis Dashboard Information PDF
This slide represents recruitment and retention dashboard which benefits industries to assess recruiting strategy, plan gaps and build strong employee base. Elements included in this slide are employee retention rate, employment status, salary budget, etc. Pitch your topic with ease and precision using this Recruitment Performance Report Sheet Analysis Dashboard Information PDF. This layout presents information onRecruitment Performance, Report Sheet Analysis. It is also available for immediate download and adjustment. So, changes can be made in the color, design, graphics or any other component to create a unique layout.
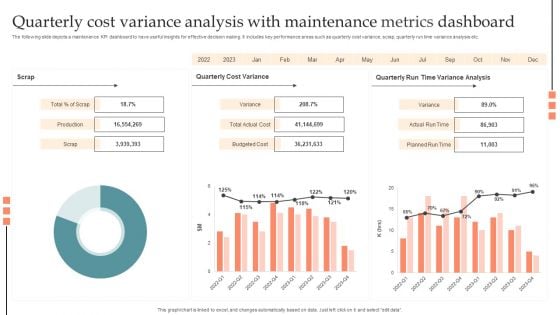
Quarterly Cost Variance Analysis With Maintenance Metrics Dashboard Information PDF
The following slide depicts a maintenance KPI dashboard to have useful insights for effective decision making. It includes key performance areas such as quarterly cost variance, scrap, quarterly run time variance analysis etc. Pitch your topic with ease and precision using this Quarterly Cost Variance Analysis With Maintenance Metrics Dashboard Information PDF. This layout presents information on Production, Budgeted Cost, Planned Run Time, Actual Run Time. It is also available for immediate download and adjustment. So, changes can be made in the color, design, graphics or any other component to create a unique layout.
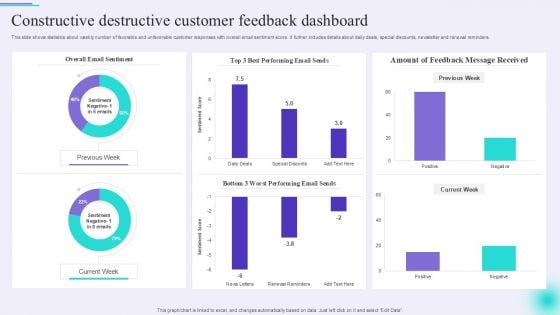
Constructive Destructive Customer Feedback Dashboard Designs PDF
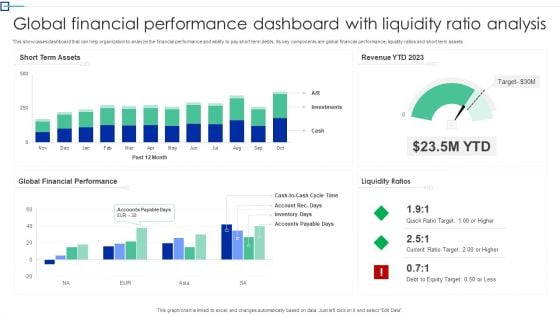
Global Financial Performance Dashboard With Liquidity Ratio Analysis Information PDF
This showcases dashboard that can help organization to analyze the financial performance and ability to pay short term debts. Its key components are global financial performance, liquidity ratios and short term assets. Pitch your topic with ease and precision using this Global Financial Performance Dashboard With Liquidity Ratio Analysis Information PDF. This layout presents information on Short Term Assets, Global Financial Performance, Liquidity Ratios. It is also available for immediate download and adjustment. So, changes can be made in the color, design, graphics or any other component to create a unique layout.
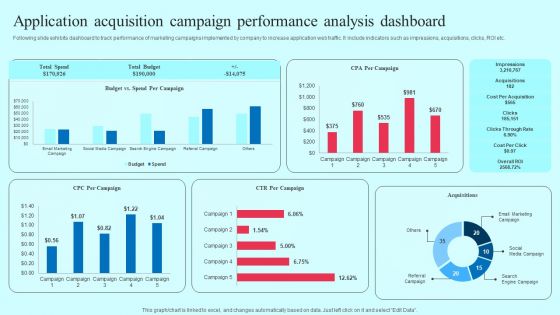
Application Acquisition Campaign Performance Analysis Dashboard Information PDF
Following slide exhibits dashboard to track performance of marketing campaigns implemented by company to increase application web traffic. It include indicators such as impressions, acquisitions, clicks, ROI etc. Find a pre designed and impeccable Application Acquisition Campaign Performance Analysis Dashboard Information PDF. The templates can ace your presentation without additional effort. You can download these easy to edit presentation templates to make your presentation stand out from others. So, what are you waiting for Download the template from Slidegeeks today and give a unique touch to your presentation.
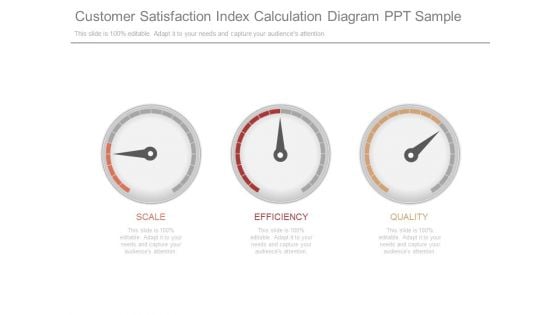
Customer Satisfaction Index Calculation Diagram Ppt Sample
This is a customer satisfaction index calculation diagram ppt sample. This is a three stage process. The stages in this process are scale, efficiency, quality.
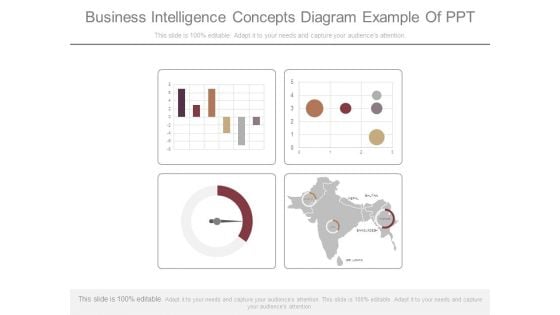
Business Intelligence Concepts Diagram Example Of Ppt
This is a business intelligence concepts diagram example of ppt. This is a four stage process. The stages in this process are location, measuring, business, strategy, management.
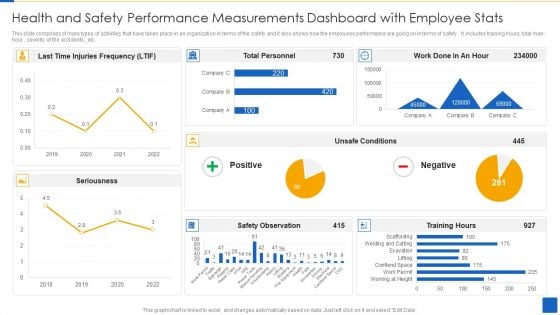
Health And Safety Performance Measurements Dashboard With Employee Stats Template PDF
This slide comprises of many types of activities that have taken place in an organization in terms of the safety and it also shows how the employees performance are going on in terms of safety . It includes training hours, total man-hour , severity of the accidents , etc.Pitch your topic with ease and precision using this Health And Safety Performance Measurements Dashboard With Employee Stats Template PDF This layout presents information on Safety Observation, Injuries Frequency, Unsafe Conditions It is also available for immediate download and adjustment. So, changes can be made in the color, design, graphics or any other component to create a unique layout.
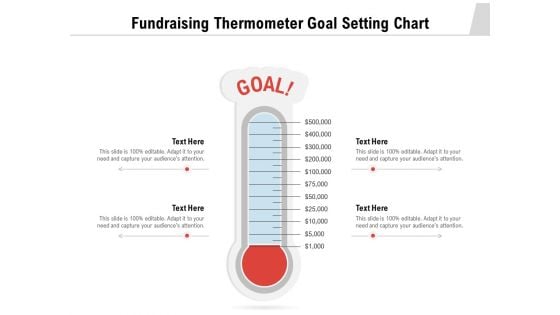
Fundraising Thermometer Goal Setting Chart Ppt PowerPoint Presentation Gallery Master Slide PDF
Presenting this set of slides with name fundraising thermometer goal setting chart ppt powerpoint presentation gallery master slide pdf. This is a one stage process. The stages in this process are fundraising thermometer goal setting chart. This is a completely editable PowerPoint presentation and is available for immediate download. Download now and impress your audience.


 Continue with Email

 Home
Home


