Data Analytics Process
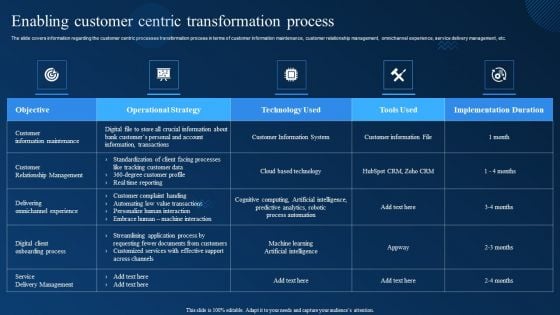
Cognitive Analytics Strategy And Techniques Enabling Customer Centric Transformation Process Introduction PDF
The slide covers information regarding the customer centric processes transformation process in terms of customer information maintenance, customer relationship management, omnichannel experience, service delivery management, etc. Boost your pitch with our creative Cognitive Analytics Strategy And Techniques Enabling Customer Centric Transformation Process Introduction PDF. Deliver an awe inspiring pitch that will mesmerize everyone. Using these presentation templates you will surely catch everyones attention. You can browse the ppts collection on our website. We have researchers who are experts at creating the right content for the templates. So you do not have to invest time in any additional work. Just grab the template now and use them.
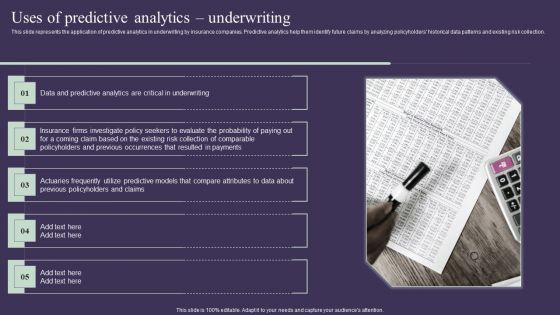
Projection Model Uses Of Predictive Analytics Underwriting Pictures PDF
This slide represents the application of predictive analytics in underwriting by insurance companies. Predictive analytics help them identify future claims by analyzing policyholders historical data patterns and existing risk collection. Boost your pitch with our creative Projection Model Uses Of Predictive Analytics Underwriting Pictures PDF. Deliver an awe-inspiring pitch that will mesmerize everyone. Using these presentation templates you will surely catch everyones attention. You can browse the ppts collection on our website. We have researchers who are experts at creating the right content for the templates. So you do not have to invest time in any additional work. Just grab the template now and use them.
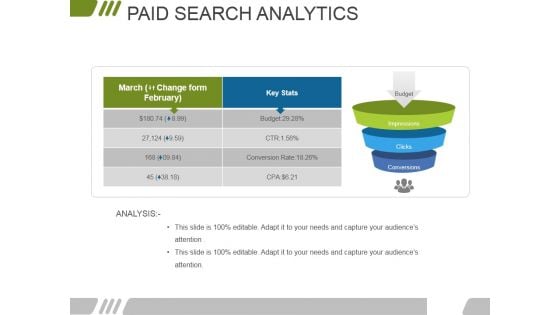
Paid Search Analytics Ppt PowerPoint Presentation Portfolio Ideas
This is a paid search analytics ppt powerpoint presentation portfolio ideas. This is a three stage process. The stages in this process are budget, impressions, clicks, conversions.
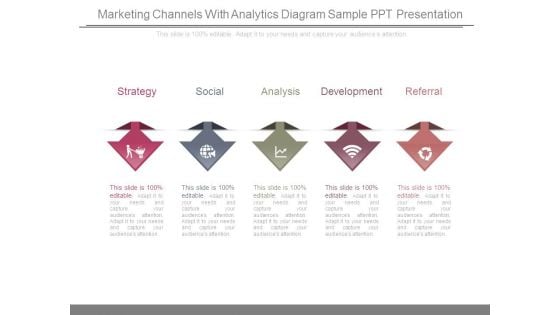
Marketing Channels With Analytics Diagram Sample Ppt Presentation
This is a marketing channels with analytics diagram sample ppt presentation. This is a five stage process. The stages in this process are strategy, social, analysis, development, referral.
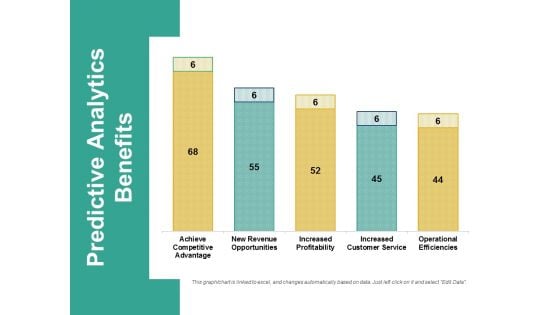
Predictive Analytics Benefits Ppt PowerPoint Presentation Professional Samples
This is a predictive analytics benefits ppt powerpoint presentation professional samples. This is a five stage process. The stages in this process are business, finance, marketing, strategy, analysis.
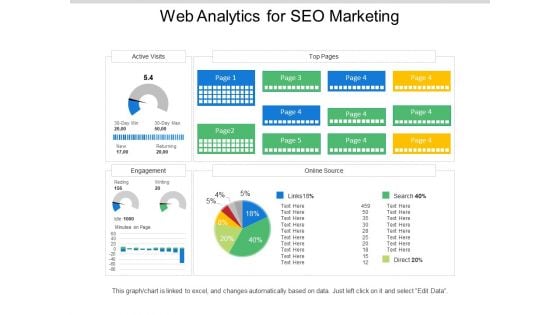
Web Analytics For Seo Marketing Ppt PowerPoint Presentation Examples
This is a web analytics for seo marketing ppt powerpoint presentation examples. This is a five stage process. The stages in this process are digital analytics, digital dashboard, marketing.
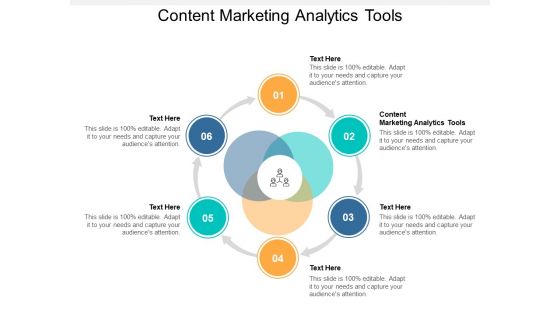
Content Marketing Analytics Tools Ppt PowerPoint Presentation Portfolio Vector Cpb
This is a content marketing analytics tools ppt powerpoint presentation portfolio vector cpb. This is a six stage process. The stages in this process are content marketing analytics tools.

System Steadiness Analytics Process Ppt PowerPoint Presentation Complete Deck With Slides
Boost your confidence and team morale with this well-structured system steadiness analytics process ppt powerpoint presentation complete deck with slides. This prefabricated set gives a voice to your presentation because of its well-researched content and graphics. Our experts have added all the components very carefully, thus helping you deliver great presentations with a single click. Not only that, it contains a set of twelve slides that are designed using the right visuals, graphics, etc. Various topics can be discussed, and effective brainstorming sessions can be conducted using the wide variety of slides added in this complete deck. Apart from this, our PPT design contains clear instructions to help you restructure your presentations and create multiple variations. The color, format, design anything can be modified as deemed fit by the user. Not only this, it is available for immediate download. So, grab it now.
Predictive Analytics Ppt PowerPoint Presentation Complete Deck With Slides
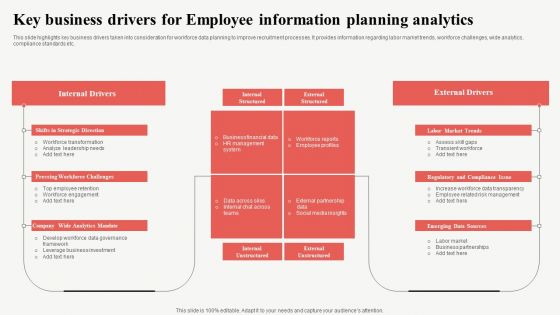
Key Business Drivers For Employee Information Planning Analytics Background PDF
This slide highlights key business drivers taken into consideration for workforce data planning to improve recruitment processes. It provides information regarding labor market trends, workforce challenges, wide analytics, compliance standards etc. Showcasing this set of slides titled Key Business Drivers For Employee Information Planning Analytics Background PDF. The topics addressed in these templates are Internal Drivers, External Drivers, Market Trends. All the content presented in this PPT design is completely editable. Download it and make adjustments in color, background, font etc. as per your unique business setting.

Predictive Analytics Market Research Ppt Powerpoint Presentation Inspiration Pictures Cpb
This is a predictive analytics market research ppt powerpoint presentation inspiration pictures cpb. This is a four stage process. The stages in this process are predictive analytics market research.
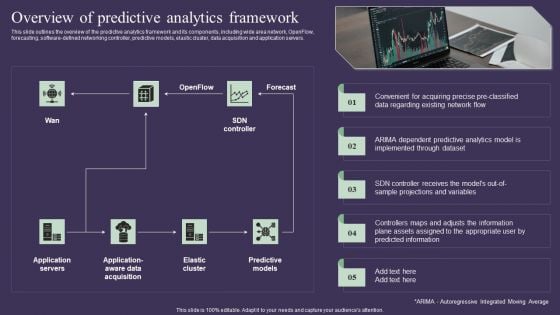
Projection Model Overview Of Predictive Analytics Framework Demonstration PDF
This slide outlines the overview of the predictive analytics framework and its components, including wide area network, OpenFlow, forecasting, software-defined networking controller, predictive models, elastic cluster, data acquisition and application servers. The best PPT templates are a great way to save time, energy, and resources. Slidegeeks have 100 percent editable powerpoint slides making them incredibly versatile. With these quality presentation templates, you can create a captivating and memorable presentation by combining visually appealing slides and effectively communicating your message. Download Projection Model Overview Of Predictive Analytics Framework Demonstration PDF from Slidegeeks and deliver a wonderful presentation.
Key Driver Analytics Template 1 Ppt PowerPoint Presentation Icon
This is a key driver analytics template 1 ppt powerpoint presentation icon. This is a four stage process. The stages in this process are business, strategy, marketing, analysis, process.

Key Driver Analytics Template 2 Ppt PowerPoint Presentation Inspiration
This is a key driver analytics template 2 ppt powerpoint presentation inspiration. This is a four stage process. The stages in this process are business, strategy, marketing, analysis, linear process.
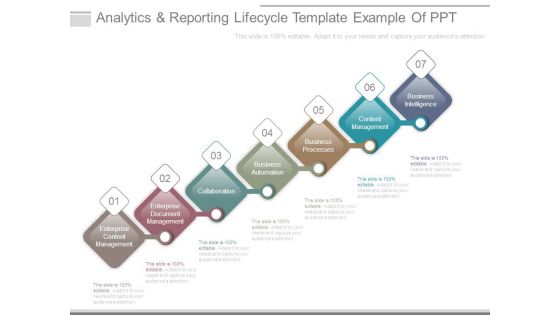
Analytics And Reporting Lifecycle Template Example Of Ppt
This is a analytics and reporting lifecycle template example of ppt. This is a seven stage process. The stages in this process are enterprise content management, enterprise document management, collaboration, business automation, business processes, content management, business intelligence.
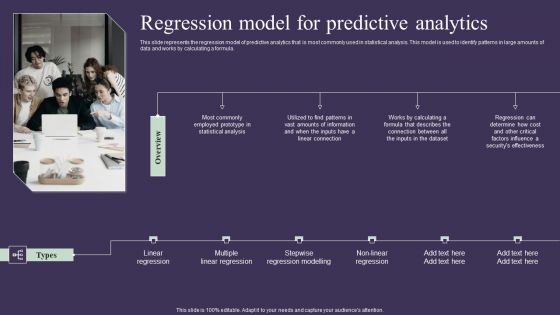
Projection Model Regression Model For Predictive Analytics Sample PDF
This slide represents the regression model of predictive analytics that is most commonly used in statistical analysis. This model is used to identify patterns in large amounts of data and works by calculating a formula. From laying roadmaps to briefing everything in detail, our templates are perfect for you. You can set the stage with your presentation slides. All you have to do is download these easy-to-edit and customizable templates. Projection Model Regression Model For Predictive Analytics Sample PDF will help you deliver an outstanding performance that everyone would remember and praise you for. Do download this presentation today.
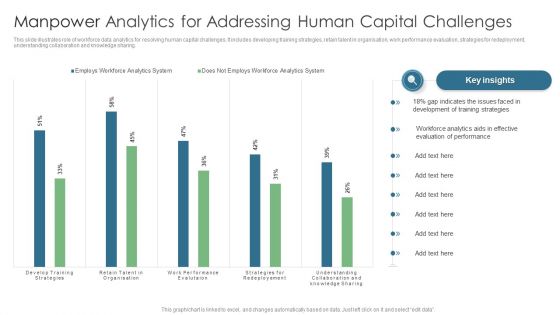
Manpower Analytics For Addressing Human Capital Challenges Diagrams PDF
This slide illustrates role of workforce data analytics for resolving human capital challenges. It includes developing training strategies, retain talent in organisation, work performance evaluation, strategies for redeployment, understanding collaboration and knowledge sharing. Showcasing this set of slides titled Manpower Analytics For Addressing Human Capital Challenges Diagrams PDF. The topics addressed in these templates are Gap Indicates, Training Strategies, Evaluation Performance. All the content presented in this PPT design is completely editable. Download it and make adjustments in color, background, font etc. as per your unique business setting.

Web Analytics Expert Template Powerpoint Slide Presentation Tips
This is a web analytics expert template powerpoint slide presentation tips. This is a five stage process. The stages in this process are define goals, collect data, content marketing, web solutions.
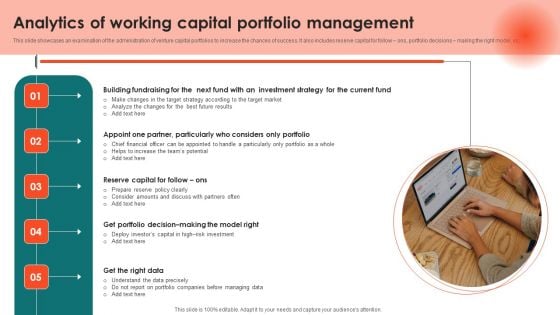
Analytics Of Working Capital Portfolio Management Rules PDF
This slide showcases an examination of the administration of venture capital portfolios to increase the chances of success. It also includes reserve capital for follow ons, portfolio decisions making the right model, etc. Presenting Analytics Of Working Capital Portfolio Management Rules PDF to dispense important information. This template comprises five stages. It also presents valuable insights into the topics including Building Fundraising, Partner, Particularly, Right Data This is a completely customizable PowerPoint theme that can be put to use immediately. So, download it and address the topic impactfully.
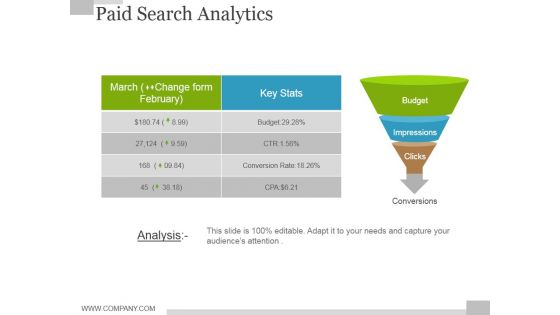
Paid Search Analytics Ppt PowerPoint Presentation Show Slide
This is a paid search analytics ppt powerpoint presentation show slide. This is a two stage process. The stages in this process are budget, impressions, clicks, key stats, funnel.
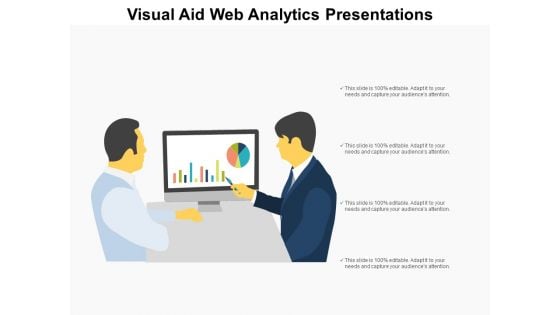
Visual Aid Web Analytics Presentations Ppt PowerPoint Presentation Infographics Elements
This is a visual aid web analytics presentations ppt powerpoint presentation infographics elements. This is a four stage process. The stages in this process are visual aids, communication, business.
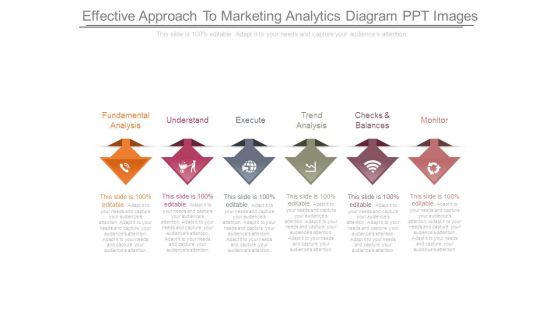
Effective Approach To Marketing Analytics Diagram Ppt Images
This is a effective approach to marketing analytics diagram ppt images. This is a six stage process. The stages in this process are fundamental analysis, understand, execute, trend analysis, checks and balances, monitor.
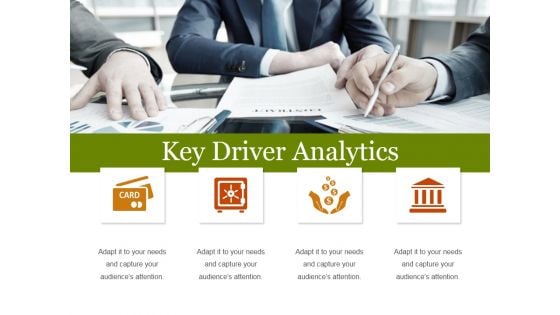
Key Driver Analytics Template 1 Ppt PowerPoint Presentation Gallery Samples
This is a key driver analytics template 1 ppt powerpoint presentation gallery samples. This is a four stage process. The stages in this process are business, icons, management, marketing, strategy, analysis.

Key Driver Analytics Template Ppt PowerPoint Presentation Examples
This is a key driver analytics template ppt powerpoint presentation examples. This is a four stage process. The stages in this process are business, strategy, marketing, analysis, success, finance.
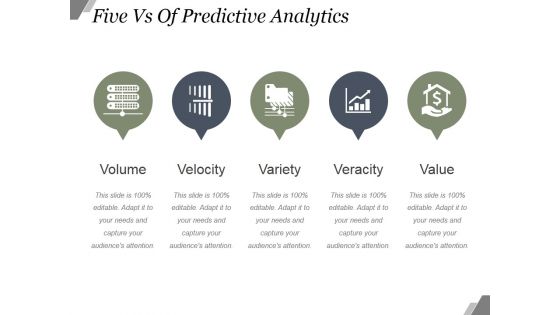
Five Vs Of Predictive Analytics Ppt PowerPoint Presentation Images
This is a five vs of predictive analytics ppt powerpoint presentation images. This is a five stage process. The stages in this process are volume, velocity, variety, veracity, value.
Key Driver Analytics Templates 2 Ppt PowerPoint Presentation Influencers
This is a key driver analytics templates 2 ppt powerpoint presentation influencers. This is a one stage process. The stages in this process are business, finance, marketing, analysis, strategy, success.
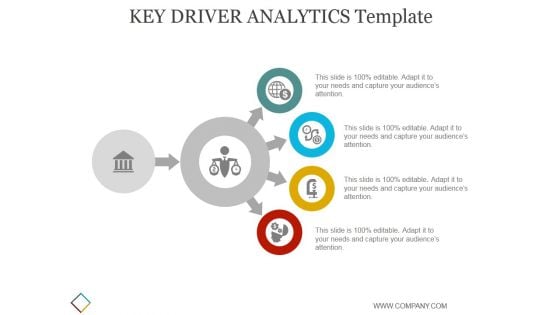
Key Driver Analytics Template 1 Ppt PowerPoint Presentation Shapes
This is a key driver analytics template 1 ppt powerpoint presentation shapes. This is a four stage process. The stages in this process are business, strategy, marketing, analysis, icons, arrow.

Key Driver Analytics Templates 1 Ppt PowerPoint Presentation Ideas
This is a key driver analytics templates 1 ppt powerpoint presentation ideas. This is a four stage process. The stages in this process are business, icons marketing, analysis, strategy, success.
Key Driver Analytics Template 2 Ppt PowerPoint Presentation Summary Inspiration
This is a key driver analytics template 2 ppt powerpoint presentation summary inspiration. This is a four stage process. The stages in this process are business, icons, analysis, strategy, marketing.
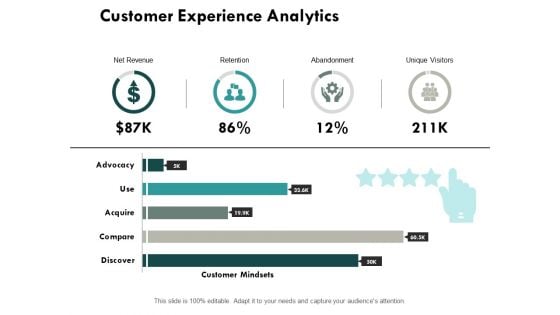
Customer Experience Analytics Ppt PowerPoint Presentation File Infographic Template
This is a customer experience analytics ppt powerpoint presentation file infographic template. This is a four stage process. The stages in this process are finance, marketing, analysis, investment, million.
Key Driver Analytics Template 2 Ppt PowerPoint Presentation Template
This is a key driver analytics template 2 ppt powerpoint presentation template. This is a four stage process. The stages in this process are business, strategy, marketing, analysis, finance, currency.
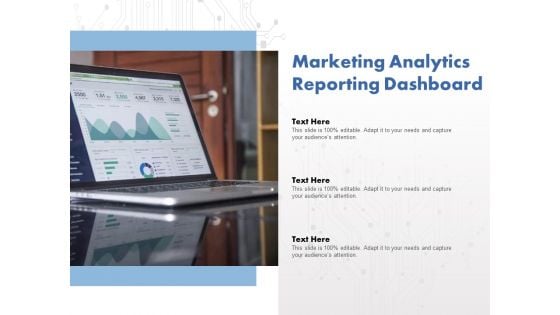
Marketing Analytics Reporting Dashboard Ppt PowerPoint Presentation Summary Slides
Presenting this set of slides with name marketing analytics reporting dashboard ppt powerpoint presentation summary slides. This is a one stage process. The stage in this process is marketing analytics reporting dashboard. This is a completely editable PowerPoint presentation and is available for immediate download. Download now and impress your audience.
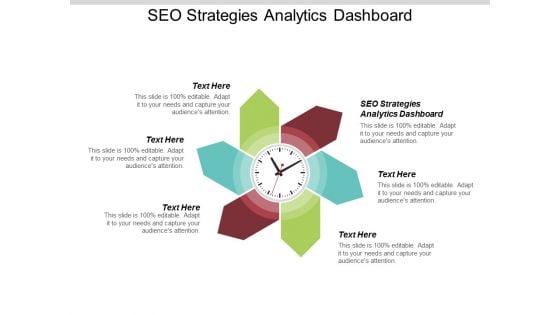
SEO Strategies Analytics Dashboard Ppt PowerPoint Presentation Styles Inspiration Cpb
Presenting this set of slides with name seo strategies analytics dashboard ppt powerpoint presentation styles inspiration cpb. This is a one stage process. The stages in this process are seo strategies analytics dashboard. This is a completely editable PowerPoint presentation and is available for immediate download. Download now and impress your audience.
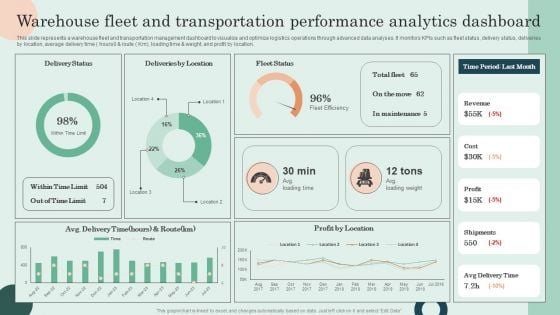
Warehouse Fleet And Transportation Performance Analytics Dashboard Pictures PDF
This slide represents a warehouse fleet and transportation management dashboard to visualize and optimize logistics operations through advanced data analyses. It monitors KPIs such as fleet status, delivery status, deliveries by location, average delivery time hours0 and route Km, loading time and weight, and profit by location. Do you have to make sure that everyone on your team knows about any specific topic I yes, then you should give Warehouse Fleet And Transportation Performance Analytics Dashboard Pictures PDF a try. Our experts have put a lot of knowledge and effort into creating this impeccable Warehouse Fleet And Transportation Performance Analytics Dashboard Pictures PDF. You can use this template for your upcoming presentations, as the slides are perfect to represent even the tiniest detail. You can download these templates from the Slidegeeks website and these are easy to edit. So grab these today
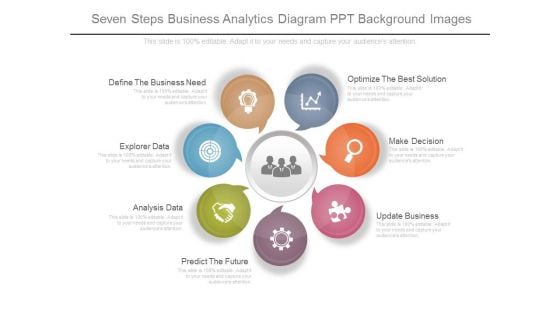
Seven Steps Business Analytics Diagram Ppt Background Images
This is a seven steps business analytics diagram ppt background images. This is a seven stage process. The stages in this process are optimize the best solution, make decision, update business, predict the future, analysis data, explorer data, define the business need.
Analytics Company Investor Funding Elevator Pitch Deck Ppt Template
Business Analytics Vector Icon Ppt PowerPoint Presentation Portfolio Slides PDF
Presenting this set of slides with name business analytics vector icon ppt powerpoint presentation portfolio slides pdf. This is a three stage process. The stages in this process are business analytics vector icon. This is a completely editable PowerPoint presentation and is available for immediate download. Download now and impress your audience.
Projection Model Uses Of Predictive Analytics Credit Icons PDF
This slide describes the usage of predictive analytics in banking and other financial institutions for credit purposes. It is used to calculate the credit score of a person or organization and to ensure that borrower does not fail to return the loan. Crafting an eye-catching presentation has never been more straightforward. Let your presentation shine with this tasteful yet straightforward Projection Model Uses Of Predictive Analytics Credit Icons PDF template. It offers a minimalistic and classy look that is great for making a statement. The colors have been employed intelligently to add a bit of playfulness while still remaining professional. Construct the ideal Projection Model Uses Of Predictive Analytics Credit Icons PDF that effortlessly grabs the attention of your audience Begin now and be certain to wow your customers
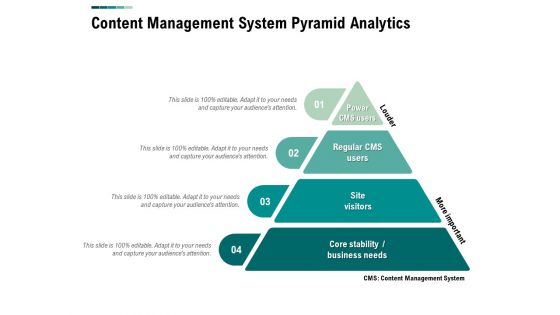
Content Management System Pyramid Analytics Ppt PowerPoint Presentation Summary Elements
Presenting this set of slides with name content management system pyramid analytics ppt powerpoint presentation summary elements. This is a four stage process. The stages in this process are power cms users, regular cms users, site visitors, core stability business needs. This is a completely editable PowerPoint presentation and is available for immediate download. Download now and impress your audience.
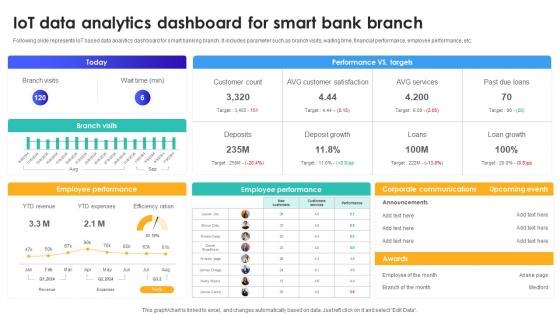
IoT Data Analytics Dashboard For Smart Bank Branch IoT In Banking For Digital Future IoT SS V
Following slide represents IoT based data analytics dashboard for smart banking branch. It includes parameter such as branch visits, waiting time, financial performance, employee performance, etc. Do you have an important presentation coming up Are you looking for something that will make your presentation stand out from the rest Look no further than IoT Data Analytics Dashboard For Smart Bank Branch IoT In Banking For Digital Future IoT SS V. With our professional designs, you can trust that your presentation will pop and make delivering it a smooth process. And with Slidegeeks, you can trust that your presentation will be unique and memorable. So why wait Grab IoT Data Analytics Dashboard For Smart Bank Branch IoT In Banking For Digital Future IoT SS V today and make your presentation stand out from the rest Following slide represents IoT based data analytics dashboard for smart banking branch. It includes parameter such as branch visits, waiting time, financial performance, employee performance, etc.
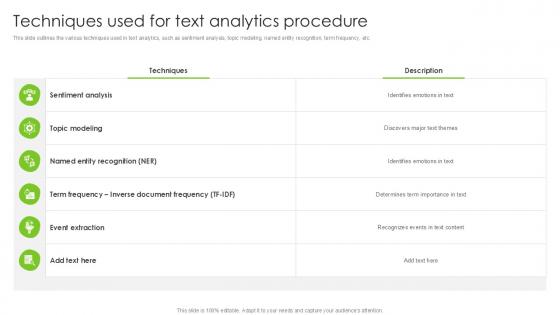
Techniques Used For Text Analytics Procedure PPT Presentation SS
This slide outlines the various techniques used in text analytics, such as sentiment analysis, topic modeling, named entity recognition, term frequency, etc. The Techniques Used For Text Analytics Procedure PPT Presentation SS is a compilation of the most recent design trends as a series of slides. It is suitable for any subject or industry presentation, containing attractive visuals and photo spots for businesses to clearly express their messages. This template contains a variety of slides for the user to input data, such as structures to contrast two elements, bullet points, and slides for written information. Slidegeeks is prepared to create an impression. This slide outlines the various techniques used in text analytics, such as sentiment analysis, topic modeling, named entity recognition, term frequency, etc.
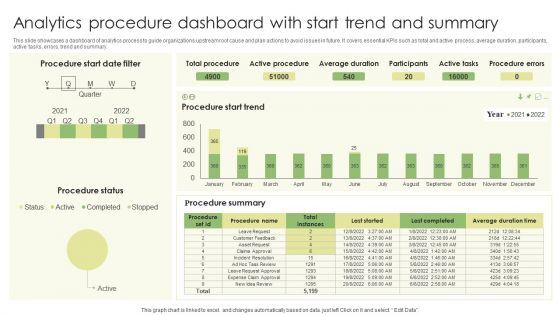
Analytics Procedure Dashboard With Start Trend And Summary Infographics PDF
This slide showcases a dashboard of analytics process to guide organizations upstream root cause and plan actions to avoid issues in future. It covers essential KPIs such as total and active process, average duration, participants, active tasks, errors, trend and summary. Showcasing this set of slides titled Analytics Procedure Dashboard With Start Trend And Summary Infographics PDF. The topics addressed in these templates are Procedure Status, Average Duration, Active Tasks. All the content presented in this PPT design is completely editable. Download it and make adjustments in color, background, font etc. as per your unique business setting.
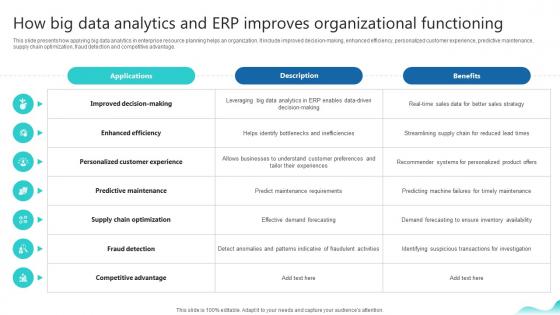
How Big Data Analytics And Erp Improves Organizational Erp And Digital Transformation For Maximizing DT SS V
This slide presents how applying big data analytics in enterprise resource planning helps an organization. It include improved decision-making, enhanced efficiency, personalized customer experience, predictive maintenance, supply chain optimization, fraud detection and competitive advantage.Slidegeeks is one of the best resources for PowerPoint templates. You can download easily and regulate How Big Data Analytics And Erp Improves Organizational Erp And Digital Transformation For Maximizing DT SS V for your personal presentations from our wonderful collection. A few clicks is all it takes to discover and get the most relevant and appropriate templates. Use our Templates to add a unique zing and appeal to your presentation and meetings. All the slides are easy to edit and you can use them even for advertisement purposes. This slide presents how applying big data analytics in enterprise resource planning helps an organization. It include improved decision-making, enhanced efficiency, personalized customer experience, predictive maintenance, supply chain optimization, fraud detection and competitive advantage.
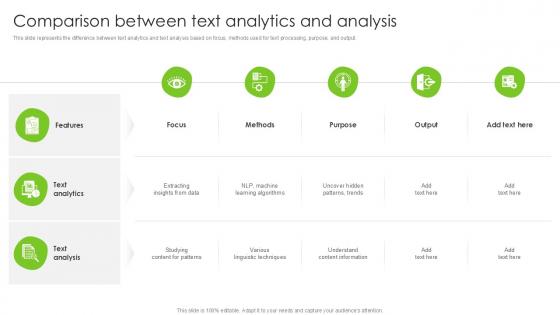
Comparison Between Text Analytics And Analysis PPT Presentation SS
This slide represents the difference between text analytics and text analysis based on focus, methods used for text processing, purpose, and output. Make sure to capture your audiences attention in your business displays with our gratis customizable Comparison Between Text Analytics And Analysis PPT Presentation SS. These are great for business strategies, office conferences, capital raising or task suggestions. If you desire to acquire more customers for your tech business and ensure they stay satisfied, create your own sales presentation with these plain slides. This slide represents the difference between text analytics and text analysis based on focus, methods used for text processing, purpose, and output.

Timeline For Effective Text Analytics Integration PPT Presentation SS
This slide outlines the timeline for integrating text analytics into business, covering project kickoff and planning, infrastructure setup, skill assessment and training, etc. Presenting this PowerPoint presentation, titled Timeline For Effective Text Analytics Integration PPT Presentation SS, with topics curated by our researchers after extensive research. This editable presentation is available for immediate download and provides attractive features when used. Download now and captivate your audience. Presenting this Timeline For Effective Text Analytics Integration PPT Presentation SS. Our researchers have carefully researched and created these slides with all aspects taken into consideration. This is a completely customizable Timeline For Effective Text Analytics Integration PPT Presentation SS that is available for immediate downloading. Download now and make an impact on your audience. Highlight the attractive features available with our PPTs. This slide outlines the timeline for integrating text analytics into business, covering project kickoff and planning, infrastructure setup, skill assessment and training, etc.
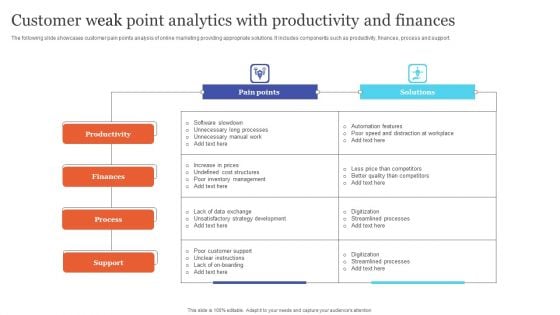
Customer Weak Point Analytics With Productivity And Finances Demonstration PDF
The following slide showcases customer pain points analysis of online marketing providing appropriate solutions. It includes components such as productivity, finances, process and support. Pitch your topic with ease and precision using this Customer Weak Point Analytics With Productivity And Finances Demonstration PDF. This layout presents information on Productivity, Finances, Process. It is also available for immediate download and adjustment. So, changes can be made in the color, design, graphics or any other component to create a unique layout.
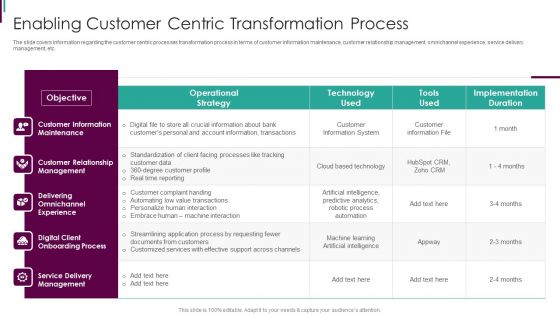
Developing Business Analytics Framework Enabling Customer Centric Transformation Brochure PDF
The slide covers information regarding the customer centric processes transformation process in terms of customer information maintenance, customer relationship management, omnichannel experience, service delivery management, etc. Deliver and pitch your topic in the best possible manner with this Developing Business Analytics Framework Enabling Customer Centric Transformation Brochure PDF Use them to share invaluable insights on Customer Information, Customer Relationship, Operational Strategy and impress your audience. This template can be altered and modified as per your expectations. So, grab it now.
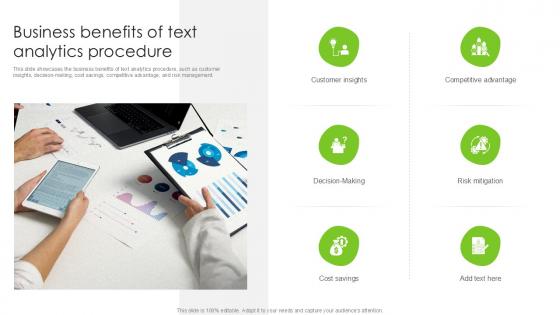
Business Benefits Of Text Analytics Procedure PPT Presentation SS
This slide showcases the business benefits of text analytics procedure, such as customer insights, decision-making, cost savings, competitive advantage, and risk management. If you are looking for a format to display your unique thoughts, then the professionally designed Business Benefits Of Text Analytics Procedure PPT Presentation SS is the one for you. You can use it as a Google Slides template or a PowerPoint template. Incorporate impressive visuals, symbols, images, and other charts. Modify or reorganize the text boxes as you desire. Experiment with shade schemes and font pairings. Alter, share or cooperate with other people on your work. Download Business Benefits Of Text Analytics Procedure PPT Presentation SS and find out how to give a successful presentation. Present a perfect display to your team and make your presentation unforgettable. This slide showcases the business benefits of text analytics procedure, such as customer insights, decision-making, cost savings, competitive advantage, and risk management.

Factors Contributing To Text Analytics Necessity PPT Sample SS
This slide outlines factors contributing to the necessity of text analytics, such as unstructured data, business insights, decision-making, automation, etc. Formulating a presentation can take up a lot of effort and time, so the content and message should always be the primary focus. The visuals of the PowerPoint can enhance the presenters message, so our Factors Contributing To Text Analytics Necessity PPT Sample SS was created to help save time. Instead of worrying about the design, the presenter can concentrate on the message while our designers work on creating the ideal templates for whatever situation is needed. Slidegeeks has experts for everything from amazing designs to valuable content, we have put everything into Factors Contributing To Text Analytics Necessity PPT Sample SS This slide outlines factors contributing to the necessity of text analytics, such as unstructured data, business insights, decision-making, automation, etc.

Edge Computing Analytics Ppt Powerpoint Presentation Complete Deck With Slides
Share a great deal of information on the topic by deploying this Edge Computing Analytics Ppt Powerpoint Presentation Complete Deck With Slides Support your ideas and thought process with this prefabricated set. It includes a set of seventeen slides, all fully modifiable and editable. Each slide can be restructured and induced with the information and content of your choice. You can add or remove large content boxes as well, to make this PPT slideshow more personalized. Its high-quality graphics and visuals help in presenting a well-coordinated pitch. This PPT template is also a resourceful tool to take visual cues from and implement the best ideas to help your business grow and expand. The main attraction of this well-formulated deck is that everything is editable, giving you the freedom to adjust it to your liking and choice. Changes can be made in the background and theme as well to deliver an outstanding pitch. Therefore, click on the download button now to gain full access to this multifunctional set. Our Edge Computing Analytics Ppt Powerpoint Presentation Complete Deck With Slides are topically designed to provide an attractive backdrop to any subject. Use them to look like a presentation pro.
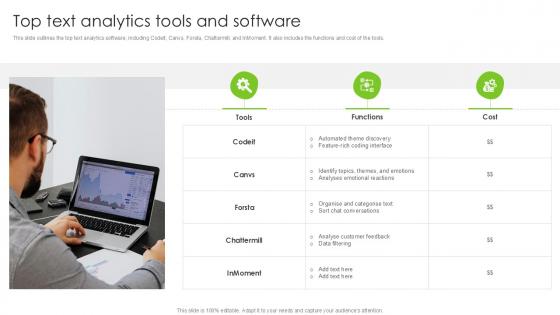
Top Text Analytics Tools And Software PPT Presentation SS
This slide outlines the top text analytics software, including Codeit, Canvs, Forsta, Chattermill, and InMoment. It also includes the functions and cost of the tools. Here you can discover an assortment of the finest PowerPoint and Google Slides templates. With these templates, you can create presentations for a variety of purposes while simultaneously providing your audience with an eye-catching visual experience. Download Top Text Analytics Tools And Software PPT Presentation SS to deliver an impeccable presentation. These templates will make your job of preparing presentations much quicker, yet still, maintain a high level of quality. Slidegeeks has experienced researchers who prepare these templates and write high-quality content for you. Later on, you can personalize the content by editing the Top Text Analytics Tools And Software PPT Presentation SS. This slide outlines the top text analytics software, including Codeit, Canvs, Forsta, Chattermill, and InMoment. It also includes the functions and cost of the tools.
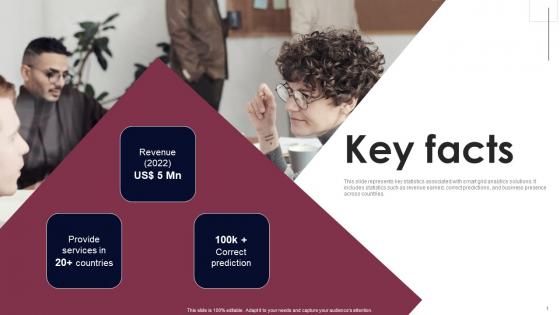
Key Facts Smart Grid Analytics Investor Fund Raising Portrait PDF
This slide represents key statistics associated with smart grid analytics solutions. It includes statistics such as revenue earned, correct predictions, and business presence across countries. Find highly impressive Key Facts Smart Grid Analytics Investor Fund Raising Portrait PDF on Slidegeeks to deliver a meaningful presentation. You can save an ample amount of time using these presentation templates. No need to worry to prepare everything from scratch because Slidegeeks experts have already done a huge research and work for you. You need to download Key Facts Smart Grid Analytics Investor Fund Raising Portrait PDF for your upcoming presentation. All the presentation templates are 100 percent editable and you can change the color and personalize the content accordingly. Download now This slide represents key statistics associated with smart grid analytics solutions. It includes statistics such as revenue earned, correct predictions, and business presence across countries.
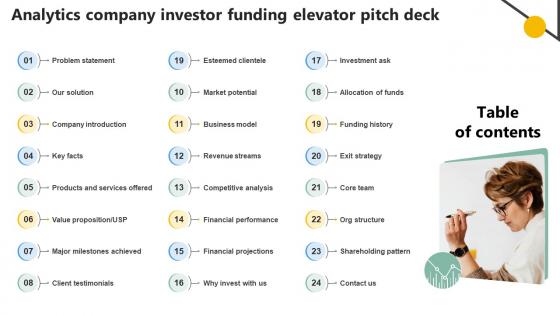
Table Of Contents Analytics Company Investor Funding Elevator Pitch Deck
The Table Of Contents Analytics Company Investor Funding Elevator Pitch Deck is a compilation of the most recent design trends as a series of slides. It is suitable for any subject or industry presentation, containing attractive visuals and photo spots for businesses to clearly express their messages. This template contains a variety of slides for the user to input data, such as structures to contrast two elements, bullet points, and slides for written information. Slidegeeks is prepared to create an impression. Our Table Of Contents Analytics Company Investor Funding Elevator Pitch Deck are topically designed to provide an attractive backdrop to any subject. Use them to look like a presentation pro.
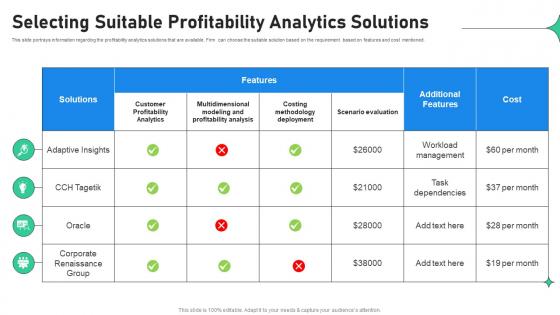
Selecting Suitable Profitability Analytics Solutions Increasing Profitability Through Better Product
This slide portrays information regarding the profitability analytics solutions that are available. Firm can choose the suitable solution based on the requirement based on features and cost mentioned. Formulating a presentation can take up a lot of effort and time, so the content and message should always be the primary focus. The visuals of the PowerPoint can enhance the presenters message, so our Selecting Suitable Profitability Analytics Solutions Increasing Profitability Through Better Product was created to help save time. Instead of worrying about the design, the presenter can concentrate on the message while our designers work on creating the ideal templates for whatever situation is needed. Slidegeeks has experts for everything from amazing designs to valuable content, we have put everything into Selecting Suitable Profitability Analytics Solutions Increasing Profitability Through Better Product This slide portrays information regarding the profitability analytics solutions that are available. Firm can choose the suitable solution based on the requirement based on features and cost mentioned.
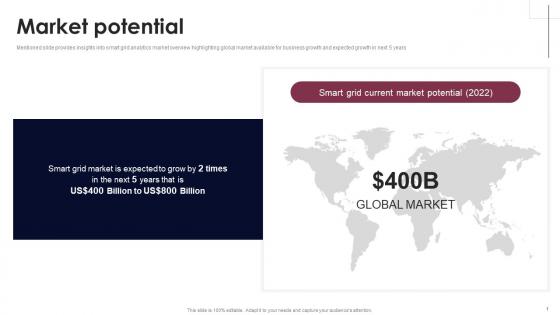
Market Potential Smart Grid Analytics Investor Fund Raising Microsoft PDF
Mentioned slide provides insights into smart grid analytics market overview highlighting global market available for business growth and expected growth in next 5 years. If you are looking for a format to display your unique thoughts, then the professionally designed Market Potential Smart Grid Analytics Investor Fund Raising Microsoft PDF is the one for you. You can use it as a Google Slides template or a PowerPoint template. Incorporate impressive visuals, symbols, images, and other charts. Modify or reorganize the text boxes as you desire. Experiment with shade schemes and font pairings. Alter, share or cooperate with other people on your work. Download Market Potential Smart Grid Analytics Investor Fund Raising Microsoft PDF and find out how to give a successful presentation. Present a perfect display to your team and make your presentation unforgettable. Mentioned slide provides insights into smart grid analytics market overview highlighting global market available for business growth and expected growth in next 5 years.

Text Analytics Integration Best Practices PPT Slide SS
This slide describes the guidelines for integrating text analytics with existing systems, covering defining goals and scope, preprocessing the text, and so on. This Text Analytics Integration Best Practices PPT Slide SS from Slidegeeks makes it easy to present information on your topic with precision. It provides customization options, so you can make changes to the colors, design, graphics, or any other component to create a unique layout. It is also available for immediate download, so you can begin using it right away. Slidegeeks has done good research to ensure that you have everything you need to make your presentation stand out. Make a name out there for a brilliant performance. This slide describes the guidelines for integrating text analytics with existing systems, covering defining goals and scope, preprocessing the text, and so on.
Human Resource Analytics Key Performance Indicator Icon Elements Pdf
Showcasing this set of slides titled Human Resource Analytics Key Performance Indicator Icon Elements Pdf The topics addressed in these templates are Human Resource, Analytics Key Performance, Indicator Icon All the content presented in this PPT design is completely editable. Download it and make adjustments in color, background, font etc. as per your unique business setting. Our Human Resource Analytics Key Performance Indicator Icon Elements Pdf are topically designed to provide an attractive backdrop to any subject. Use them to look like a presentation pro.

Quarterly Information Technology Security Analytics Improvement Roadmap Template
Presenting our innovatively structured quarterly information technology security analytics improvement roadmap template Template. Showcase your roadmap process in different formats like PDF, PNG, and JPG by clicking the download button below. This PPT design is available in both Standard Screen and Widescreen aspect ratios. It can also be easily personalized and presented with modified font size, font type, color, and shapes to measure your progress in a clear way.

Budget For Text Analytics Integration In Business PPT Powerpoint SS
This slide outlines the budget allocation for integrating text analytics in an organization, covering expense categories, estimated and actual budget. If your project calls for a presentation, then Slidegeeks is your go-to partner because we have professionally designed, easy-to-edit templates that are perfect for any presentation. After downloading, you can easily edit Budget For Text Analytics Integration In Business PPT Powerpoint SS and make the changes accordingly. You can rearrange slides or fill them with different images. Check out all the handy templates This slide outlines the budget allocation for integrating text analytics in an organization, covering expense categories, estimated and actual budget.
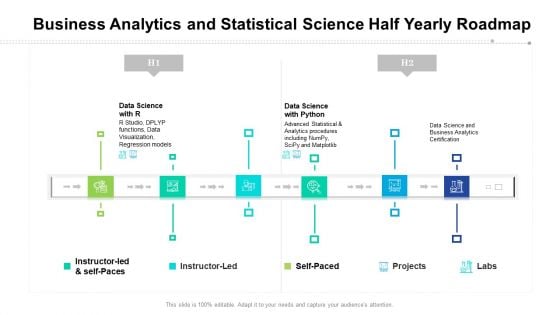
Business Analytics And Statistical Science Half Yearly Roadmap Summary
Presenting our innovatively structured business analytics and statistical science half yearly roadmap summary Template. Showcase your roadmap process in different formats like PDF, PNG, and JPG by clicking the download button below. This PPT design is available in both Standard Screen and Widescreen aspect ratios. It can also be easily personalized and presented with modified font size, font type, color, and shapes to measure your progress in a clear way.


 Continue with Email

 Home
Home


