Data Analytics Process
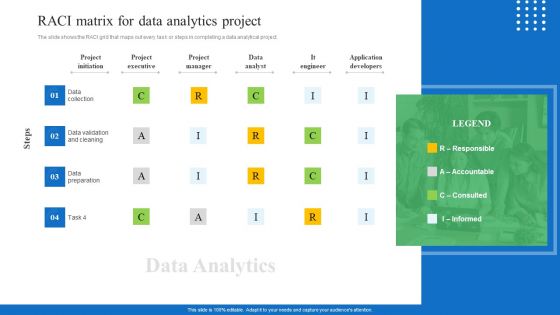
Toolkit For Data Science And Analytics Transition RACI Matrix For Data Analytics Project Designs PDF
The slide shows the RACI grid that maps out every task or steps in completing a data analytical project. Do you have an important presentation coming up Are you looking for something that will make your presentation stand out from the rest Look no further than Toolkit For Data Science And Analytics Transition RACI Matrix For Data Analytics Project Designs PDF. With our professional designs, you can trust that your presentation will pop and make delivering it a smooth process. And with Slidegeeks, you can trust that your presentation will be unique and memorable. So why wait Grab Toolkit For Data Science And Analytics Transition RACI Matrix For Data Analytics Project Designs PDF today and make your presentation stand out from the rest.
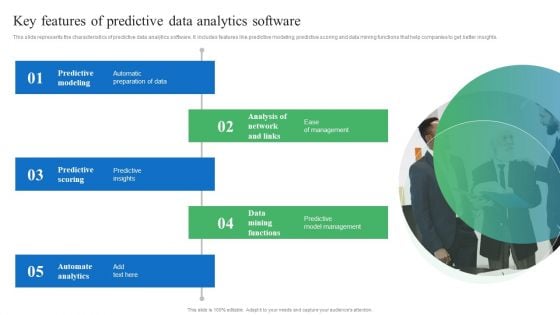
Toolkit For Data Science And Analytics Transition Key Features Of Predictive Data Analytics Software Ideas PDF
This slide represents the characteristics of predictive data analytics software. It includes features like predictive modeling, predictive scoring and data mining functions that help companies to get better insights. If your project calls for a presentation, then Slidegeeks is your go to partner because we have professionally designed, easy to edit templates that are perfect for any presentation. After downloading, you can easily edit Toolkit For Data Science And Analytics Transition Key Features Of Predictive Data Analytics Software Ideas PDF and make the changes accordingly. You can rearrange slides or fill them with different images. Check out all the handy templates.

Toolkit For Data Science And Analytics Transition Work Streams Organizational Structure For Data Analytics Rules PDF
This slide shows the organization structure model including the analytics leadership, analytical tool for to obtain the business results. Slidegeeks has constructed Toolkit For Data Science And Analytics Transition Work Streams Organizational Structure For Data Analytics Rules PDF after conducting extensive research and examination. These presentation templates are constantly being generated and modified based on user preferences and critiques from editors. Here, you will find the most attractive templates for a range of purposes while taking into account ratings and remarks from users regarding the content. This is an excellent jumping off point to explore our content and will give new users an insight into our top notch PowerPoint Templates.
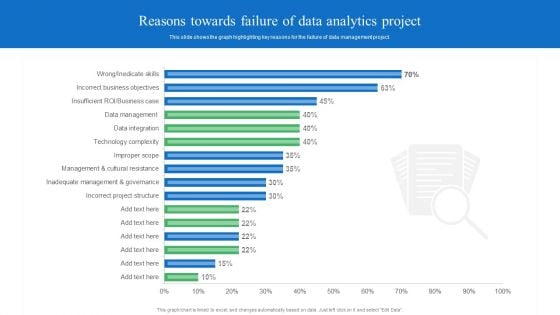
Toolkit For Data Science And Analytics Transition Reasons Towards Failure Of Data Analytics Project Background PDF
This slide shows the graph highlighting key reasons for the failure of data management project. If you are looking for a format to display your unique thoughts, then the professionally designed Toolkit For Data Science And Analytics Transition Reasons Towards Failure Of Data Analytics Project Background PDF is the one for you. You can use it as a Google Slides template or a PowerPoint template. Incorporate impressive visuals, symbols, images, and other charts. Modify or reorganize the text boxes as you desire. Experiment with shade schemes and font pairings. Alter, share or cooperate with other people on your work. Download Toolkit For Data Science And Analytics Transition Reasons Towards Failure Of Data Analytics Project Background PDF and find out how to give a successful presentation. Present a perfect display to your team and make your presentation unforgettable.
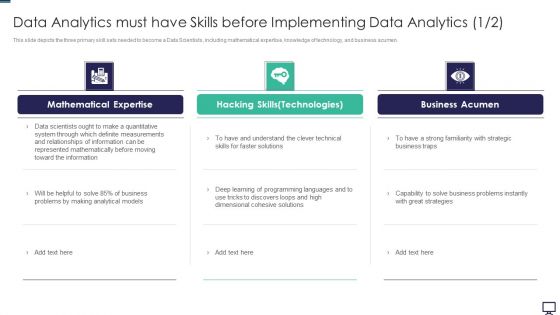
Data Analytics Must Have Skills Before Implementing Data Analytics Ppt Ideas PDF
This slide depicts the three primary skill sets needed to become a Data Scientists, including mathematical expertise, knowledge of technology, and business acumen. Deliver an awe inspiring pitch with this creative data analytics must have skills before implementing data analytics ppt ideas pdf bundle. Topics like business, system, measurements, information can be discussed with this completely editable template. It is available for immediate download depending on the needs and requirements of the user.
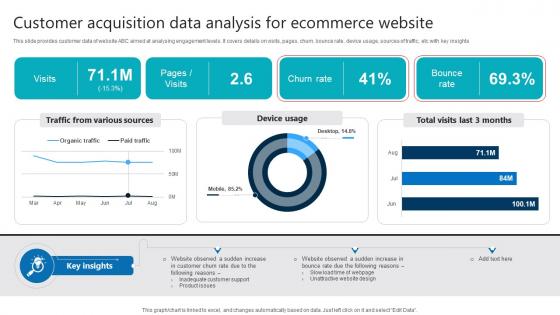
Customer Acquisition Data Analysis For Ecommerce Website Product Analytics Implementation Data Analytics V
This slide provides customer data of website ABC aimed at analysing engagement levels. It covers details on visits, pages, churn, bounce rate, device usage, sources of traffic, etc with key insights If you are looking for a format to display your unique thoughts, then the professionally designed Customer Acquisition Data Analysis For Ecommerce Website Product Analytics Implementation Data Analytics V is the one for you. You can use it as a Google Slides template or a PowerPoint template. Incorporate impressive visuals, symbols, images, and other charts. Modify or reorganize the text boxes as you desire. Experiment with shade schemes and font pairings. Alter, share or cooperate with other people on your work. Download Customer Acquisition Data Analysis For Ecommerce Website Product Analytics Implementation Data Analytics V and find out how to give a successful presentation. Present a perfect display to your team and make your presentation unforgettable. This slide provides customer data of website ABC aimed at analysing engagement levels. It covers details on visits, pages, churn, bounce rate, device usage, sources of traffic, etc with key insights

Toolkit For Data Science And Analytics Transition Key Features To Implement Data Analytics Software Elements PDF
This slide shows broad range of data analytics features that help businesses to draw data driven decision. It includes features such as collaboration, data cleaning, Data governance and many more. Are you in need of a template that can accommodate all of your creative concepts This one is crafted professionally and can be altered to fit any style. Use it with Google Slides or PowerPoint. Include striking photographs, symbols, depictions, and other visuals. Fill, move around, or remove text boxes as desired. Test out color palettes and font mixtures. Edit and save your work, or work with colleagues. Download Toolkit For Data Science And Analytics Transition Key Features To Implement Data Analytics Software Elements PDF and observe how to make your presentation outstanding. Give an impeccable presentation to your group and make your presentation unforgettable.
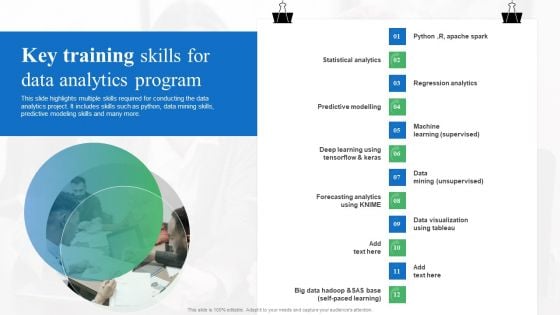
Toolkit For Data Science And Analytics Transition Key Training Skills For Data Analytics Program Template PDF
This slide highlights multiple skills required for conducting the data analytics project. It includes skills such as python, data mining skills, predictive modeling skills and many more. Coming up with a presentation necessitates that the majority of the effort goes into the content and the message you intend to convey. The visuals of a PowerPoint presentation can only be effective if it supplements and supports the story that is being told. Keeping this in mind our experts created Toolkit For Data Science And Analytics Transition Key Training Skills For Data Analytics Program Template PDF to reduce the time that goes into designing the presentation. This way, you can concentrate on the message while our designers take care of providing you with the right template for the situation.
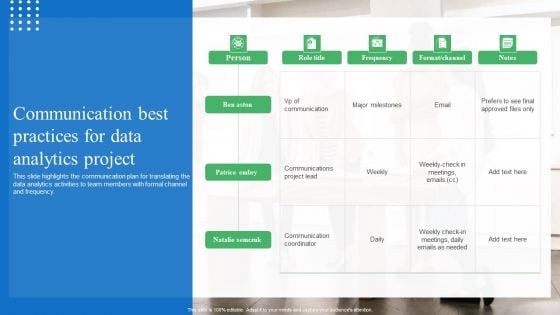
Toolkit For Data Science And Analytics Transition Communication Best Practices For Data Analytics Project Summary PDF
This slide highlights the communication plan for translating the data analytics activities to team members with formal channel and frequency. Do you know about Slidesgeeks Toolkit For Data Science And Analytics Transition Communication Best Practices For Data Analytics Project Summary PDF These are perfect for delivering any kind od presentation. Using it, create PowerPoint presentations that communicate your ideas and engage audiences. Save time and effort by using our pre designed presentation templates that are perfect for a wide range of topic. Our vast selection of designs covers a range of styles, from creative to business, and are all highly customizable and easy to edit. Download as a PowerPoint template or use them as Google Slides themes.
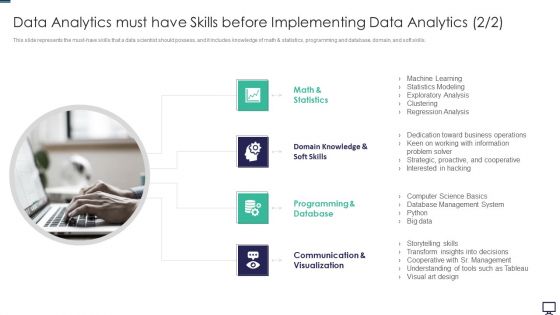
Data Analytics Must Have Skills Before Implementing Data Analytics Database Ppt Layouts Clipart Images PDF
This slide represents the must have skills that a data scientist should possess, and it includes knowledge of math and statistics, programming and database, domain, and soft skills. This is a data analytics must have skills before implementing data analytics database ppt layouts clipart images pdf template with various stages. Focus and dispense information on four stages using this creative set, that comes with editable features. It contains large content boxes to add your information on topics like database, communication, management, design, information. You can also showcase facts, figures, and other relevant content using this PPT layout. Grab it now.
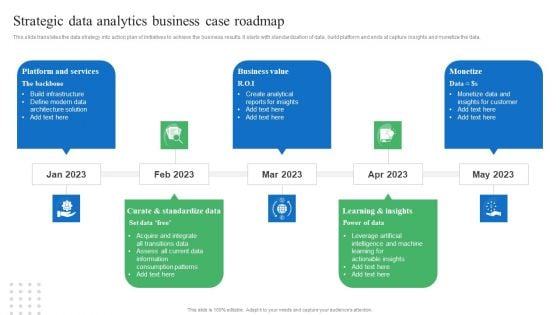
Toolkit For Data Science And Analytics Transition Strategic Data Analytics Business Case Roadmap Themes PDF
This slide translates the data strategy into action plan of initiatives to achieve the business results. It starts with standardization of data, build platform and ends at capture insights and monetize the data. Are you in need of a template that can accommodate all of your creative concepts This one is crafted professionally and can be altered to fit any style. Use it with Google Slides or PowerPoint. Include striking photographs, symbols, depictions, and other visuals. Fill, move around, or remove text boxes as desired. Test out color palettes and font mixtures. Edit and save your work, or work with colleagues. Download Toolkit For Data Science And Analytics Transition Strategic Data Analytics Business Case Roadmap Themes PDF and observe how to make your presentation outstanding. Give an impeccable presentation to your group and make your presentation unforgettable.
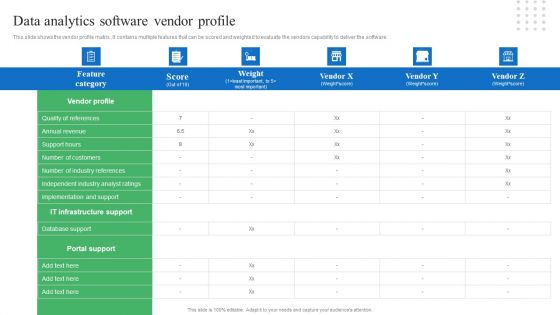
Toolkit For Data Science And Analytics Transition Data Analytics Software Vendor Profile Themes PDF
This slide shows the vendor profile matrix. It contains multiple features that can be scored and weighted to evaluate the vendors capability to deliver the software. Slidegeeks is here to make your presentations a breeze with Toolkit For Data Science And Analytics Transition Data Analytics Software Vendor Profile Themes PDF With our easy to use and customizable templates, you can focus on delivering your ideas rather than worrying about formatting. With a variety of designs to choose from, you are sure to find one that suits your needs. And with animations and unique photos, illustrations, and fonts, you can make your presentation pop. So whether you are giving a sales pitch or presenting to the board, make sure to check out Slidegeeks first.
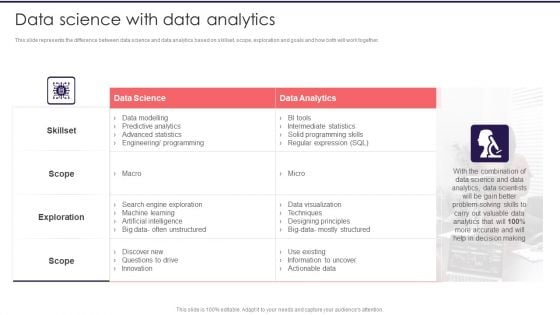
Information Studies Data Science With Data Analytics Background PDF
This slide represents the difference between data science and data analytics based on skillset, scope, exploration and goals and how both will work together. Deliver an awe inspiring pitch with this creative Information Studies Data Science With Data Analytics Background PDF bundle. Topics like Data Science, Data Analytics, Data Visualization can be discussed with this completely editable template. It is available for immediate download depending on the needs and requirements of the user.

Data Science With Data Analytics Ppt Outline Design Templates PDF
Deliver and pitch your topic in the best possible manner with this data science with data analytics ppt outline design templates pdf. Use them to share invaluable insights on data science, data analytics and impress your audience. This template can be altered and modified as per your expectations. So, grab it now.
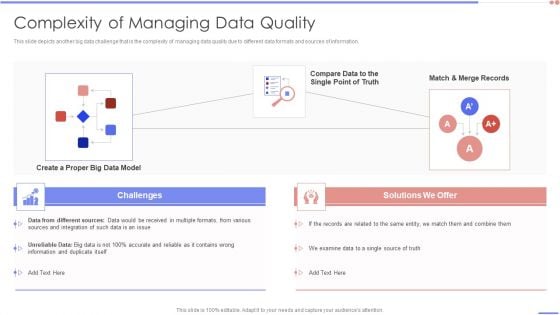
Data Analytics Management Complexity Of Managing Data Quality Summary PDF
This slide depicts another big data challenge that is the complexity of managing data quality due to different data formats and sources of information.Deliver an awe inspiring pitch with this creative Data Analytics Management Complexity Of Managing Data Quality Summary PDF bundle. Topics like Received In Multiple, Accurate Reliable, Information Duplicate can be discussed with this completely editable template. It is available for immediate download depending on the needs and requirements of the user.
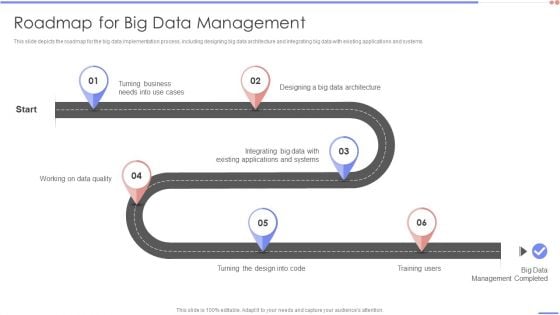
Data Analytics Management Roadmap For Big Data Management Portrait PDF
This slide depicts the roadmap for the big data implementation process, including designing big data architecture and integrating big data with existing applications and systems.This is a Data Analytics Management Roadmap For Big Data Management Portrait PDF template with various stages. Focus and dispense information on six stages using this creative set, that comes with editable features. It contains large content boxes to add your information on topics like Turning Business, Data Architecture, Existing Applications. You can also showcase facts, figures, and other relevant content using this PPT layout. Grab it now.
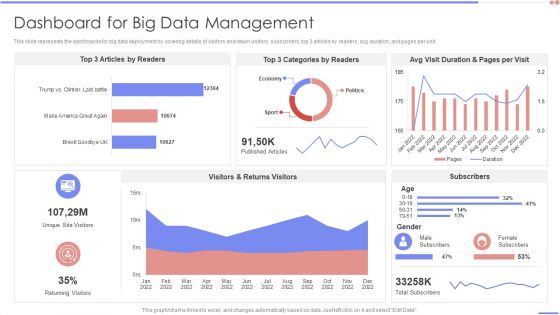
Data Analytics Management Dashboard For Big Data Management Background PDF
This slide represents the dashboards for big data deployment by covering details of visitors and return visitors, subscribers, top 3 articles by readers, avg duration, and pages per visit. Deliver and pitch your topic in the best possible manner with this Data Analytics Management Dashboard For Big Data Management Background PDF. Use them to share invaluable insights on Article Readers, Categories Readers, Duration Pages and impress your audience. This template can be altered and modified as per your expectations. So, grab it now.
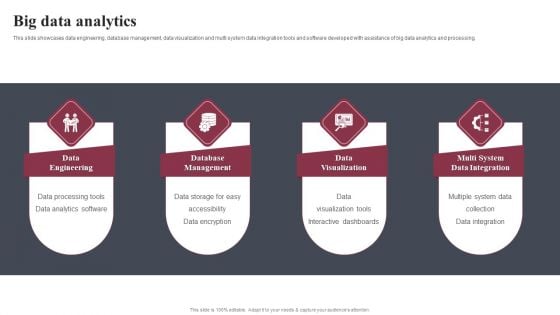
Business Software Development Company Profile Big Data Analytics Professional PDF
This slide showcases data engineering, database management, data visualization and multi system data integration tools and software developed with assistance of big data analytics and processing. Presenting Business Software Development Company Profile Big Data Analytics Professional PDF to provide visual cues and insights. Share and navigate important information on four stages that need your due attention. This template can be used to pitch topics like Data Engineering, Database Management, Data Visualization. In addtion, this PPT design contains high resolution images, graphics, etc, that are easily editable and available for immediate download.
Big Data Analytics Marketing Ppt PowerPoint Presentation File Templates Cpb
This is a big data analytics marketing ppt powerpoint presentation file templates cpb. This is a four stage process. The stages in this process are big data analytics marketing.

Digital Products Company Outline Big Data Analytics Formats PDF
This slide showcases data engineering, database management, data visualization and multi system data integration tools and software developed with assistance of big data analytics and processing. Create an editable Digital Products Company Outline Big Data Analytics Formats PDF that communicates your idea and engages your audience. Whether you are presenting a business or an educational presentation, pre designed presentation templates help save time. Digital Products Company Outline Big Data Analytics Formats PDF is highly customizable and very easy to edit, covering many different styles from creative to business presentations. Slidegeeks has creative team members who have crafted amazing templates. So, go and get them without any delay.
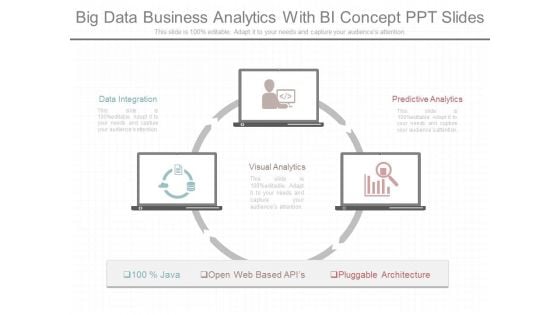
Big Data Business Analytics With Bi Concept Ppt Slides
This is a big data business analytics with bi concept ppt slides. This is a three stage process. The stages in this process are data integration, visual analytics, predictive analytics, open web based apis, pluggable architecture, java.
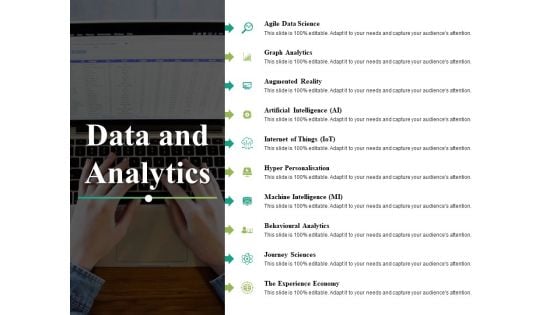
Data And Analytics Ppt PowerPoint Presentation Styles Outline
This is a data and analytics ppt powerpoint presentation styles outline. This is a ten stage process. The stages in this process are agile data science, graph analytics, journey sciences.
Data Analytics Strategy Ppt PowerPoint Presentation Visual Aids Layouts Cpb
Presenting this set of slides with name data analytics strategy ppt powerpoint presentation visual aids layouts cpb. This is a six stage process. The stages in this process are data analytics strategy. This is a completely editable PowerPoint presentation and is available for immediate download. Download now and impress your audience.
Data Analytics Tools Ppt PowerPoint Presentation Professional Structure Cpb
Presenting this set of slides with name data analytics tools ppt powerpoint presentation professional structure cpb. This is a five stage process. The stages in this process are data analytics tools. This is a completely editable PowerPoint presentation and is available for immediate download. Download now and impress your audience.
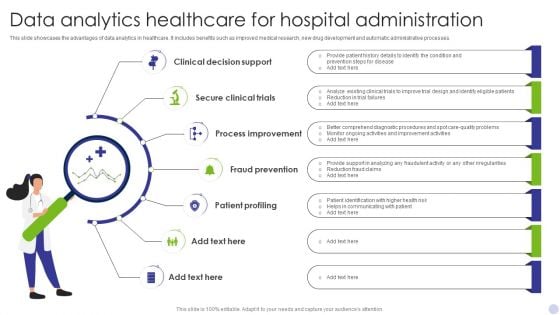
Data Analytics Healthcare For Hospital Administration Clipart PDF
This slide showcases the advantages of data analytics in healthcare. It includes benefits such as improved medical research, new drug development and automatic administrative processes. Presenting Data Analytics Healthcare For Hospital Administration Clipart PDF to dispense important information. This template comprises Seven stages. It also presents valuable insights into the topics including Clinical Decision Support, Secure Clinical Trials, Process Improvement. This is a completely customizable PowerPoint theme that can be put to use immediately. So, download it and address the topic impactfully.
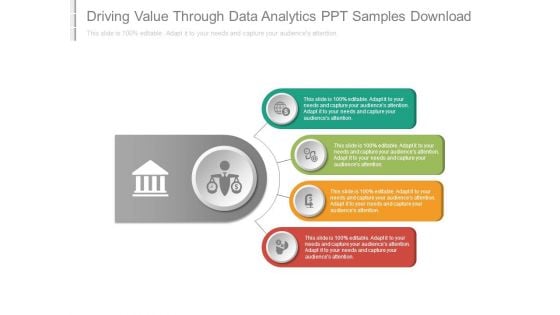
Driving Value Through Data Analytics Ppt Samples Download
This is a driving value through data analytics ppt samples download. This is a four stage process. The stages in this process are icons, business, strategy, management, process, marketing.
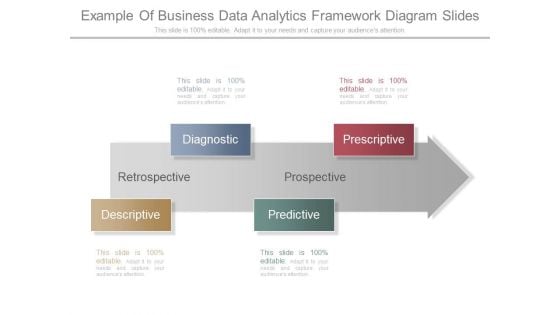
Example Of Business Data Analytics Framework Diagram Slides
This is a example of business data analytics framework diagram slides. This is a four stage process. The stages in this process are diagnostic, descriptive, predictive, prescriptive, retrospective, prospective.
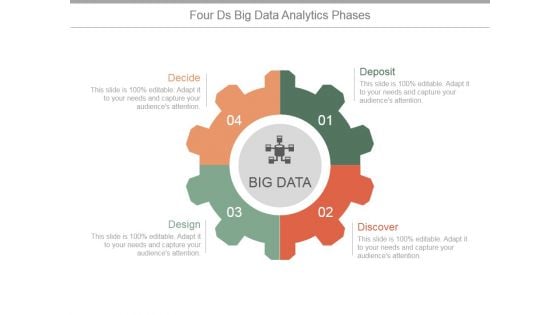
Four Ds Big Data Analytics Phases Ppt PowerPoint Presentation Shapes
This is a four ds big data analytics phases ppt powerpoint presentation shapes. This is a four stage process. The stages in this process are deposit, discover, design, decide.
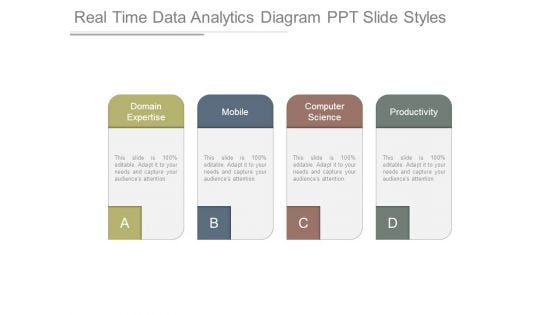
Real Time Data Analytics Diagram Ppt Slide Styles
This is a real time data analytics diagram ppt slide styles. This is a four stage process. The stages in this process are domain expertise, mobile, computer science, productivity.
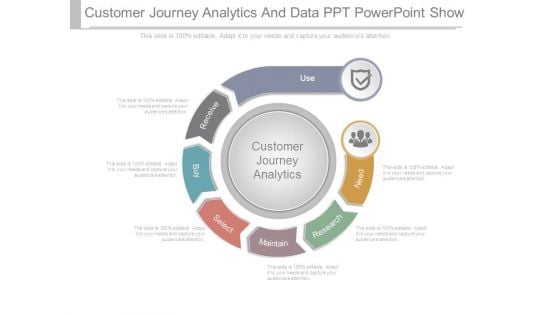
Customer Journey Analytics And Data Ppt Powerpoint Show
This is a customer journey analytics and data ppt powerpoint show. This is a seven stage process. The stages in this process are use, receive, buy, select, maintain, research, need, customer journey analytics.
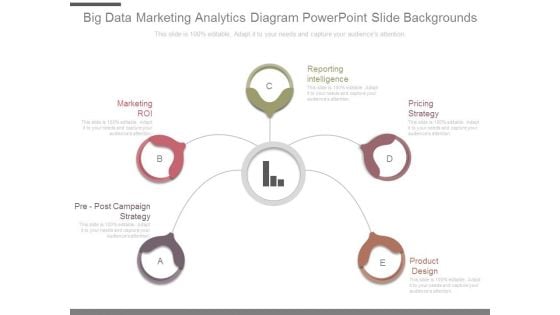
Big Data Marketing Analytics Diagram Powerpoint Slide Backgrounds
This is a big data marketing analytics diagram powerpoint slide backgrounds. This is a five stage process. The stages in this process are marketing roi, reporting intelligence, pricing strategy, product design, pre post campaign strategy.
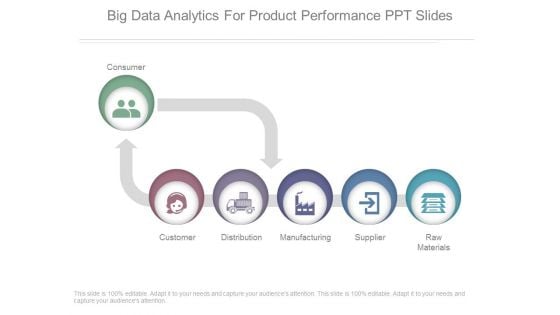
Big Data Analytics For Product Performance Ppt Slides
This is a big data analytics for product performance ppt slides. This is a five stage process. The stages in this process are consumer, customer, distribution, manufacturing, supplier, raw materials.
Big Data Marketing Analytics Ppt Powerpoint Presentation Ideas Templates Cpb
Presenting this set of slides with name big data marketing analytics ppt powerpoint presentation ideas templates cpb. This is a four stage process. The stages in this process are big data marketing analytics. This is a completely editable PowerPoint presentation and is available for immediate download. Download now and impress your audience.
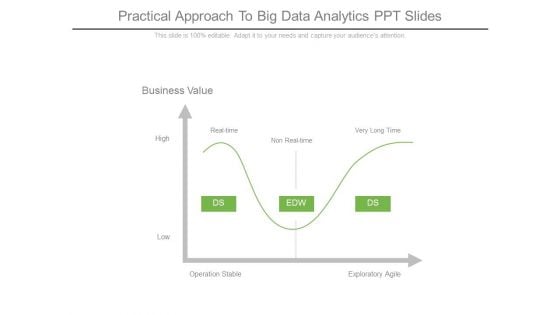
Practical Approach To Big Data Analytics Ppt Slides
This is a practical approach to big data analytics ppt slides. This is a three stage process. The stages in this process are business value, operation stable, exploratory agile, high, low, real time, non real time, very long time, ds, edw, ds.
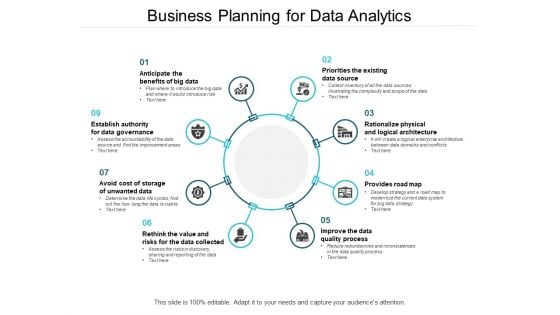
Business Planning For Data Analytics Ppt PowerPoint Presentation Samples
Presenting this set of slides with name business planning for data analytics ppt powerpoint presentation samples. This is a eight stage process. The stages in this process are big data strategy, data governance strategy, big data technology. This is a completely editable PowerPoint presentation and is available for immediate download. Download now and impress your audience.
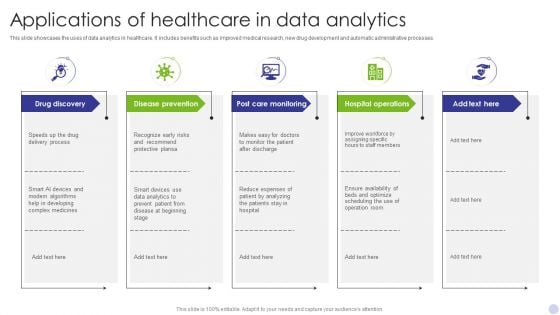
Applications Of Healthcare In Data Analytics Information PDF
This slide showcases the uses of data analytics in healthcare. It includes benefits such as improved medical research, new drug development and automatic administrative processes. Presenting Applications Of Healthcare In Data Analytics Information PDF to dispense important information. This template comprises Five stages. It also presents valuable insights into the topics including Drug Discovery, Disease Prevention, Post Care Monitoring. This is a completely customizable PowerPoint theme that can be put to use immediately. So, download it and address the topic impactfully.
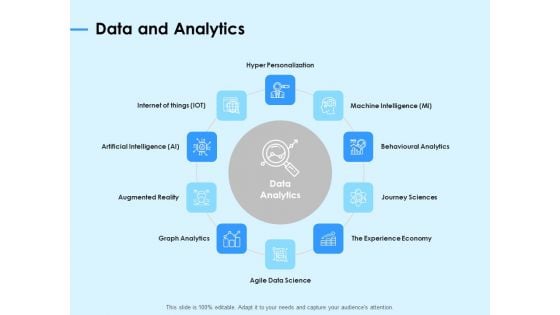
Digital Transformation Strategies Data And Analytics Ppt Professional Slideshow PDF
Presenting this set of slides with name digital transformation strategies data and analytics ppt professional slideshow pdf. This is a ten stage process. The stages in this process are hyper personalization, machine intelligence, behavioural analytics, journey sciences, the experience economy, graph analytics, augmented reality, agile data science. This is a completely editable PowerPoint presentation and is available for immediate download. Download now and impress your audience.
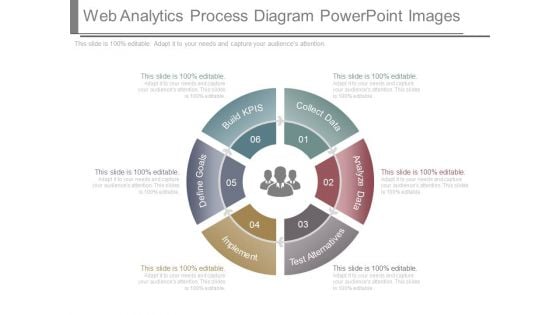
Web Analytics Process Diagram Powerpoint Images
This is a web analytics process diagram powerpoint images. This is a six stage process. The stages in this process are build kpis, define goals, implement, test alternatives, analyze data, collect data.
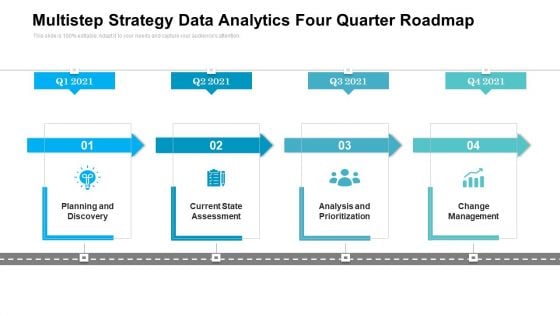
Multistep Strategy Data Analytics Four Quarter Roadmap Guidelines
Presenting our innovatively structured multistep strategy data analytics four quarter roadmap guidelines Template. Showcase your roadmap process in different formats like PDF, PNG, and JPG by clicking the download button below. This PPT design is available in both Standard Screen and Widescreen aspect ratios. It can also be easily personalized and presented with modified font size, font type, color, and shapes to measure your progress in a clear way.
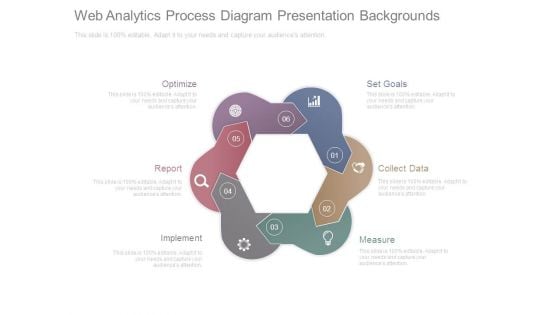
Web Analytics Process Diagram Presentation Backgrounds
This is a web analytics process diagram presentation backgrounds. This is a six stage process. The stages in this process are optimize, report, implement, measure, collect data, set goals.
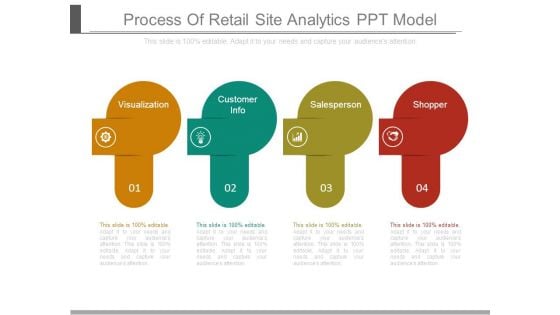
Process Of Retail Site Analytics Ppt Model
This is a process of retail site analytics ppt model. This is a four stage process. The stages in this process are visualization, customer info, salesperson, shopper.

Quarterly Data Analytics Career Roadmap For Engineering Professional Diagrams
Presenting our innovatively-structured quarterly data analytics career roadmap for engineering professional diagrams Template. Showcase your roadmap process in different formats like PDF, PNG, and JPG by clicking the download button below. This PPT design is available in both Standard Screen and Widescreen aspect ratios. It can also be easily personalized and presented with modified font size, font type, color, and shapes to measure your progress in a clear way.
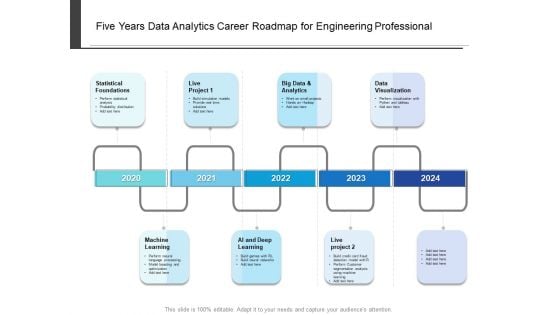
Five Years Data Analytics Career Roadmap For Engineering Professional Introduction
Presenting our innovatively-structured five years data analytics career roadmap for engineering professional introduction Template. Showcase your roadmap process in different formats like PDF, PNG, and JPG by clicking the download button below. This PPT design is available in both Standard Screen and Widescreen aspect ratios. It can also be easily personalized and presented with modified font size, font type, color, and shapes to measure your progress in a clear way.
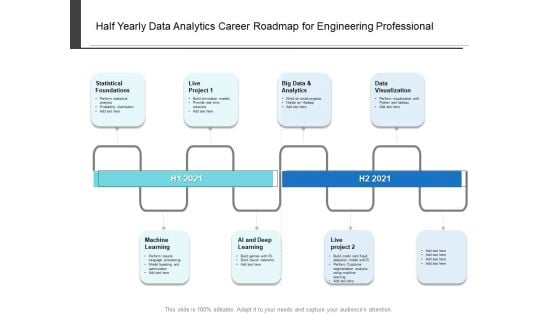
Half Yearly Data Analytics Career Roadmap For Engineering Professional Themes
Presenting our innovatively-structured half yearly data analytics career roadmap for engineering professional themes Template. Showcase your roadmap process in different formats like PDF, PNG, and JPG by clicking the download button below. This PPT design is available in both Standard Screen and Widescreen aspect ratios. It can also be easily personalized and presented with modified font size, font type, color, and shapes to measure your progress in a clear way.
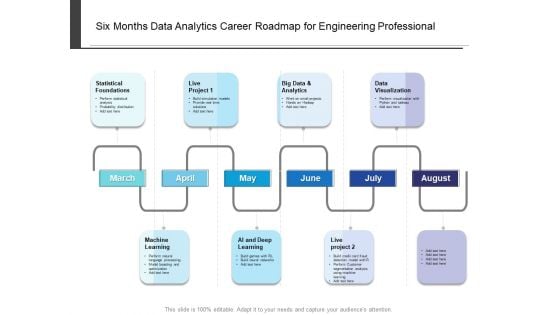
Six Months Data Analytics Career Roadmap For Engineering Professional Mockup
Presenting our innovatively-structured six months data analytics career roadmap for engineering professional mockup Template. Showcase your roadmap process in different formats like PDF, PNG, and JPG by clicking the download button below. This PPT design is available in both Standard Screen and Widescreen aspect ratios. It can also be easily personalized and presented with modified font size, font type, color, and shapes to measure your progress in a clear way.
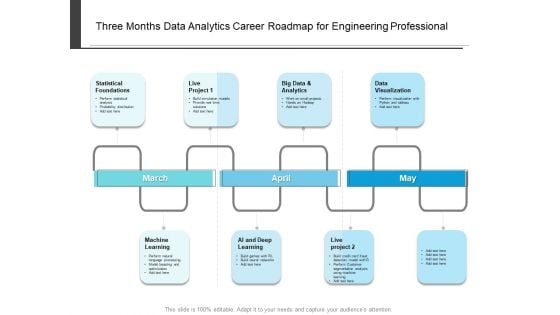
Three Months Data Analytics Career Roadmap For Engineering Professional Designs
Presenting our innovatively-structured three months data analytics career roadmap for engineering professional designs Template. Showcase your roadmap process in different formats like PDF, PNG, and JPG by clicking the download button below. This PPT design is available in both Standard Screen and Widescreen aspect ratios. It can also be easily personalized and presented with modified font size, font type, color, and shapes to measure your progress in a clear way.
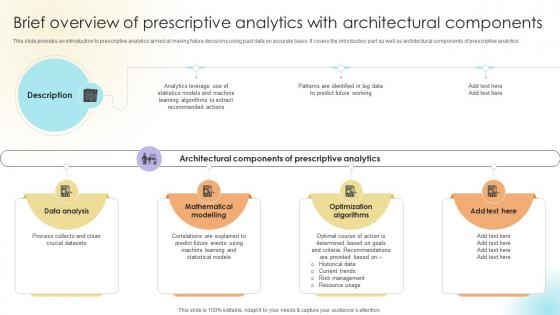
Brief Overview Of Prescriptive Analytics With Architectural Components Data Analytics SS V
This slide provides an introduction to prescriptive analytics aimed at making future decisions using past data on accurate basis. It covers the introductory part as well as architectural components of prescriptive analytics.Explore a selection of the finest Brief Overview Of Prescriptive Analytics With Architectural Components Data Analytics SS V here. With a plethora of professionally designed and pre-made slide templates, you can quickly and easily find the right one for your upcoming presentation. You can use our Brief Overview Of Prescriptive Analytics With Architectural Components Data Analytics SS V to effectively convey your message to a wider audience. Slidegeeks has done a lot of research before preparing these presentation templates. The content can be personalized and the slides are highly editable. Grab templates today from Slidegeeks. This slide provides an introduction to prescriptive analytics aimed at making future decisions using past data on accurate basis. It covers the introductory part as well as architectural components of prescriptive analytics.
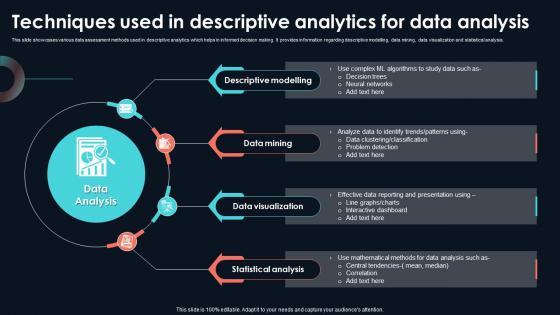
Techniques Used In Descriptive Analytics Developing Strategic Insights Using Big Data Analytics SS V
This slide showcases various data assessment methods used in descriptive analytics which helps in informed decision making. It provides information regarding descriptive modelling, data mining, data visualization and statistical analysis. Presenting this PowerPoint presentation, titled Techniques Used In Descriptive Analytics Developing Strategic Insights Using Big Data Analytics SS V, with topics curated by our researchers after extensive research. This editable presentation is available for immediate download and provides attractive features when used. Download now and captivate your audience. Presenting this Techniques Used In Descriptive Analytics Developing Strategic Insights Using Big Data Analytics SS V. Our researchers have carefully researched and created these slides with all aspects taken into consideration. This is a completely customizable Techniques Used In Descriptive Analytics Developing Strategic Insights Using Big Data Analytics SS V that is available for immediate downloading. Download now and make an impact on your audience. Highlight the attractive features available with our PPTs. This slide showcases various data assessment methods used in descriptive analytics which helps in informed decision making. It provides information regarding descriptive modelling, data mining, data visualization and statistical analysis.
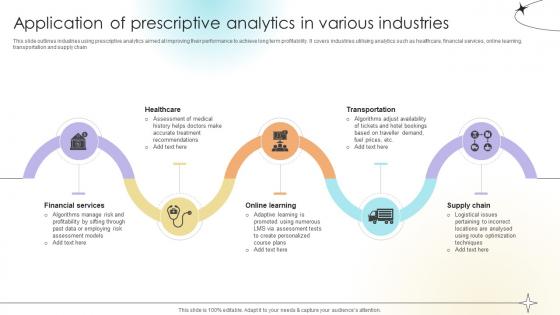
Application Of Prescriptive Analytics In Various Industries Data Analytics SS V
This slide outlines industries using prescriptive analytics aimed at improving their performance to achieve long term profitability. It covers industries utilising analytics such as healthcare, financial services, online learning, transportation and supply chain.Do you have to make sure that everyone on your team knows about any specific topic I yes, then you should give Application Of Prescriptive Analytics In Various Industries Data Analytics SS V a try. Our experts have put a lot of knowledge and effort into creating this impeccable Application Of Prescriptive Analytics In Various Industries Data Analytics SS V. You can use this template for your upcoming presentations, as the slides are perfect to represent even the tiniest detail. You can download these templates from the Slidegeeks website and these are easy to edit. So grab these today This slide outlines industries using prescriptive analytics aimed at improving their performance to achieve long term profitability. It covers industries utilising analytics such as healthcare, financial services, online learning, transportation and supply chain.
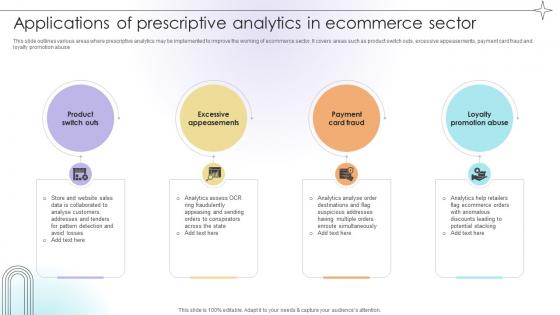
Applications Of Prescriptive Analytics In Ecommerce Sector Data Analytics SS V
This slide outlines various areas where prescriptive analytics may be implemented to improve the working of ecommerce sector. It covers areas such as product switch outs, excessive appeasements, payment card fraud and loyalty promotion abuse.From laying roadmaps to briefing everything in detail, our templates are perfect for you. You can set the stage with your presentation slides. All you have to do is download these easy-to-edit and customizable templates. Applications Of Prescriptive Analytics In Ecommerce Sector Data Analytics SS V will help you deliver an outstanding performance that everyone would remember and praise you for. Do download this presentation today. This slide outlines various areas where prescriptive analytics may be implemented to improve the working of ecommerce sector. It covers areas such as product switch outs, excessive appeasements, payment card fraud and loyalty promotion abuse.
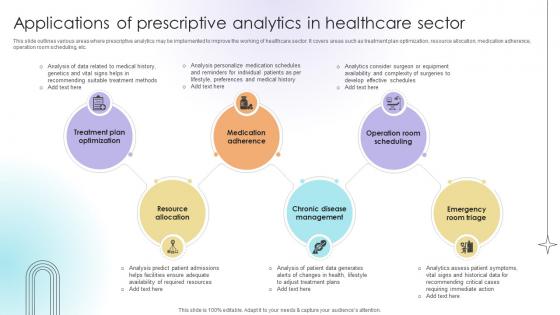
Applications Of Prescriptive Analytics In Healthcare Sector Data Analytics SS V
This slide outlines various areas where prescriptive analytics may be implemented to improve the working of healthcare sector. It covers areas such as treatment plan optimization, resource allocation, medication adherence, operation room scheduling, etc.Slidegeeks is here to make your presentations a breeze with Applications Of Prescriptive Analytics In Healthcare Sector Data Analytics SS V With our easy-to-use and customizable templates, you can focus on delivering your ideas rather than worrying about formatting. With a variety of designs to choose from, you are sure to find one that suits your needs. And with animations and unique photos, illustrations, and fonts, you can make your presentation pop. So whether you are giving a sales pitch or presenting to the board, make sure to check out Slidegeeks first This slide outlines various areas where prescriptive analytics may be implemented to improve the working of healthcare sector. It covers areas such as treatment plan optimization, resource allocation, medication adherence, operation room scheduling, etc.
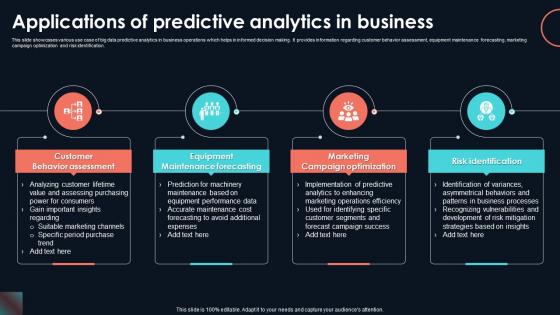
Applications Of Predictive Analytics In Developing Strategic Insights Using Big Data Analytics SS V
This slide showcases various use case of big data predictive analytics in business operations which helps in informed decision making. It provides information regarding customer behavior assessment, equipment maintenance forecasting, marketing campaign optimization and risk identification. There are so many reasons you need a Applications Of Predictive Analytics In Developing Strategic Insights Using Big Data Analytics SS V. The first reason is you can not spend time making everything from scratch, Thus, Slidegeeks has made presentation templates for you too. You can easily download these templates from our website easily. This slide showcases various use case of big data predictive analytics in business operations which helps in informed decision making. It provides information regarding customer behavior assessment, equipment maintenance forecasting, marketing campaign optimization and risk identification.
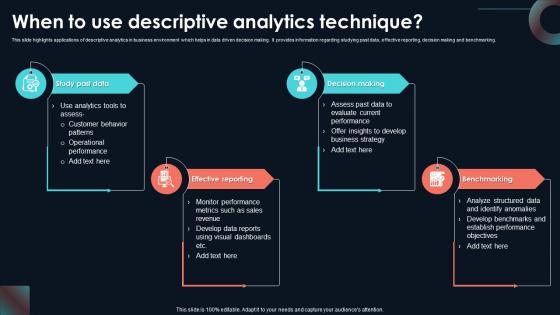
When To Use Descriptive Analytics Technique Developing Strategic Insights Using Big Data Analytics SS V
This slide highlights applications of descriptive analytics in business environment which helps in data driven decision making. It provides information regarding studying past data, effective reporting, decision making and benchmarking. This slide highlights applications of descriptive analytics in business environment which helps in data driven decision making. It provides information regarding studying past data, effective reporting, decision making and benchmarking. This When To Use Descriptive Analytics Technique Developing Strategic Insights Using Big Data Analytics SS V from Slidegeeks makes it easy to present information on your topic with precision. It provides customization options, so you can make changes to the colors, design, graphics, or any other component to create a unique layout. It is also available for immediate download, so you can begin using it right away. Slidegeeks has done good research to ensure that you have everything you need to make your presentation stand out. Make a name out there for a brilliant performance. This slide highlights applications of descriptive analytics in business environment which helps in data driven decision making. It provides information regarding studying past data, effective reporting, decision making and benchmarking.
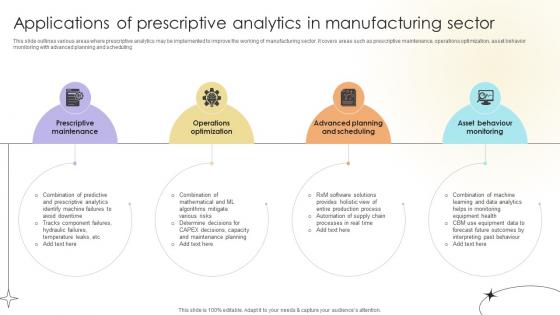
Applications Of Prescriptive Analytics In Manufacturing Sector Data Analytics SS V
This slide outlines various areas where prescriptive analytics may be implemented to improve the working of manufacturing sector. It covers areas such as prescriptive maintenance, operations optimization, asset behavior monitoring with advanced planning and scheduling.Do you have an important presentation coming up Are you looking for something that will make your presentation stand out from the rest Look no further than Applications Of Prescriptive Analytics In Manufacturing Sector Data Analytics SS V. With our professional designs, you can trust that your presentation will pop and make delivering it a smooth process. And with Slidegeeks, you can trust that your presentation will be unique and memorable. So why wait Grab Applications Of Prescriptive Analytics In Manufacturing Sector Data Analytics SS V today and make your presentation stand out from the rest This slide outlines various areas where prescriptive analytics may be implemented to improve the working of manufacturing sector. It covers areas such as prescriptive maintenance, operations optimization, asset behavior monitoring with advanced planning and scheduling.

Overview Of Descriptive Analytics In Developing Strategic Insights Using Big Data Analytics SS V
This slide provides introduction of descriptive analytics used in business for analyzing performance efficiency. It includes elements such as decision making, sales performance, growth opportunities, valuable insights etc. Formulating a presentation can take up a lot of effort and time, so the content and message should always be the primary focus. The visuals of the PowerPoint can enhance the presenters message, so our Overview Of Descriptive Analytics In Developing Strategic Insights Using Big Data Analytics SS V was created to help save time. Instead of worrying about the design, the presenter can concentrate on the message while our designers work on creating the ideal templates for whatever situation is needed. Slidegeeks has experts for everything from amazing designs to valuable content, we have put everything into Overview Of Descriptive Analytics In Developing Strategic Insights Using Big Data Analytics SS V This slide provides introduction of descriptive analytics used in business for analyzing performance efficiency. It includes elements such as decision making, sales performance, growth opportunities, valuable insights etc.
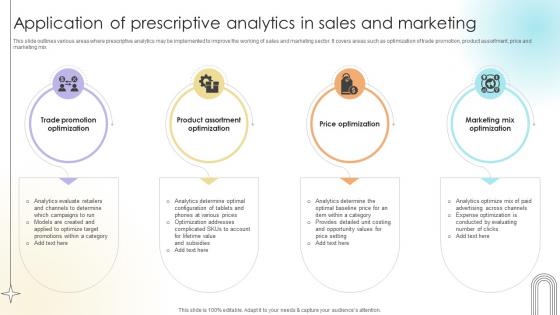
Application Of Prescriptive Analytics In Sales And Marketing Data Analytics SS V
This slide outlines various areas where prescriptive analytics may be implemented to improve the working of sales and marketing sector. It covers areas such as optimization of trade promotion, product assortment, price and marketing mix.Want to ace your presentation in front of a live audience Our Application Of Prescriptive Analytics In Sales And Marketing Data Analytics SS V can help you do that by engaging all the users towards you. Slidegeeks experts have put their efforts and expertise into creating these impeccable powerpoint presentations so that you can communicate your ideas clearly. Moreover, all the templates are customizable, and easy-to-edit and downloadable. Use these for both personal and commercial use. This slide outlines various areas where prescriptive analytics may be implemented to improve the working of sales and marketing sector. It covers areas such as optimization of trade promotion, product assortment, price and marketing mix.
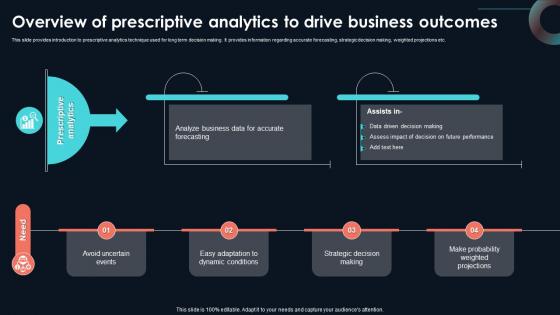
Overview Of Prescriptive Analytics To Drive Developing Strategic Insights Using Big Data Analytics SS V
This slide provides introduction to prescriptive analytics technique used for long term decision making. It provides information regarding accurate forecasting, strategic decision making, weighted projections etc. Coming up with a presentation necessitates that the majority of the effort goes into the content and the message you intend to convey. The visuals of a PowerPoint presentation can only be effective if it supplements and supports the story that is being told. Keeping this in mind our experts created Overview Of Prescriptive Analytics To Drive Developing Strategic Insights Using Big Data Analytics SS V to reduce the time that goes into designing the presentation. This way, you can concentrate on the message while our designers take care of providing you with the right template for the situation. This slide provides introduction to prescriptive analytics technique used for long term decision making. It provides information regarding accurate forecasting, strategic decision making, weighted projections etc.

Best Practices Of Attribution Analysis Product Analytics Implementation Data Analytics V
This slide provides key practices aimed at optimizing the practice of attribution analysis to boost marketing efforts. It covers choose KPIs, backend training, connect channels, use automation and talk to stakeholders There are so many reasons you need a Best Practices Of Attribution Analysis Product Analytics Implementation Data Analytics V. The first reason is you can not spend time making everything from scratch, Thus, Slidegeeks has made presentation templates for you too. You can easily download these templates from our website easily. This slide provides key practices aimed at optimizing the practice of attribution analysis to boost marketing efforts. It covers choose KPIs, backend training, connect channels, use automation and talk to stakeholders
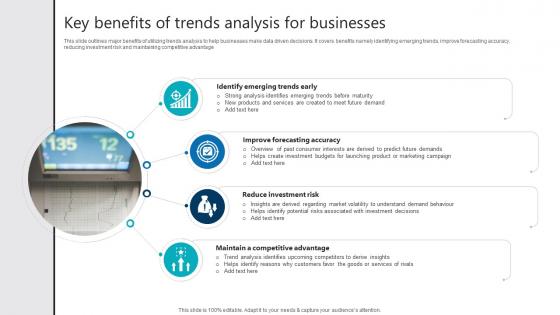
Key Benefits Of Trends Analysis For Businesses Product Analytics Implementation Data Analytics V
This slide outlines major benefits of utilizing trends analysis to help businesses make data driven decisions. It covers benefits namely identifying emerging trends, improve forecasting accuracy, reducing investment risk and maintaining competitive advantage Take your projects to the next level with our ultimate collection of Key Benefits Of Trends Analysis For Businesses Product Analytics Implementation Data Analytics V. Slidegeeks has designed a range of layouts that are perfect for representing task or activity duration, keeping track of all your deadlines at a glance. Tailor these designs to your exact needs and give them a truly corporate look with your own brand colors they will make your projects stand out from the rest This slide outlines major benefits of utilizing trends analysis to help businesses make data driven decisions. It covers benefits namely identifying emerging trends, improve forecasting accuracy, reducing investment risk and maintaining competitive advantage
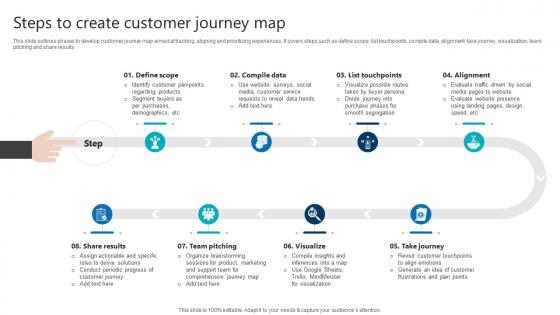
Steps To Create Customer Journey Map Product Analytics Implementation Data Analytics V
This slide outlines phases to develop customer journey map aimed at tracking, aligning and prioritizing experiences. It covers steps such as define scope, list touchpoints, compile data, alignment, take journey, visualization, team pitching and share results Welcome to our selection of the Steps To Create Customer Journey Map Product Analytics Implementation Data Analytics V. These are designed to help you showcase your creativity and bring your sphere to life. Planning and Innovation are essential for any business that is just starting out. This collection contains the designs that you need for your everyday presentations. All of our PowerPoints are 100 percent editable, so you can customize them to suit your needs. This multi-purpose template can be used in various situations. Grab these presentation templates today. This slide outlines phases to develop customer journey map aimed at tracking, aligning and prioritizing experiences. It covers steps such as define scope, list touchpoints, compile data, alignment, take journey, visualization, team pitching and share results


 Continue with Email

 Home
Home


