Data Analytics Process
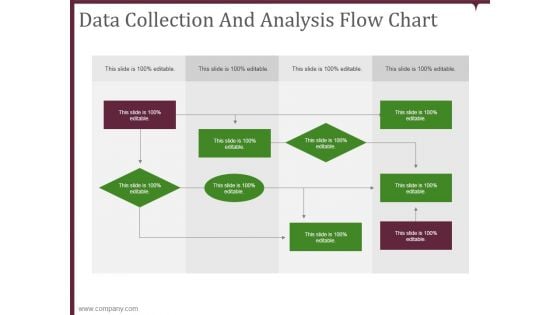
Data Collection And Analysis Flow Chart Template 1 Ppt PowerPoint Presentation Ideas Gridlines
This is a data collection and analysis flow chart template 1 ppt powerpoint presentation ideas gridlines. This is a nine stage process. The stages in this process are business, chart, organization, process, structure.
Data Collection And Analysis Flow Chart Template 2 Ppt PowerPoint Presentation Inspiration Layout Ideas
This is a data collection and analysis flow chart template 2 ppt powerpoint presentation inspiration layout ideas. This is a four stage process. The stages in this process are business, chart, organization, process, structure.
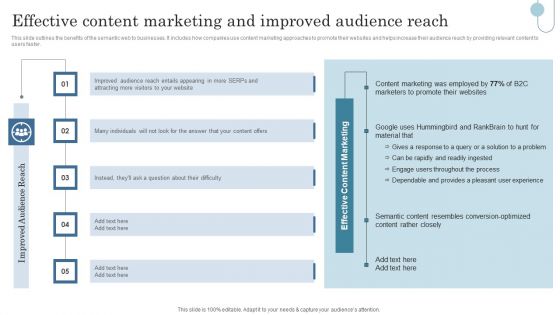
Semantic Data Searching Technique Effective Content Marketing And Improved Audience Reach Themes PDF
This slide outlines the benefits of the semantic web to businesses. It includes how companies use content marketing approaches to promote their websites and helps increase their audience reach by providing relevant content to users faster. Are you in need of a template that can accommodate all of your creative concepts This one is crafted professionally and can be altered to fit any style. Use it with Google Slides or PowerPoint. Include striking photographs, symbols, depictions, and other visuals. Fill, move around, or remove text boxes as desired. Test out color palettes and font mixtures. Edit and save your work, or work with colleagues. Download Semantic Data Searching Technique Effective Content Marketing And Improved Audience Reach Themes PDF and observe how to make your presentation outstanding. Give an impeccable presentation to your group and make your presentation unforgettable.

Data Lineage Methods Challenges And Objectives Of The Client Organization Mockup PDF
This slide describes the client organizations challenges and objectives, including difficulty in examining the demographics of the information, strict regulatory supervision, and different terminology within six divisions of the organization. Welcome to our selection of the Data Lineage Methods Challenges And Objectives Of The Client Organization Mockup PDF. These are designed to help you showcase your creativity and bring your sphere to life. Planning and Innovation are essential for any business that is just starting out. This collection contains the designs that you need for your everyday presentations. All of our PowerPoints are 100 percent editable, so you can customize them to suit your needs. This multi-purpose template can be used in various situations. Grab these presentation templates today
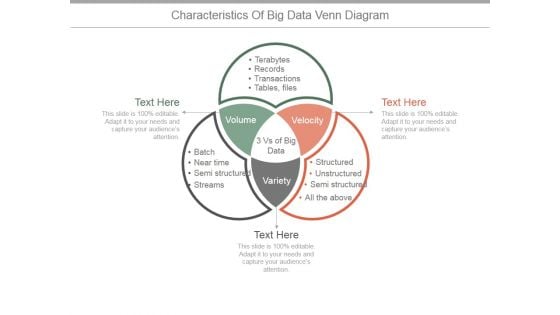
Characteristics Of Big Data Venn Diagram Ppt PowerPoint Presentation Example 2015
This is a characteristics of big data venn diagram ppt powerpoint presentation example 2015. This is a three stage process. The stages in this process are volume, velocity, variety, tables, files, transactions, records, terabytes.
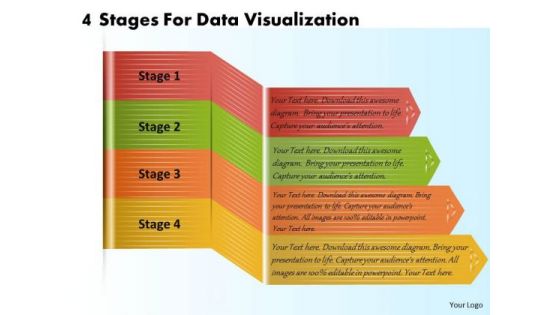
Business Plan And Strategy 4 Stages For Data Visualization Strategic Planning Template Ppt Slide
Your Listeners Will Never Doodle. Our business plan and strategy 4 stages for data visualization strategic planning template ppt slide Powerpoint Templates Will Hold Their Concentration. Do The One Thing With Your Thoughts. Uphold Custom With Our Process and Flows Powerpoint Templates.
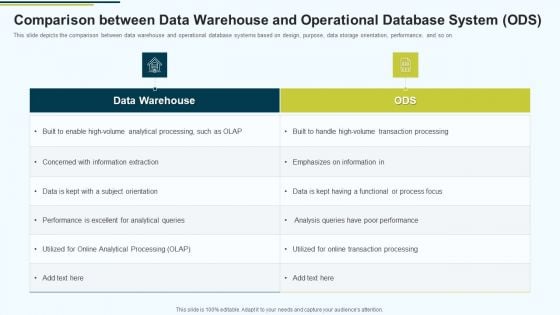
MIS Comparison Between Data Warehouse And Operational Database System ODS Ppt PowerPoint Presentation Show Images PDF
This slide depicts the comparison between data warehouse and operational database systems based on design, purpose, data storage orientation, performance, and so on.Deliver an awe inspiring pitch with this creative MIS Comparison Between Data Warehouse And Operational Database System ODS Ppt PowerPoint Presentation Show Images PDF bundle. Topics like Concerned With Information, Performance Is Excellent, Analytical Processing can be discussed with this completely editable template. It is available for immediate download depending on the needs and requirements of the user.
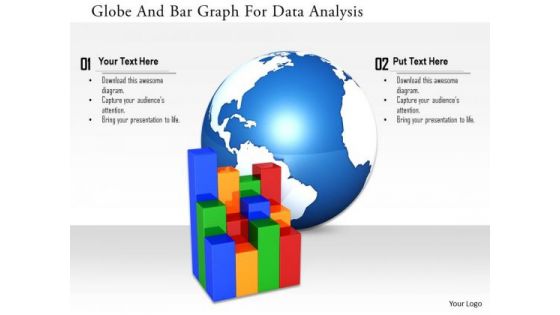
Stock Photo Globe And Bar Graph For Data Analysis Image Graphics For PowerPoint Slide
This image slide has been designed with business graph with globe in background. This image slide represents topics like global business, economic growth. This image will enhance the quality of your presentations.
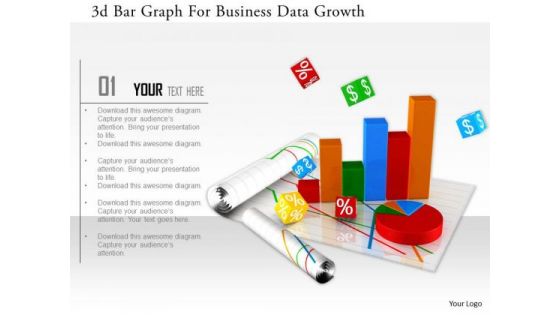
Stock Photo 3d Bar Graph For Business Data Growth Image Graphics For PowerPoint Slide
This image slide has graphics of financial charts and reports. This contains bar graph and pie chart to present business reports. Build an innovative presentations using this professional image slide.
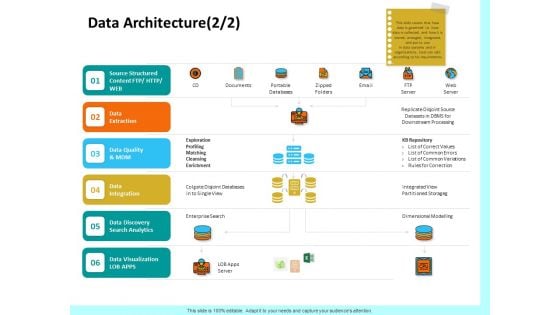
Firm Productivity Administration Data Architecture Integration Ppt PowerPoint Presentation Model Portfolio PDF
Presenting this set of slides with name firm productivity administration data architecture integration ppt powerpoint presentation model portfolio pdf. This is a one stage process. The stages in this process are data extraction, data quality and mdm, data integration, enterprise search, data discovery search analytics. This is a completely editable PowerPoint presentation and is available for immediate download. Download now and impress your audience.
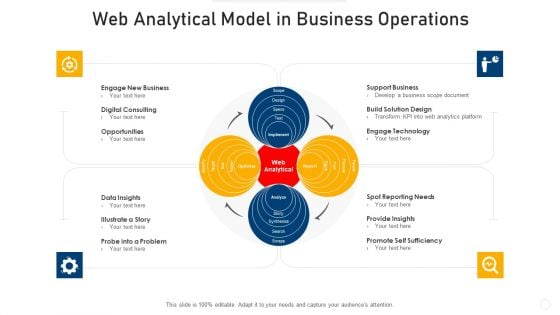
Web Analytical Model In Business Operations Graphics PDF
Persuade your audience using this web analytical model in business operations graphics pdf. This PPT design covers four stages, thus making it a great tool to use. It also caters to a variety of topics including business, sufficiency, data insights. Download this PPT design now to present a convincing pitch that not only emphasizes the topic but also showcases your presentation skills.
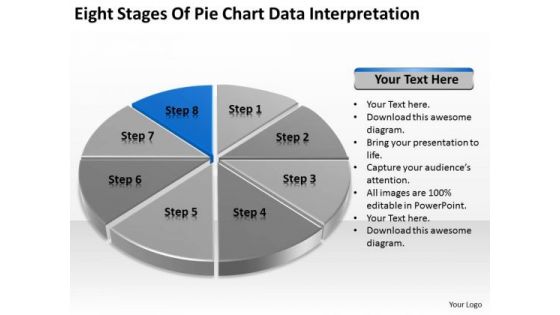
Eight Stages Of Pie Chart Data Interpretation Detailed Business Plan PowerPoint Templates
We present our eight stages of pie chart data interpretation detailed business plan PowerPoint templates.Download and present our Competition PowerPoint Templates because You can Stir your ideas in the cauldron of our PowerPoint Templates and Slides. Cast a magic spell on your audience. Download and present our Marketing PowerPoint Templates because You should Kick up a storm with our PowerPoint Templates and Slides. The heads of your listeners will swirl with your ideas. Download and present our Arrows PowerPoint Templates because Your ideas provide food for thought. Our PowerPoint Templates and Slides will help you create a dish to tickle the most discerning palate. Present our Circle Charts PowerPoint Templates because You can Stir your ideas in the cauldron of our PowerPoint Templates and Slides. Cast a magic spell on your audience. Download our Business PowerPoint Templates because You can Score a slam dunk with our PowerPoint Templates and Slides. Watch your audience hang onto your every word.Use these PowerPoint slides for presentations relating to chart, graph, pie, 3d, diagram, graphic, icon, control, business, data, profit, market, sales, display, corporate, concept, render, success, presentation, finance, report, marketing, accounting, management, piece, strategy, money, growth, company, competition, progress, account, sheet, part, information, investment, improvement, banking, index, financial, reflect, results, performance, exchange. The prominent colors used in the PowerPoint template are Blue, Black, Gray. Exult in the comfort of our Eight Stages Of Pie Chart Data Interpretation Detailed Business Plan PowerPoint Templates. Experience the convenience they deliver.
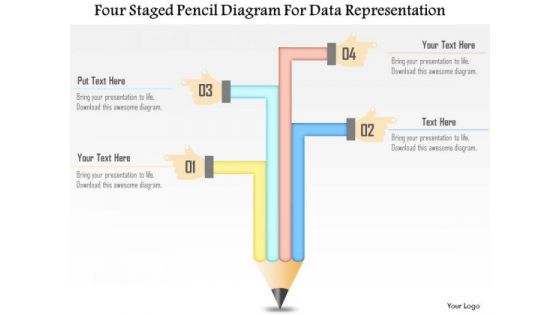
Business Diagram Four Staged Pencil Diagram For Data Representation Presentation Template
This business diagram has been designed with four staged pencil chart. This slide suitable for data representation. You can also use this slide to present four steps of any business process. Use this diagram to present your views in a wonderful manner.
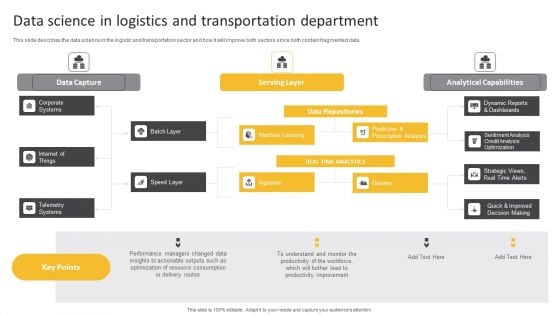
Information Science Data Science In Logistics And Transportation Department Ppt PowerPoint Presentation Slides Templates PDF
This slide describes the data science in the logistic and transportation sector and how it will improve both sectors since both contain fragmented data.Deliver an awe inspiring pitch with this creative Information Science Data Science In Logistics And Transportation Department Ppt PowerPoint Presentation Slides Templates PDF bundle. Topics like Analytical Capabilities, Data Capture, Serving Layer can be discussed with this completely editable template. It is available for immediate download depending on the needs and requirements of the user.
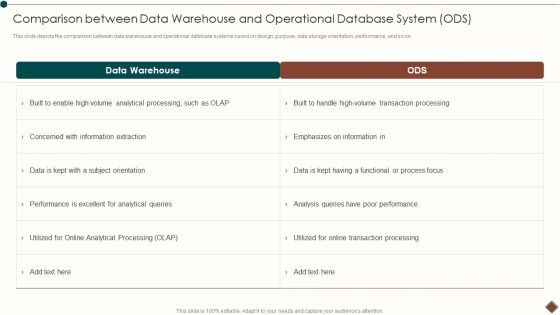
Comparison Between Data Warehouse And Operational Database System ODS Infographics PDF
This slide depicts the comparison between data warehouse and operational database systems based on design, purpose, data storage orientation, performance, and so on.Deliver and pitch your topic in the best possible manner with this Comparison Between Data Warehouse And Operational Database System ODS Infographics PDF. Use them to share invaluable insights on Concerned Information, Analytical Processing, Poor Performance and impress your audience. This template can be altered and modified as per your expectations. So, grab it now.
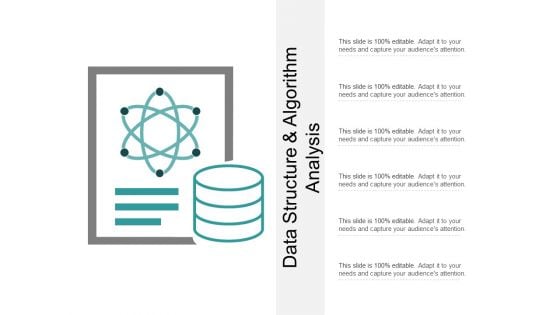
Data Structure And Algorithm Analysis Ppt PowerPoint Presentation Slides Graphics Design
This is a data structure and algorithm analysis ppt powerpoint presentation slides graphics design. This is a one stage process. The stages in this process are data, analysis, data science, information science.
Data Algorithm And Storage Management Ppt PowerPoint Presentation Icon Background Images
This is a data algorithm and storage management ppt powerpoint presentation icon background images. This is a four stage process. The stages in this process are data, analysis, data science, information science.
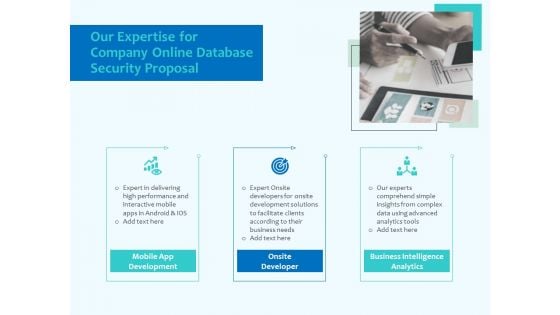
Best Data Security Software Our Expertise For Company Online Database Security Proposal Formats PDF
Presenting this set of slides with name best data security software our expertise for company online database security proposal formats pdf. This is a three stage process. The stages in this process are mobile app development, onsite developer, business intelligence analytics. This is a completely editable PowerPoint presentation and is available for immediate download. Download now and impress your audience.
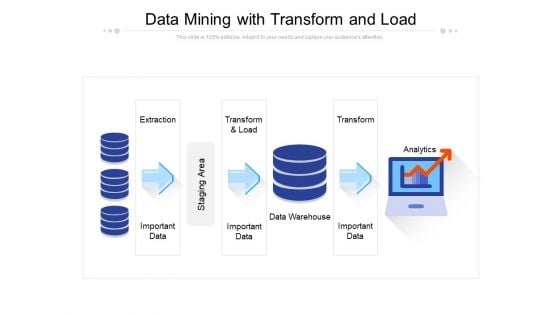
Data Mining With Transform And Load Ppt PowerPoint Presentation Model Pictures
Presenting this set of slides with name data mining with transform and load ppt powerpoint presentation model pictures. This is a three stage process. The stages in this process are extraction important data, transform and load, important data, data warehouse, important data, transform analytics, staging area. This is a completely editable PowerPoint presentation and is available for immediate download. Download now and impress your audience.

Business Analysis Data Charts And Reports Ppt Powerpoint Presentation Ideas Portrait
This is a business analysis data charts and reports ppt powerpoint presentation ideas portrait. This is a three stage process. The stages in this process are business metrics, business kpi, business dashboard.
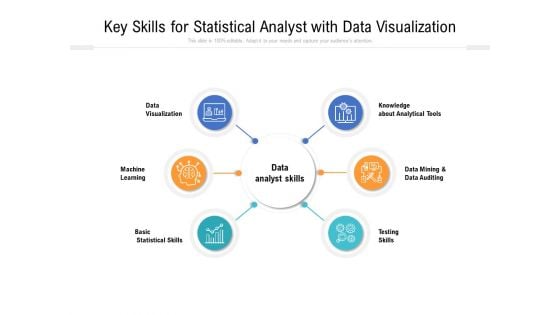
Key Skills For Statistical Analyst With Data Visualization Ppt PowerPoint Presentation Gallery Elements PDF
Presenting key skills for statistical analyst with data visualization ppt powerpoint presentation gallery elements pdf. to dispense important information. This template comprises six stages. It also presents valuable insights into the topics including machine, learning, statistical skills analyst, testing skills, analytical tools, knowledge. This is a completely customizable PowerPoint theme that can be put to use immediately. So, download it and address the topic impactfully.
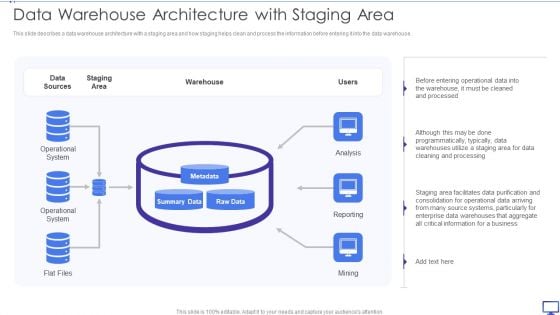
Decision Support System Data Warehouse Architecture With Staging Area Diagrams PDF
This slide describes a data warehouse architecture with a staging area and how staging helps clean and process the information before entering it into the data warehouse. This is a Decision Support System Data Warehouse Architecture With Staging Area Diagrams PDF template with various stages. Focus and dispense information on one stages using this creative set, that comes with editable features. It contains large content boxes to add your information on topics like Data Sources, Staging Area, Operational System. You can also showcase facts, figures, and other relevant content using this PPT layout. Grab it now.

Data Algorithm Statistics And Advanced Computing Ppt PowerPoint Presentation File Styles
This is a data algorithm statistics and advanced computing ppt powerpoint presentation file styles. This is a eight stage process. The stages in this process are data, analysis, data science, information science.
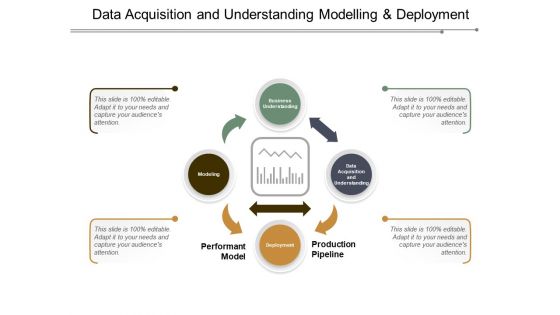
Data Acquisition And Understanding Modelling And Deployment Ppt PowerPoint Presentation Layouts
This is a data acquisition and understanding modelling and deployment ppt powerpoint presentation layouts. This is a four stage process. The stages in this process are data, analysis, data science, information science.
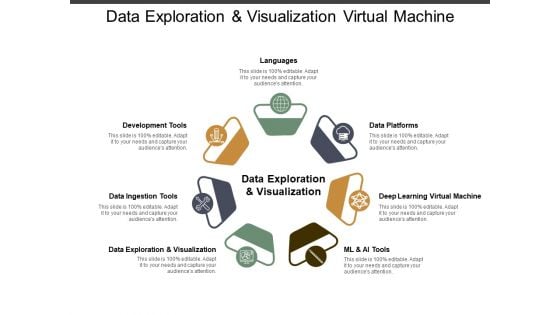
Data Exploration And Visualization Virtual Machine Ppt PowerPoint Presentation Infographics Diagrams
This is a data exploration and visualization virtual machine ppt powerpoint presentation infographics diagrams. This is a seven stage process. The stages in this process are data, analysis, data science, information science.
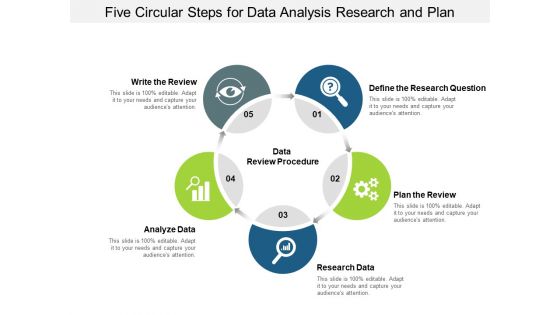
Five Circular Steps For Data Analysis Research And Plan Ppt PowerPoint Presentation Outline Show
This is a five circular steps for data analysis research and plan ppt powerpoint presentation outline show. This is a five stage process. The stages in this process are data analysis, data review, data evaluation.

Data Analysis And Interpretation Reviewed And Resolved Ppt PowerPoint Presentation Pictures Graphics
This is a data analysis and interpretation reviewed and resolved ppt powerpoint presentation pictures graphics. This is a four stage process. The stages in this process are data analysis, data review, data evaluation.
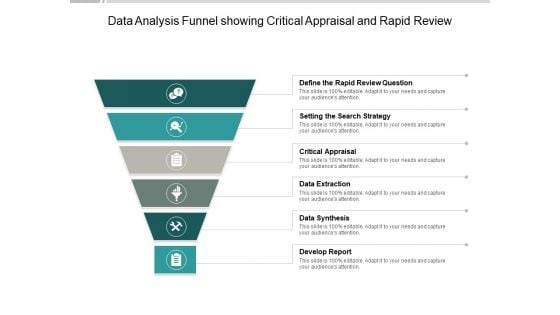
Data Analysis Funnel Showing Critical Appraisal And Rapid Review Ppt PowerPoint Presentation Model Deck
This is a data analysis funnel showing critical appraisal and rapid review ppt powerpoint presentation model deck. This is a six stage process. The stages in this process are data analysis, data review, data evaluation.

Data Governance For Enterprise Workflow Management Ppt PowerPoint Presentation Model Outline
This is a data governance for enterprise workflow management ppt powerpoint presentation model outline. This is a two stage process. The stages in this process are data analysis, data review, data evaluation.
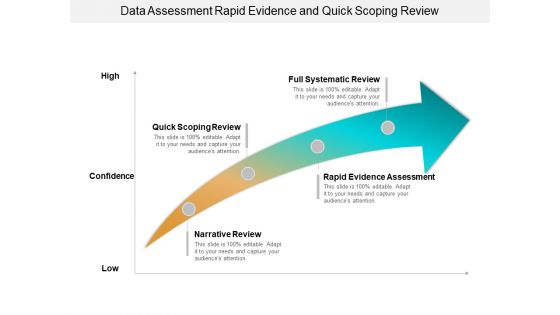
Data Assessment Rapid Evidence And Quick Scoping Review Ppt PowerPoint Presentation Outline Styles
This is a data assessment rapid evidence and quick scoping review ppt powerpoint presentation outline styles. This is a four stage process. The stages in this process are data analysis, data review, data evaluation.

Data Governance Steps Review Tools Setup Ppt PowerPoint Presentation Visual Aids Diagrams
This is a data governance steps review tools setup ppt powerpoint presentation visual aids diagrams. This is a five stage process. The stages in this process are data analysis, data review, data evaluation.

Data Interpretation Implementation Review And Evaluation Ppt PowerPoint Presentation Infographics Example
This is a data interpretation implementation review and evaluation ppt powerpoint presentation infographics example. This is a four stage process. The stages in this process are data analysis, data review, data evaluation.
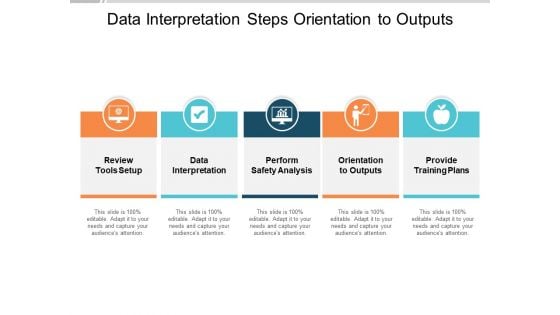
Data Interpretation Steps Orientation To Outputs Ppt PowerPoint Presentation Slides Maker
This is a data interpretation implementation review and evaluation ppt powerpoint presentation infographics example. This is a five stage process. The stages in this process are data analysis, data review, data evaluation.
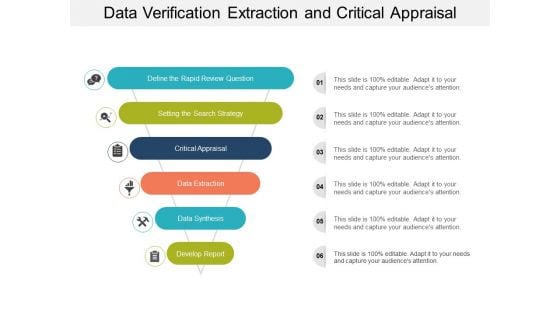
Data Verification Extraction And Critical Appraisal Ppt PowerPoint Presentation Slides Graphic Images
This is a data verification extraction and critical appraisal ppt powerpoint presentation slides graphic images. This is a six stage process. The stages in this process are data analysis, data review, data evaluation.
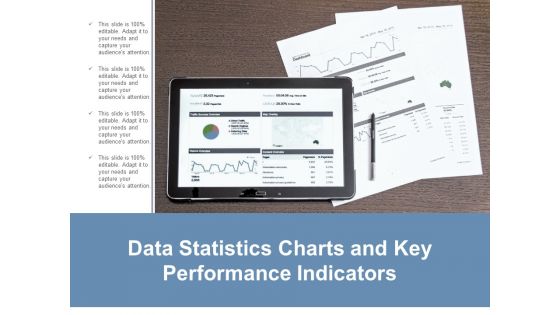
Data Statistics Charts And Key Performance Indicators Ppt Powerpoint Presentation Layouts Guide
This is a data statistics charts and key performance indicators ppt powerpoint presentation layouts guide. This is a four stage process. The stages in this process are business metrics, business kpi, business dashboard.
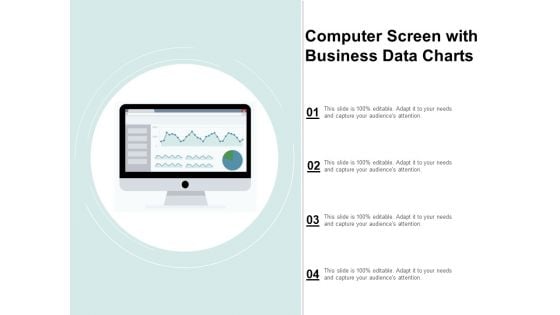
Computer Screen With Business Data Charts Ppt Powerpoint Presentation Show Vector
This is a computer screen with business data charts ppt powerpoint presentation show vector. This is a four stage process. The stages in this process are business metrics, business kpi, business dashboard.
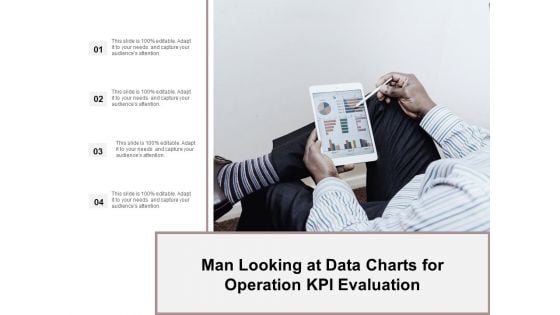
Man Looking At Data Charts For Operation Kpi Evaluation Ppt Powerpoint Presentation Ideas Demonstration
This is a man looking at data charts for operation kpi evaluation ppt powerpoint presentation ideas demonstration. This is a four stage process. The stages in this process are business metrics, business kpi, business dashboard.
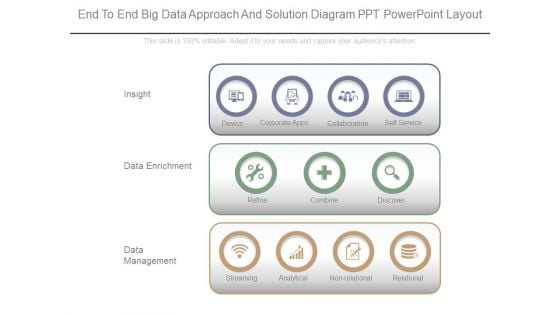
End To End Big Data Approach And Solution Diagram Ppt Powerpoint Layout
This is a end to end big data approach and solution diagram ppt powerpoint layout. This is a three stage process. The stages in this process are insight, data enrichment, data management, device, corporate apps, collaboration, self service, refine, combine, discover, relational, non relational, analytical, streaming.

Internet Of Things Related To Data Science Ppt PowerPoint Presentation Gallery Ideas
Presenting this set of slides with name internet of things related to data science ppt powerpoint presentation gallery ideas. This is a six stage process. The stages in this process are big data analysis, data management, technologies segmentation. This is a completely editable PowerPoint presentation and is available for immediate download. Download now and impress your audience.
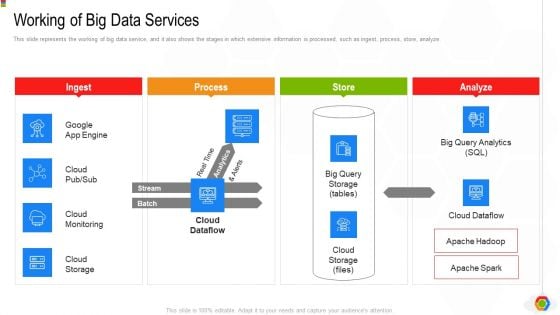
Google Cloud Console IT Working Of Big Data Services Ppt Gallery Clipart PDF
This slide represents the working of big data service, and it also shows the stages in which extensive information is processed, such as ingest, process, store, analyze. Deliver and pitch your topic in the best possible manner with this google cloud console it working of big data services ppt gallery clipart pdf. Use them to share invaluable insights on ingest, cloud monitoring, big query analytics, analyze, store, process and impress your audience. This template can be altered and modified as per your expectations. So, grab it now.
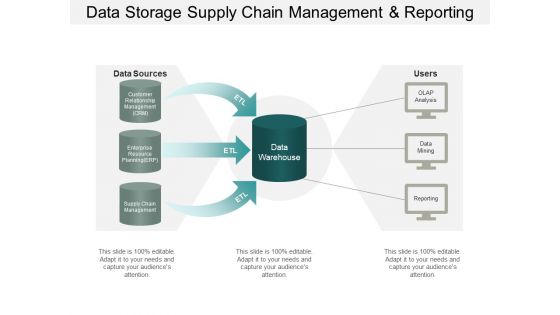
Data Storage Supply Chain Management And Reporting Ppt PowerPoint Presentation Outline
This is a data storage supply chain management and reporting ppt powerpoint presentation outline. This is a six stage process. The stages in this process are transform and load, data wore housing, etl, extract.

Coding For Data Science Analysis Ppt PowerPoint Presentation Slides Design Templates
Presenting this set of slides with name coding for data science analysis ppt powerpoint presentation slides design templates. This is a one stage process. The stage in this process is coding for data science analysis. This is a completely editable PowerPoint presentation and is available for immediate download. Download now and impress your audience.

Kaizen Action Plan Data Collection And Analysis Techniques Ppt PowerPoint Presentation Complete Deck With Slides
This is a kaizen action plan data collection and analysis techniques ppt powerpoint presentation complete deck with slides. This is a one stage process. The stages in this process are action plan, kaizen, data management, analysis, technology.
Development Leadership Program Research Data Analysis Liquidation Value Ppt PowerPoint Presentation File Graphics Example
This is a development leadership program research data analysis liquidation value ppt powerpoint presentation file graphics example. This is a four stage process. The stages in this process are development leadership program, research data analysis, liquidation value.
Product Planning Tool Data Quality Analysis Financial Management Ppt PowerPoint Presentation Styles Graphics Template
This is a product planning tool data quality analysis financial management ppt powerpoint presentation styles graphics template. This is a five stage process. The stages in this process are product planning tool, data quality analysis, financial management.
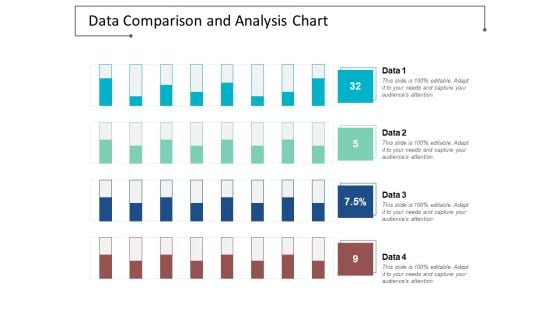
Data Comparison And Analysis Chart Ppt Powerpoint Presentation File Background Images
This is a data comparison and analysis chart ppt powerpoint presentation file background images. This is a four stage process. The stages in this process are data presentation, content presentation, information presentation.
Core Competency Analysis Agile Data Modelling Outsourcing Employee Ppt PowerPoint Presentation Infographics Icons
This is a core competency analysis agile data modelling outsourcing employee ppt powerpoint presentation infographics icons. This is a three stage process. The stages in this process are core competency analysis, agile data modelling, outsourcing employee.
Qualitative Data Analysis Strategic Mergers Acquisitions Behavioural Goals Ppt PowerPoint Presentation Ideas Guidelines
This is a qualitative data analysis strategic mergers acquisitions behavioural goals ppt powerpoint presentation ideas guidelines. This is a four stage process. The stages in this process are qualitative data analysis, strategic mergers acquisitions, behavioural goals.
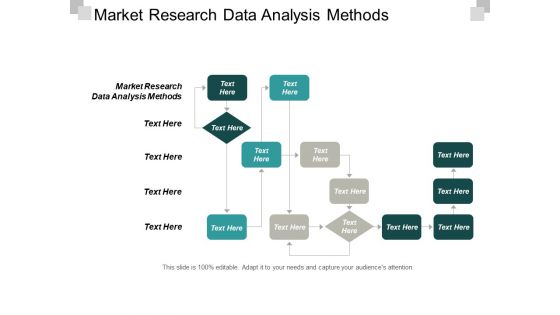
Market Research Data Analysis Methods Ppt PowerPoint Presentation Pictures Clipart Images Cpb
This is a market research data analysis methods ppt powerpoint presentation pictures clipart images cpb. This is a three stage process. The stages in this process are market research data analysis methods.

Dissertation Data Presentation Structure And Analysis Ppt PowerPoint Presentation Complete Deck With Slides
This is a dissertation data presentation structure and analysis ppt powerpoint presentation complete deck with slides. This is a one stage process. The stages in this process are dissertation, data, presentation, structure, analysis.
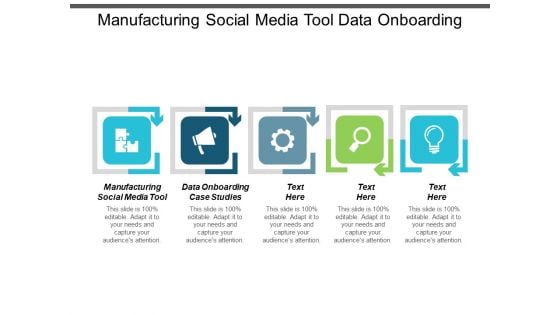
Manufacturing Social Media Tool Data Onboarding Case Studies Ppt PowerPoint Presentation Layouts Background Image
This is a manufacturing social media tool data onboarding case studies ppt powerpoint presentation layouts background image. This is a five stage process. The stages in this process are manufacturing social media tool, data onboarding case studies.
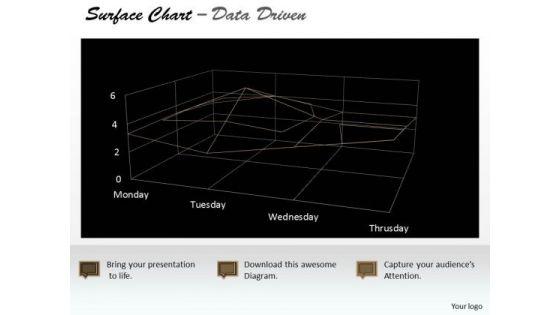
Data Analysis Template Driven Surface Chart Indicating Areas PowerPoint Slides Templates
Highlight Your Drive With Our data analysis template driven surface chart indicating areas powerpoint slides Templates . Prove The Fact That You Have Control.
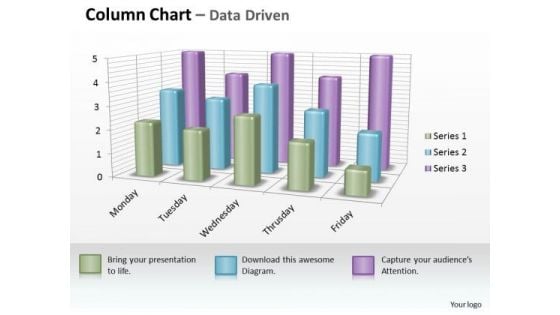
Examples Of Data Analysis Market 3d Business Inspection Procedure Chart PowerPoint Templates
However Dry Your Topic Maybe. Make It Catchy With Our examples of data analysis market 3d business inspection procedure chart Powerpoint Templates .
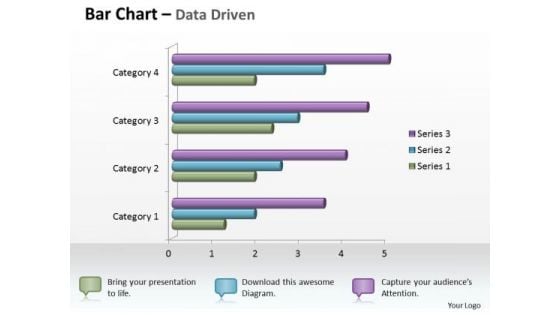
Data Analysis In Excel 3d Bar Chart For Business Statistics PowerPoint Templates
Knock On The Door To Success With Our data analysis in excel 3d bar chart for business statistics Powerpoint Templates . Be Assured Of Gaining Entry.
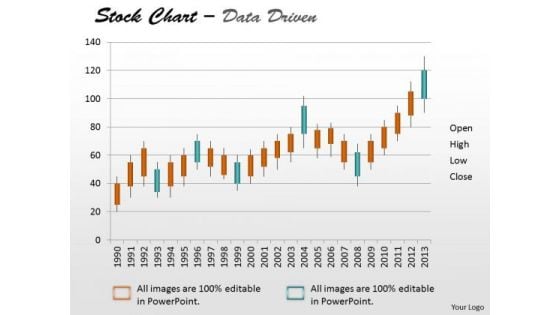
Data Analysis Template Driven Stock Chart For Market Trends PowerPoint Slides Templates
Drive Your Team Along The Road To Success. Take The Wheel With Our data analysis template driven stock chart for market trends powerpoint slides Templates .
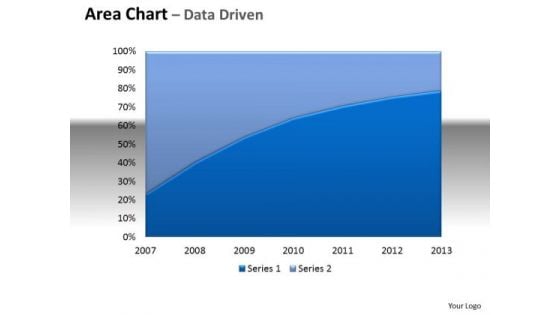
Financial Data Analysis Area Chart With Plotted Line Center PowerPoint Templates
Be The Doer With Our financial data analysis area chart with plotted line center Powerpoint Templates . Put Your Thoughts Into Practice.
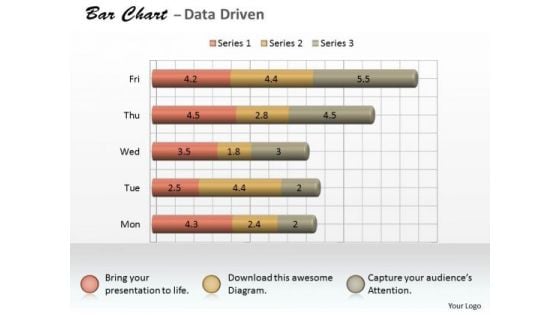
Microsoft Excel Data Analysis 3d Bar Chart As Research Tool PowerPoint Templates
Knock On The Door To Success With Our microsoft excel data analysis 3d bar chart as research tool Powerpoint Templates . Be Assured Of Gaining Entry.
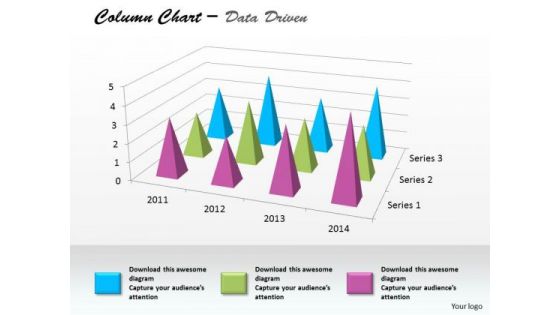
Data Analysis In Excel Column Chart For Business Project PowerPoint Templates
Edit Your Work With Our data analysis in excel column chart for business project Powerpoint Templates . They Will Help You Give The Final Form.
Customer Voice Service Data Flow Charts Ppt PowerPoint Presentation Icon Styles PDF
This slide presents a data flow charts, which includes visual data about the inputs and outputs of entities and processes illustrating the flow of information between client voice services and data verse. it covers procedures including create project, distribute survey, respond to survey and analyse results. Presenting Customer Voice Service Data Flow Charts Ppt PowerPoint Presentation Icon Styles PDF to dispense important information. This template comprises one stages. It also presents valuable insights into the topics including Create Project, Distribute Survey, Analyze Results, Project Information. This is a completely customizable PowerPoint theme that can be put to use immediately. So, download it and address the topic impactfully.
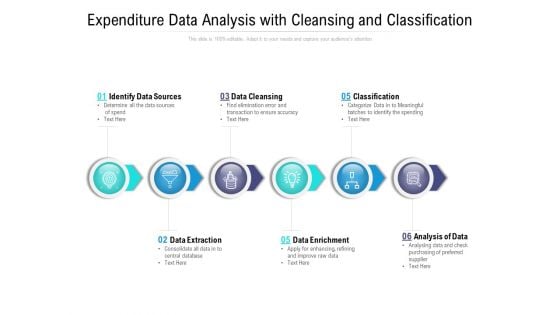
Expenditure Data Analysis With Cleansing And Classification Ppt PowerPoint Presentation Outline Graphics Tutorials
Presenting this set of slides with name expenditure data analysis with cleansing and classification ppt powerpoint presentation outline graphics tutorials. This is a six stage process. The stages in this process are identify data sources, data cleansing, classification, data extraction, data enrichment, analysis data. This is a completely editable PowerPoint presentation and is available for immediate download. Download now and impress your audience.


 Continue with Email

 Home
Home


