Data Analytics Roadmap

Toolkit For Data Science And Analytics Transition Key Consideration For Data Analytics Implementation Strategy Ideas PDF
This slide depicts a holistic data analytics implementation strategy that includes a roadmap with a mix of business and technology imperatives. Slidegeeks is here to make your presentations a breeze with Toolkit For Data Science And Analytics Transition Key Consideration For Data Analytics Implementation Strategy Ideas PDF With our easy to use and customizable templates, you can focus on delivering your ideas rather than worrying about formatting. With a variety of designs to choose from, you are sure to find one that suits your needs. And with animations and unique photos, illustrations, and fonts, you can make your presentation pop. So whether you are giving a sales pitch or presenting to the board, make sure to check out Slidegeeks first.
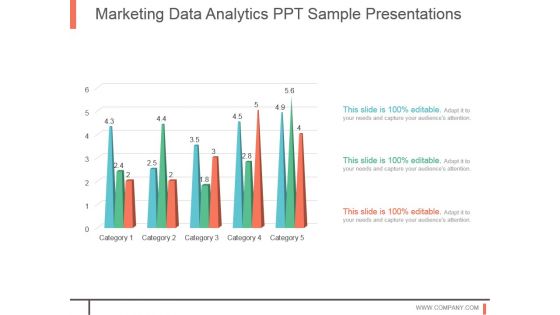
Marketing Data Analytics Ppt Sample Presentations
This is a marketing data analytics ppt sample presentations. This is a five stage process. The stages in this process are business, strategy, marketing, process, linear process.
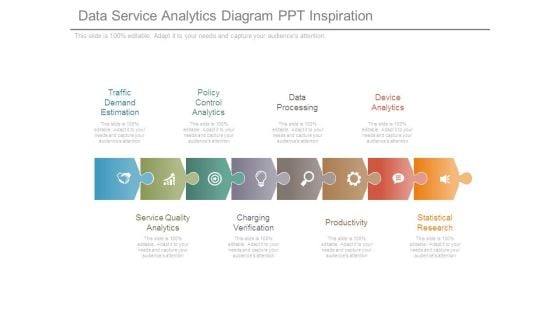
Data Service Analytics Diagram Ppt Inspiration
This is a data service analytics diagram ppt inspiration. This is a eight stage process. The stages in this process are traffic demand estimation, policy control analytics, data processing, device analytics, service quality analytics, charging verification, productivity, statistical research.
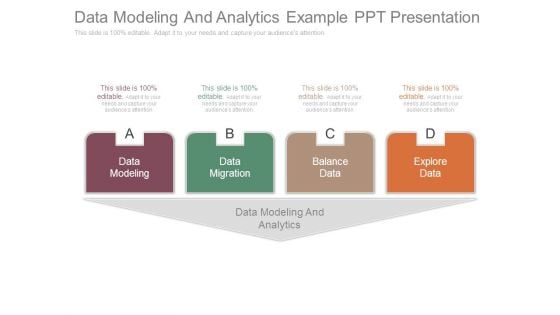
Data Modeling And Analytics Example Ppt Presentation
This is a data modeling and analytics example ppt presentation. This is a four stage process. The stages in this process are data modeling, data migration, balance data, explore data, data modeling and analytics.
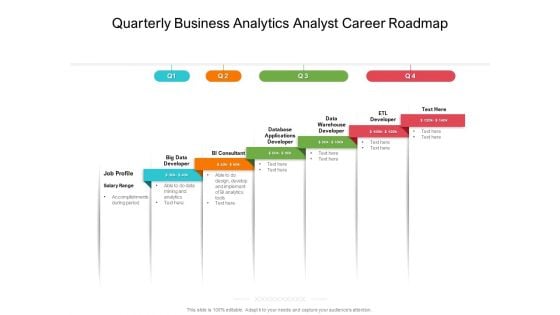
Quarterly Business Analytics Analyst Career Roadmap Themes
We present our quarterly business analytics analyst career roadmap themes. This PowerPoint layout is easy-to-edit so you can change the font size, font type, color, and shape conveniently. In addition to this, the PowerPoint layout is Google Slides compatible, so you can share it with your audience and give them access to edit it. Therefore, download and save this well-researched quarterly business analytics analyst career roadmap themes in different formats like PDF, PNG, and JPG to smoothly execute your business plan.

Ebitda Data Analytics Company Outline Topics PDF
This slide illustrates a graph of EBITDA for Kantar company showing growth trend in from 2021. It also showcases key insights for EBITDA highlighting estimated EBITDA for 2022 and 2023. Present like a pro with Ebitda Data Analytics Company Outline Topics PDF Create beautiful presentations together with your team, using our easy-to-use presentation slides. Share your ideas in real-time and make changes on the fly by downloading our templates. So whether you are in the office, on the go, or in a remote location, you can stay in sync with your team and present your ideas with confidence. With Slidegeeks presentation got a whole lot easier. Grab these presentations today. This slide illustrates a graph of EBITDA for Kantar company showing growth trend in from 2021. It also showcases key insights for EBITDA highlighting estimated EBITDA for 2022 and 2023
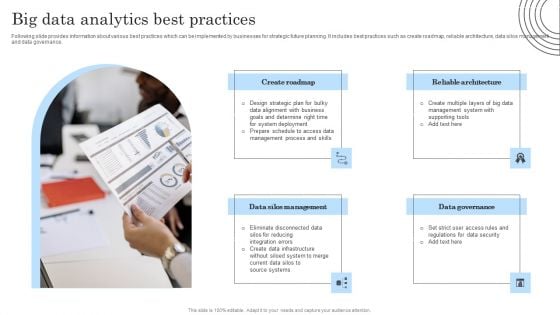
Big Data Analytics Best Practices Mockup PDF
Following slide provides information about various best practices which can be implemented by businesses for strategic future planning. It includes best practices such as create roadmap, reliable architecture, data silos management and data governance. Persuade your audience using this Big Data Analytics Best Practices Mockup PDF. This PPT design covers four stages, thus making it a great tool to use. It also caters to a variety of topics including Data Governance, Reliable Architecture, Data Silos Management. Download this PPT design now to present a convincing pitch that not only emphasizes the topic but also showcases your presentation skills.
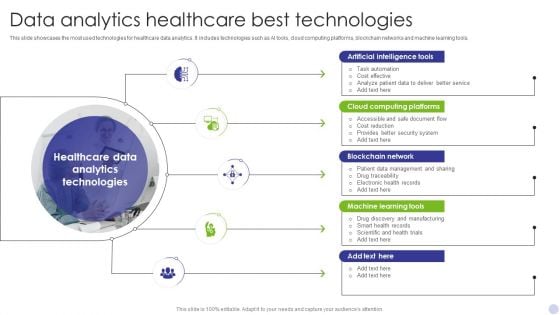
Data Analytics Healthcare Best Technologies Template PDF
This slide showcases the most used technologies for healthcare data analytics. It includes technologies such as AI tools, cloud computing platforms, blockchain networks and machine learning tools. Presenting Data Analytics Healthcare Best Technologies Template PDF to dispense important information. This template comprises Five stages. It also presents valuable insights into the topics including Artificial Intelligence Tools, Cloud Computing Platforms, Blockchain Network. This is a completely customizable PowerPoint theme that can be put to use immediately. So, download it and address the topic impactfully.
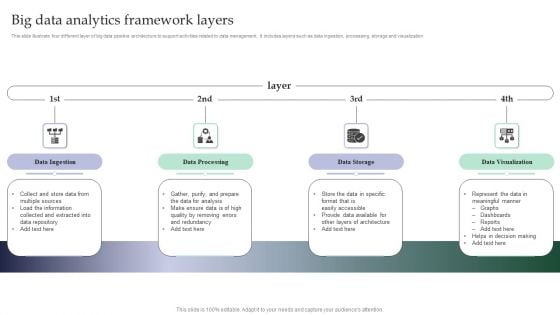
Big Data Analytics Framework Layers Formats PDF
This slide illustrate four different layer of big data pipeline architecture to support activities related to data management. It includes layers such as data ingestion, processing, storage and visualization Persuade your audience using this Benefits Of Big Data And Analytics Framework For Organization Development Guidelines PDF. This PPT design covers four stages, thus making it a great tool to use. It also caters to a variety of topics including Data Ingestion, Data Processing, Data Storage. Download this PPT design now to present a convincing pitch that not only emphasizes the topic but also showcases your presentation skills.
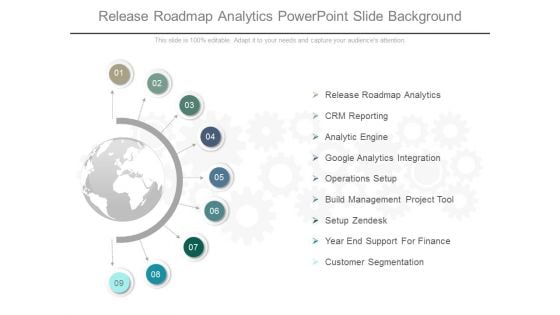
Release Roadmap Analytics Powerpoint Slide Background
This is a release roadmap analytics powerpoint slide background. This is a nine stage process. The stages in this process are release roadmap analytics, crm reporting, analytic engine, google analytics integration, operations setup, build management project tool, setup zendesk, year end support for finance, customer segmentation.
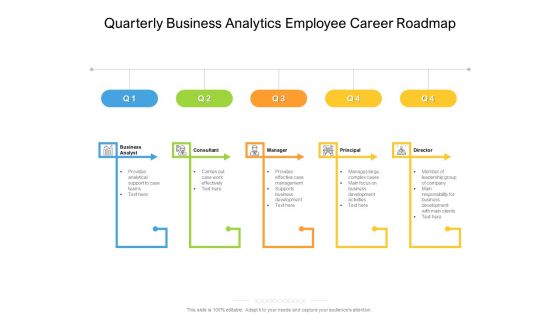
Quarterly Business Analytics Employee Career Roadmap Graphics
Presenting the quarterly business analytics employee career roadmap graphics. The template includes a roadmap that can be used to initiate a strategic plan. Not only this, the PowerPoint slideshow is completely editable and you can effortlessly modify the font size, font type, and shapes according to your needs. This PPT slide can be easily reached in standard screen and widescreen aspect ratios. The set is also available in various formats like PDF, PNG, and JPG. So download and use it multiple times as per your knowledge.
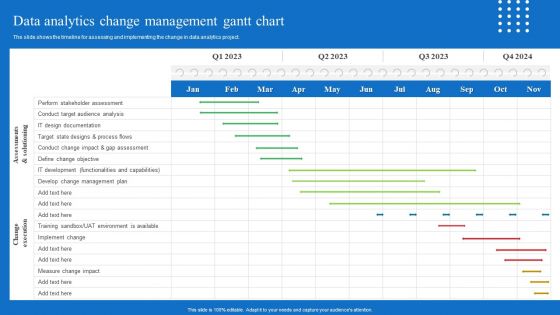
Toolkit For Data Science And Analytics Transition Data Analytics Change Management Gantt Chart Portrait PDF
The slide shows the timeline for assessing and implementing the change in data analytics project. Get a simple yet stunning designed Toolkit For Data Science And Analytics Transition Data Analytics Change Management Gantt Chart Portrait PDF It is the best one to establish the tone in your meetings. It is an excellent way to make your presentations highly effective. So, download this PPT today from Slidegeeks and see the positive impacts. Our easy to edit Toolkit For Data Science And Analytics Transition Data Analytics Change Management Gantt Chart Portrait PDF can be your go to option for all upcoming conferences and meetings. So, what are you waiting for Grab this template today.
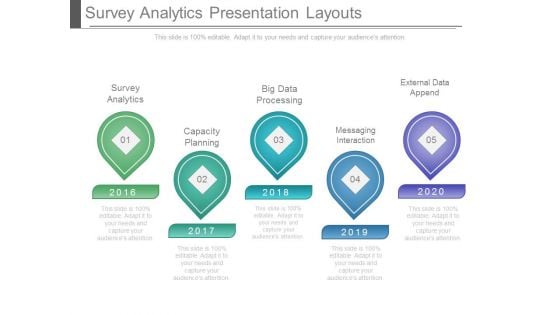
Survey Analytics Presentation Layouts
This is a survey analytics presentation layouts. This is a five stage process. The stages in this process are survey analytics, capacity planning, big data processing, messaging interaction, external data append.
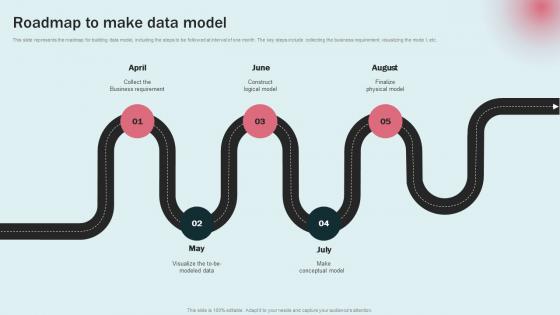
Roadmap To Make Data Model Data Modeling Approaches For Modern Analytics Guidelines Pdf
This slide represents the roadmap for building data model, including the steps to be followed at interval of one month. The key steps include collecting the business requirement, visualizing the mode l, etc. Retrieve professionally designed Roadmap To Make Data Model Data Modeling Approaches For Modern Analytics Guidelines Pdf to effectively convey your message and captivate your listeners. Save time by selecting pre made slideshows that are appropriate for various topics, from business to educational purposes. These themes come in many different styles, from creative to corporate, and all of them are easily adjustable and can be edited quickly. Access them as PowerPoint templates or as Google Slides themes. You do not have to go on a hunt for the perfect presentation because Slidegeeks got you covered from everywhere. This slide represents the roadmap for building data model, including the steps to be followed at interval of one month. The key steps include collecting the business requirement, visualizing the mode l, etc.
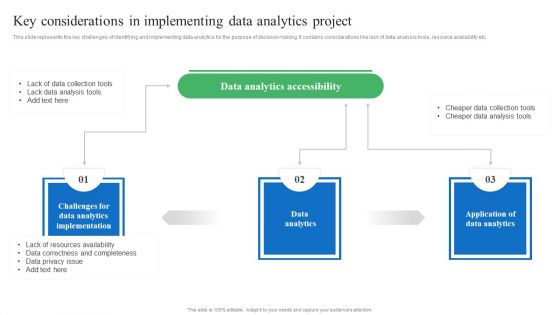
Toolkit For Data Science And Analytics Transition Key Considerations In Implementing Data Analytics Project Download PDF
This slide represents the key challenges of identifying and implementing data analytics for the purpose of decision making. It contains considerations like lack of data analysis tools, resource availability etc. From laying roadmaps to briefing everything in detail, our templates are perfect for you. You can set the stage with your presentation slides. All you have to do is download these easy to edit and customizable templates. Toolkit For Data Science And Analytics Transition Key Considerations In Implementing Data Analytics Project Download PDF will help you deliver an outstanding performance that everyone would remember and praise you for. Do download this presentation today.
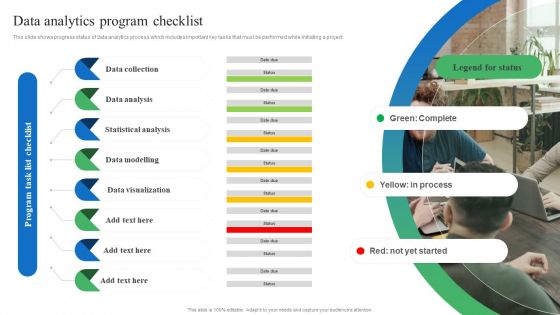
Toolkit For Data Science And Analytics Transition Data Analytics Program Checklist Portrait PDF
This slide shows progress status of data analytics process which includes important key tasks that must be performed while initiating a project. From laying roadmaps to briefing everything in detail, our templates are perfect for you. You can set the stage with your presentation slides. All you have to do is download these easy to edit and customizable templates. Toolkit For Data Science And Analytics Transition Data Analytics Program Checklist Portrait PDF will help you deliver an outstanding performance that everyone would remember and praise you for. Do download this presentation today.
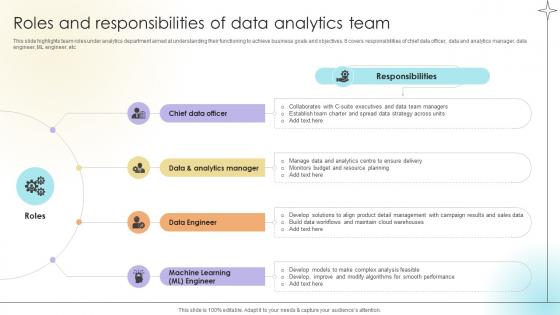
Roles And Responsibilities Of Data Analytics Team Data Analytics SS V
This slide highlights team roles under analytics department aimed at understanding their functioning to achieve business goals and objectives. It covers responsibilities of chief data officer, data and analytics manager, data engineer, ML engineer, etc.This Roles And Responsibilities Of Data Analytics Team Data Analytics SS V from Slidegeeks makes it easy to present information on your topic with precision. It provides customization options, so you can make changes to the colors, design, graphics, or any other component to create a unique layout. It is also available for immediate download, so you can begin using it right away. Slidegeeks has done good research to ensure that you have everything you need to make your presentation stand out. Make a name out there for a brilliant performance. This slide highlights team roles under analytics department aimed at understanding their functioning to achieve business goals and objectives. It covers responsibilities of chief data officer, data and analytics manager, data engineer, ML engineer, etc.
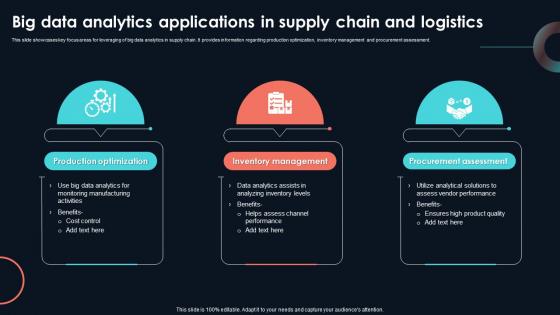
Big Data Analytics Applications In Supply Developing Strategic Insights Using Big Data Analytics SS V
This slide showcases key focus areas for leveraging of big data analytics in supply chain. It provides information regarding production optimization, inventory management and procurement assessment. Find highly impressive Big Data Analytics Applications In Supply Developing Strategic Insights Using Big Data Analytics SS V on Slidegeeks to deliver a meaningful presentation. You can save an ample amount of time using these presentation templates. No need to worry to prepare everything from scratch because Slidegeeks experts have already done a huge research and work for you. You need to download Big Data Analytics Applications In Supply Developing Strategic Insights Using Big Data Analytics SS V for your upcoming presentation. All the presentation templates are 100 percent editable and you can change the color and personalize the content accordingly. Download now This slide showcases key focus areas for leveraging of big data analytics in supply chain. It provides information regarding production optimization, inventory management and procurement assessment.
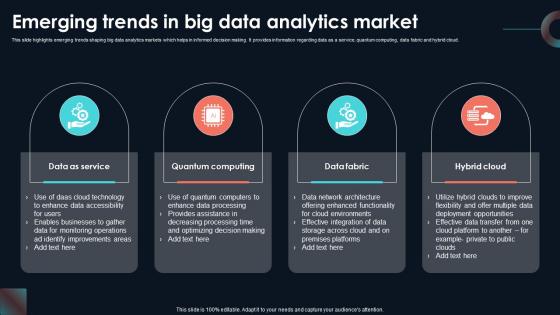
Emerging Trends In Big Data Analytics Developing Strategic Insights Using Big Data Analytics SS V
This slide highlights emerging trends shaping big data analytics markets which helps in informed decision making. It provides information regarding data as a service, quantum computing, data fabric and hybrid cloud. The Emerging Trends In Big Data Analytics Developing Strategic Insights Using Big Data Analytics SS V is a compilation of the most recent design trends as a series of slides. It is suitable for any subject or industry presentation, containing attractive visuals and photo spots for businesses to clearly express their messages. This template contains a variety of slides for the user to input data, such as structures to contrast two elements, bullet points, and slides for written information. Slidegeeks is prepared to create an impression. This slide highlights emerging trends shaping big data analytics markets which helps in informed decision making. It provides information regarding data as a service, quantum computing, data fabric and hybrid cloud.
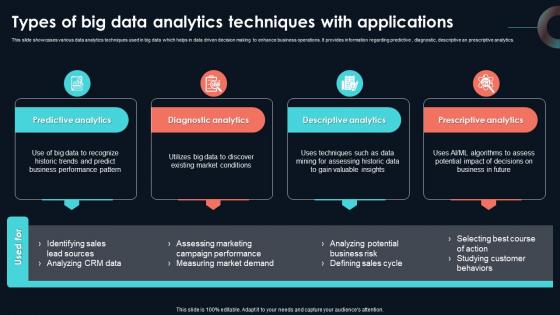
Types Of Big Data Analytics Techniques With Developing Strategic Insights Using Big Data Analytics SS V
This slide showcases various data analytics techniques used in big data which helps in data driven decision making to enhance business operations. It provides information regarding predictive , diagnostic, descriptive an prescriptive analytics. This slide showcases various data analytics techniques used in big data which helps in data driven decision making to enhance business operations. It provides information regarding predictive , diagnostic, descriptive an prescriptive analytics. Do you know about Slidesgeeks Types Of Big Data Analytics Techniques With Developing Strategic Insights Using Big Data Analytics SS V These are perfect for delivering any kind od presentation. Using it, create PowerPoint presentations that communicate your ideas and engage audiences. Save time and effort by using our pre-designed presentation templates that are perfect for a wide range of topic. Our vast selection of designs covers a range of styles, from creative to business, and are all highly customizable and easy to edit. Download as a PowerPoint template or use them as Google Slides themes. This slide showcases various data analytics techniques used in big data which helps in data driven decision making to enhance business operations. It provides information regarding predictive , diagnostic, descriptive an prescriptive analytics.
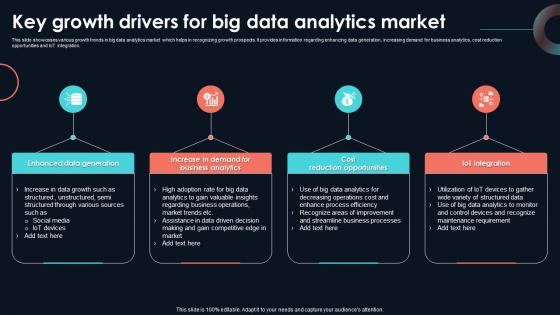
Key Growth Drivers For Big Data Analytics Developing Strategic Insights Using Big Data Analytics SS V
This slide showcases various growth trends in big data analytics market which helps in recognizing growth prospects. It provides information regarding enhancing data generation, increasing demand for business analytics, cost reduction opportunities and IoT integration. Do you have an important presentation coming up Are you looking for something that will make your presentation stand out from the rest Look no further than Key Growth Drivers For Big Data Analytics Developing Strategic Insights Using Big Data Analytics SS V. With our professional designs, you can trust that your presentation will pop and make delivering it a smooth process. And with Slidegeeks, you can trust that your presentation will be unique and memorable. So why wait Grab Key Growth Drivers For Big Data Analytics Developing Strategic Insights Using Big Data Analytics SS V today and make your presentation stand out from the rest This slide showcases various growth trends in big data analytics market which helps in recognizing growth prospects. It provides information regarding enhancing data generation, increasing demand for business analytics, cost reduction opportunities and IoT integration.
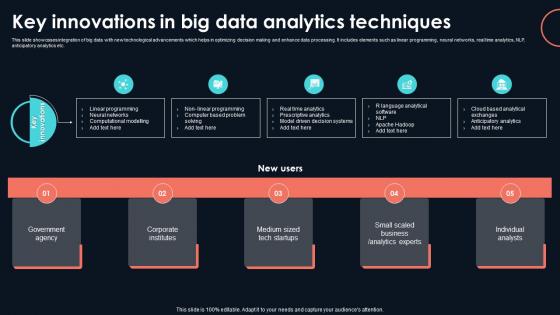
Key Innovations In Big Data Analytics Developing Strategic Insights Using Big Data Analytics SS V
This slide showcases integration of big data with new technological advancements which helps in optimizing decision making and enhance data processing. It includes elements such as linear programming, neural networks, real time analytics, NLP, anticipatory analytics etc. Whether you have daily or monthly meetings, a brilliant presentation is necessary. Key Innovations In Big Data Analytics Developing Strategic Insights Using Big Data Analytics SS V can be your best option for delivering a presentation. Represent everything in detail using Key Innovations In Big Data Analytics Developing Strategic Insights Using Big Data Analytics SS V and make yourself stand out in meetings. The template is versatile and follows a structure that will cater to your requirements. All the templates prepared by Slidegeeks are easy to download and edit. Our research experts have taken care of the corporate themes as well. So, give it a try and see the results. This slide showcases integration of big data with new technological advancements which helps in optimizing decision making and enhance data processing. It includes elements such as linear programming, neural networks, real time analytics, NLP, anticipatory analytics etc.
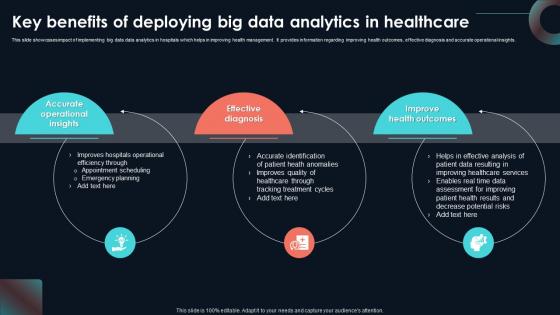
Key Benefits Of Deploying Big Data Analytics Developing Strategic Insights Using Big Data Analytics SS V
This slide showcases impact of implementing big data data analytics in hospitals which helps in improving health management. It provides information regarding improving health outcomes, effective diagnosis and accurate operational insights. There are so many reasons you need a Key Benefits Of Deploying Big Data Analytics Developing Strategic Insights Using Big Data Analytics SS V. The first reason is you can not spend time making everything from scratch, Thus, Slidegeeks has made presentation templates for you too. You can easily download these templates from our website easily. This slide showcases impact of implementing big data data analytics in hospitals which helps in improving health management. It provides information regarding improving health outcomes, effective diagnosis and accurate operational insights.
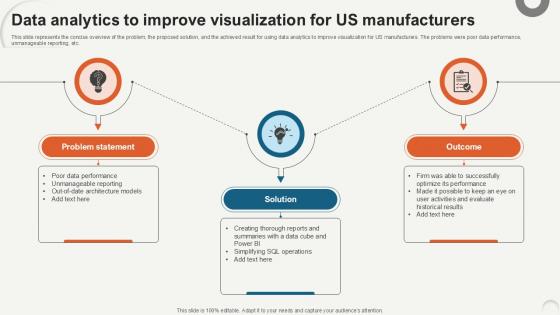
Data Analytics To Improve Visualization Data Analytics For Informed Decision Ppt PowerPoint
This slide represents the concise overview of the problem, the proposed solution, and the achieved result for using data analytics to improve visualization for US manufacturers. The problems were poor data performance, unmanageable reporting, etc. Whether you have daily or monthly meetings, a brilliant presentation is necessary. Data Analytics To Improve Visualization Data Analytics For Informed Decision Ppt PowerPoint can be your best option for delivering a presentation. Represent everything in detail using Data Analytics To Improve Visualization Data Analytics For Informed Decision Ppt PowerPoint and make yourself stand out in meetings. The template is versatile and follows a structure that will cater to your requirements. All the templates prepared by Slidegeeks are easy to download and edit. Our research experts have taken care of the corporate themes as well. So, give it a try and see the results. This slide represents the concise overview of the problem, the proposed solution, and the achieved result for using data analytics to improve visualization for US manufacturers. The problems were poor data performance, unmanageable reporting, etc.

PESTEL Analysis For Big Data Analytics Developing Strategic Insights Using Big Data Analytics SS V
This slide showcases PESTEL assessment for big data analytics market which helps in strategic business planning and optimizing process efficiency. It provides information regarding political, economic, social, technological , environmental and legal factors. This modern and well-arranged PESTEL Analysis For Big Data Analytics Developing Strategic Insights Using Big Data Analytics SS V provides lots of creative possibilities. It is very simple to customize and edit with the Powerpoint Software. Just drag and drop your pictures into the shapes. All facets of this template can be edited with Powerpoint, no extra software is necessary. Add your own material, put your images in the places assigned for them, adjust the colors, and then you can show your slides to the world, with an animated slide included. This slide showcases PESTEL assessment for big data analytics market which helps in strategic business planning and optimizing process efficiency. It provides information regarding political, economic, social, technological , environmental and legal factors.
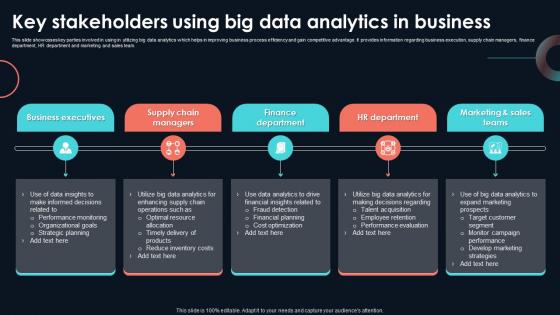
Key Stakeholders Using Big Data Analytics Developing Strategic Insights Using Big Data Analytics SS V
This slide showcases key parties involved in using in utilizing big data analytics which helps in improving business process efficiency and gain competitive advantage. It provides information regarding business execution, supply chain managers, finance department, HR department and marketing and sales team. If your project calls for a presentation, then Slidegeeks is your go-to partner because we have professionally designed, easy-to-edit templates that are perfect for any presentation. After downloading, you can easily edit Key Stakeholders Using Big Data Analytics Developing Strategic Insights Using Big Data Analytics SS V and make the changes accordingly. You can rearrange slides or fill them with different images. Check out all the handy templates This slide showcases key parties involved in using in utilizing big data analytics which helps in improving business process efficiency and gain competitive advantage. It provides information regarding business execution, supply chain managers, finance department, HR department and marketing and sales team.
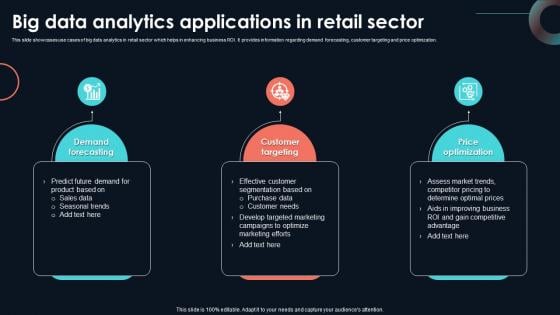
Big Data Analytics Applications In Retail Developing Strategic Insights Using Big Data Analytics SS V
This slide showcases use cases of big data analytics in retail sector which helps in enhancing business ROI. It provides information regarding demand forecasting, customer targeting and price optimization. Whether you have daily or monthly meetings, a brilliant presentation is necessary. Big Data Analytics Applications In Retail Developing Strategic Insights Using Big Data Analytics SS V can be your best option for delivering a presentation. Represent everything in detail using Big Data Analytics Applications In Retail Developing Strategic Insights Using Big Data Analytics SS V and make yourself stand out in meetings. The template is versatile and follows a structure that will cater to your requirements. All the templates prepared by Slidegeeks are easy to download and edit. Our research experts have taken care of the corporate themes as well. So, give it a try and see the results. This slide showcases use cases of big data analytics in retail sector which helps in enhancing business ROI. It provides information regarding demand forecasting, customer targeting and price optimization.

Brief Introduction To Data Integration For Analytics Data Analytics SS V
This slide provides an introduction to data integration aimed at helping businesses gather and consolidate data for effective decision making. It covers the description as well as benefits of implementing data integration.Welcome to our selection of the Brief Introduction To Data Integration For Analytics Data Analytics SS V. These are designed to help you showcase your creativity and bring your sphere to life. Planning and Innovation are essential for any business that is just starting out. This collection contains the designs that you need for your everyday presentations. All of our PowerPoints are 100 percent editable, so you can customize them to suit your needs. This multi-purpose template can be used in various situations. Grab these presentation templates today. This slide provides an introduction to data integration aimed at helping businesses gather and consolidate data for effective decision making. It covers the description as well as benefits of implementing data integration.
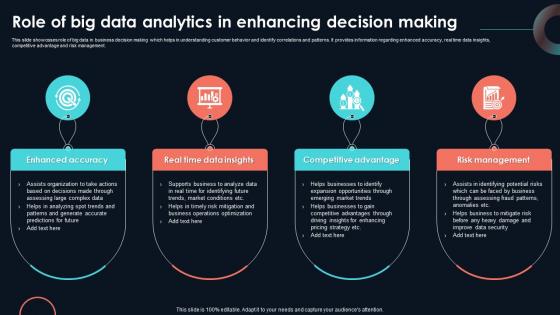
Role Of Big Data Analytics In Enhancing Developing Strategic Insights Using Big Data Analytics SS V
This slide showcases role of big data in business decision making which helps in understanding customer behavior and identify correlations and patterns. It provides information regarding enhanced accuracy, real time data insights, competitive advantage and risk management. Explore a selection of the finest Role Of Big Data Analytics In Enhancing Developing Strategic Insights Using Big Data Analytics SS V here. With a plethora of professionally designed and pre-made slide templates, you can quickly and easily find the right one for your upcoming presentation. You can use our Role Of Big Data Analytics In Enhancing Developing Strategic Insights Using Big Data Analytics SS V to effectively convey your message to a wider audience. Slidegeeks has done a lot of research before preparing these presentation templates. The content can be personalized and the slides are highly editable. Grab templates today from Slidegeeks. This slide showcases role of big data in business decision making which helps in understanding customer behavior and identify correlations and patterns. It provides information regarding enhanced accuracy, real time data insights, competitive advantage and risk management.
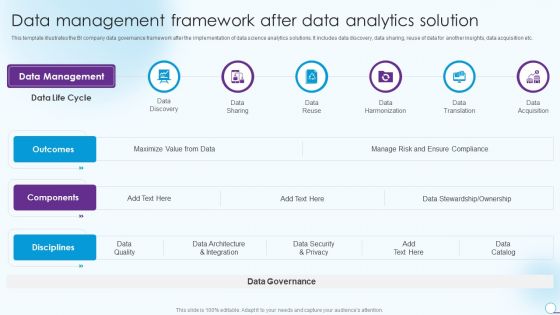
Information Analytics And Ml Strategy Playbook Data Management Framework After Data Analytics Solution Introduction PDF
This template illustrates the BI company data governance framework after the implementation of data science analytics solutions. It includes data discovery, data sharing, reuse of data for another insights, data acquisition etc. Presenting Information Analytics And Ml Strategy Playbook Data Management Framework After Data Analytics Solution Introduction PDF to provide visual cues and insights. Share and navigate important information on six stages that need your due attention. This template can be used to pitch topics like Data Management, Data Harmonization, Data Translation. In addtion, this PPT design contains high resolution images, graphics, etc, that are easily editable and available for immediate download.
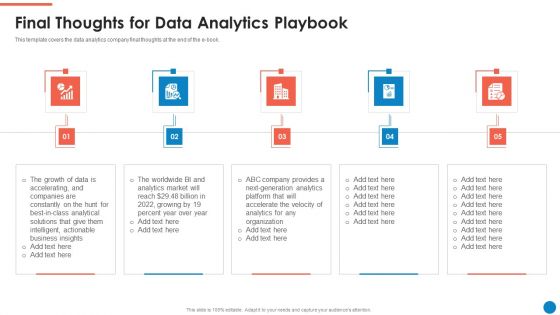
Data And Analytics Playbook Final Thoughts For Data Analytics Playbook Summary PDF
This template covers the data analytics company final thoughts at the end of the e-book. Presenting Data And Analytics Playbook Final Thoughts For Data Analytics Playbook Summary PDF to provide visual cues and insights. Share and navigate important information on five stages that need your due attention. This template can be used to pitch topics like Growth Data, Actionable Business Insights, Market. In addtion, this PPT design contains high resolution images, graphics, etc, that are easily editable and available for immediate download.
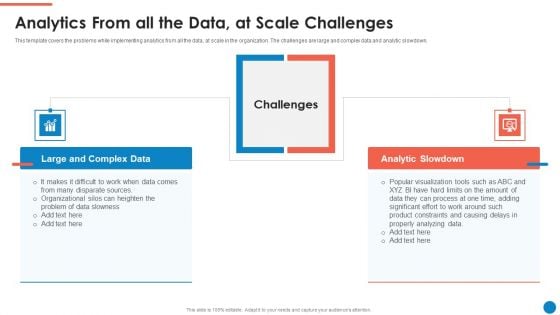
Data And Analytics Playbook Analytics From All The Data At Scale Challenges Summary PDF
This template covers the problems while implementing analytics from all the data, at scale in the organization. The challenges are large and complex data and analytic slowdown. This is a Data And Analytics Playbook Analytics From All The Data At Scale Challenges Summary PDF template with various stages. Focus and dispense information on two stages using this creative set, that comes with editable features. It contains large content boxes to add your information on topics like Large And Complex Data, Analytic Slowdown, Challenges, Data Slowness. You can also showcase facts, figures, and other relevant content using this PPT layout. Grab it now.
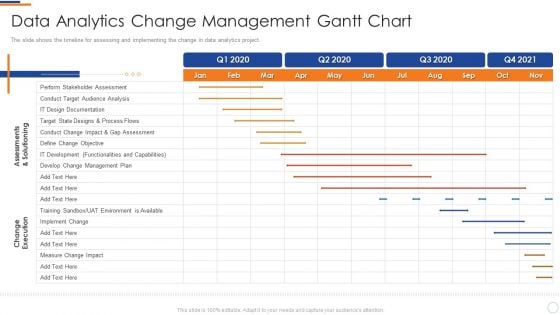
Business Intelligence And Big Data Analytics Data Analytics Change Management Gantt Pictures PDF
The slide shows the timeline for assessing and implementing the change in data analytics project. Deliver and pitch your topic in the best possible manner with this business intelligence and big data analytics data analytics change management gantt pictures pdf. Use them to share invaluable insights on change execution, assessments and solutioning, develop change management plan and impress your audience. This template can be altered and modified as per your expectations. So, grab it now.

Toolkit For Data Science And Analytics Transition Data Analytics Value Stream Chain Pictures PDF
This slide illustrates the series of activities required for analyzing the data. It contains information such as data preparation, exploratory analysis, and predictive analytics etc. If you are looking for a format to display your unique thoughts, then the professionally designed Toolkit For Data Science And Analytics Transition Data Analytics Value Stream Chain Pictures PDF is the one for you. You can use it as a Google Slides template or a PowerPoint template. Incorporate impressive visuals, symbols, images, and other charts. Modify or reorganize the text boxes as you desire. Experiment with shade schemes and font pairings. Alter, share or cooperate with other people on your work. Download Toolkit For Data Science And Analytics Transition Data Analytics Value Stream Chain Pictures PDF and find out how to give a successful presentation. Present a perfect display to your team and make your presentation unforgettable.
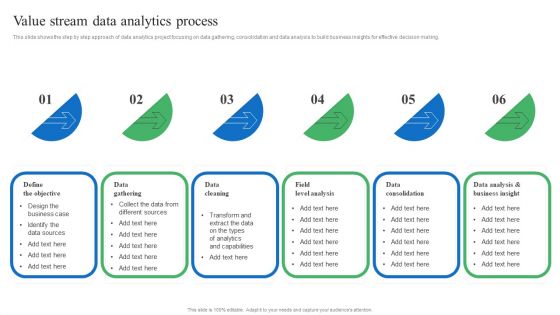
Toolkit For Data Science And Analytics Transition Value Stream Data Analytics Process Background PDF
This slide shows the step by step approach of data analytics project focusing on data gathering, consolidation and data analysis to build business insights for effective decision making. Find highly impressive Toolkit For Data Science And Analytics Transition Value Stream Data Analytics Process Background PDF on Slidegeeks to deliver a meaningful presentation. You can save an ample amount of time using these presentation templates. No need to worry to prepare everything from scratch because Slidegeeks experts have already done a huge research and work for you. You need to download Toolkit For Data Science And Analytics Transition Value Stream Data Analytics Process Background PDF for your upcoming presentation. All the presentation templates are 100 percent editable and you can change the color and personalize the content accordingly. Download now.
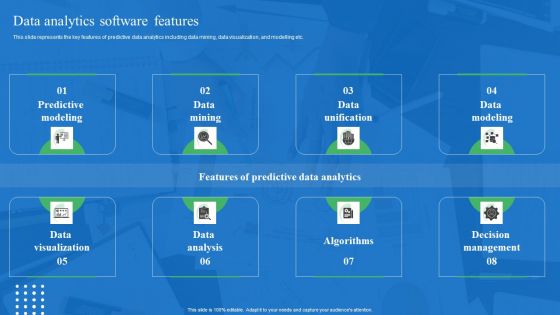
Toolkit For Data Science And Analytics Transition Data Analytics Software Features Inspiration PDF
This slide represents the key features of predictive data analytics including data mining, data visualization, and modelling etc. Do you have to make sure that everyone on your team knows about any specific topic I yes, then you should give Toolkit For Data Science And Analytics Transition Data Analytics Software Features Inspiration PDF a try. Our experts have put a lot of knowledge and effort into creating this impeccable Toolkit For Data Science And Analytics Transition Data Analytics Software Features Inspiration PDF. You can use this template for your upcoming presentations, as the slides are perfect to represent even the tiniest detail. You can download these templates from the Slidegeeks website and these are easy to edit. So grab these today.
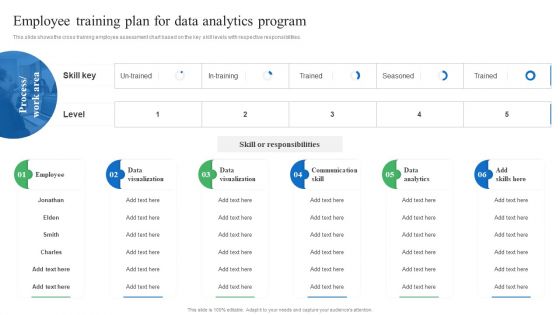
Toolkit For Data Science And Analytics Transition Employee Training Plan For Data Analytics Program Microsoft PDF
This slide shows the cross training employee assessment chart based on the key skill levels with respective responsibilities. Do you have an important presentation coming up Are you looking for something that will make your presentation stand out from the rest Look no further than Toolkit For Data Science And Analytics Transition Employee Training Plan For Data Analytics Program Microsoft PDF. With our professional designs, you can trust that your presentation will pop and make delivering it a smooth process. And with Slidegeeks, you can trust that your presentation will be unique and memorable. So why wait Grab Toolkit For Data Science And Analytics Transition Employee Training Plan For Data Analytics Program Microsoft PDF today and make your presentation stand out from the rest.

Toolkit For Data Science And Analytics Transition Key Features Of Data Analytics Software Topics PDF
If your project calls for a presentation, then Slidegeeks is your go to partner because we have professionally designed, easy to edit templates that are perfect for any presentation. After downloading, you can easily edit Toolkit For Data Science And Analytics Transition Key Features Of Data Analytics Software Topics PDF and make the changes accordingly. You can rearrange slides or fill them with different images. Check out all the handy templates.
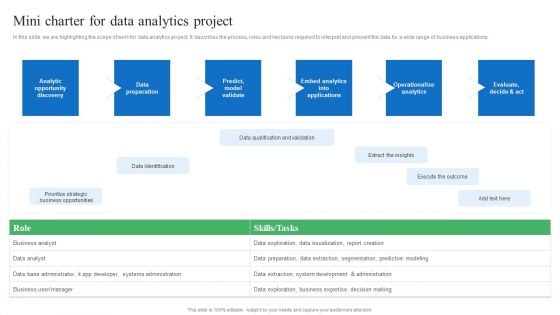
Toolkit For Data Science And Analytics Transition Mini Charter For Data Analytics Project Introduction PDF
In this slide, we are highlighting the scope of work for data analytics project. It describes the process, roles and key tasks required to interpret and present the data for a wide range of business applications. Slidegeeks is here to make your presentations a breeze with Toolkit For Data Science And Analytics Transition Mini Charter For Data Analytics Project Introduction PDF With our easy to use and customizable templates, you can focus on delivering your ideas rather than worrying about formatting. With a variety of designs to choose from, you are sure to find one that suits your needs. And with animations and unique photos, illustrations, and fonts, you can make your presentation pop. So whether you are giving a sales pitch or presenting to the board, make sure to check out Slidegeeks first.
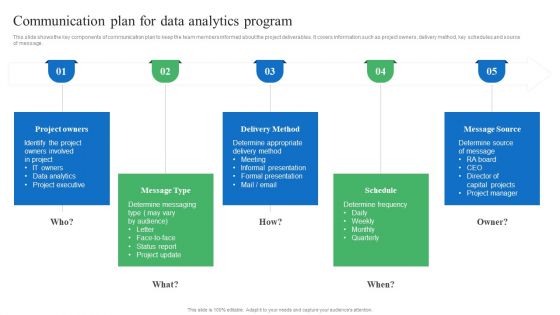
Toolkit For Data Science And Analytics Transition Communication Plan For Data Analytics Program Designs PDF
This slide shows the key components of communication plan to keep the team members informed about the project deliverables. It covers information such as project owners, delivery method, key schedules and source of message. There are so many reasons you need a Toolkit For Data Science And Analytics Transition Communication Plan For Data Analytics Program Designs PDF. The first reason is you can not spend time making everything from scratch, Thus, Slidegeeks has made presentation templates for you too. You can easily download these templates from our website easily.
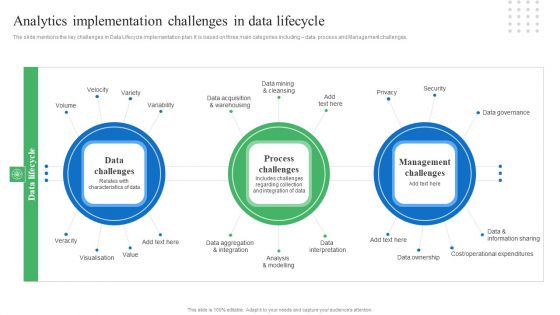
Toolkit For Data Science And Analytics Transition Analytics Implementation Challenges In Data Lifecycle Download PDF
The slide mentions the key challenges in Data Lifecycle implementation plan. It is based on three main categories including data, process and Management challenges. This Toolkit For Data Science And Analytics Transition Analytics Implementation Challenges In Data Lifecycle Download PDF from Slidegeeks makes it easy to present information on your topic with precision. It provides customization options, so you can make changes to the colors, design, graphics, or any other component to create a unique layout. It is also available for immediate download, so you can begin using it right away. Slidegeeks has done good research to ensure that you have everything you need to make your presentation stand out. Make a name out there for a brilliant performance.
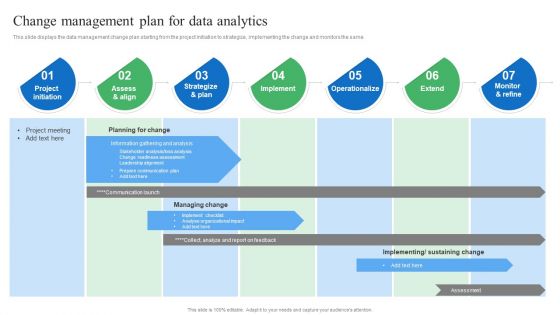
Toolkit For Data Science And Analytics Transition Change Management Plan For Data Analytics Structure PDF
This slide displays the data management change plan starting from the project initiation to strategize, implementing the change and monitors the same. Do you know about Slidesgeeks Toolkit For Data Science And Analytics Transition Change Management Plan For Data Analytics Structure PDF These are perfect for delivering any kind od presentation. Using it, create PowerPoint presentations that communicate your ideas and engage audiences. Save time and effort by using our pre designed presentation templates that are perfect for a wide range of topic. Our vast selection of designs covers a range of styles, from creative to business, and are all highly customizable and easy to edit. Download as a PowerPoint template or use them as Google Slides themes.
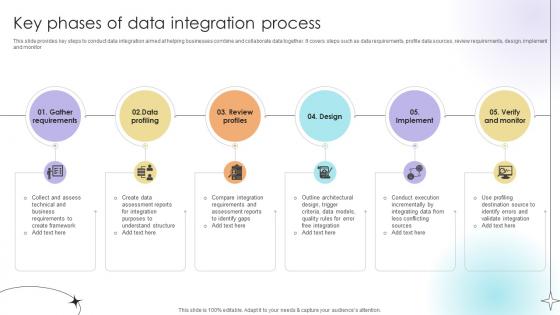
Key Phases Of Data Integration Process Data Analytics SS V
This slide provides key steps to conduct data integration aimed at helping businesses combine and collaborate data together. It covers steps such as data requirements, profile data sources, review requirements, design, implement and monitor.Slidegeeks is here to make your presentations a breeze with Key Phases Of Data Integration Process Data Analytics SS V With our easy-to-use and customizable templates, you can focus on delivering your ideas rather than worrying about formatting. With a variety of designs to choose from, you are sure to find one that suits your needs. And with animations and unique photos, illustrations, and fonts, you can make your presentation pop. So whether you are giving a sales pitch or presenting to the board, make sure to check out Slidegeeks first This slide provides key steps to conduct data integration aimed at helping businesses combine and collaborate data together. It covers steps such as data requirements, profile data sources, review requirements, design, implement and monitor.
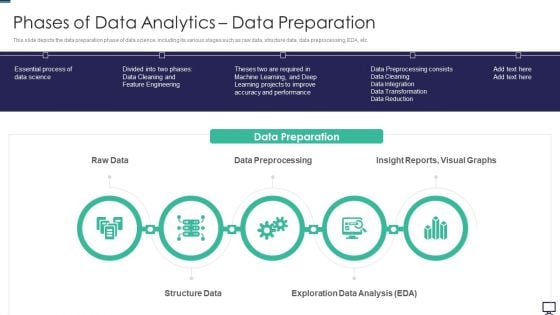
Phases Of Data Analytics Data Preparation Ppt Summary Clipart PDF
This slide depicts the data preparation phase of data science, including its various stages such as raw data, structure data, data preprocessing, EDA, etc. Presenting phases of data analytics data preparation ppt summary clipart pdf to provide visual cues and insights. Share and navigate important information on five stages that need your due attention. This template can be used to pitch topics like data preprocessing, structure data, exploration data analysis. In addtion, this PPT design contains high resolution images, graphics, etc, that are easily editable and available for immediate download.
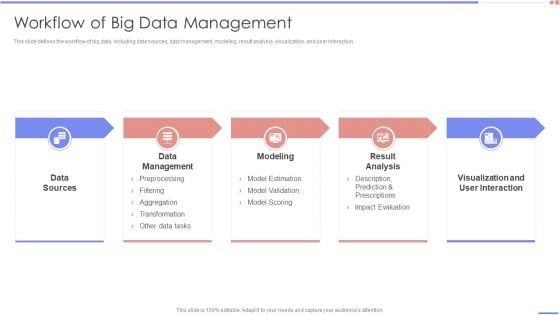
Data Analytics Management Workflow Of Big Data Management Infographics PDF
This slide defines the workflow of big data, including data sources, data management, modeling, result analysis, visualization, and user interaction.This is a Data Analytics Management Workflow Of Big Data Management Infographics PDF template with various stages. Focus and dispense information on five stages using this creative set, that comes with editable features. It contains large content boxes to add your information on topics like Data Management, Visualization Interaction, Result Analysis. You can also showcase facts, figures, and other relevant content using this PPT layout. Grab it now.
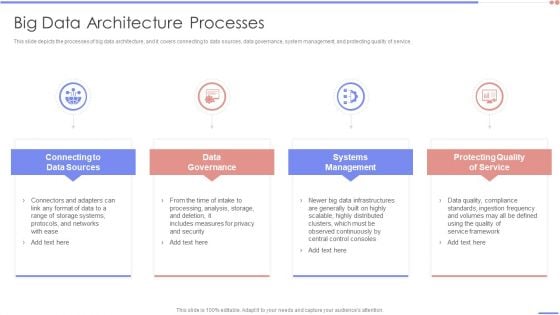
Data Analytics Management Big Data Architecture Processes Information PDF
This slide depicts the processes of big data architecture, and it covers connecting to data sources, data governance, system management, and protecting quality of service.Presenting Data Analytics Management Big Data Architecture Processes Information PDF to provide visual cues and insights. Share and navigate important information on four stages that need your due attention. This template can be used to pitch topics like Data Governance, Systems Management, Protecting Quality. In addtion, this PPT design contains high resolution images, graphics, etc, that are easily editable and available for immediate download.

Data Analytics Management Big Data Architecture Layers Introduction PDF
This slide describes the layers of big data architecture that include the big data source layer, management storage layer, analysis layer, and consumption layer.This is a Data Analytics Management Big Data Architecture Layers Introduction PDF template with various stages. Focus and dispense information on four stages using this creative set, that comes with editable features. It contains large content boxes to add your information on topics like Data Sources, Analysis Layer, Management Storage. You can also showcase facts, figures, and other relevant content using this PPT layout. Grab it now.
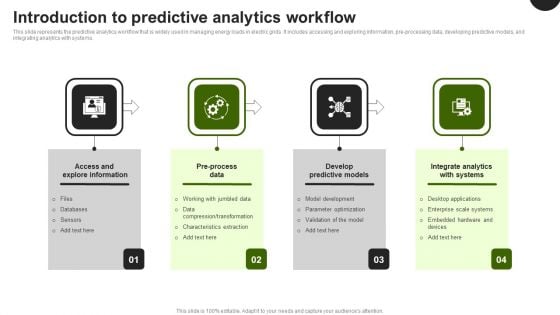
Predictive Analytics In The Age Of Big Data Introduction To Predictive Analytics Workflow Background PDF
This slide represents the predictive analytics workflow that is widely used in managing energy loads in electric grids. It includes accessing and exploring information, pre-processing data, developing predictive models, and integrating analytics with systems. From laying roadmaps to briefing everything in detail, our templates are perfect for you. You can set the stage with your presentation slides. All you have to do is download these easy to edit and customizable templates. Predictive Analytics In The Age Of Big Data Introduction To Predictive Analytics Workflow Background PDF will help you deliver an outstanding performance that everyone would remember and praise you for. Do download this presentation today.
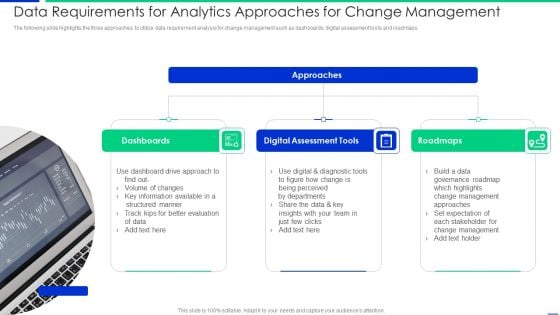
Data Requirements For Analytics Approaches For Change Management Topics PDF
The following slide highlights the three approaches to utilize data requirement analysis for change management such as dashboards, digital assessment tools and roadmaps. Presenting data requirements for analytics approaches for change management topics pdf to dispense important information. This template comprises three stages. It also presents valuable insights into the topics including dashboards, digital assessment tools, roadmaps. This is a completely customizable PowerPoint theme that can be put to use immediately. So, download it and address the topic impactfully.
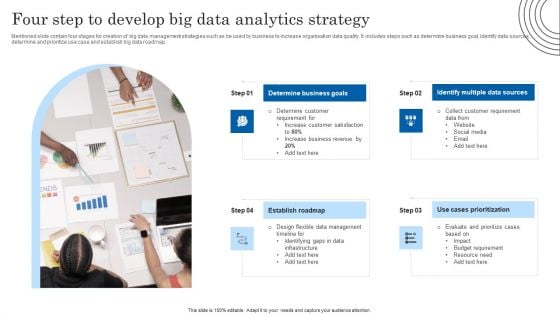
Four Step To Develop Big Data Analytics Strategy Designs PDF
Mentioned slide contain four stages for creation of big data management strategies such as be used by business to increase organisation data quality. It includes steps such as determine business goal, identify data sources, determine and prioritize use case and establish big data roadmap. Presenting Four Step To Develop Big Data Analytics Strategy Designs PDF to dispense important information. This template comprises four stages. It also presents valuable insights into the topics including Determine Business Goals, Multiple Data Sources, Cases Prioritization. This is a completely customizable PowerPoint theme that can be put to use immediately. So, download it and address the topic impactfully.
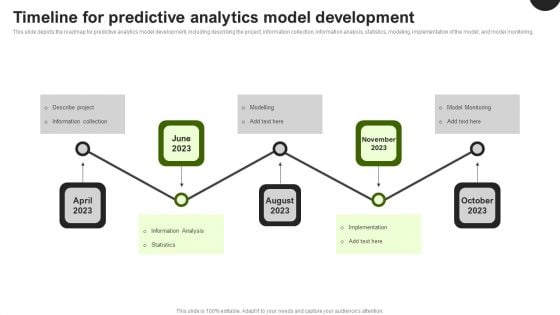
Predictive Analytics In The Age Of Big Data Timeline For Predictive Analytics Model Development Information PDF
This slide depicts the roadmap for predictive analytics model development, including describing the project, information collection, information analysis, statistics, modeling, implementation of the model, and model monitoring. There are so many reasons you need a Predictive Analytics In The Age Of Big Data Timeline For Predictive Analytics Model Development Information PDF. The first reason is you cannot spend time making everything from scratch, Thus, Slidegeeks has made presentation templates for you too. You can easily download these templates from our website easily.
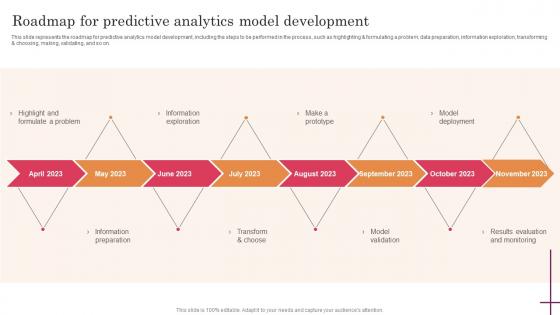
Roadmap For Predictive Analytics Model Predictive Analytics For Improved Rules Pdf
This slide represents the roadmap for predictive analytics model development, including the steps to be performed in the process, such as highlighting and formulating a problem, data preparation, information exploration, transforming and choosing, making, validating, and so on. Create an editable Roadmap For Predictive Analytics Model Predictive Analytics For Improved Rules Pdf that communicates your idea and engages your audience. Whether you are presenting a business or an educational presentation, pre-designed presentation templates help save time. Roadmap For Predictive Analytics Model Predictive Analytics For Improved Rules Pdf is highly customizable and very easy to edit, covering many different styles from creative to business presentations. Slidegeeks has creative team members who have crafted amazing templates. So, go and get them without any delay. This slide represents the roadmap for predictive analytics model development, including the steps to be performed in the process, such as highlighting and formulating a problem, data preparation, information exploration, transforming and choosing, making, validating, and so on.

Predictive Analytics For Empowering Roadmap For Predictive Analytics Model Inspiration Pdf
This slide represents the roadmap for predictive analytics model development, including the steps to be performed in the process, such as highlighting and formulating a problem, data preparation, information exploration, transforming and choosing, making, validating, and so on. Do you know about Slidesgeeks Predictive Analytics For Empowering Roadmap For Predictive Analytics Model Inspiration Pdf These are perfect for delivering any kind od presentation. Using it, create PowerPoint presentations that communicate your ideas and engage audiences. Save time and effort by using our pre-designed presentation templates that are perfect for a wide range of topic. Our vast selection of designs covers a range of styles, from creative to business, and are all highly customizable and easy to edit. Download as a PowerPoint template or use them as Google Slides themes. This slide represents the roadmap for predictive analytics model development, including the steps to be performed in the process, such as highlighting and formulating a problem, data preparation, information exploration, transforming and choosing, making, validating, and so on.
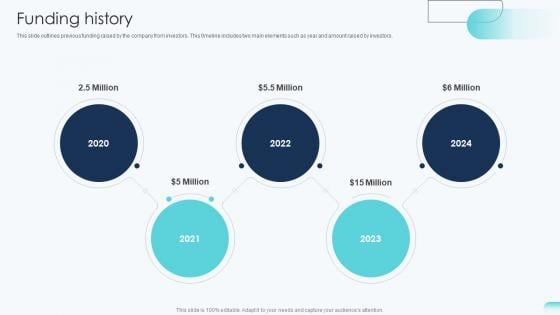
Funding History Big Data Analytics Investor Funding Elevator Pitch Deck
This slide outlines previous funding raised by the company from investors. This timeline includes two main elements such as year and amount raised by investors. Do you have an important presentation coming up Are you looking for something that will make your presentation stand out from the rest Look no further than Funding History Big Data Analytics Investor Funding Elevator Pitch Deck. With our professional designs, you can trust that your presentation will pop and make delivering it a smooth process. And with Slidegeeks, you can trust that your presentation will be unique and memorable. So why wait Grab Funding History Big Data Analytics Investor Funding Elevator Pitch Deck today and make your presentation stand out from the rest This slide outlines previous funding raised by the company from investors. This timeline includes two main elements such as year and amount raised by investors.
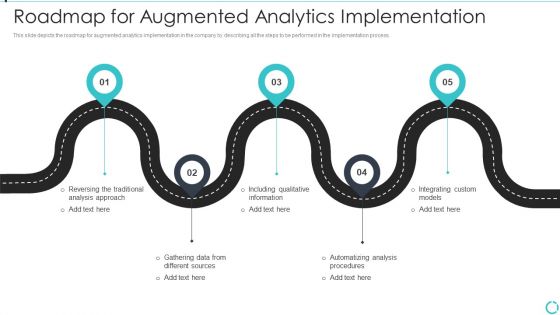
Augmented Analytics Implementation IT Roadmap For Augmented Analytics Implementation Ideas PDF
This slide depicts the roadmap for augmented analytics implementation in the company by describing all the steps to be performed in the implementation process. This is a Augmented Analytics Implementation IT Roadmap For Augmented Analytics Implementation Ideas PDF template with various stages. Focus and dispense information on five stages using this creative set, that comes with editable features. It contains large content boxes to add your information on topics like Reversing Traditional Analysis Approach, Gathering Data Different Sources, Including Qualitative Information. You can also showcase facts, figures, and other relevant content using this PPT layout. Grab it now.
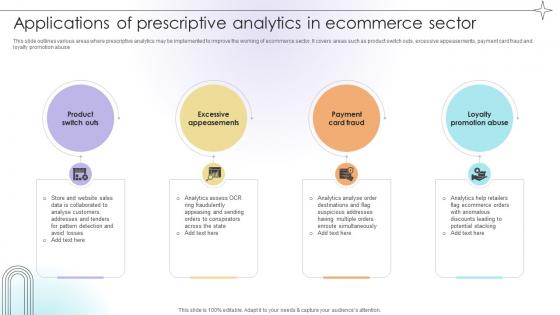
Applications Of Prescriptive Analytics In Ecommerce Sector Data Analytics SS V
This slide outlines various areas where prescriptive analytics may be implemented to improve the working of ecommerce sector. It covers areas such as product switch outs, excessive appeasements, payment card fraud and loyalty promotion abuse.From laying roadmaps to briefing everything in detail, our templates are perfect for you. You can set the stage with your presentation slides. All you have to do is download these easy-to-edit and customizable templates. Applications Of Prescriptive Analytics In Ecommerce Sector Data Analytics SS V will help you deliver an outstanding performance that everyone would remember and praise you for. Do download this presentation today. This slide outlines various areas where prescriptive analytics may be implemented to improve the working of ecommerce sector. It covers areas such as product switch outs, excessive appeasements, payment card fraud and loyalty promotion abuse.
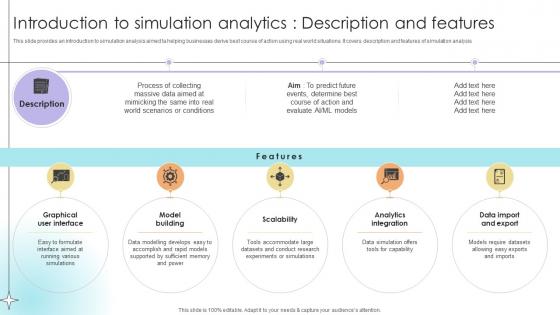
Introduction To Simulation Analytics Description And Features Data Analytics SS V
This slide provides an introduction to simulation analysis aimed ta helping businesses derive best course of action using real world situations. It covers description and features of simulation analysis. From laying roadmaps to briefing everything in detail, our templates are perfect for you. You can set the stage with your presentation slides. All you have to do is download these easy-to-edit and customizable templates. Introduction To Simulation Analytics Description And Features Data Analytics SS V will help you deliver an outstanding performance that everyone would remember and praise you for. Do download this presentation today. This slide provides an introduction to simulation analysis aimed ta helping businesses derive best course of action using real world situations. It covers description and features of simulation analysis
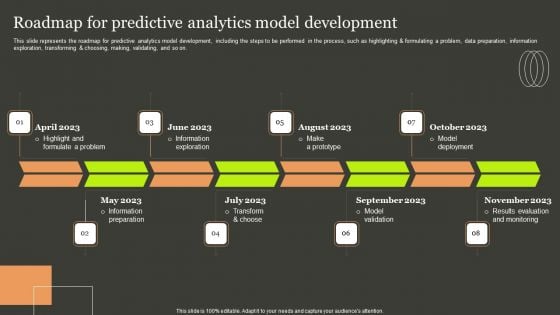
Predictive Analytics Methods Roadmap For Predictive Analytics Model Development Mockup PDF
This slide represents the roadmap for predictive analytics model development, including the steps to be performed in the process, such as highlighting and formulating a problem, data preparation, information exploration, transforming and choosing, making, validating, and so on. Slidegeeks is one of the best resources for PowerPoint templates. You can download easily and regulate Predictive Analytics Methods Roadmap For Predictive Analytics Model Development Mockup PDF for your personal presentations from our wonderful collection. A few clicks is all it takes to discover and get the most relevant and appropriate templates. Use our Templates to add a unique zing and appeal to your presentation and meetings. All the slides are easy to edit and you can use them even for advertisement purposes.
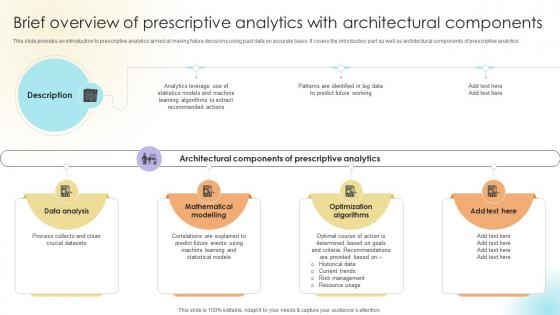
Brief Overview Of Prescriptive Analytics With Architectural Components Data Analytics SS V
This slide provides an introduction to prescriptive analytics aimed at making future decisions using past data on accurate basis. It covers the introductory part as well as architectural components of prescriptive analytics.Explore a selection of the finest Brief Overview Of Prescriptive Analytics With Architectural Components Data Analytics SS V here. With a plethora of professionally designed and pre-made slide templates, you can quickly and easily find the right one for your upcoming presentation. You can use our Brief Overview Of Prescriptive Analytics With Architectural Components Data Analytics SS V to effectively convey your message to a wider audience. Slidegeeks has done a lot of research before preparing these presentation templates. The content can be personalized and the slides are highly editable. Grab templates today from Slidegeeks. This slide provides an introduction to prescriptive analytics aimed at making future decisions using past data on accurate basis. It covers the introductory part as well as architectural components of prescriptive analytics.
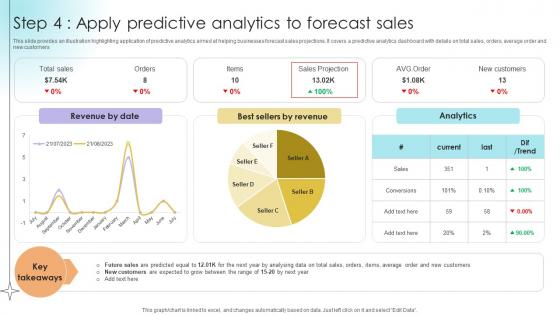
Step 4 Apply Predictive Analytics To Forecast Sales Data Analytics SS V
This slide provides an illustration highlighting application of predictive analytics aimed at helping businesses forecast sales projections. It covers a predictive analytics dashboard with details on total sales, orders, average order and new customers.Coming up with a presentation necessitates that the majority of the effort goes into the content and the message you intend to convey. The visuals of a PowerPoint presentation can only be effective if it supplements and supports the story that is being told. Keeping this in mind our experts created Step 4 Apply Predictive Analytics To Forecast Sales Data Analytics SS V to reduce the time that goes into designing the presentation. This way, you can concentrate on the message while our designers take care of providing you with the right template for the situation. This slide provides an illustration highlighting application of predictive analytics aimed at helping businesses forecast sales projections. It covers a predictive analytics dashboard with details on total sales, orders, average order and new customers.


 Continue with Email

 Home
Home


