Data Architecture Diagram
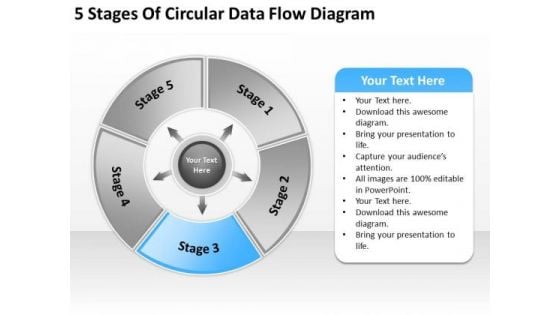
5 Stages Of Circular Data Flow Diagram Business Plans PowerPoint Slides
We present our 5 stages of circular data flow diagram business plans PowerPoint Slides.Download our Circle Charts PowerPoint Templates because Our PowerPoint Templates and Slides are created by a hardworking bunch of busybees. Always flitting around with solutions gauranteed to please. Download and present our Arrows PowerPoint Templates because Our PowerPoint Templates and Slides are conceived by a dedicated team. Use them and give form to your wondrous ideas. Present our Signs PowerPoint Templates because Our PowerPoint Templates and Slides will let Your superior ideas hit the target always and everytime. Download our Shapes PowerPoint Templates because It will Strengthen your hand with your thoughts. They have all the aces you need to win the day. Download and present our Process and Flows PowerPoint Templates because you should Whip up a frenzy with our PowerPoint Templates and Slides. They will fuel the excitement of your team.Use these PowerPoint slides for presentations relating to process, chart, circular, arrow, diagram, organization, model, blank, sequence, numbers, business, sequential, concept, template, abstract, management, mba, cycle, circulation, illustration, icon, six, strategy, executive, design, empty, procedure, 6, conceptual, resource. The prominent colors used in the PowerPoint template are Blue, Gray, Black. Our 5 Stages Of Circular Data Flow Diagram Business Plans PowerPoint Slides are exhaustively detailed. They pay close attention to each and every aspect.
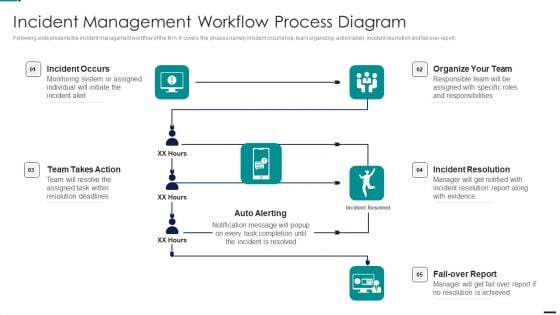
Risk Management Model For Data Security Incident Management Workflow Process Diagram Topics PDF
Following slide presents the incident management workflow of the firm. It covers five phases namely incident occurrence, team organizing, action taken, incident resolution and fail over report. Presenting Risk Management Model For Data Security Incident Management Workflow Process Diagram Topics PDF to provide visual cues and insights. Share and navigate important information on four stages that need your due attention. This template can be used to pitch topics like Incident Occurs, Organize Team, Incident Resolution, Fail Over Report, Auto Alerting, Team Takes Action. In addtion, this PPT design contains high resolution images, graphics, etc, that are easily editable and available for immediate download.
Latest Trends In Data Quality Procedure Icon Diagrams Pdf
Showcasing this set of slides titled Latest Trends In Data Quality Procedure Icon Diagrams Pdf. The topics addressed in these templates are Latest Trends, Data Quality Procedure Icon. All the content presented in this PPT design is completely editable. Download it and make adjustments in color, background, font etc. as per your unique business setting. Our Latest Trends In Data Quality Procedure Icon Diagrams Pdf are topically designed to provide an attractive backdrop to any subject. Use them to look like a presentation pro.
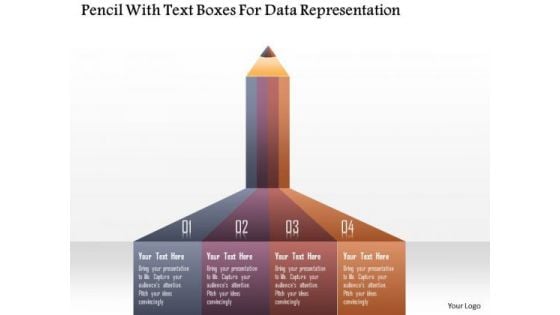
Business Diagram Pencil With Text Boxes For Data Representation PowerPoint Template
This power point template diagram has been designed with graphic of pencil style text boxes. These boxes are used to display the text and data. Use this PPT for your business presentation.
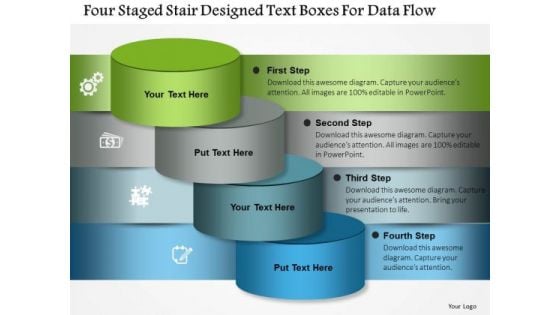
Business Diagram Four Staged Stair Designed Text Boxes For Data Flow Presentation Template
Four staged stair designed text boxes are used to design this power point template. This PPT contains the concept of data flow. Use this PPT for your business and finance related presentations.
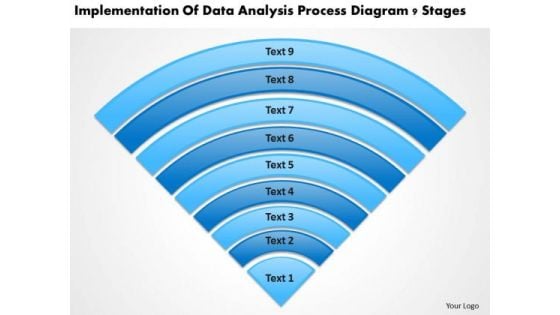
Data Analysis Process Diagram 9 Stages Help With Business Plan PowerPoint Slides
We present our data analysis process diagram 9 stages help with business plan PowerPoint Slides.Use our Computer PowerPoint Templates because Our PowerPoint Templates and Slides will let you Leave a lasting impression to your audiences. They possess an inherent longstanding recall factor. Use our Communication PowerPoint Templates because you can Break through with our PowerPoint Templates and Slides. Bring down the mental barriers of your audience. Use our Semicircles PowerPoint Templates because Our PowerPoint Templates and Slides will let your words and thoughts hit bullseye everytime. Present our Shapes PowerPoint Templates because Our PowerPoint Templates and Slides will let you meet your Deadlines. Use our Business PowerPoint Templates because Our PowerPoint Templates and Slides have the Brilliant backdrops. Guaranteed to illuminate the minds of your audience.Use these PowerPoint slides for presentations relating to Catalogue, chart, checking, choice, circle, swatch, computer, design, equipment, fan, gamma, guide, mix, object, paint, palette, pantone, paper, press, print, printout, process, profile, publishing, rainbow, round, scale, select, selection, semicircle, spectrum, system, template, typographic, typography, variation. The prominent colors used in the PowerPoint template are Blue, Gray, Black. Identify targets with our Data Analysis Process Diagram 9 Stages Help With Business Plan PowerPoint Slides. Download without worries with our money back guaranteee.
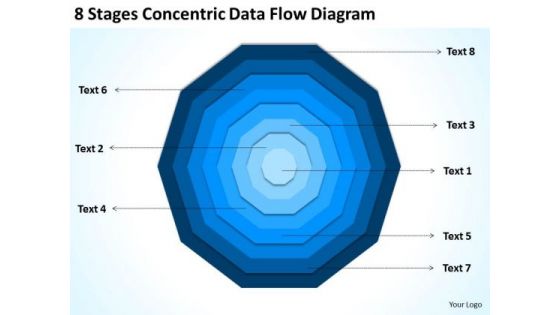
8 Stages Concentric Data Flow Diagram Marketing Business Plan Template PowerPoint Templates
We present our 8 stages concentric data flow diagram marketing business plan template PowerPoint templates.Download and present our Business PowerPoint Templates because They will Put the wind in your sails. Skim smoothly over the choppy waters of the market. Use our Flow Charts PowerPoint Templates because It will let you Set new benchmarks with our PowerPoint Templates and Slides. They will keep your prospects well above par. Use our Marketing PowerPoint Templates because You have gained great respect for your brilliant ideas. Use our PowerPoint Templates and Slides to strengthen and enhance your reputation. Download and present our Process and Flows PowerPoint Templates because You can Hit the nail on the head with our PowerPoint Templates and Slides. Embed your ideas in the minds of your audience. Download and present our Circle Charts PowerPoint Templates because Our PowerPoint Templates and Slides will Embellish your thoughts. They will help you illustrate the brilliance of your ideas.Use these PowerPoint slides for presentations relating to Blue, swirl, abstract, background, design, motion, shape, vector, round, graphic, business, pattern, liquid, blank, flowing, effect, wallpaper, decoration, white, concept, bright, curve, circle, clean, technology, illustration, energy, creativity, color, art, style, space, image, simplicity, textured. The prominent colors used in the PowerPoint template are Black, Blue light, Blue. Capture emerging international markets with our 8 Stages Concentric Data Flow Diagram Marketing Business Plan Template PowerPoint Templates. They will make you look good.
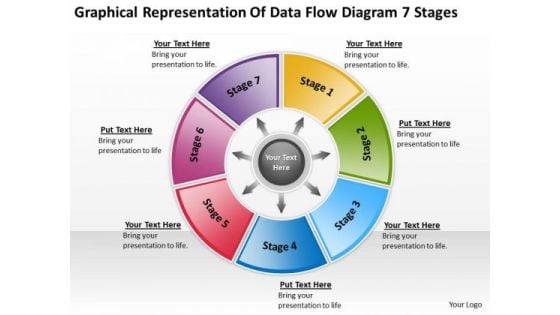
Representation Of Data Flow Diagram 7 Stages Templates For Business PowerPoint
We present our representation of data flow diagram 7 stages templates for business PowerPoint.Download our Circle Charts PowerPoint Templates because Our PowerPoint Templates and Slides will give you great value for your money. Be assured of finding the best projection to highlight your words. Present our Arrows PowerPoint Templates because Our PowerPoint Templates and Slides will let you Leave a lasting impression to your audiences. They possess an inherent longstanding recall factor. Present our Business PowerPoint Templates because Our PowerPoint Templates and Slides are designed to help you succeed. They have all the ingredients you need. Download and present our Shapes PowerPoint Templates because Our PowerPoint Templates and Slides are Clear and concise. Use them and dispel any doubts your team may have. Download and present our Process and Flows PowerPoint Templates because Our PowerPoint Templates and Slides will let you Clearly mark the path for others to follow.Use these PowerPoint slides for presentations relating to abstract, access, arrow, background, banner, blue, bright, business, chart, circle, color, colorful, concept, conceptual, connection, corporate, creative, cycle, design, different, element, empty, form, frame, graphic, green, group, idea, illustration, match, message, order, part, piece, place, process, red, shape, solution, special, speech, strategy, symbol, system loop, template, text, usable, vector, web, website. The prominent colors used in the PowerPoint template are Purple, Yellow, Green. Your thoughts are creating an explosion of ideas. Control the consequences with our Representation Of Data Flow Diagram 7 Stages Templates For Business PowerPoint.
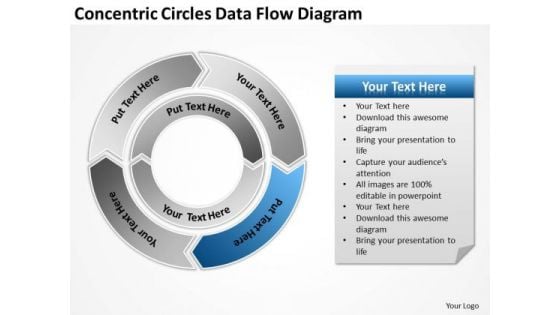
Concentric Circles Data Flow Diagram Examples Of Small Business Plans PowerPoint Templates
We present our concentric circles data flow diagram examples of small business plans PowerPoint templates.Download our Arrows PowerPoint Templates because It is Aesthetically crafted by artistic young minds. Our PowerPoint Templates and Slides are designed to display your dexterity. Download and present our Process and Flows PowerPoint Templates because you should Whip up a frenzy with our PowerPoint Templates and Slides. They will fuel the excitement of your team. Download and present our Flow Charts PowerPoint Templates because Our PowerPoint Templates and Slides are created by a hardworking bunch of busybees. Always flitting around with solutions gauranteed to please. Download our Business PowerPoint Templates because Our PowerPoint Templates and Slides are designed to help you succeed. They have all the ingredients you need. Use our Shapes PowerPoint Templates because You have a driving passion to excel in your field. Our PowerPoint Templates and Slides will prove ideal vehicles for your ideas.Use these PowerPoint slides for presentations relating to Arrows, speech, form, special, corporate, order, business, concept, arrow, bright, symbol, circle, match, usable, graphic, process,element, different, idea, shape, abstract, cycle, creative, illustration, piece, connection, chart, strategy, place, group, color, colorful, text, access, part, conceptual. The prominent colors used in the PowerPoint template are Blue, Gray, White. Exert some pressure with our Concentric Circles Data Flow Diagram Examples Of Small Business Plans PowerPoint Templates. Get the decision in your favour.
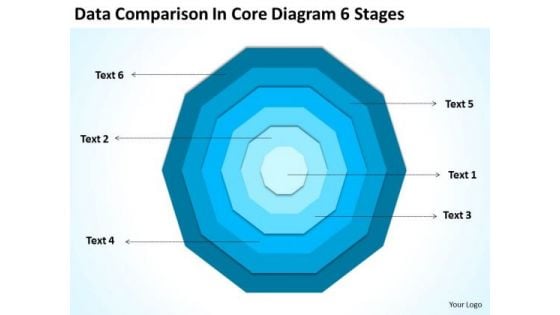
Data Comparison In Core Diagram 6 Stages Bussiness Plan PowerPoint Templates
We present our data comparison in core diagram 6 stages bussiness plan PowerPoint templates.Download our Circle Charts PowerPoint Templates because Our PowerPoint Templates and Slides are aesthetically designed to attract attention. We gaurantee that they will grab all the eyeballs you need. Download our Process and Flows PowerPoint Templates because You can Bait your audience with our PowerPoint Templates and Slides. They will bite the hook of your ideas in large numbers. Present our Business PowerPoint Templates because It will Give impetus to the hopes of your colleagues. Our PowerPoint Templates and Slides will aid you in winning their trust. Download our Marketing PowerPoint Templates because Our PowerPoint Templates and Slides will let your team Walk through your plans. See their energy levels rise as you show them the way. Download and present our Success PowerPoint Templates because Our PowerPoint Templates and Slides are specially created by a professional team with vast experience. They diligently strive to come up with the right vehicle for your brilliant Ideas. Use these PowerPoint slides for presentations relating to Background, abstract, blue, design, vector, line, bright, light, shape, pattern, clean, motion, decoration, white, power, business, blank, concept, circle, element, card, technology, smooth, flowing, modern, illustration, energy, sparse, shiny, backdrop, color, effect, style, space . The prominent colors used in the PowerPoint template are Blue, Blue dark, Blue light. Handle a delicate situation with our Data Comparison In Core Diagram 6 Stages Bussiness Plan PowerPoint Templates. Just download, type and present.
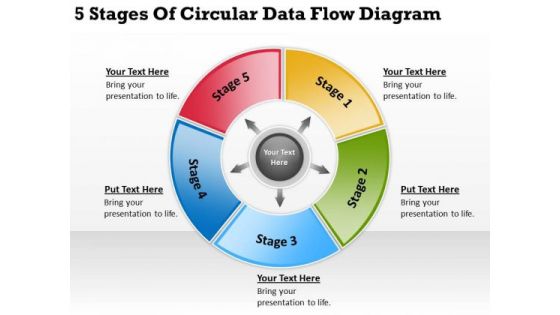
5 Stages Of Circular Data Flow Diagram Simple Business Plan PowerPoint Slides
We present our 5 stages of circular data flow diagram simple business plan PowerPoint Slides.Present our Marketing PowerPoint Templates because Our PowerPoint Templates and Slides will steer your racing mind. Hit the right buttons and spur on your audience. Use our Leadership PowerPoint Templates because Our PowerPoint Templates and Slides come in all colours, shades and hues. They help highlight every nuance of your views. Use our Arrows PowerPoint Templates because Our PowerPoint Templates and Slides come in all colours, shades and hues. They help highlight every nuance of your views. Present our Business PowerPoint Templates because Our PowerPoint Templates and Slides will let you Hit the target. Go the full distance with ease and elan. Download and present our Circle Charts PowerPoint Templates because You should Bet on your luck with our PowerPoint Templates and Slides. Be assured that you will hit the jackpot.Use these PowerPoint slides for presentations relating to Flow, process, arrow, chart, adding, business, vector, symbol, flowchart, graph, network, conservation, sign, rotation, recycling, value, graphic, element, repeat, management, wheel, cycle, circulation, connection, strategy, orientation, planning, direction, design, group, return, repetition, communication. The prominent colors used in the PowerPoint template are Red, Green, Yellow. Awards will be the feathers in your cap. Accumulate accolades with our 5 Stages Of Circular Data Flow Diagram Simple Business Plan PowerPoint Slides.
8 Stages Concentric Data Flow Diagram Ppt Business Plan PowerPoint Slides
We present our 8 stages concentric data flow diagram ppt business plan PowerPoint Slides.Download and present our Business PowerPoint Templates because our bewitching PowerPoint Templates and Slides will delight your audience with the magic of your words. Use our Circle Charts PowerPoint Templates because Our PowerPoint Templates and Slides are topically designed to provide an attractive backdrop to any subject. Download and present our Signs PowerPoint Templates because They will bring a lot to the table. Their alluring flavours will make your audience salivate. Download and present our Shapes PowerPoint Templates because our PowerPoint Templates and Slides are a looking glass. Train them on the magnificent future you have in mind. Present our Metaphors-Visual Concepts PowerPoint Templates because our PowerPoint Templates and Slides are a looking glass. Train them on the magnificent future you have in mind.Use these PowerPoint slides for presentations relating to radial, concentric, shine, pipe, line, environmental, circle, rendered, plastic, striped, shape, abstract, object, shiny, reflective, capsule, stripe, background, border, ecological, repetition. The prominent colors used in the PowerPoint template are Blue, Black, Gray. Be an organizational leader with our 8 Stages Concentric Data Flow Diagram Ppt Business Plan PowerPoint Slides. They will make you look good.
8 Stages Concentric Data Flow Diagram Ppt Business Plan PowerPoint Templates
We present our 8 stages concentric data flow diagram ppt business plan PowerPoint templates.Present our Business PowerPoint Templates because Watching this your Audience will Grab their eyeballs, they wont even blink. Download and present our Circle Charts PowerPoint Templates because You have a driving passion to excel in your field. Our PowerPoint Templates and Slides will prove ideal vehicles for your ideas. Download our Signs PowerPoint Templates because You should Kick up a storm with our PowerPoint Templates and Slides. The heads of your listeners will swirl with your ideas. Download and present our Shapes PowerPoint Templates because Our PowerPoint Templates and Slides are aesthetically designed to attract attention. We gaurantee that they will grab all the eyeballs you need. Download our Metaphors-Visual Concepts PowerPoint Templates because Our PowerPoint Templates and Slides help you meet the demand of the Market. Just browse and pick the slides that appeal to your intuitive senses.Use these PowerPoint slides for presentations relating to radial, concentric, shine, pipe, line, environmental, circle, rendered, plastic, striped, shape, abstract, object, shiny, reflective, capsule, stripe, background, border, ecological, repetition. The prominent colors used in the PowerPoint template are Blue, Black, Gray. Get them all gung-ho with our 8 Stages Concentric Data Flow Diagram Ppt Business Plan PowerPoint Templates. Crank up their enthusiasm with with your words.
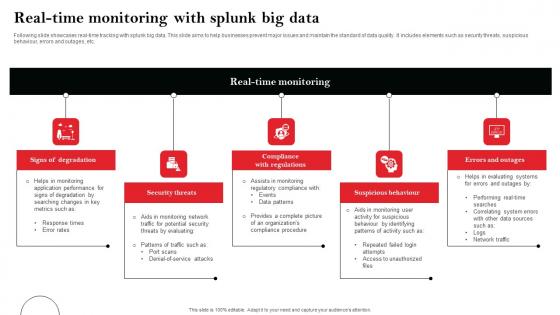
Real Time Monitoring With Splunk Big Data Diagrams Pdf
Following slide showcases real-time tracking with splunk big data. This slide aims to help businesses prevent major issues and maintain the standard of data quality. It includes elements such as security threats, suspicious behaviour, errors and outages, etc. Pitch your topic with ease and precision using this Real Time Monitoring With Splunk Big Data Diagrams Pdf This layout presents information on Signs Of Degradation, Security Threats, Errors And Outages It is also available for immediate download and adjustment. So, changes can be made in the color, design, graphics or any other component to create a unique layout. Following slide showcases real-time tracking with splunk big data. This slide aims to help businesses prevent major issues and maintain the standard of data quality. It includes elements such as security threats, suspicious behaviour, errors and outages, etc.
Business Diagram Social Media And Big Data Icons In Iphone Ppt Slide
This PowerPoint template is designed with graphics of iphone applications. This PPT slide contains the icons for social media and big data related topics. This PPT depicts the concept of mobile technology.
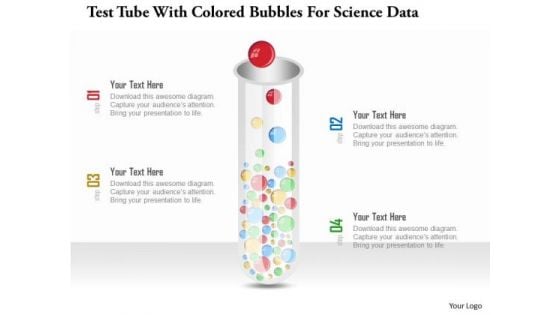
Business Diagram Test Tube With Colored Bubbles For Science Data Presentation Template
Test tubes with colored bubbles are used to design this power point template slide. This PPt slide contains the concept of science data analysis. Use this PPT slide for your business and science related presentations.
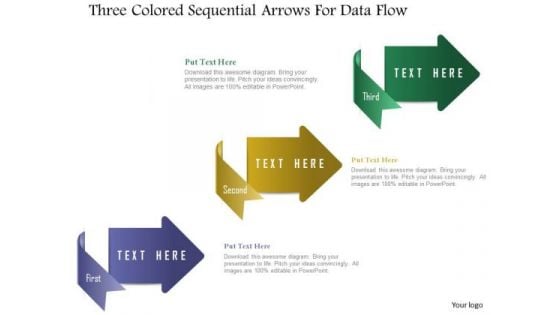
Business Diagram Three Colored Sequential Arrows For Data Flow Presentation Template
Three colored sequential arrows graphic has been used to design this power point template slide. This PPT slide contains the concept of data flow representation. Use this PPT slide for your business and management related presentations.

Business Diagram Four Progressive Text Boxes For Business Data Presentation Template
This diagram has been designed with four progressive steps with text boxes. You can insert this diagram into your presentations to clarify information. Highlight your ideas broad based on strong fundamentals and illustrate how they step by step achieve the set growth factor.
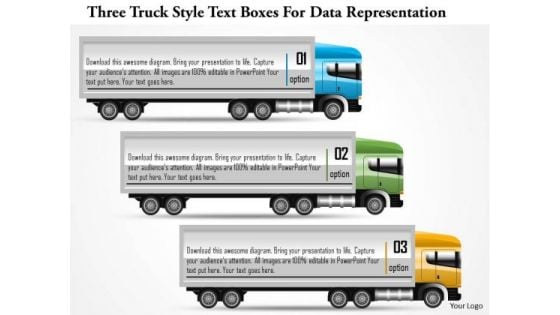
Business Diagram Three Truck Style Text Boxes For Data Representation PowerPoint Template
This power point template diagram has been designed with graphic of three truck style text boxes. These boxes are used to display the text and data. Use this PPT for your business presentation and get good comments from your viewers.
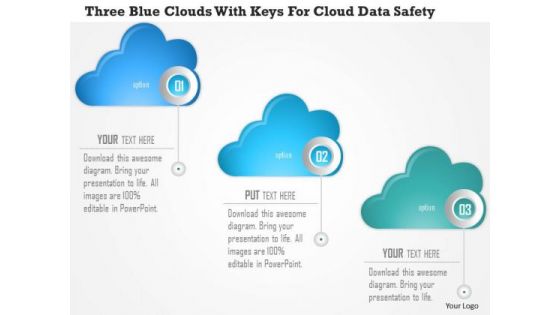
Business Diagram Three Blue Clouds With Keys For Cloud Data Safety Presentation Template
Our above business diagram contains design of three blue clouds with keys. This diagram provides an effective way of displaying information you can edit text, color, shade and style as per you need. Present your views using this innovative slide and be assured of leaving a lasting impression
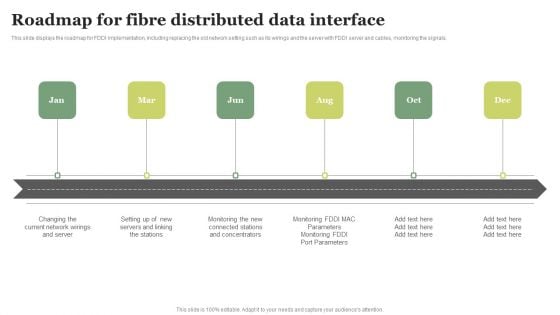
Roadmap For Fibre Distributed Data Interface Ppt PowerPoint Presentation Diagram Lists PDF
This slide displays the roadmap for FDDI implementation, including replacing the old network setting such as its wirings and the server with FDDI server and cables, monitoring the signals. Slidegeeks is here to make your presentations a breeze with Roadmap For Fibre Distributed Data Interface Ppt PowerPoint Presentation Diagram Lists PDF With our easy to use and customizable templates, you can focus on delivering your ideas rather than worrying about formatting. With a variety of designs to choose from, you are sure to find one that suits your needs. And with animations and unique photos, illustrations, and fonts, you can make your presentation pop. So whether you are giving a sales pitch or presenting to the board, make sure to check out Slidegeeks first.
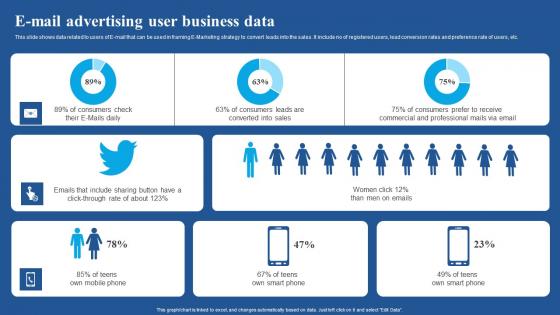
E Mail Advertising User Business Data Diagrams Pdf
This slide shows data related to users of E-mail that can be used in framing E-Marketing strategy to convert leads into the sales. It include no of registered users, lead conversion rates and preference rate of users, etc.Showcasing this set of slides titled E Mail Advertising User Business Data Diagrams Pdf The topics addressed in these templates are E Mail Advertising, User Business Data All the content presented in this PPT design is completely editable. Download it and make adjustments in color, background, font etc. as per your unique business setting. This slide shows data related to users of E mail that can be used in framing E Marketing strategy to convert leads into the sales. It include no of registered users, lead conversion rates and preference rate of users, etc.
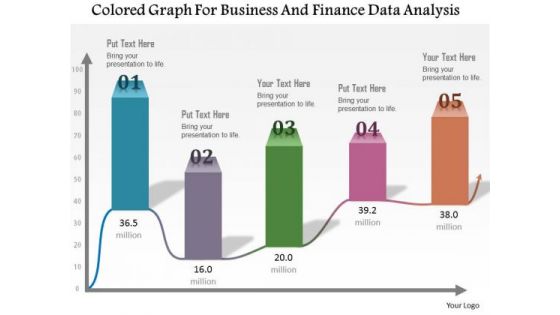
Business Diagram Colored Graph For Business And Finance Data Analysis Presentation Template
This Power Point template has been designed with graphic of colored bar graph. Use this slide to represent five steps of any business process. Use this diagram for your business presentations and get exclusive comments on your efforts.
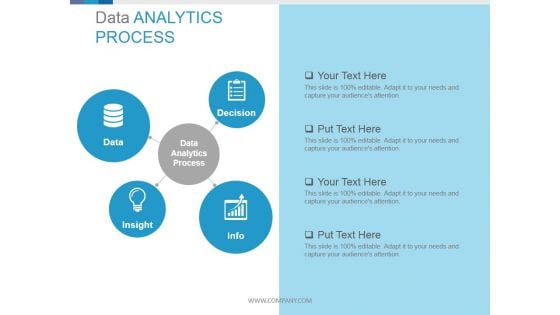
Data Analytics Process Circular Diagrams Ppt PowerPoint Presentation Guidelines
This is a data analytics process circular diagrams ppt powerpoint presentation guidelines. This is a four stage process. The stages in this process are data analytics process, data, decision, insight, info.
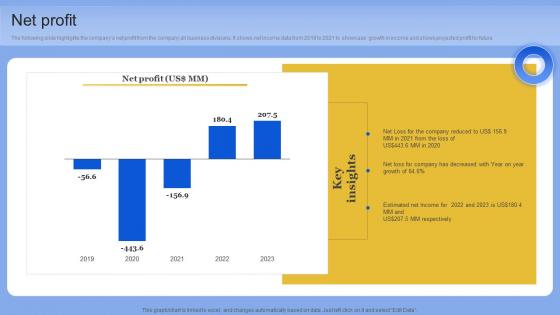
Net Profit Data Analytics Company Outline Diagrams PDF
The following slide highlights the companys net profit from the company all business divisions. It shows net income data from 2019 to 2021 to showcase growth in income and shows projected profit for future. Retrieve professionally designed Net Profit Data Analytics Company Outline Diagrams PDF to effectively convey your message and captivate your listeners. Save time by selecting pre-made slideshows that are appropriate for various topics, from business to educational purposes. These themes come in many different styles, from creative to corporate, and all of them are easily adjustable and can be edited quickly. Access them as PowerPoint templates or as Google Slides themes. You do not have to go on a hunt for the perfect presentation because Slidegeeks got you covered from everywhere. The following slide highlights the companys net profit from the company all business divisions. It shows net income data from 2019 to 2021 to showcase growth in income and shows projected profit for future
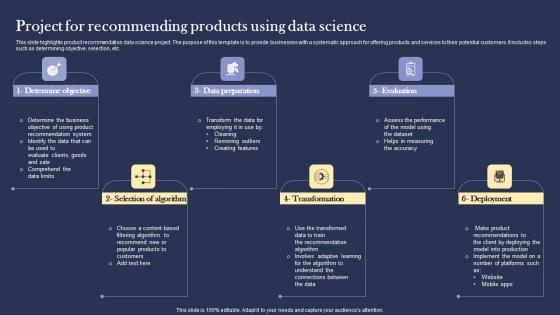
Project For Recommending Products Using Data Science Diagrams pdf
This slide highlights product recommendation data science project. The purpose of this template is to provide businesses with a systematic approach for offering products and services to their potential customers. It includes steps such as determining objective, selection, etc. Pitch your topic with ease and precision using this Project For Recommending Products Using Data Science Diagrams pdf. This layout presents information on Determining Objective, Selection. It is also available for immediate download and adjustment. So, changes can be made in the color, design, graphics or any other component to create a unique layout. This slide highlights product recommendation data science project. The purpose of this template is to provide businesses with a systematic approach for offering products and services to their potential customers. It includes steps such as determining objective, selection, etc.
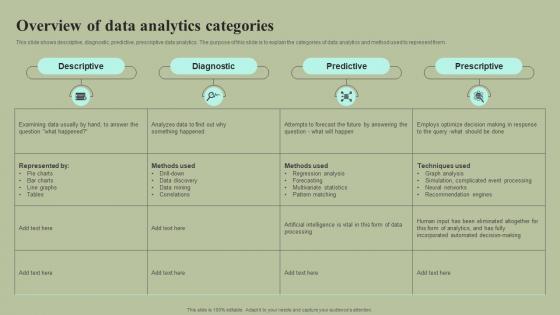
Overview Of Data Analytics Categories Cybernetic Integration Diagrams Pdf
This slide shows descriptive, diagnostic, predictive, prescriptive data analytics. The purpose of this slide is to explain the categories of data analytics and method used to represent them. Do you have an important presentation coming up Are you looking for something that will make your presentation stand out from the rest Look no further than Overview Of Data Analytics Categories Cybernetic Integration Diagrams Pdf With our professional designs, you can trust that your presentation will pop and make delivering it a smooth process. And with Slidegeeks, you can trust that your presentation will be unique and memorable. So why wait Grab Overview Of Data Analytics Categories Cybernetic Integration Diagrams Pdf today and make your presentation stand out from the rest. This slide shows descriptive, diagnostic, predictive, prescriptive data analytics. The purpose of this slide is to explain the categories of data analytics and method used to represent them.
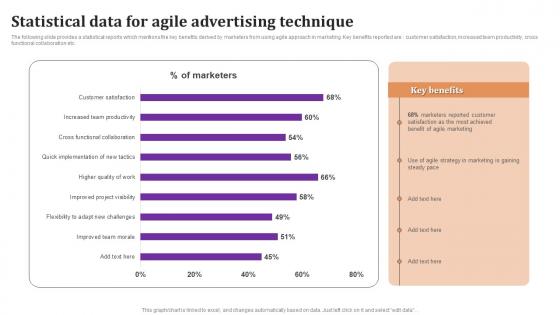
Statistical Data For Agile Advertising Technique Diagrams Pdf
The following slide provides a statistical reports which mentions the key benefits derived by marketers from using agile approach in marketing. Key benefits reported are customer satisfaction, increased team productivity, cross functional collaboration etc. Pitch your topic with ease and precision using this Statistical Data For Agile Advertising Technique Diagrams Pdf This layout presents information on Statistical Data, Agile Advertising, Technique It is also available for immediate download and adjustment. So, changes can be made in the color, design, graphics or any other component to create a unique layout. The following slide provides a statistical reports which mentions the key benefits derived by marketers from using agile approach in marketing. Key benefits reported are customer satisfaction, increased team productivity, cross functional collaboration etc.

Comparative Analysis Of Enterprise Repository And Data Mart Diagrams PDF
The slide analyses a comparative matrix of data warehouse and data mart. The slide includes definition, usage, objective , data type , data value, size, design and approach. Showcasing this set of slides titled Comparative Analysis Of Enterprise Repository And Data Mart Diagrams PDF. The topics addressed in these templates are Parameters, Data Warehouse, Data Mart. All the content presented in this PPT design is completely editable. Download it and make adjustments in color, background, font etc. as per your unique business setting.
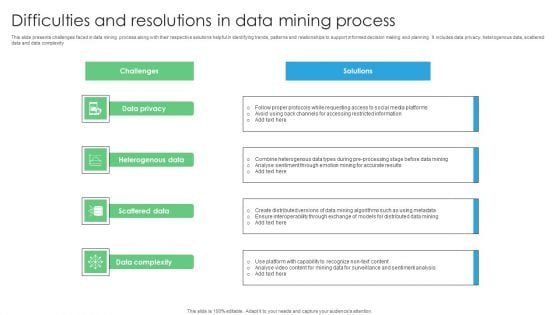
Difficulties And Resolutions In Data Mining Process Diagrams PDF
This slide presents challenges faced in data mining process along with their respective solutions helpful in identifying trends, patterns and relationships to support informed decision making and planning. It includes data privacy, heterogenous data, scattered data and data complexity. Introducing Difficulties And Resolutions In Data Mining Process Diagrams PDF. to increase your presentation threshold. Encompassed with four stages, this template is a great option to educate and entice your audience. Dispence information on Data Privacy, Heterogenous Data, Scattered Data, using this template. Grab it now to reap its full benefits.
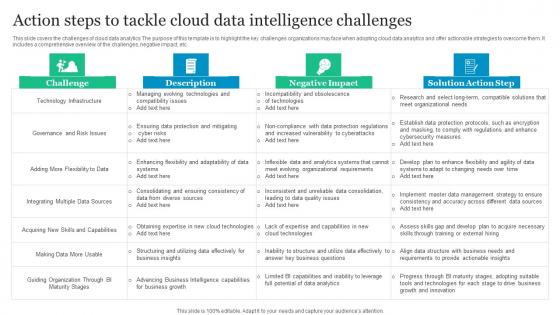
Action Steps To Tackle Cloud Data Intelligence Challenges Diagrams Pdf
This slide covers the challenges of cloud data analytics The purpose of this template is to highlight the key challenges organizations may face when adopting cloud data analytics and offer actionable strategies to overcome them. It includes a comprehensive overview of the challenges, negative impact, etc. Showcasing this set of slides titled Action Steps To Tackle Cloud Data Intelligence Challenges Diagrams Pdf. The topics addressed in these templates are Technology Infrastructure, Cyber Risks, Diverse Sources. All the content presented in this PPT design is completely editable. Download it and make adjustments in color, background, font etc. as per your unique business setting. This slide covers the challenges of cloud data analytics The purpose of this template is to highlight the key challenges organizations may face when adopting cloud data analytics and offer actionable strategies to overcome them. It includes a comprehensive overview of the challenges, negative impact, etc.
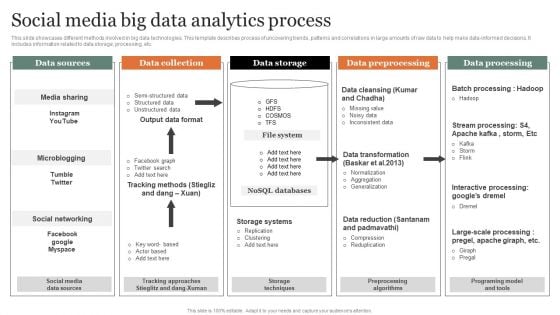
Social Media Big Data Analytics Process Diagrams PDF
This slide showcases different methods involved in big data technologies. This template describes process of uncovering trends, patterns and correlations in large amounts of raw data to help make data informed decisions. It includes information related to data storage, processing, etc. Showcasing this set of slides titled Social Media Big Data Analytics Process Diagrams PDF Microsoft. The topics addressed in these templates are Data Collection, Data Storage, Data Preprocessing. All the content presented in this PPT design is completely editable. Download it and make adjustments in color, background, font etc. as per your unique business setting.
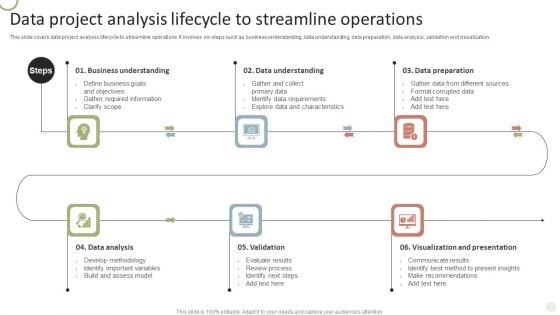
Data Project Analysis Lifecycle To Streamline Operations Diagrams PDF
This slide covers data project analysis lifecycle to streamline operations. It involves six steps such as business understanding, data understanding, data preparation, data analysis, validation and visualization.Persuade your audience using this Data Project Analysis Lifecycle To Streamline Operations Diagrams PDF. This PPT design covers six stages, thus making it a great tool to use. It also caters to a variety of topics including Business Understanding, Data Understanding, Data Preparation. Download this PPT design now to present a convincing pitch that not only emphasizes the topic but also showcases your presentation skills.
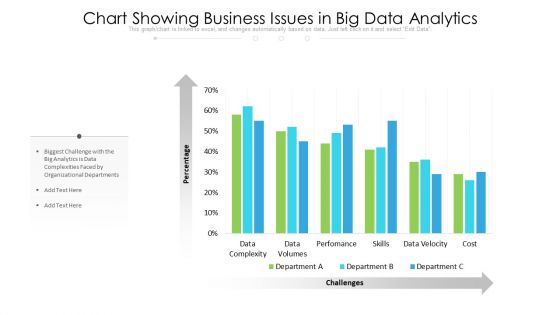
Chart Showing Business Issues In Big Data Analytics Diagrams PDF
Pitch your topic with ease and precision using this chart showing business issues in big data analytics diagrams pdf. This layout presents information on data complexity, data volumes, performance, skills. It is also available for immediate download and adjustment. So, changes can be made in the color, design, graphics or any other component to create a unique layout.

Information Transformation Process Toolkit Data Analysis Project Plan Diagrams PDF
The slide outline the key steps for data analytics methodology. It initiates with defining business objectives to data understanding, modelling and ends at data visualization and presentation. Presenting Information Transformation Process Toolkit Data Analysis Project Plan Diagrams PDF to provide visual cues and insights. Share and navigate important information on six stages that need your due attention. This template can be used to pitch topics like Business Issue Understanding, Data Understanding, Data Preparation. In addtion, this PPT design contains high resolution images, graphics, etc, that are easily editable and available for immediate download.
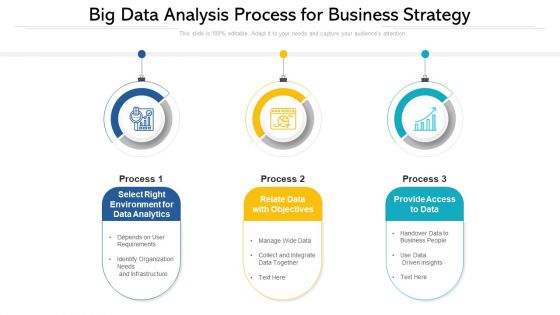
Big Data Analysis Process For Business Strategy Diagrams PDF
Persuade your audience using this big data analysis process for business strategy diagrams pdf.This PPT design covers three stages, thus making it a great tool to use. It also caters to a variety of topics including select right environment for data analytics, relate data with objectives, provide access to data. Download this PPT design now to present a convincing pitch that not only emphasizes the topic but also showcases your presentation skills.
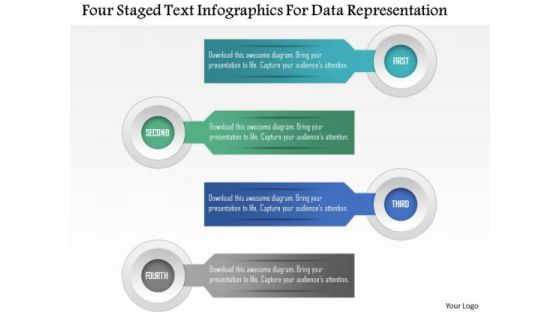
Business Diagram Four Staged Text Infographics For Data Representation Presentation Template
Four staged info graphics has been used to design this PowerPoint template. This slide can be used for text representation. Present your views using this innovative slide and be assured of leaving a lasting impression.
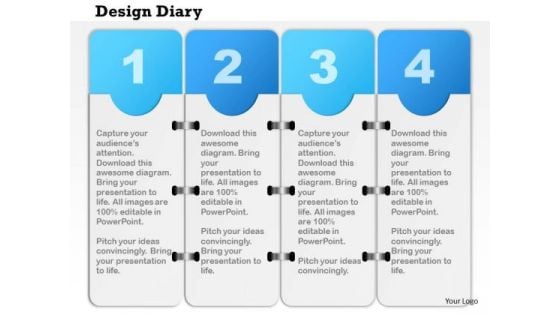
Business Diagram Four Staged Design Diary For Data Flow Presentation Template
Four staged info graphics has been used to design this PowerPoint template. This slide can be used for text representation. Present your views using this innovative slide and be assured of leaving a lasting impression.
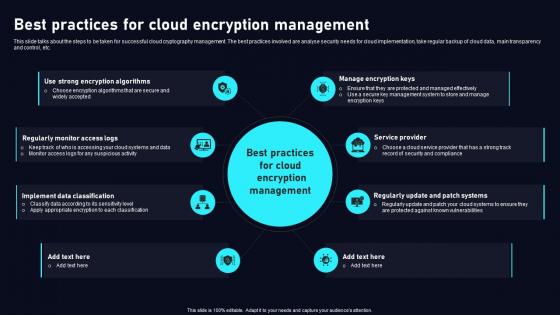
Best Practices For Cloud Data Security Using Cryptography Diagrams Pdf
This slide talks about the steps to be taken for successful cloud cryptography management. The best practices involved are analyse security needs for cloud implementation, take regular backup of cloud data, main transparency and control, etc. If you are looking for a format to display your unique thoughts, then the professionally designed Best Practices For Cloud Data Security Using Cryptography Diagrams Pdf is the one for you. You can use it as a Google Slides template or a PowerPoint template. Incorporate impressive visuals, symbols, images, and other charts. Modify or reorganize the text boxes as you desire. Experiment with shade schemes and font pairings. Alter, share or cooperate with other people on your work. Download Best Practices For Cloud Data Security Using Cryptography Diagrams Pdf and find out how to give a successful presentation. Present a perfect display to your team and make your presentation unforgettable. This slide talks about the steps to be taken for successful cloud cryptography management. The best practices involved are analyse security needs for cloud implementation, take regular backup of cloud data, main transparency and control, etc.
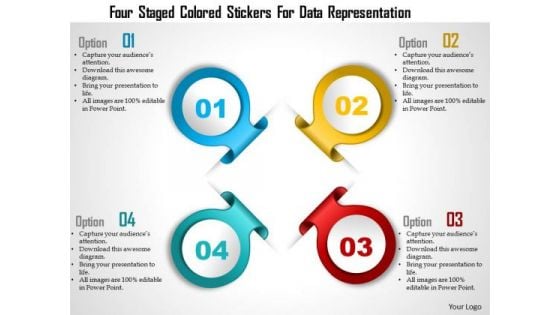
Business Diagram Four Staged Colored Stickers For Data Representation Presentation Template
Graphic of four staged colored stickers been used to design this business slide. This slide depicts four steps of a business process. Make your presentation more interactive with this business slide.
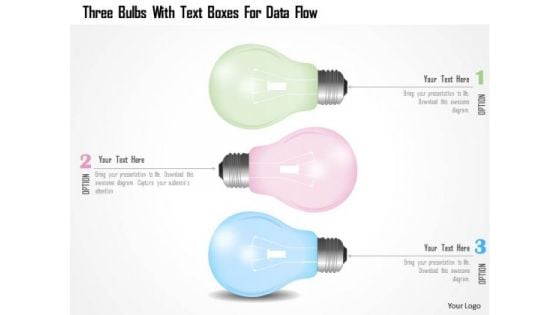
Business Diagram Three Bulbs With Text Boxes For Data Flow PowerPoint Template
This power point template has been designed with graphic of three bulbs and text boxes. These text boxes are used to show the text and data. Display your business and marketing related text in any presentation with this exclusive PPT.

Busines Diagram Three Staged Text Boxes For Data Representation Presentation Template
Three staged text boxes are used to design this business diagram. This slide helps to depict business process flow. This slide offers an excellent background to build professional presentations.
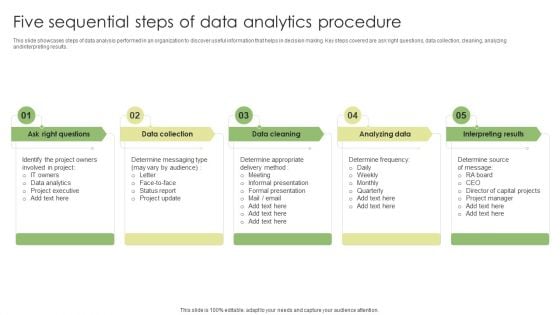
Five Sequential Steps Of Data Analytics Procedure Diagrams PDF
This slide showcases steps of data analysis performed in an organization to discover useful information that helps in decision making. Key steps covered are ask right questions, data collection, cleaning, analyzing and interpreting results. Persuade your audience using this Five Sequential Steps Of Data Analytics Procedure Diagrams PDF. This PPT design covers five stages, thus making it a great tool to use. It also caters to a variety of topics including Data Collection, Analyzing Data, Interpreting Results. Download this PPT design now to present a convincing pitch that not only emphasizes the topic but also showcases your presentation skills.

Busines Diagram Six Staged Vertical Process For Data Presentation Presentation Template
Six staged vertical process flow has been used to design this business diagram. This slide helps to depict business process flow. This slide offers an excellent background to build professional presentations.
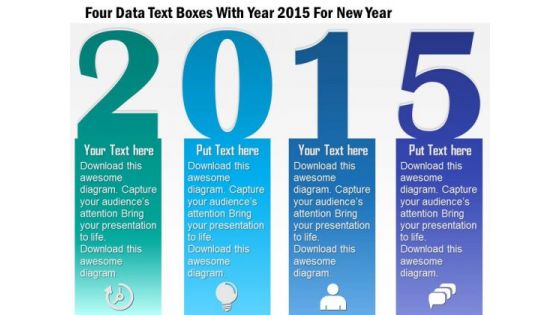
Business Diagram Four Data Text Boxes With Year 2015 For New Year Presentation Template
Four text boxes with year text 2015 has been used to design this power point template. This PPT contains the concept of new year celebration. Use this PPT for your new year based topics in any presentation.
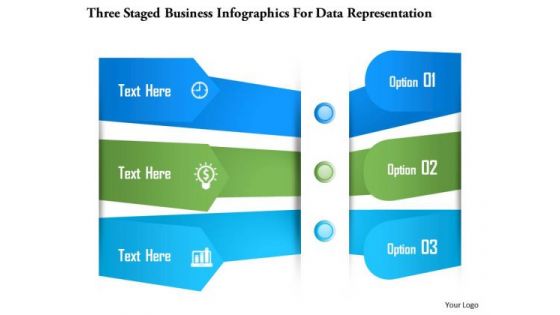
Business Diagram Three Staged Business Infographics For Data Representation Presentation Template
Three staged info graphics has been used to design this PowerPoint template. This slide can be used for text representation. Present your views using this innovative slide and be assured of leaving a lasting impression.
Data Analysis In Market Research Steps Icon Diagrams PDF
Showcasing this set of slides titled Data Analysis In Market Research Steps Icon Diagrams PDF. The topics addressed in these templates are Data Analysis, Market, Research Steps. All the content presented in this PPT design is completely editable. Download it and make adjustments in color, background, font etc. as per your unique business setting.
Data Refinement In Management Mining Icon Diagrams PDF
Showcasing this set of slides titled Data Refinement In Management Mining Icon Diagrams PDF. The topics addressed in these templates are Data Refinement, Management Mining Icon. All the content presented in this PPT design is completely editable. Download it and make adjustments in color, background, font etc. as per your unique business setting.
Primary Data Acquisition And Transformation Icon Diagrams PDF
Showcasing this set of slides titled Primary Data Acquisition And Transformation Icon Diagrams PDF. The topics addressed in these templates are Primary Data, Acquisition Transformation Icon. All the content presented in this PPT design is completely editable. Download it and make adjustments in color, background, font etc. as per your unique business setting.
Data Project Management And Process Icon Diagrams PDF
Showcasing this set of slides titled Data Project Management And Process Icon Diagrams PDF. The topics addressed in these templates are Data Project, Management, Process. All the content presented in this PPT design is completely editable. Download it and make adjustments in color, background, font etc. as per your unique business setting.
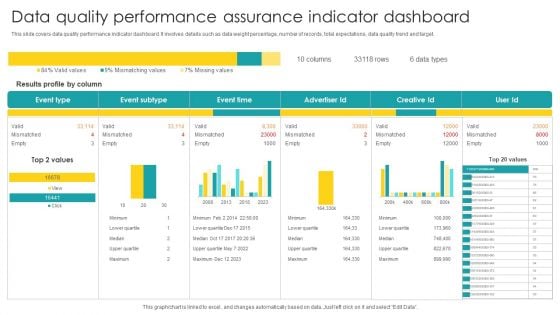
Data Quality Performance Assurance Indicator Dashboard Diagrams PDF
Pitch your topic with ease and precision using this Data Quality Performance Assurance Indicator Dashboard Diagrams PDF. This layout presents information on Data Quality Performance, Assurance Indicator Dashboard. It is also available for immediate download and adjustment. So, changes can be made in the color, design, graphics or any other component to create a unique layout.
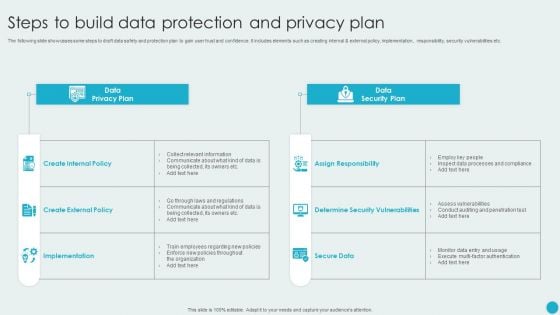
Steps To Build Data Protection And Privacy Plan Diagrams PDF
The following slide showcases some steps to draft data safety and protection plan to gain user trust and confidence. It includes elements such as creating internal and external policy, implementation, responsibility, security vulnerabilities etc. Showcasing this set of slides titled Steps To Build Data Protection And Privacy Plan Diagrams PDF. The topics addressed in these templates are Data Privacy Plan, Data Security Plan, Implementation. All the content presented in this PPT design is completely editable. Download it and make adjustments in color, background, font etc. as per your unique business setting.
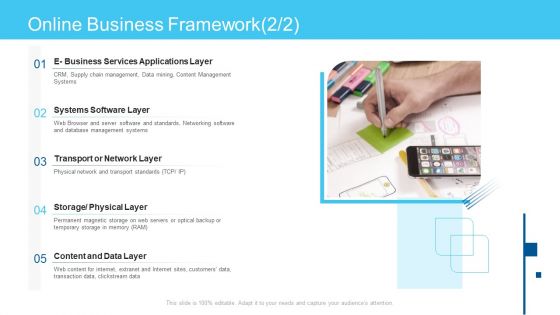
Online Business Framework Online Business Framework Data Diagrams PDF
This is a online business framework online business framework data diagrams pdf template with various stages. Focus and dispense information on five stages using this creative set, that comes with editable features. It contains large content boxes to add your information on topics like data, network layer, software layer. You can also showcase facts, figures, and other relevant content using this PPT layout. Grab it now.
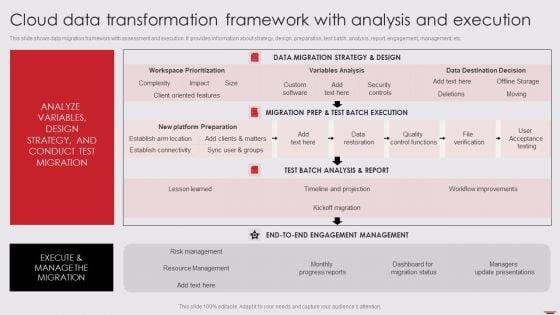
Cloud Data Transformation Framework With Analysis And Execution Diagrams PDF
This slide shows data migration framework with assessment and execution. It provides information about strategy, design, preparation, test batch, analysis, report, engagement, management, etc. Pitch your topic with ease and precision using this Cloud Data Transformation Framework With Analysis And Execution Diagrams PDF. This layout presents information on Data Migration Strategy, Migration Prep Test, Test Batch Analysis. It is also available for immediate download and adjustment. So, changes can be made in the color, design, graphics or any other component to create a unique layout.
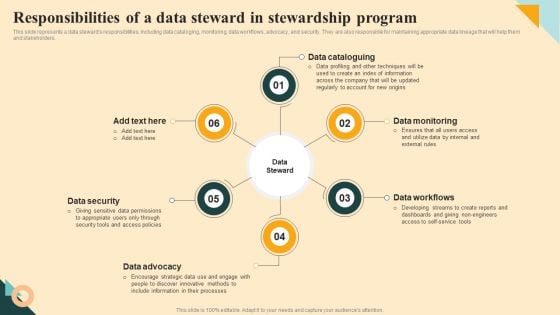
Responsibilities Of A Data Steward In Stewardship Program Diagrams PDF
This slide represents a data stewards responsibilities, including data cataloging, monitoring, data workflows, advocacy, and security. They are also responsible for maintaining appropriate data lineage that will help them and stakeholders. Coming up with a presentation necessitates that the majority of the effort goes into the content and the message you intend to convey. The visuals of a PowerPoint presentation can only be effective if it supplements and supports the story that is being told. Keeping this in mind our experts created Responsibilities Of A Data Steward In Stewardship Program Diagrams PDF to reduce the time that goes into designing the presentation. This way, you can concentrate on the message while our designers take care of providing you with the right template for the situation.
Data Analytics Plan For Digital Marketing Icon Diagrams PDF
Persuade your audience using this Data Analytics Plan For Digital Marketing Icon Diagrams PDF. This PPT design covers three stages, thus making it a great tool to use. It also caters to a variety of topics including Data Analytics Plan, Digital Marketing Icon. Download this PPT design now to present a convincing pitch that not only emphasizes the topic but also showcases your presentation skills.
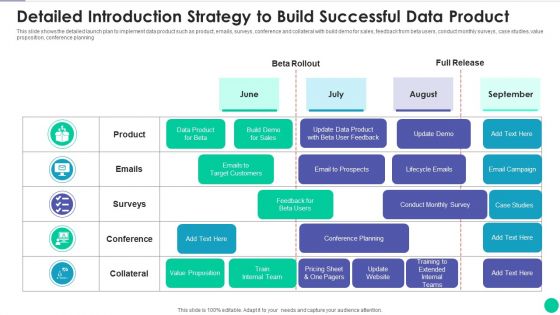
Detailed Introduction Strategy To Build Successful Data Product Diagrams PDF
This slide shows the detailed launch plan to implement data product such as product, emails, surveys, conference and collateral with build demo for sales, feedback from beta users, conduct monthly surveys, case studies, value proposition, conference planning Showcasing this set of slides titled detailed introduction strategy to build successful data product diagrams pdf. The topics addressed in these templates are detailed introduction strategy to build successful data product. All the content presented in this PPT design is completely editable. Download it and make adjustments in color, background, font etc. as per your unique business setting.
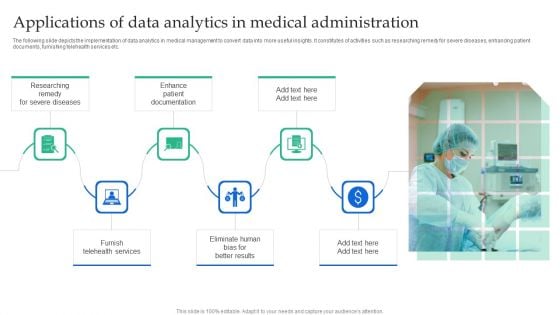
Applications Of Data Analytics In Medical Administration Diagrams PDF
The following slide depicts the implementation of data analytics in medical management to convert data into more useful insights. It constitutes of activities such as researching remedy for severe diseases, enhancing patient documents, furnishing telehealth services etc.Showcasing this set of slides titled Applications Of Data Analytics In Medical Administration Diagrams PDF. The topics addressed in these templates are Severe Diseases, Furnish Telehealth, Patient Documentation. All the content presented in this PPT design is completely editable. Download it and make adjustments in color, background, font etc. as per your unique business setting.
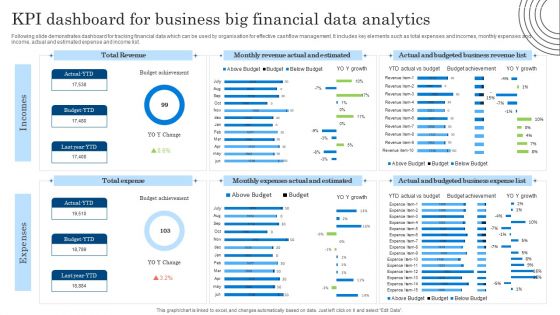
KPI Dashboard For Business Big Financial Data Analytics Diagrams PDF
Following slide demonstrates dashboard for tracking financial data which can be used by organisation for effective cashflow management. It includes key elements such as total expenses and incomes, monthly expenses and income, actual and estimated expense and income list. Showcasing this set of slides titled KPI Dashboard For Business Big Financial Data Analytics Diagrams PDF. The topics addressed in these templates are KPI Dashboard, Business Big Financial, Data Analytics. All the content presented in this PPT design is completely editable. Download it and make adjustments in color, background, font etc. as per your unique business setting.
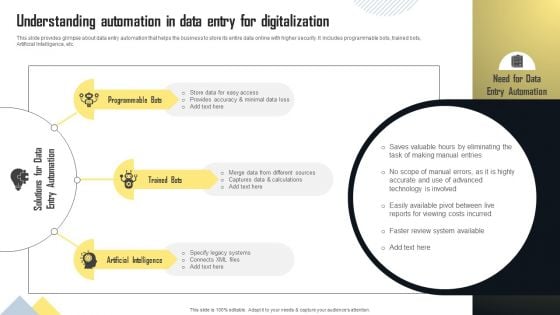
Understanding Automation In Data Entry For Digitalization Diagrams PDF
This slide provides glimpse about data entry automation that helps the business to store its entire data online with higher security. It includes programmable bots, trained bots, Artificial Intelligence, etc. Explore a selection of the finest Understanding Automation In Data Entry For Digitalization Diagrams PDF here. With a plethora of professionally designed and pre made slide templates, you can quickly and easily find the right one for your upcoming presentation. You can use our Understanding Automation In Data Entry For Digitalization Diagrams PDF to effectively convey your message to a wider audience. Slidegeeks has done a lot of research before preparing these presentation templates. The content can be personalized and the slides are highly editable. Grab templates today from Slidegeeks.


 Continue with Email

 Home
Home


