Data Architecture Diagram
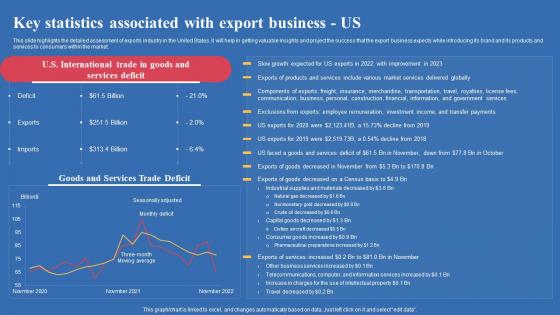
Key Statistics Associated With Export Business Us Export Business Plan Introduction Pdf
This slide highlights the detailed assessment of exports industry in the United States. It will help in getting valuable insights and project the success that the export business expects while introducing its brand and its products and services to consumers within the market. The Key Statistics Associated With Export Business Us Export Business Plan Introduction Pdf is a compilation of the most recent design trends as a series of slides. It is suitable for any subject or industry presentation, containing attractive visuals and photo spots for businesses to clearly express their messages. This template contains a variety of slides for the user to input data, such as structures to contrast two elements, bullet points, and slides for written information. Slidegeeks is prepared to create an impression. This slide highlights the detailed assessment of exports industry in the United States. It will help in getting valuable insights and project the success that the export business expects while introducing its brand and its products and services to consumers within the market.
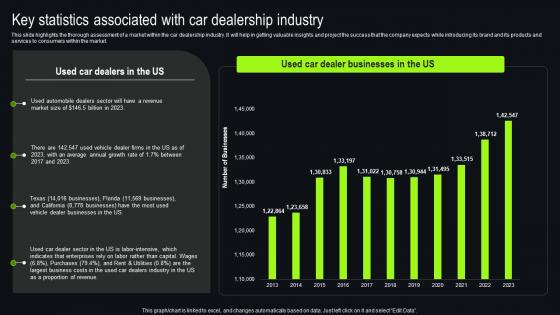
Key Statistics Associated With Car Dealership Industry New And Used Car Dealership Brochure Pdf
This slide highlights the thorough assessment of a market within the car dealership industry. It will help in getting valuable insights and project the success that the company expects while introducing its brand and its products and services to consumers within the market. The Key Statistics Associated With Car Dealership Industry New And Used Car Dealership Brochure Pdf is a compilation of the most recent design trends as a series of slides. It is suitable for any subject or industry presentation, containing attractive visuals and photo spots for businesses to clearly express their messages. This template contains a variety of slides for the user to input data, such as structures to contrast two elements, bullet points, and slides for written information. Slidegeeks is prepared to create an impression. This slide highlights the thorough assessment of a market within the car dealership industry. It will help in getting valuable insights and project the success that the company expects while introducing its brand and its products and services to consumers within the market.
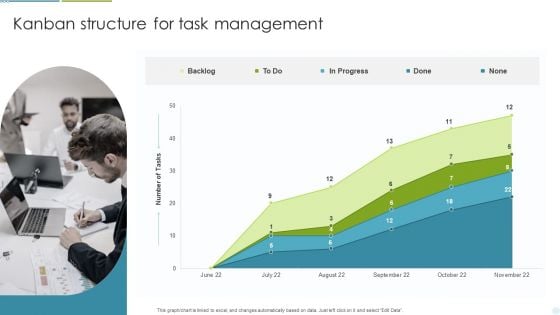
Kanban Structure For Task Management Ppt Summary Information PDF
This graph or chart is linked to excel, and changes automatically based on data. Just left click on it and select Edit Data. Showcasing this set of slides titled Kanban Structure For Task Management Ppt Summary Information PDF. The topics addressed in these templates are Backlog, In Progress, New Epic Added. All the content presented in this PPT design is completely editable. Download it and make adjustments in color, background, font etc. as per your unique business setting.
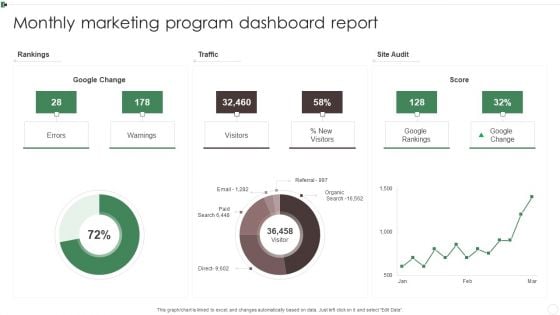
Monthly Marketing Program Dashboard Report Ppt Inspiration Information PDF
This graph or chart is linked to excel, and changes automatically based on data. Just left click on it and select Edit Data. Pitch your topic with ease and precision using this Monthly Marketing Program Dashboard Report Ppt Inspiration Information PDF. This layout presents information on Rankings, Traffic, Site Audit, Warnings. It is also available for immediate download and adjustment. So, changes can be made in the color, design, graphics or any other component to create a unique layout.
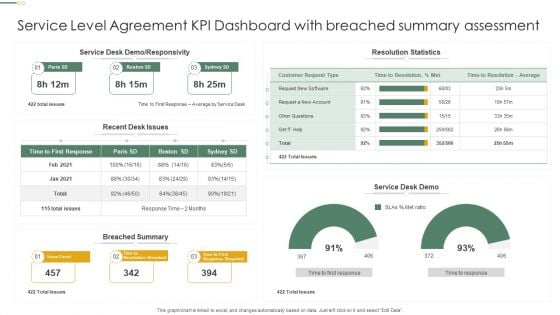
Service Level Agreement KPI Dashboard With Breached Summary Assessment Professional PDF
This graph or chart is linked to excel, and changes automatically based on data. Just left click on it and select Edit Data. Pitch your topic with ease and precision using this Service Level Agreement KPI Dashboard With Breached Summary Assessment Professional PDF. This layout presents information on Resolution Statistics, Service Desk Demo, Breached Summary. It is also available for immediate download and adjustment. So, changes can be made in the color, design, graphics or any other component to create a unique layout.

Online Bookstore Business Plan Global Books Market Statistics And Outlook BP SS V
This slide aims to highlight the market size of the global books market outlook, including its share in 2022, forecasted value in 2030, and its CAGR. It also reflects emerging trends, offering insights into the current state and future projections of the industry. Crafting an eye-catching presentation has never been more straightforward. Let your presentation shine with this tasteful yet straightforward Online Bookstore Business Plan Global Books Market Statistics And Outlook BP SS V template. It offers a minimalistic and classy look that is great for making a statement. The colors have been employed intelligently to add a bit of playfulness while still remaining professional. Construct the ideal Online Bookstore Business Plan Global Books Market Statistics And Outlook BP SS V that effortlessly grabs the attention of your audience Begin now and be certain to wow your customers This slide aims to highlight the market size of the global books market outlook, including its share in 2022, forecasted value in 2030, and its CAGR. It also reflects emerging trends, offering insights into the current state and future projections of the industry.
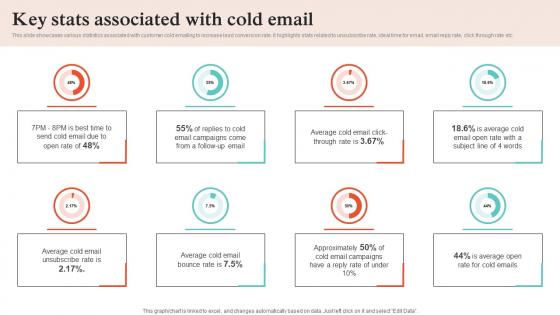
Virtual Sales Strategies Key Stats Associated With Cold Email Strategy SS V
This slide showcases various statistics associated with customer cold emailing to increase lead conversion rate. It highlights stats related to unsubscribe rate, ideal time for email, email reply rate, click through rate etc. Slidegeeks has constructed Virtual Sales Strategies Key Stats Associated With Cold Email Strategy SS V after conducting extensive research and examination. These presentation templates are constantly being generated and modified based on user preferences and critiques from editors. Here, you will find the most attractive templates for a range of purposes while taking into account ratings and remarks from users regarding the content. This is an excellent jumping-off point to explore our content and will give new users an insight into our top-notch PowerPoint Templates. This slide showcases various statistics associated with customer cold emailing to increase lead conversion rate. It highlights stats related to unsubscribe rate, ideal time for email, email reply rate, click through rate etc.
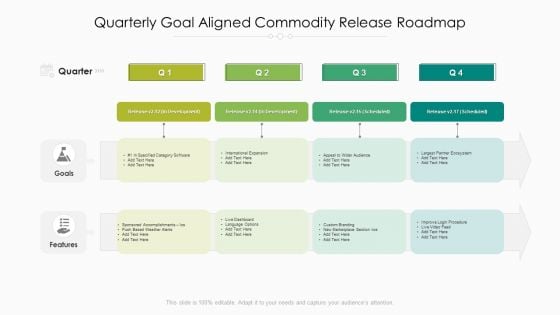
Quarterly Goal Aligned Commodity Release Roadmap Portrait
Introducing our quarterly goal aligned commodity release roadmap portrait. This PPT presentation is Google Slides compatible, therefore, you can share it easily with the collaborators for measuring the progress. Also, the presentation is available in both standard screen and widescreen aspect ratios. So edit the template design by modifying the font size, font type, color, and shapes as per your requirements. As this PPT design is fully editable it can be presented in PDF, JPG and PNG formats.
Stock Photo Card Board Download Arrow Icon PowerPoint Slide
This image slide is designed with cardboard and download arrow. This image contains the graphic of download icon with cardboard depicting downloading and storage of data. Use this image to make outstanding presentations.
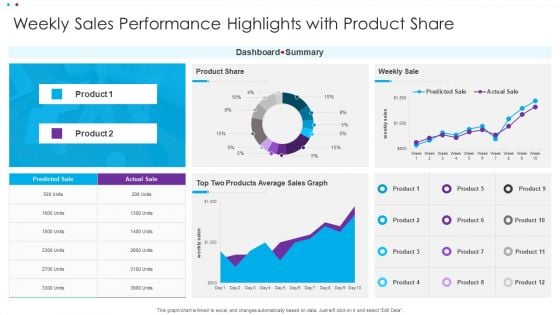
Weekly Sales Performance Highlights With Product Share Ppt File Information PDF
This graph or chart is linked to excel, and changes automatically based on data. Just left click on it and select Edit Data. Pitch your topic with ease and precision using this Weekly Sales Performance Highlights With Product Share Ppt File Information PDF. This layout presents information on Dashboard Summary, Weekly Sale, Product Share. It is also available for immediate download and adjustment. So, changes can be made in the color, design, graphics or any other component to create a unique layout.
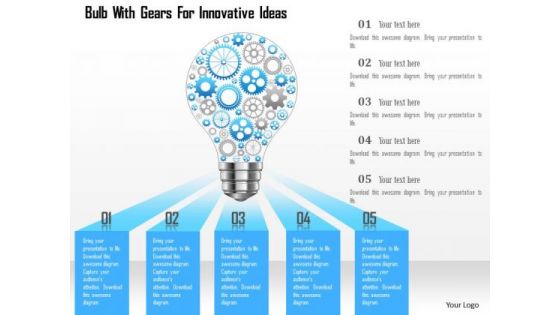
Bullb With Gears For Innovative Ideas PowerPoint Template
Concept of innovative ideas can be explained with this diagram. It contains graphics of bulb with gears. You can use this design to complement your idea themed presentation.
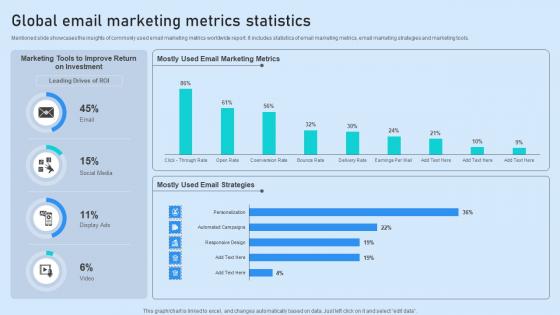
Global Email Marketing Metrics Statistics Structure Pdf
Mentioned slide showcases the insights of commonly used email marketing metrics worldwide report. It includes statistics of email marketing metrics, email marketing strategies and marketing tools. Showcasing this set of slides titled Global Email Marketing Metrics Statistics Structure Pdf. The topics addressed in these templates are Marketing Metrics, Strategies, Investment. All the content presented in this PPT design is completely editable. Download it and make adjustments in color, background, font etc. as per your unique business setting. Mentioned slide showcases the insights of commonly used email marketing metrics worldwide report. It includes statistics of email marketing metrics, email marketing strategies and marketing tools.
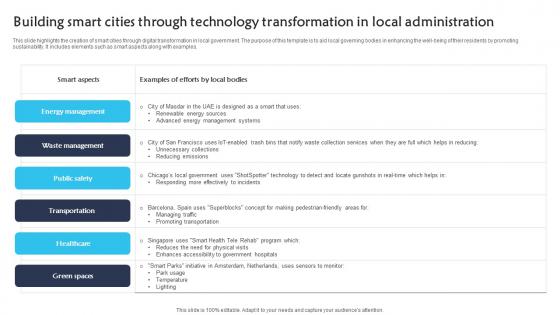
Building Smart Cities Through Technology Transformation In Local Administration Themes pdf
This slide highlights the creation of smart cities through digital transformation in local government. The purpose of this template is to aid local governing bodies in enhancing the well-being of their residents by promoting sustainability. It includes elements such as smart aspects along with examples. Pitch your topic with ease and precision using this Building Smart Cities Through Technology Transformation In Local Administration Themes pdf. This layout presents information on Energy Management, Waste Management, Public Safety. It is also available for immediate download and adjustment. So, changes can be made in the color, design, graphics or any other component to create a unique layout. This slide highlights the creation of smart cities through digital transformation in local government. The purpose of this template is to aid local governing bodies in enhancing the well-being of their residents by promoting sustainability. It includes elements such as smart aspects along with examples.
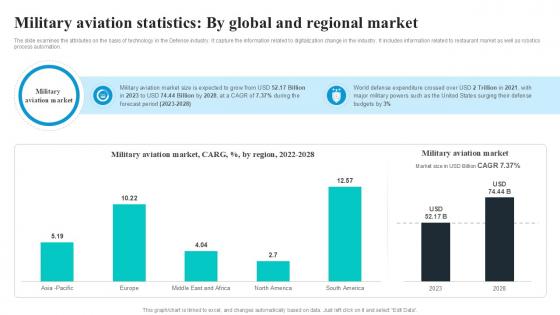
Military Aviation Statistics By Global Security Industry PPT PowerPoint IR SS V
The slide examines the attributes on the basis of technology in the Defense industry. It capture the information related to digitalization change in the industry. It includes information related to restaurant market as well as robotics process automation. Welcome to our selection of the Military Aviation Statistics By Global Security Industry PPT PowerPoint IR SS V. These are designed to help you showcase your creativity and bring your sphere to life. Planning and Innovation are essential for any business that is just starting out. This collection contains the designs that you need for your everyday presentations. All of our PowerPoints are 100Percent editable, so you can customize them to suit your needs. This multi-purpose template can be used in various situations. Grab these presentation templates today. The slide examines the attributes on the basis of technology in the Defense industry. It capture the information related to digitalization change in the industry. It includes information related to restaurant market as well as robotics process automation.
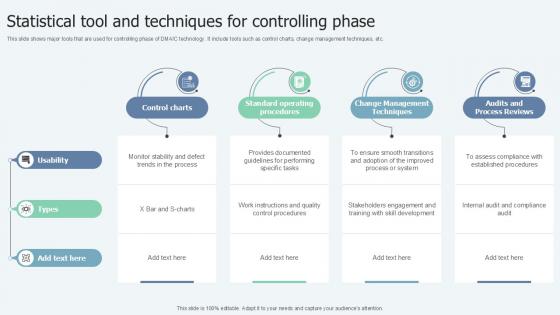
Statistical Tool And Techniques Lean Six Sigma In Manufacturing Ppt Slide
This slide shows major tools that are used for controlling phase of DMAIC technology. It include tools such as control charts, change management techniques, etc. Crafting an eye-catching presentation has never been more straightforward. Let your presentation shine with this tasteful yet straightforward Statistical Tool And Techniques Lean Six Sigma In Manufacturing Ppt Slide template. It offers a minimalistic and classy look that is great for making a statement. The colors have been employed intelligently to add a bit of playfulness while still remaining professional. Construct the ideal Statistical Tool And Techniques Lean Six Sigma In Manufacturing Ppt Slide that effortlessly grabs the attention of your audience Begin now and be certain to wow your customers This slide shows major tools that are used for controlling phase of DMAIC technology. It include tools such as control charts, change management techniques, etc.
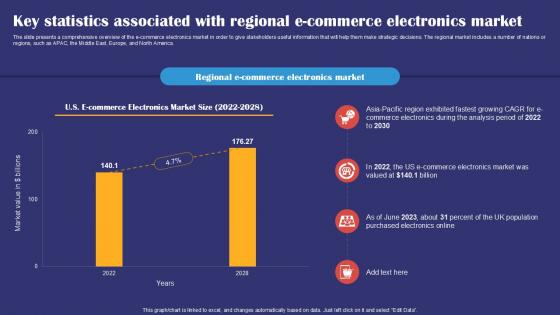
Key Statistics Associated With Regional E Commerce Market Smartphones Industry Report PPT Slides IR SS V
The slide presents a comprehensive overview of the e commerce electronics market in order to give stakeholders useful information that will help them make strategic decisions. The regional market includes a number of nations or regions, such as APAC, the Middle East, Europe, and North America. This modern and well arranged Key Statistics Associated With Regional E Commerce Market Smartphones Industry Report PPT Slides IR SS V provides lots of creative possibilities. It is very simple to customize and edit with the Powerpoint Software. Just drag and drop your pictures into the shapes. All facets of this template can be edited with Powerpoint, no extra software is necessary. Add your own material, put your images in the places assigned for them, adjust the colors, and then you can show your slides to the world, with an animated slide included. The slide presents a comprehensive overview of the e commerce electronics market in order to give stakeholders useful information that will help them make strategic decisions. The regional market includes a number of nations or regions, such as APAC, the Middle East, Europe, and North America.
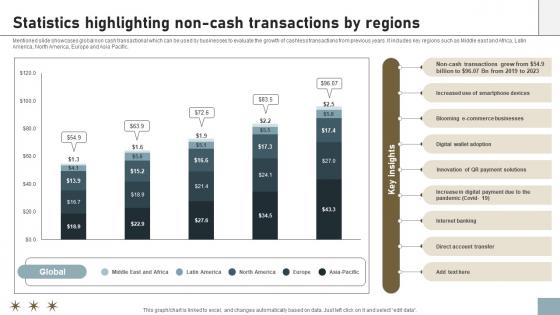
Online Payment Techniques Statistics Highlighting Non Cash Transactions By Regions
Mentioned slide showcases global non cash transactional which can be used by businesses to evaluate the growth of cashless transactions from previous years. It includes key regions such as Middle east and Africa, Latin America, North America, Europe and Asia Pacific. This modern and well-arranged Online Payment Techniques Statistics Highlighting Non Cash Transactions By Regions provides lots of creative possibilities. It is very simple to customize and edit with the Powerpoint Software. Just drag and drop your pictures into the shapes. All facets of this template can be edited with Powerpoint, no extra software is necessary. Add your own material, put your images in the places assigned for them, adjust the colors, and then you can show your slides to the world, with an animated slide included. Mentioned slide showcases global non cash transactional which can be used by businesses to evaluate the growth of cashless transactions from previous years. It includes key regions such as Middle east and Africa, Latin America, North America, Europe and Asia Pacific.
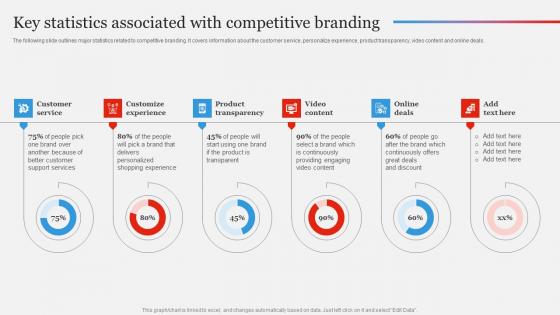
Key Statistics Associated Branding Strategy To Gain Competitive Edge Elements Pdf
The following slide outlines major statistics related to competitive branding. It covers information about the customer service, personalize experience, product transparency, video content and online deals. Coming up with a presentation necessitates that the majority of the effort goes into the content and the message you intend to convey. The visuals of a PowerPoint presentation can only be effective if it supplements and supports the story that is being told. Keeping this in mind our experts created Key Statistics Associated Branding Strategy To Gain Competitive Edge Elements Pdf to reduce the time that goes into designing the presentation. This way, you can concentrate on the message while our designers take care of providing you with the right template for the situation. The following slide outlines major statistics related to competitive branding. It covers information about the customer service, personalize experience, product transparency, video content and online deals.
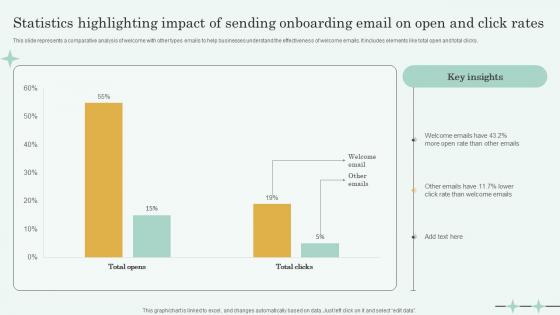
Statistics Highlighting Impact Of Sending Onboarding Email On Open And Click Rates Sample Pdf
This slide represents a comparative analysis of welcome with other types emails to help businesses understand the effectiveness of welcome emails. It includes elements like total open and total clicks. Pitch your topic with ease and precision using this Statistics Highlighting Impact Of Sending Onboarding Email On Open And Click Rates Sample Pdf. This layout presents information on Welcome Emails, Open Rate, Sending Onboarding Email. It is also available for immediate download and adjustment. So, changes can be made in the color, design, graphics or any other component to create a unique layout. This slide represents a comparative analysis of welcome with other types emails to help businesses understand the effectiveness of welcome emails. It includes elements like total open and total clicks.

Dump Truck Travel PowerPoint Themes And PowerPoint Slides 0411
Microsoft PowerPoint Theme and Slide with dump truck Your thoughts will never falter with our Dump Truck Travel PowerPoint Themes And PowerPoint Slides 0411. They are adept at cueing you in.
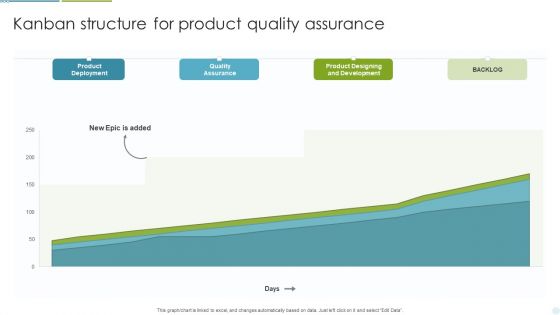
Kanban Structure For Product Quality Assurance Ppt Portfolio Deck PDF
This graph or chart is linked to excel, and changes automatically based on data. Just left click on it and select Edit Data. Pitch your topic with ease and precision using this Kanban Structure For Product Quality Assurance Ppt Portfolio Deck PDF. This layout presents information on Product Deployment, Quality Assurance, Product, Designing And Development. It is also available for immediate download and adjustment. So, changes can be made in the color, design, graphics or any other component to create a unique layout.
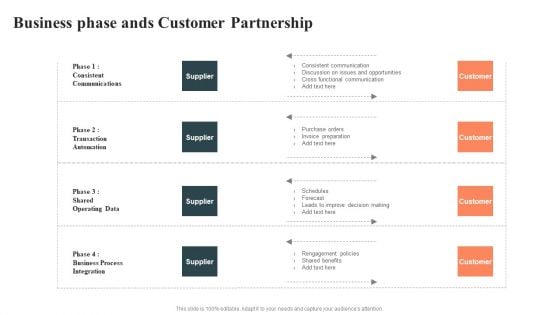
Business Phase Ands Customer Partnership Formats PDF
Pitch your topic with ease and precision using this Business Phase Ands Customer Partnership Formats PDF. This layout presents information on Supplier, Cross Functional Communication, Operating Data. It is also available for immediate download and adjustment. So, changes can be made in the color, design, graphics or any other component to create a unique layout.
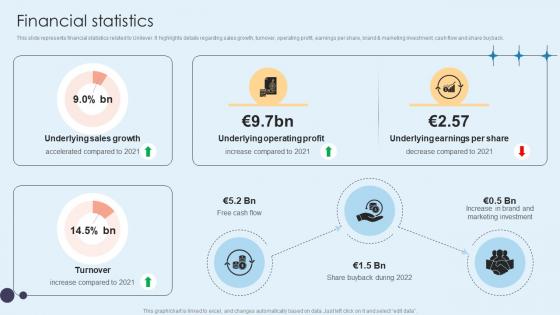
Financial Statistics Home Care Solutions Company Profile CP SS V
This slide represents financial statistics related to Unilever. It highlights details regarding sales growth, turnover, operating profit, earnings per share, brand and marketing investment, cash flow and share buyback.Formulating a presentation can take up a lot of effort and time, so the content and message should always be the primary focus. The visuals of the PowerPoint can enhance the presenters message, so our Financial Statistics Home Care Solutions Company Profile CP SS V was created to help save time. Instead of worrying about the design, the presenter can concentrate on the message while our designers work on creating the ideal templates for whatever situation is needed. Slidegeeks has experts for everything from amazing designs to valuable content, we have put everything into Financial Statistics Home Care Solutions Company Profile CP SS V. This slide represents financial statistics related to Unilever. It highlights details regarding sales growth, turnover, operating profit, earnings per share, brand and marketing investment, cash flow and share buyback.

House Locked With Padlock And Bank Security PowerPoint Templates And PowerPoint Themes 0912
House Locked With Padlock And Bank Security PowerPoint Templates And PowerPoint Themes 0912-Microsoft Powerpoint Templates and Background with house locked with padlock and piggy bank-House locked with padlock and piggy bank, business, security, real estate, construction, success Resolve problems with our House Locked With Padlock And Bank Security PowerPoint Templates And PowerPoint Themes 0912. Download without worries with our money back guaranteee.
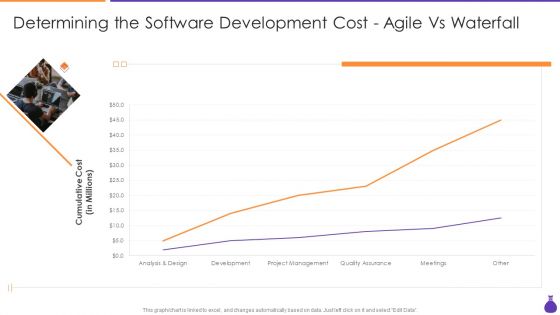
Why Is Agile Cost Effective IT Determining The Software Development Cost Agile Demonstration PDF
This graph or chart is linked to excel, and changes automatically based on data. Just left click on it and select Edit Data. Deliver and pitch your topic in the best possible manner with this Why Is Agile Cost Effective IT Determining The Software Development Cost Agile Demonstration PDF. Use them to share invaluable insights on Analysis And Design, Development, Project Management, Quality Assurance and impress your audience. This template can be altered and modified as per your expectations. So, grab it now.

Key Statistics Associated With Global E Commerce Smartphones Industry Report PPT Presentation IR SS V
The slide presents a comprehensive overview of the e commerce electronics market in order to give stakeholders useful information that will help them make strategic decisions. The statistics for the global markets are covered in the slide indicating the potential for any new business, product, or service. If you are looking for a format to display your unique thoughts, then the professionally designed Key Statistics Associated With Global E Commerce Smartphones Industry Report PPT Presentation IR SS V is the one for you. You can use it as a Google Slides template or a PowerPoint template. Incorporate impressive visuals, symbols, images, and other charts. Modify or reorganize the text boxes as you desire. Experiment with shade schemes and font pairings. Alter, share or cooperate with other people on your work. Download Key Statistics Associated With Global E Commerce Smartphones Industry Report PPT Presentation IR SS V and find out how to give a successful presentation. Present a perfect display to your team and make your presentation unforgettable. The slide presents a comprehensive overview of the e commerce electronics market in order to give stakeholders useful information that will help them make strategic decisions. The statistics for the global markets are covered in the slide indicating the potential for any new business, product, or service.
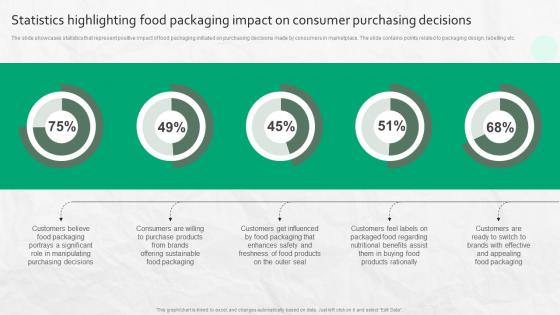
Statistics Highlighting Food Packaging Impact On Consumer Purchasing Decisions
The slide showcases statistics that represent positive impact of food packaging initiated on purchasing decisions made by consumers in marketplace. The slide contains points related to packaging design, labelling etc. Do you know about Slidesgeeks Statistics Highlighting Food Packaging Impact On Consumer Purchasing Decisions These are perfect for delivering any kind od presentation. Using it, create PowerPoint presentations that communicate your ideas and engage audiences. Save time and effort by using our pre-designed presentation templates that are perfect for a wide range of topic. Our vast selection of designs covers a range of styles, from creative to business, and are all highly customizable and easy to edit. Download as a PowerPoint template or use them as Google Slides themes. The slide showcases statistics that represent positive impact of food packaging initiated on purchasing decisions made by consumers in marketplace. The slide contains points related to packaging design, labelling etc.
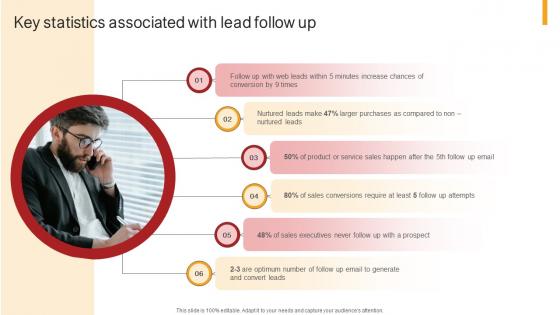
Remote Sales Plan For Lead Key Statistics Associated With Lead Follow Up Strategy SS V
Retrieve professionally designed Remote Sales Plan For Lead Key Statistics Associated With Lead Follow Up Strategy SS V to effectively convey your message and captivate your listeners. Save time by selecting pre-made slideshows that are appropriate for various topics, from business to educational purposes. These themes come in many different styles, from creative to corporate, and all of them are easily adjustable and can be edited quickly. Access them as PowerPoint templates or as Google Slides themes. You do not have to go on a hunt for the perfect presentation because Slidegeeks got you covered from everywhere. Our Remote Sales Plan For Lead Key Statistics Associated With Lead Follow Up Strategy SS V are topically designed to provide an attractive backdrop to any subject. Use them to look like a presentation pro.

Bar Graph Showing Revenues Generated By Sales Department Ppt Portfolio Graphics Example PDF
This graph or chart is linked to excel, and changes automatically based on data. Just left click on it and select edit data. Showcasing this set of slides titled bar graph showing revenues generated by sales department ppt portfolio graphics example pdf. The topics addressed in these templates are yearly sales revenues, sales team, profits. All the content presented in this PPT design is completely editable. Download it and make adjustments in color, background, font etc. as per your unique business setting.
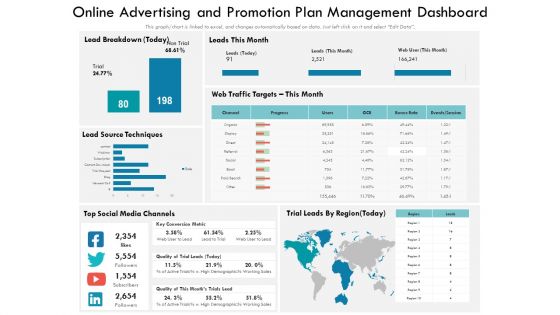
Online Advertising And Promotion Plan Management Dashboard Ppt PowerPoint Presentation Show Tips PDF
This graph chart is linked to excel, and changes automatically based on data. Just left click on it and select Edit Data. Showcasing this set of slides titled online advertising and promotion plan management dashboard ppt powerpoint presentation show tips pdf. The topics addressed in these templates are source techniques, social media channels, traffic targets. All the content presented in this PPT design is completely editable. Download it and make adjustments in color, background, font etc. as per your unique business setting.
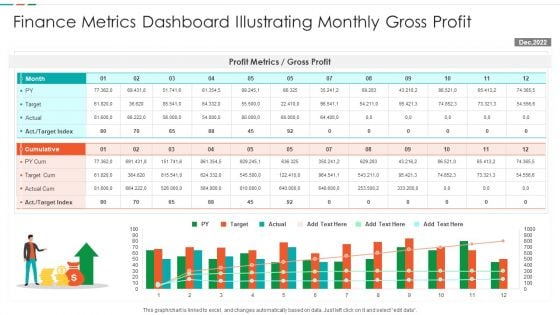
Finance Metrics Dashboard Illustrating Monthly Gross Profit Formats PDF
This graph or chart is linked to excel, and changes automatically based on data. Just left click on it and select edit data. Showcasing this set of slides titled Finance Metrics Dashboard Illustrating Monthly Gross Profit Formats PDF. The topics addressed in these templates are Profit Metrics Gross, Profit Target Cum, Actual Cum Target. All the content presented in this PPT design is completely editable. Download it and make adjustments in color, background, font etc. as per your unique business setting.
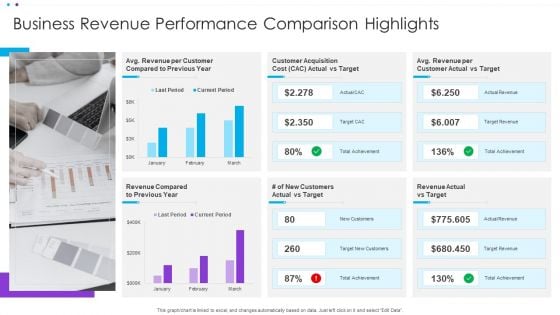
Business Revenue Performance Comparison Highlights Ppt Summary Rules PDF
This graph or chart is linked to excel, and changes automatically based on data. Just left click on it and select Edit Data. Showcasing this set of slides titled Business Revenue Performance Comparison Highlights Ppt Summary Rules PDF. The topics addressed in these templates are Customer Acquisition, Customer Actual, Revenue Compared. All the content presented in this PPT design is completely editable. Download it and make adjustments in color, background, font etc. as per your unique business setting.
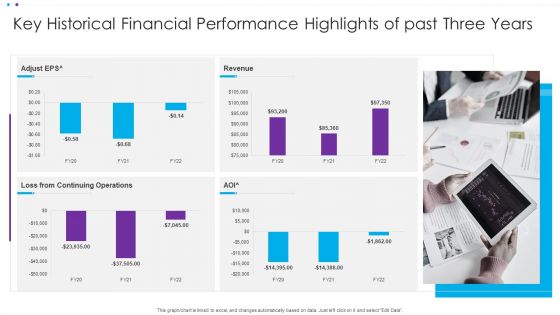
Key Historical Financial Performance Highlights Of Past Three Years Ppt Ideas Background PDF
This graph or chart is linked to excel, and changes automatically based on data. Just left click on it and select Edit Data. Showcasing this set of slides titled Key Historical Financial Performance Highlights Of Past Three Years Ppt Ideas Background PDF. The topics addressed in these templates are Continuing Operations, Adjust EP. All the content presented in this PPT design is completely editable. Download it and make adjustments in color, background, font etc. as per your unique business setting.
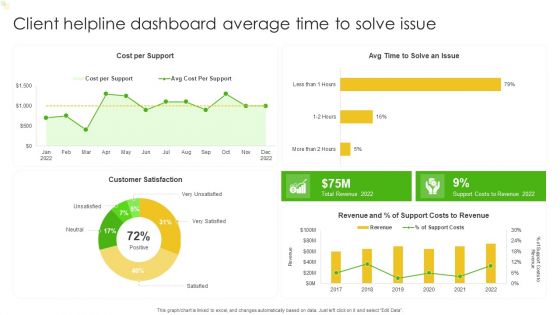
Client Helpline Dashboard Average Time To Solve Issue Ppt Portfolio Visuals PDF
This graph or chart is linked to excel, and changes automatically based on data. Just left click on it and select Edit Data. Showcasing this set of slides titled Client Helpline Dashboard Average Time To Solve Issue Ppt Portfolio Visuals PDF. The topics addressed in these templates are Cost Per Support, Customer Satisfaction, Costs To Revenue. All the content presented in this PPT design is completely editable. Download it and make adjustments in color, background, font etc. as per your unique business setting.
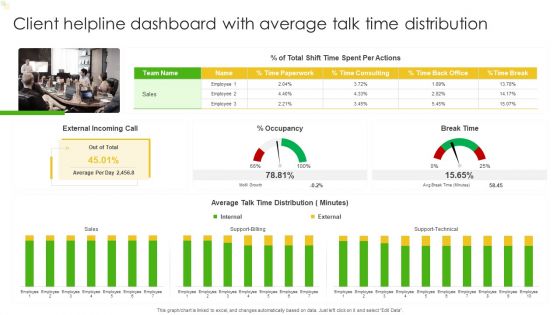
Client Helpline Dashboard With Average Talk Time Distribution Ppt Gallery Backgrounds PDF
This graph or chart is linked to excel, and changes automatically based on data. Just left click on it and select Edit Data. Showcasing this set of slides titled Client Helpline Dashboard With Average Talk Time Distribution Ppt Gallery Backgrounds PDF. The topics addressed in these templates are External Incoming Call, Occupancy, Break Time, Sales. All the content presented in this PPT design is completely editable. Download it and make adjustments in color, background, font etc. as per your unique business setting.
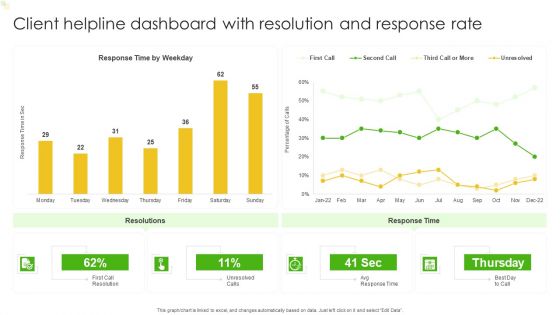
Client Helpline Dashboard With Resolution And Response Rate Ppt File Example Topics PDF
This graph or chart is linked to excel, and changes automatically based on data. Just left click on it and select Edit Data. Showcasing this set of slides titled Client Helpline Dashboard With Resolution And Response Rate Ppt File Example Topics PDF. The topics addressed in these templates are Resolutions, Response Time, Response Time Weekday. All the content presented in this PPT design is completely editable. Download it and make adjustments in color, background, font etc. as per your unique business setting.
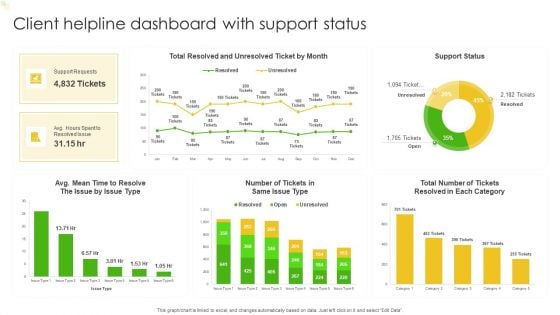
Client Helpline Dashboard With Support Status Ppt Portfolio Rules PDF
This graph or chart is linked to excel, and changes automatically based on data. Just left click on it and select Edit Data. Showcasing this set of slides titled Client Helpline Dashboard With Support Status Ppt Portfolio Rules PDF. The topics addressed in these templates are Total Number, Support Requests, Total Resolved, Support Status. All the content presented in this PPT design is completely editable. Download it and make adjustments in color, background, font etc. as per your unique business setting.
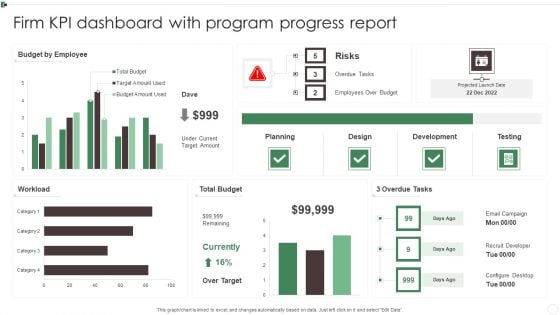
Firm KPI Dashboard With Program Progress Report Ppt Pictures Deck PDF
This graph or chart is linked to excel, and changes automatically based on data. Just left click on it and select Edit Data. Showcasing this set of slides titled Firm KPI Dashboard With Program Progress Report Ppt Pictures Deck PDF. The topics addressed in these templates are Budget By Employee, Total Budget, 3 Overdue Tasks, Workload. All the content presented in this PPT design is completely editable. Download it and make adjustments in color, background, font etc. as per your unique business setting.
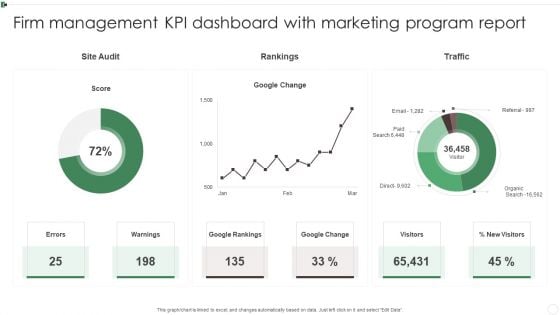
Firm Management KPI Dashboard With Marketing Program Report Ppt Styles Introduction PDF
This graph or chart is linked to excel, and changes automatically based on data. Just left click on it and select Edit Data. Showcasing this set of slides titled Firm Management KPI Dashboard With Marketing Program Report Ppt Styles Introduction PDF. The topics addressed in these templates are Google Rankings, Google Change, Warnings, Visitors. All the content presented in this PPT design is completely editable. Download it and make adjustments in color, background, font etc. as per your unique business setting.
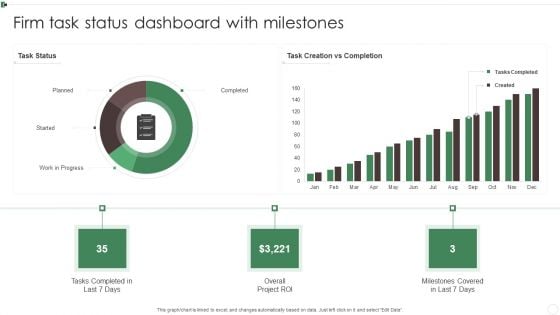
Firm Task Status Dashboard With Milestones Ppt Show Sample PDF
This graph or chart is linked to excel, and changes automatically based on data. Just left click on it and select Edit Data. Showcasing this set of slides titled Firm Task Status Dashboard With Milestones Ppt Show Sample PDF. The topics addressed in these templates are Tasks Completed, Planned, Work Progress, Overall Project ROI. All the content presented in this PPT design is completely editable. Download it and make adjustments in color, background, font etc. as per your unique business setting.
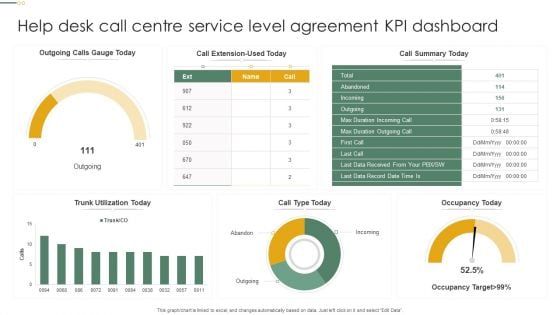
Help Desk Call Centre Service Level Agreement KPI Dashboard Pictures PDF
This graph or chart is linked to excel, and changes automatically based on data. Just left click on it and select Edit Data. Showcasing this set of slides titled Help Desk Call Centre Service Level Agreement KPI Dashboard Pictures PDF. The topics addressed in these templates are Call Type Today, Occupancy Today, Call Summary Today. All the content presented in this PPT design is completely editable. Download it and make adjustments in color, background, font etc. as per your unique business setting.
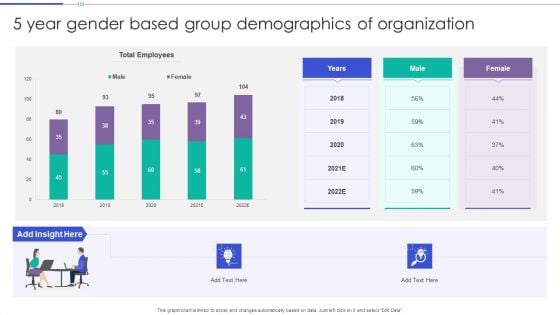
5 Year Gender Based Group Demographics Of Organization Background PDF
This graph or chart is linked to excel, and changes automatically based on data. Just left click on it and select Edit Data. Showcasing this set of slides titled 5 Year Gender Based Group Demographics Of Organization Background PDF. The topics addressed in these templates are Total Employees, Male, Female. All the content presented in this PPT design is completely editable. Download it and make adjustments in color, background, font etc. as per your unique business setting.
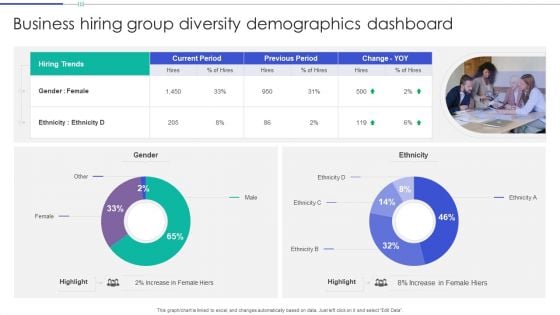
Business Hiring Group Diversity Demographics Dashboard Guidelines PDF
This graph or chart is linked to excel, and changes automatically based on data. Just left click on it and select Edit Data. Showcasing this set of slides titled Business Hiring Group Diversity Demographics Dashboard Guidelines PDF. The topics addressed in these templates are Hiring Trends, Current Period, Previous Period. All the content presented in this PPT design is completely editable. Download it and make adjustments in color, background, font etc. as per your unique business setting.
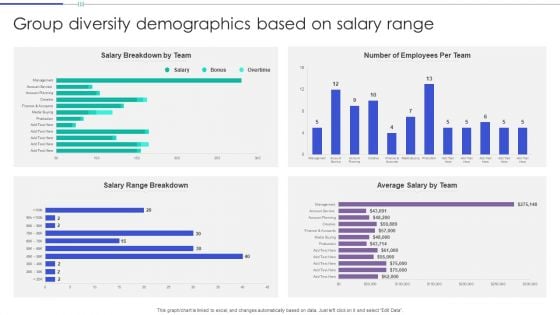
Group Diversity Demographics Based On Salary Range Portrait PDF
This graph or chart is linked to excel, and changes automatically based on data. Just left click on it and select Edit Data. Showcasing this set of slides titled Group Diversity Demographics Based On Salary Range Portrait PDF. The topics addressed in these templates are Salary Breakdown Team, Number Employees, Per Team. All the content presented in this PPT design is completely editable. Download it and make adjustments in color, background, font etc. as per your unique business setting.
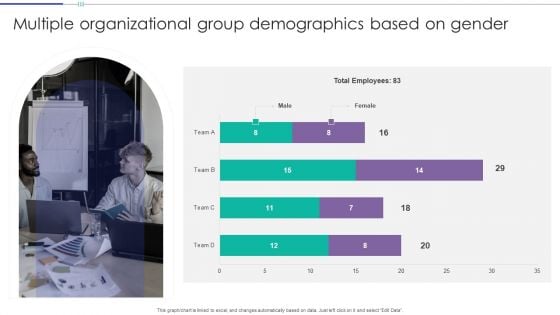
Multiple Organizational Group Demographics Based On Gender Download PDF
This graph or chart is linked to excel, and changes automatically based on data. Just left click on it and select Edit Data. Showcasing this set of slides titled Multiple Organizational Group Demographics Based On Gender Download PDF. The topics addressed in these templates are Total Employees, Team, Female. All the content presented in this PPT design is completely editable. Download it and make adjustments in color, background, font etc. as per your unique business setting.
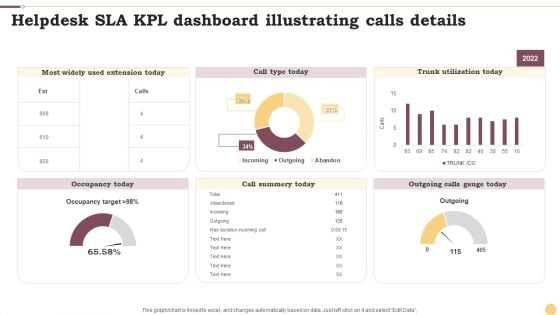
Helpdesk SLA KPL Dashboard Illustrating Calls Details Ppt Slides Show PDF
This graph or chart is linked to excel, and changes automatically based on data. Just left click on it and select Edit Data. Showcasing this set of slides titled Helpdesk SLA KPL Dashboard Illustrating Calls Details Ppt Slides Show PDF. The topics addressed in these templates are Call Type Today, Trunk Utilization Today, Call Summery Today. All the content presented in this PPT design is completely editable. Download it and make adjustments in color, background, font etc. as per your unique business setting.
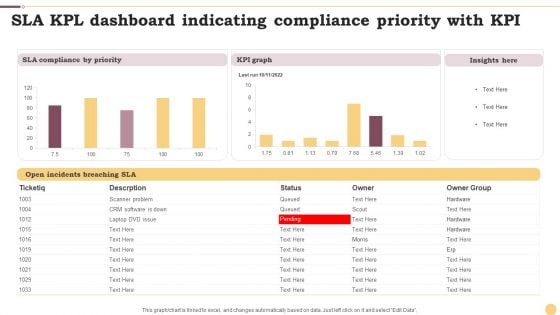
SLA KPL Dashboard Indicating Compliance Priority With KPI Ppt File Format PDF
This graph or chart is linked to excel, and changes automatically based on data. Just left click on it and select Edit Data. Showcasing this set of slides titled SLA KPL Dashboard Indicating Compliance Priority With KPI Ppt File Format PDF. The topics addressed in these templates are KPI Graph, Insights Here, SLA Compliance Priority. All the content presented in this PPT design is completely editable. Download it and make adjustments in color, background, font etc. as per your unique business setting.
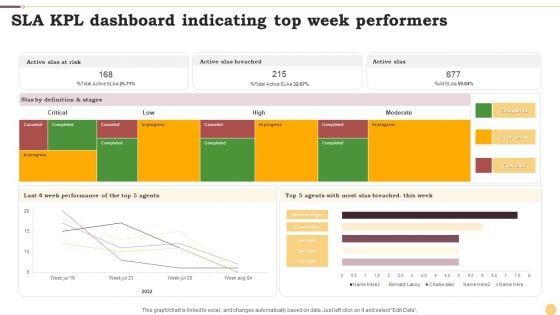
SLA KPL Dashboard Indicating Top Week Performers Ppt Infographics Examples PDF
This graph or chart is linked to excel, and changes automatically based on data. Just left click on it and select Edit Data. Showcasing this set of slides titled SLA KPL Dashboard Indicating Top Week Performers Ppt Infographics Examples PDF. The topics addressed in these templates are Active Slas Risk, Active Slas Breached, Active Slas. All the content presented in this PPT design is completely editable. Download it and make adjustments in color, background, font etc. as per your unique business setting.
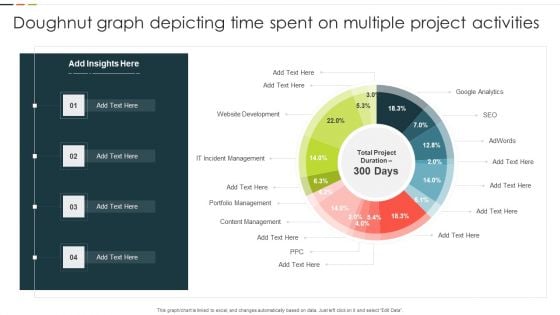
Doughnut Graph Depicting Time Spent On Multiple Project Activities Microsoft PDF
This graph or chart is linked to excel, and changes automatically based on data. Just left click on it and select Edit Data. Showcasing this set of slides titled Doughnut Graph Depicting Time Spent On Multiple Project Activities Microsoft PDF. The topics addressed in these templates are Website Development, IT Incident Management, Portfolio Management. All the content presented in this PPT design is completely editable. Download it and make adjustments in color, background, font etc. as per your unique business setting.
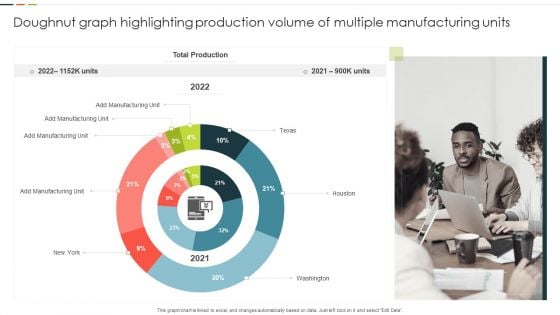
Doughnut Graph Highlighting Production Volume Of Multiple Manufacturing Units Guidelines PDF
This graph or chart is linked to excel, and changes automatically based on data. Just left click on it and select Edit Data. Showcasing this set of slides titled Doughnut Graph Highlighting Production Volume Of Multiple Manufacturing Units Guidelines PDF. The topics addressed in these templates are Total Production, Manufacturing Unit, Washington. All the content presented in this PPT design is completely editable. Download it and make adjustments in color, background, font etc. as per your unique business setting.
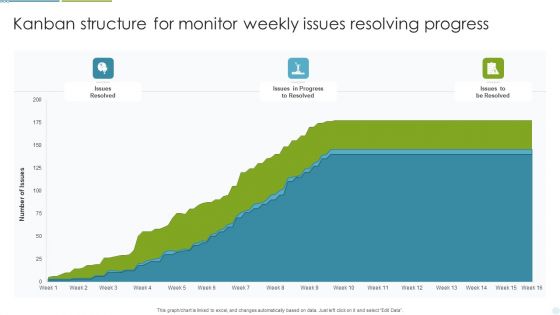
Kanban Structure For Monitor Weekly Issues Resolving Progress Ppt Professional Outline PDF
This graph or chart is linked to excel, and changes automatically based on data. Just left click on it and select Edit Data. Showcasing this set of slides titled Kanban Structure For Monitor Weekly Issues Resolving Progress Ppt Professional Outline PDF. The topics addressed in these templates are Issues Resolved, Progress To Resolved, Issues To Resolved. All the content presented in this PPT design is completely editable. Download it and make adjustments in color, background, font etc. as per your unique business setting.
Kanban Structure For Yearly Project Progress Tracking Ppt File Example Introduction PDF
This graph or chart is linked to excel, and changes automatically based on data. Just left click on it and select Edit Data. Showcasing this set of slides titled Kanban Structure For Yearly Project Progress Tracking Ppt File Example Introduction PDF. The topics addressed in these templates are Number Projects, Backlog Approved, Final Review. All the content presented in this PPT design is completely editable. Download it and make adjustments in color, background, font etc. as per your unique business setting.
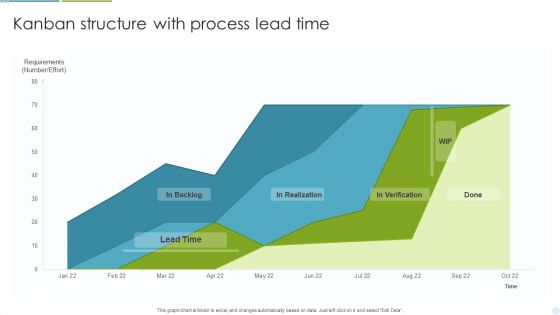
Kanban Structure With Process Lead Time Ppt Gallery Template PDF
This graph or chart is linked to excel, and changes automatically based on data. Just left click on it and select Edit Data. Showcasing this set of slides titled Kanban Structure With Process Lead Time Ppt Gallery Template PDF. The topics addressed in these templates are Lead Time, In Realization, Requirements. All the content presented in this PPT design is completely editable. Download it and make adjustments in color, background, font etc. as per your unique business setting.
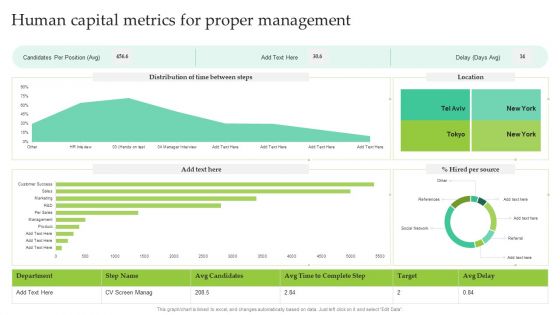
Human Capital Metrics For Proper Management Ppt Show Inspiration PDF
This graph or chart is linked to excel, and changes automatically based on data. Just left click on it and select Edit Data. Showcasing this set of slides titled Human Capital Metrics For Proper Management Ppt Show Inspiration PDF. The topics addressed in these templates are Candidates Per Position, Hired Per Source, Location. All the content presented in this PPT design is completely editable. Download it and make adjustments in color, background, font etc. as per your unique business setting.
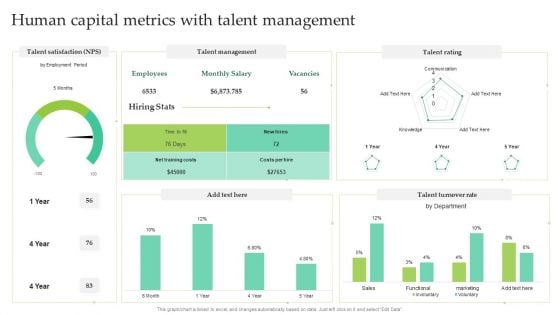
Human Capital Metrics With Talent Management Ppt Layouts Mockup PDF
This graph or chart is linked to excel, and changes automatically based on data. Just left click on it and select Edit Data. Showcasing this set of slides titled Human Capital Metrics With Talent Management Ppt Layouts Mockup PDF. The topics addressed in these templates are Talent Management, Talent Rating, Talent Turnover Rate. All the content presented in this PPT design is completely editable. Download it and make adjustments in color, background, font etc. as per your unique business setting.
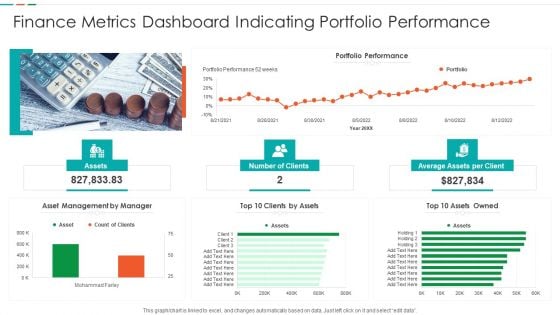
Finance Metrics Dashboard Indicating Portfolio Performance Microsoft PDF
This graph or chart is linked to excel, and changes automatically based on data. Just left click on it and select edit data. Pitch your topic with ease and precision using this Finance Metrics Dashboard Indicating Portfolio Performance Microsoft PDF. This layout presents information on Portfolio Performance Portfolio, Asset Management Manager, Top 10 Assets. It is also available for immediate download and adjustment. So, changes can be made in the color, design, graphics or any other component to create a unique layout.
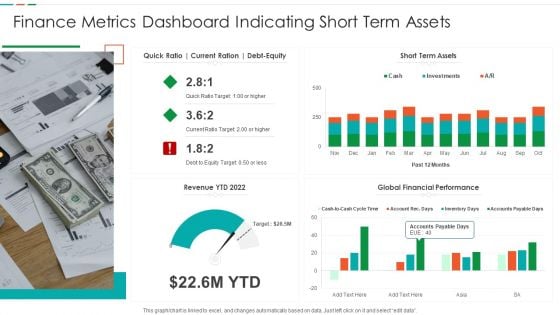
Finance Metrics Dashboard Indicating Short Term Assets Download PDF
This graph or chart is linked to excel, and changes automatically based on data. Just left click on it and select edit data. Pitch your topic with ease and precision using this Finance Metrics Dashboard Indicating Short Term Assets Download PDF. This layout presents information on Short Term Assets, Global Financial Performance, Revenue YTD 2022. It is also available for immediate download and adjustment. So, changes can be made in the color, design, graphics or any other component to create a unique layout.
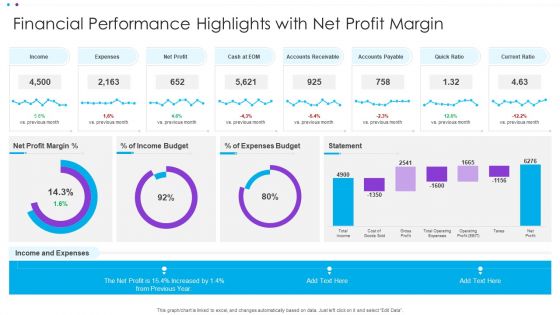
Financial Performance Highlights With Net Profit Margin Ppt Model Ideas PDF
This graph or chart is linked to excel, and changes automatically based on data. Just left click on it and select Edit Data. Pitch your topic with ease and precision using this Financial Performance Highlights With Net Profit Margin Ppt Model Ideas PDF. This layout presents information on Net Profit, Accounts Receivable, Accounts Payable. It is also available for immediate download and adjustment. So, changes can be made in the color, design, graphics or any other component to create a unique layout.
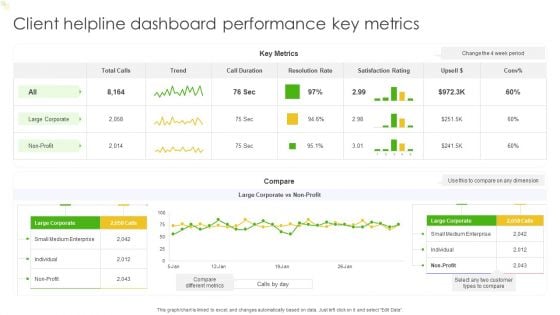
Client Helpline Dashboard Performance Key Metrics Ppt Outline Deck PDF
This graph or chart is linked to excel, and changes automatically based on data. Just left click on it and select Edit Data. Pitch your topic with ease and precision using this Client Helpline Dashboard Performance Key Metrics Ppt Outline Deck PDF. This layout presents information on Key Metrics, Trend, Compare. It is also available for immediate download and adjustment. So, changes can be made in the color, design, graphics or any other component to create a unique layout.
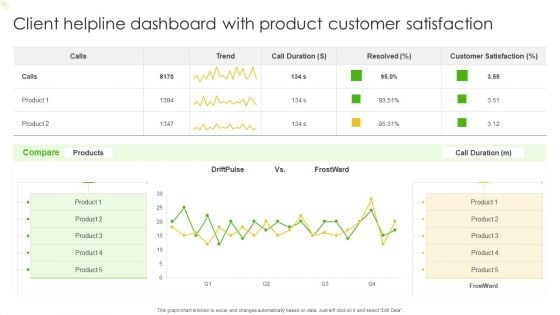
Client Helpline Dashboard With Product Customer Satisfaction Ppt Slides Graphics Template PDF
This graph or chart is linked to excel, and changes automatically based on data. Just left click on it and select Edit Data. Pitch your topic with ease and precision using this Client Helpline Dashboard With Product Customer Satisfaction Ppt Slides Graphics Template PDF. This layout presents information on Customer Satisfaction, Product, Compare. It is also available for immediate download and adjustment. So, changes can be made in the color, design, graphics or any other component to create a unique layout.


 Continue with Email

 Home
Home


