Data Architecture
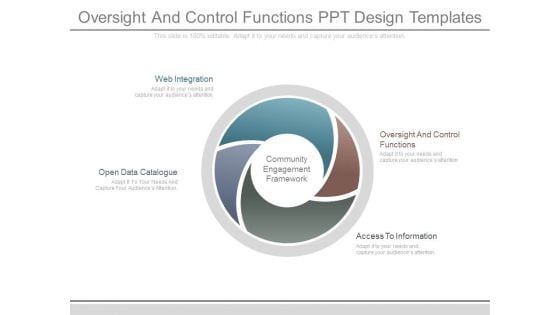
Oversight And Control Functions Ppt Design Templates
This is a oversight and control functions ppt design templates. This is a four stage process. The stages in this process are web integration, oversight and control functions, access to information, open data catalogue, community engagement framework.
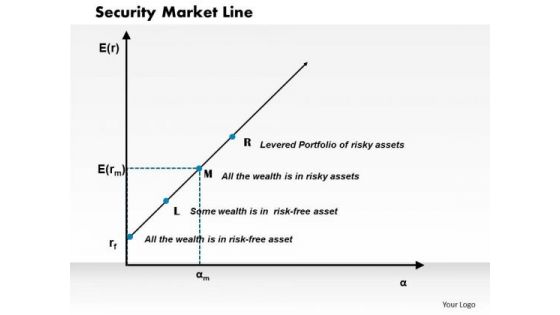
Business Framework Security Market Line PowerPoint Presentation
This diagram displays graph of security market line. You can use line graph to plot changes in data over time, such as monthly revenue and earnings changes or daily changes in stock market prices.
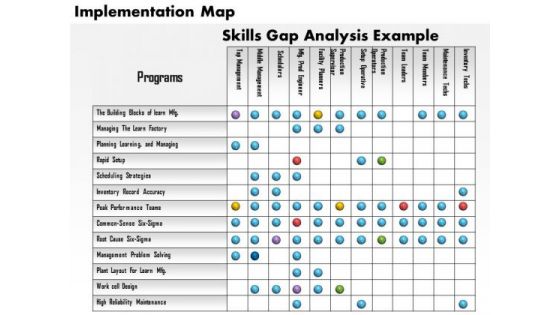
Business Framework Implementation Map PowerPoint Presentation
Graphic of implementation map has been used to decorate this power point diagram slide. This PPT slide contains the concept of data representation. This PPT diagram slide can be used for business and finance related presentations.
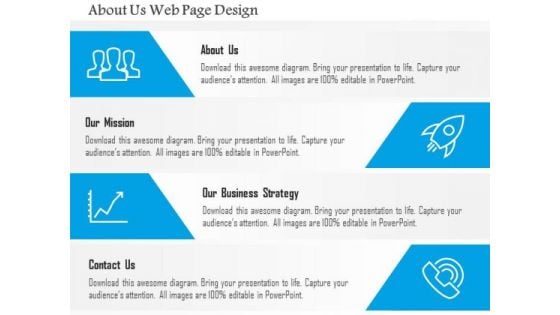
Business Diagram About Us Web Page Design Presentation Template
This power point template diagram has been designed with graphic of four icons. This PPT can represent the concept of building about us. This PPT is suitable for business and data related presentations.
Five Steps Infographic Design Powerpoint Templates
Our above slide contains graphics of six hands around bulb. It helps to display steps of idea planning. Use this diagram to impart more clarity to data and to create more sound impact on viewers.
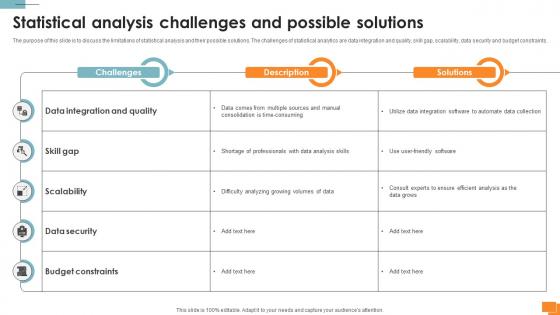
Statistical Tools For Evidence Statistical Analysis Challenges And Possible Solutions
The purpose of this slide is to discuss the limitations of statistical analysis and their possible solutions. The challenges of statistical analytics are data integration and quality, skill gap, scalability, data security and budget constraints. Take your projects to the next level with our ultimate collection of Statistical Tools For Evidence Statistical Analysis Challenges And Possible Solutions. Slidegeeks has designed a range of layouts that are perfect for representing task or activity duration, keeping track of all your deadlines at a glance. Tailor these designs to your exact needs and give them a truly corporate look with your own brand colors they will make your projects stand out from the rest The purpose of this slide is to discuss the limitations of statistical analysis and their possible solutions. The challenges of statistical analytics are data integration and quality, skill gap, scalability, data security and budget constraints.
Diamond Design With Two Levels And Eight Stages Powerpoint Template
Our above slide contains graphics of diamond design with two levels and eight stages. It helps to display concepts in visual manner. Use this diagram to impart more clarity to data and to create more sound impact on viewers.
Four Options Zigzag Infographics Powerpoint Template
Emphatically define your message with our above template which contains four options zigzag infographic. This business diagram may be used to plot data series. Deliver amazing presentations to mesmerize your audience.
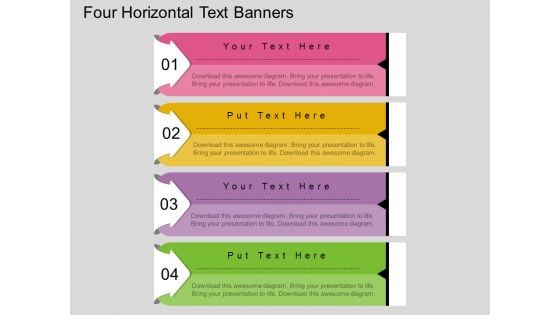
Four Horizontal Text Banners Powerpoint Template
This PowerPoint template has been designed with four horizontal text banners. This diagram is excellent visual tools for business presentations. Download this PPT slide to explain complex data immediately and clearly.
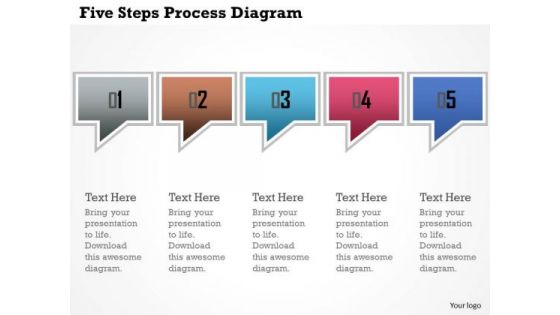
Business Diagram Five Steps Process Diagram Presentation Template
This power point template has been crafted with graphic of five dialogue boxes. This PPT contains the concept of text and data representation. Use this PPT for your business and marketing related presentations.
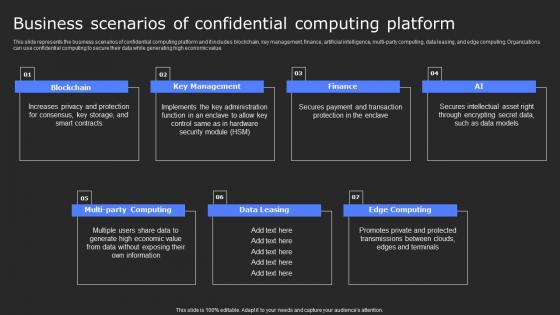
Business Scenarios Of Confidential Computing Secure Computing Framework Information Pdf
This slide represents the business scenarios of confidential computing platform and it includes blockchain, key management, finance, artificial intelligence, multi-party computing, data leasing, and edge computing. Organizations can use confidential computing to secure their data while generating high economic value. There are so many reasons you need a Business Scenarios Of Confidential Computing Secure Computing Framework Information Pdf. The first reason is you can not spend time making everything from scratch, Thus, Slidegeeks has made presentation templates for you too. You can easily download these templates from our website easily. This slide represents the business scenarios of confidential computing platform and it includes blockchain, key management, finance, artificial intelligence, multi-party computing, data leasing, and edge computing. Organizations can use confidential computing to secure their data while generating high economic value.

Challenges And Solutions Associated With Text Analytics PPT Template SS
This slide outlines the challenges and solutions associated with text analytics, such as noisy, incomplete, inconsistent, complex data, data integration, etc. Are you in need of a template that can accommodate all of your creative concepts This one is crafted professionally and can be altered to fit any style. Use it with Google Slides or PowerPoint. Include striking photographs, symbols, depictions, and other visuals. Fill, move around, or remove text boxes as desired. Test out color palettes and font mixtures. Edit and save your work, or work with colleagues. Download Challenges And Solutions Associated With Text Analytics PPT Template SS and observe how to make your presentation outstanding. Give an impeccable presentation to your group and make your presentation unforgettable. This slide outlines the challenges and solutions associated with text analytics, such as noisy, incomplete, inconsistent, complex data, data integration, etc.
Four Colored Text Boxes With Icons Powerpoint Slides
This PowerPoint template has been designed with graphics of four text boxes. Download this PPT slide to display percentage data display. Use this professional template to build an exclusive presentation.
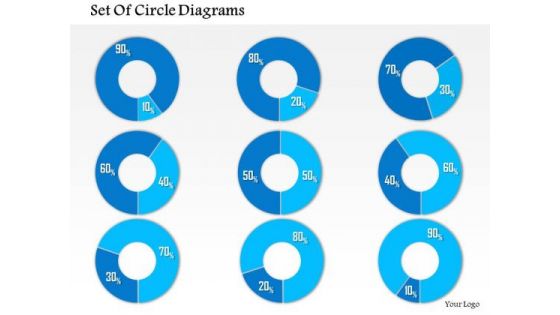
Business Framework 10 Percent To 90 Percent PowerPoint Presentation
This business diagram has been designed with graphic of multiple pie graphs. This diagram slide contains the concept of result analysis with percentage values. Use this diagram to present and compare data in an impressive manner
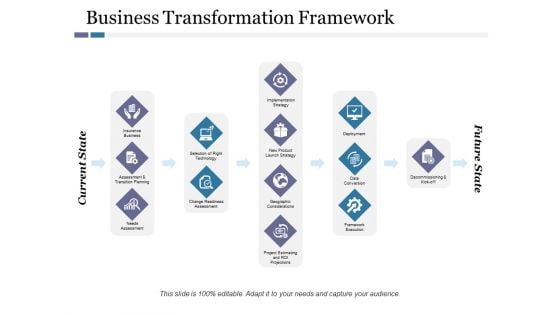
Business Transformation Framework Ppt PowerPoint Presentation Gallery Summary
This is a business transformation framework ppt powerpoint presentation gallery summary. This is a five stage process. The stages in this process are implementation strategy, new product launch strategy, selection of right technology, deployment, data conversion, framework execution.
Three Options Puzzle Diagram With Icons Powerpoint Slides
Our above slide contains graphics of three options puzzle diagram with icons. It helps to display concepts in visual manner. Use this diagram to impart more clarity to data and to create more sound impact on viewers.
Four Sequential Text Banners With Icons Powerpoint Template
This PowerPoint template has been designed with four sequential text banners and icons. This diagram is excellent visual tools for business presentations. Download this PPT slide to explain complex data immediately and clearly.
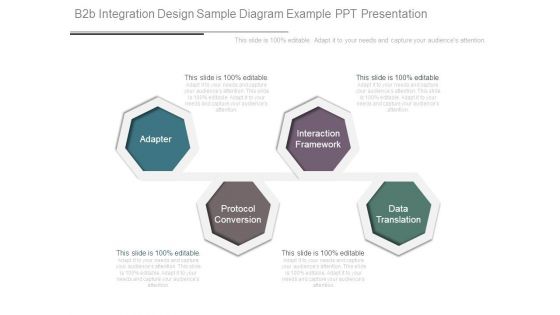
B2b Integration Design Sample Diagram Example Ppt Presentation
This is a b2b integration design sample diagram example ppt presentation. This is a four stage process. The stages in this process are adapter, protocol conversion, interaction framework, data translation.
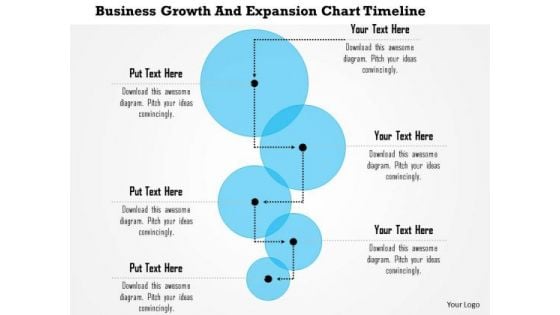
Business Framework Business Growth And Expansion Chart Timeline PowerPoint Presentation
Six staged process flow linear diagram is used to design this Power Point template. This PPT slide contains the concept of data and process flow. This exclusive PPT can be used for linear process flow representation in any presentation.
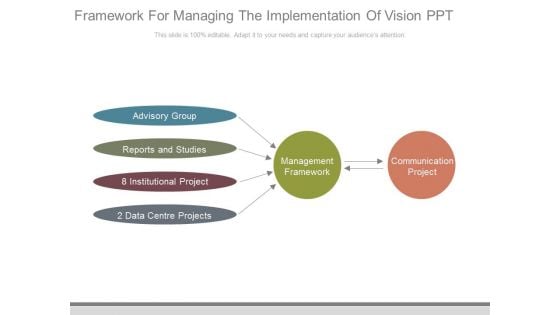
Framework For Managing The Implementation Of Vision Ppt
This is a framework for managing the implementation of vision ppt. This is a four stage process. The stages in this process are advisory group, reports and studies, 8 institutional project, 2 data centre projects, management framework, communication project.
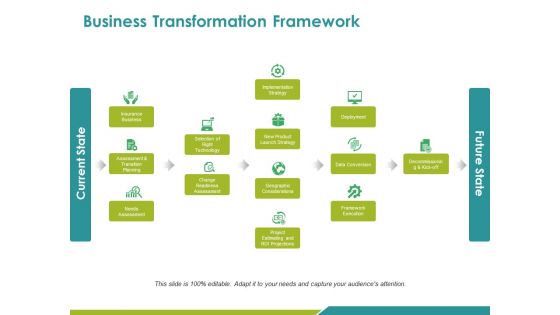
Business Transformation Framework Ppt PowerPoint Presentation Show Ideas
This is a business transformation framework ppt powerpoint presentation show ideas. This is a five stage process. The stages in this process are current state, deployment, data conversion, future state, needs assessment.
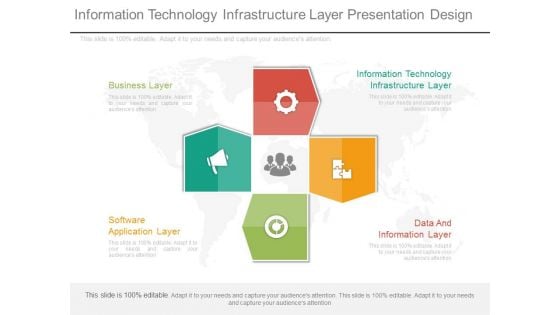
Information Technology Infrastructure Layer Presentation Design
This is an information technology infrastructure layer presentation design. This is a four stage process. The stages in this process are business layer, information technology infrastructure layer, data and information layer, software application layer.
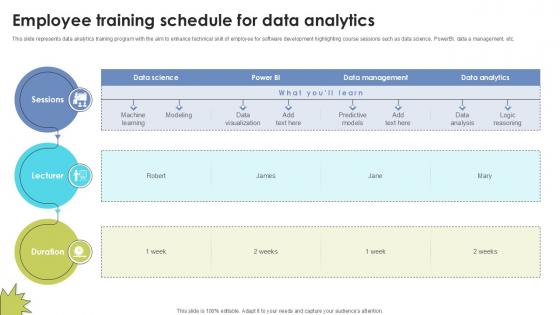
Employee Training Schedule For Skill Building Plan For Application PPT Slide DTE SS V
This slide represents data analytics training program with the aim to enhance technical skill of employee for software development highlighting course sessions such as data science, PowerBI, data a management, etc. Whether you have daily or monthly meetings, a brilliant presentation is necessary. Employee Training Schedule For Skill Building Plan For Application PPT Slide DTE SS V can be your best option for delivering a presentation. Represent everything in detail using Employee Training Schedule For Skill Building Plan For Application PPT Slide DTE SS V and make yourself stand out in meetings. The template is versatile and follows a structure that will cater to your requirements. All the templates prepared by Slidegeeks are easy to download and edit. Our research experts have taken care of the corporate themes as well. So, give it a try and see the results. This slide represents data analytics training program with the aim to enhance technical skill of employee for software development highlighting course sessions such as data science, PowerBI, data a management, etc.
Cloud Icons With Paper Clips PowerPoint Template
Visually support your presentation with our above template showing cloud icons with paper clips. This slide has been professionally designed to portray concepts like cloud computing and data storage. This template offers an excellent background to build impressive presentation.
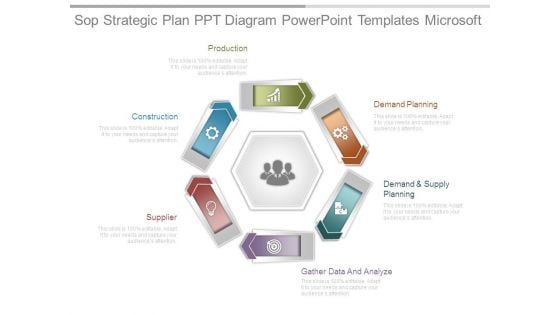
Sop Strategic Plan Ppt Diagram Powerpoint Templates Microsoft
This is a sop strategic plan ppt diagram powerpoint templates microsoft. This is a six stage process. The stages in this process are production, construction, supplier, gather data and analyze, demand and supply, demand planning.
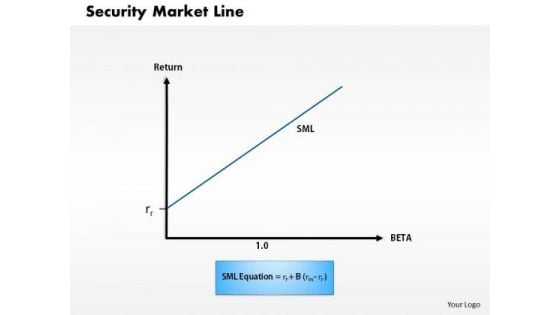
Business Framework Security Market Line 1 PowerPoint Presentation
This diagram displays graph of security market line. You can use line graph to plot changes in data over time, such as monthly revenue and earnings changes or daily changes in stock market prices.
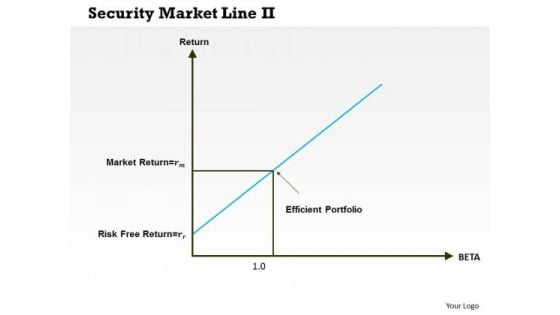
Business Framework Security Market Line 11 PowerPoint Presentation
This diagram displays graph of security market line. You can use line graph to plot changes in data over time, such as monthly revenue and earnings changes or daily changes in stock market prices.
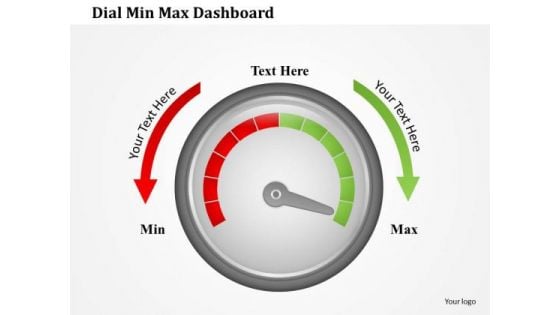
Business Framework Dial Min Max Dashboard PowerPoint Presentation
This professional power point template slide has been crafted with graphic of two funnels. These funnels are used to show any data calculation or process flow. Use this PPT for your business presentation and become a professional presenter.

Business Framework 3 Axis Graph Diagram PowerPoint Presentation
This business diagram displays 3 axis graphs with cubes. This editable slide contains the concept of business and success. Use this diagram in your business presentations to display data in graphical manner.

Business Framework Battery Charge Loading Bar PowerPoint Presentation
This business diagram displays bar graph of five battery cells. This business slide contains the concept of business growth shown in multiple levels. Use this diagram to present and compare data in an impressive manner.
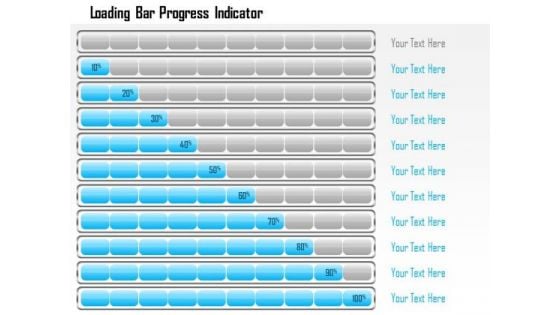
Business Framework Loading Bar Progress Indicator PowerPoint Presentation
This business diagram displays bar progress indicators. This business slide contains the concept of business growth shown in multiple levels. Use this diagram to present and compare data in an impressive manner.
Five Banners With Communication And Technology Icons Powerpoint Template
This PowerPoint template has been designed with five banners and communication technology icons. This diagram is excellent visual tools for business presentations. Download this PPT slide to explain complex data immediately and clearly.
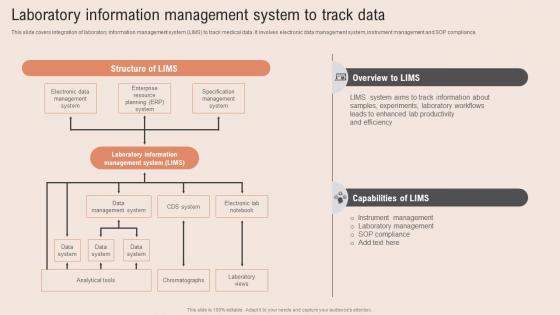
Laboratory Information Management Healthcare Information Tech To Enhance Medical Facilities Demonstration Pdf
This slide covers integration of laboratory information management system LIMS to track medical data. It involves electronic data management system, instrument management and SOP compliance. Slidegeeks has constructed Laboratory Information Management Healthcare Information Tech To Enhance Medical Facilities Demonstration Pdf after conducting extensive research and examination. These presentation templates are constantly being generated and modified based on user preferences and critiques from editors. Here, you will find the most attractive templates for a range of purposes while taking into account ratings and remarks from users regarding the content. This is an excellent jumping off point to explore our content and will give new users an insight into our top notch PowerPoint Templates. This slide covers integration of laboratory information management system LIMS to track medical data. It involves electronic data management system, instrument management and SOP compliance.
Stock Photo Graphics Of Laptop With Cloud Icon Pwerpoint Slide
This image has been designed with graphic of laptop and cloud icon. This image shows the concept of cloud computing and data communication. Build a presentation for cloud computing and networking related presentations.
Stock Photo Laptop With Blue Cloud Icon Pwerpoint Slide
This image has been designed with graphic of laptop and blue colored cloud icon. This image shows the concept of cloud computing and data communication. Build a presentation for cloud computing and networking related presentations.
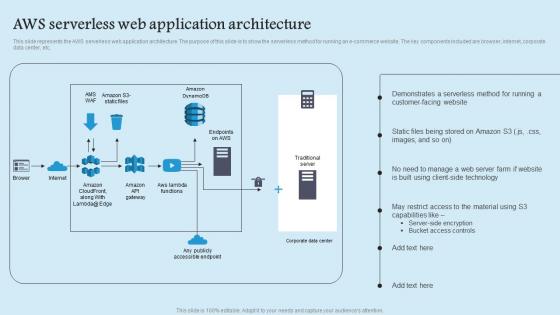
AWS Serverless Web Role Serverless Computing Modern Technology Template Pdf
This slide represents the AWS serverless web application architecture. The purpose of this slide is to show the serverless method for running an e commerce website. The key components included are browser, internet, corporate data center, etc. If your project calls for a presentation, then Slidegeeks is your go to partner because we have professionally designed, easy to edit templates that are perfect for any presentation. After downloading, you can easily edit AWS Serverless Web Role Serverless Computing Modern Technology Template Pdf and make the changes accordingly. You can rearrange slides or fill them with different images. Check out all the handy templates This slide represents the AWS serverless web application architecture. The purpose of this slide is to show the serverless method for running an e commerce website. The key components included are browser, internet, corporate data center, etc.

Five Banners For Management Development Process Powerpoint Template
This PowerPoint template has been designed with graphics of five text banners and icons. This diagram may be sued to display management development process. Download this PPT slide to explain complex data immediately and clearly.
Linear Arrow Process Diagram With Icons Powerpoint Template
This business slide has been designed with infographic of linear arrow. This arrow infographic can be used for data representation. Use this diagram for your business presentations. Build a quality presentation for your viewers with this unique diagram.
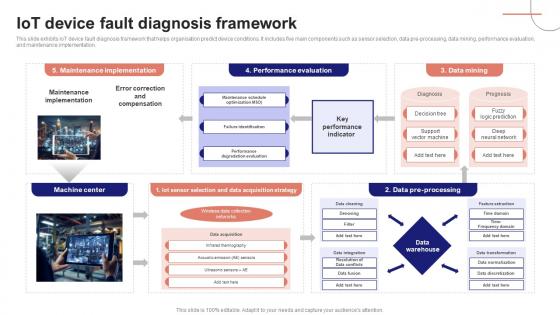
IoT Device Management Fundamentals IoT Device Fault Diagnosis Framework IoT Ss V
This slide exhibits IoT device fault diagnosis framework that helps organisation predict device conditions. It includes five main components such as sensor selection, data pre-processing, data mining, performance evaluation, and maintenance implementation. This IoT Device Management Fundamentals IoT Device Fault Diagnosis Framework IoT SS V from Slidegeeks makes it easy to present information on your topic with precision. It provides customization options, so you can make changes to the colors, design, graphics, or any other component to create a unique layout. It is also available for immediate download, so you can begin using it right away. Slidegeeks has done good research to ensure that you have everything you need to make your presentation stand out. Make a name out there for a brilliant performance. This slide exhibits IoT device fault diagnosis framework that helps organisation predict device conditions. It includes five main components such as sensor selection, data pre-processing, data mining, performance evaluation, and maintenance implementation.

Team Pictures With Names And Profile Powerpoint Slides
This PowerPoint template has been designed with team pictures and profile information. This diagram is excellent visual tools to present team profile. Download this PPT slide to explain complex data immediately and clearly.
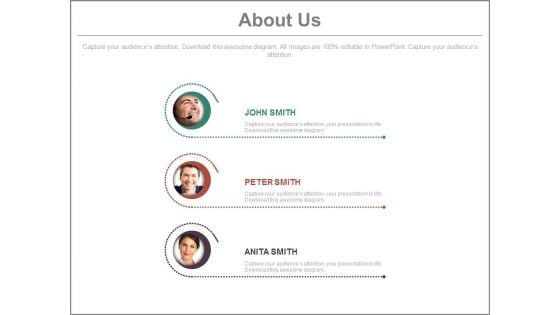
Team Profiles For About Us Slide Powerpoint Slides
This PowerPoint template has been designed with team pictures and profile information. This diagram is excellent visual tools to present team profile. Download this PPT slide to explain complex data immediately and clearly.

Business People Profile For Social Media Powerpoint Slides
This PowerPoint template has been designed with business people profile information. This diagram is excellent visual tools to present team profile with social media. Download this PPT slide to explain complex data immediately and clearly.
Content Management Powerpoint Slide Background Designs
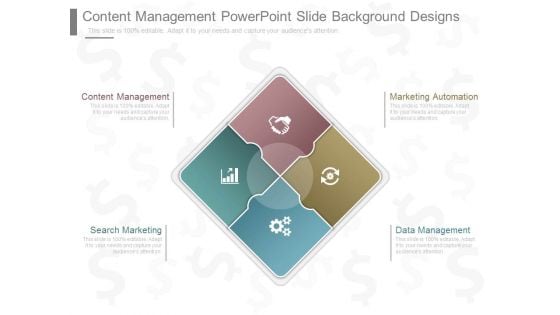
This is a content management powerpoint slide background designs. This is a four stage process. The stages in this process are marketing automation, data management, content management, search marketing.
Coalescer Section Powerpoint Slides Design
Linking Of Four Business Concepts Powerpoint Template
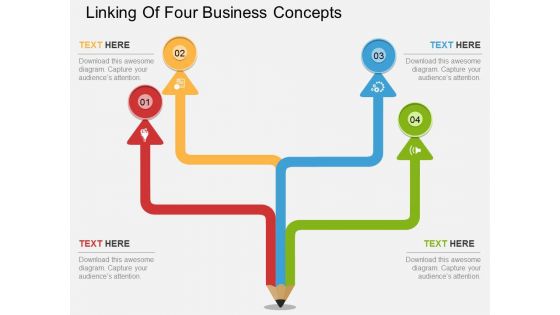
This PowerPoint template has been designed with four steps pencil diagram. This diagram is excellent visual tools to present link of steps. Download this PPT slide to explain complex data immediately and clearly.
Navigation Point Four Banners And Icons Powerpoint Template
This PowerPoint template has been designed with four banners icons. This diagram is excellent visual tools for business presentations. Download this PPT slide to explain complex data immediately and clearly.
Four Sequential Boxes And Icons Diagram Powerpoint Template
This PowerPoint template has been designed with four sequential boxes and icons. This diagram is excellent visual tools for business presentations. Download this PPT slide to explain complex data immediately and clearly.
Four Staged Numeric Banners With Icons Powerpoint Template
This PowerPoint template has been designed with four staged numeric banners icons. This diagram is excellent visual tools for business presentations. Download this PPT slide to explain complex data immediately and clearly.
Three Arrow For Team Members Profile Powerpoint Slides
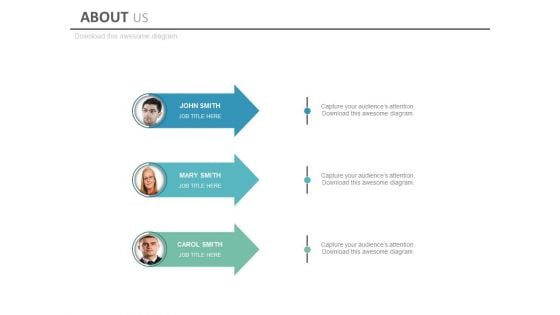
This PowerPoint template has been designed with three arrows and team pictures. This diagram is excellent visual tools for business presentations. Download this PPT slide to explain complex data immediately and clearly.
Business Team About Us Page Powerpoint Slides
This PowerPoint template has been designed with team pictures and business icons. This diagram is excellent visual tools to present teams strategic planning. Download this PPT slide to explain complex data immediately and clearly.
Five Banners For Nature And Finance Process Flow Powerpoint Template
This PowerPoint template has been designed with five banners nature, finance icons. This diagram is excellent visual tools for business presentations. Download this PPT slide to explain complex data immediately and clearly.
Four Arrows For Different Process Representation Powerpoint Template
This PowerPoint template has been designed with graphics of four arrows This diagram is excellent visual tools for business presentations. Download this PPT slide to explain complex data immediately and clearly.
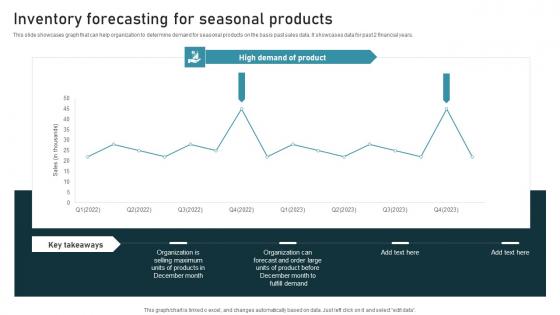
Inventory Forecasting Inventory Administration Techniques For Enhanced Stock Accuracy Designs Pdf
This slide showcases graph that can help organization to determine demand for seasonal products on the basis past sales data. It showcases data for past 2 financial years. This modern and well arranged Inventory Forecasting Inventory Administration Techniques For Enhanced Stock Accuracy Designs Pdf provides lots of creative possibilities. It is very simple to customize and edit with the Powerpoint Software. Just drag and drop your pictures into the shapes. All facets of this template can be edited with Powerpoint, no extra software is necessary. Add your own material, put your images in the places assigned for them, adjust the colors, and then you can show your slides to the world, with an animated slide included. This slide showcases graph that can help organization to determine demand for seasonal products on the basis past sales data. It showcases data for past 2 financial years.
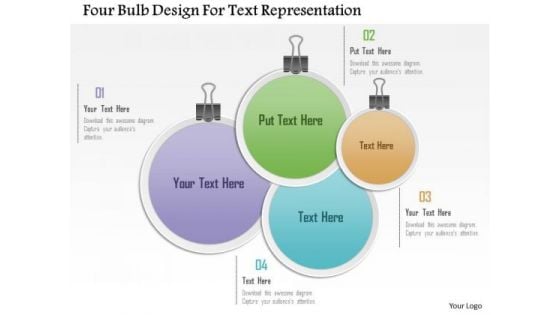
Busines Diagram Four Bulb Design For Text Representation Presentation Template
Four bulb design text diagram has been used to design this business slide. Use this diagram to display data in visual manner. This slide offers an excellent background to build professional presentations.
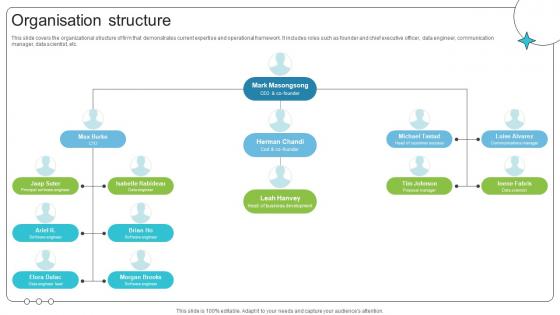
Organisation Structure Investor Oriented Urbanlogiq Fundraising Deck
This slide covers the organizational structure of firm that demonstrates current expertise and operational framework. It includes roles such as founder and chief executive officer, data engineer, communication manager, data scientist, etc. Crafting an eye-catching presentation has never been more straightforward. Let your presentation shine with this tasteful yet straightforward Organisation Structure Investor Oriented Urbanlogiq Fundraising Deck template. It offers a minimalistic and classy look that is great for making a statement. The colors have been employed intelligently to add a bit of playfulness while still remaining professional. Construct the ideal Organisation Structure Investor Oriented Urbanlogiq Fundraising Deck that effortlessly grabs the attention of your audience Begin now and be certain to wow your customers This slide covers the organizational structure of firm that demonstrates current expertise and operational framework. It includes roles such as founder and chief executive officer, data engineer, communication manager, data scientist, etc.
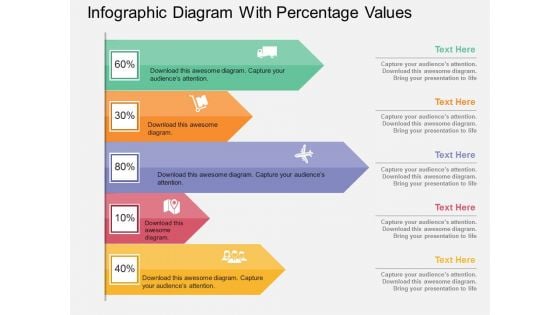
Infographic Diagram With Percentage Values Powerpoint Template
Visually support your presentation with our above template containing infographic diagram with percentage values. This diagram is excellent visual tools for explaining huge amounts of information where complex data needs to be explained immediately and clearly.
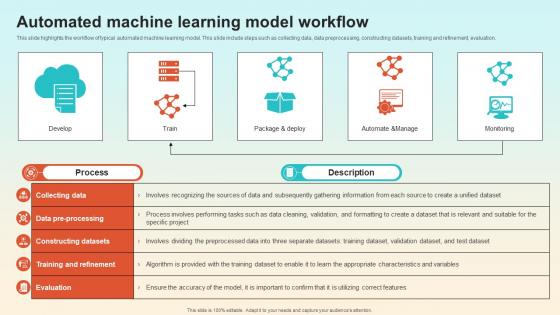
Automated Machine Learning Model Workflow Introduction To MLOPs IT
This slide highlights the workflow of typical automated machine learning model. This slide include steps such as collecting data, data preprocessing, constructing datasets, training and refinement, evaluation. Get a simple yet stunning designed Automated Machine Learning Model Workflow Introduction To MLOPs IT. It is the best one to establish the tone in your meetings. It is an excellent way to make your presentations highly effective. So, download this PPT today from Slidegeeks and see the positive impacts. Our easy-to-edit Automated Machine Learning Model Workflow Introduction To MLOPs IT can be your go-to option for all upcoming conferences and meetings. So, what are you waiting for Grab this template today. This slide highlights the workflow of typical automated machine learning model. This slide include steps such as collecting data, data preprocessing, constructing datasets, training and refinement, evaluation.
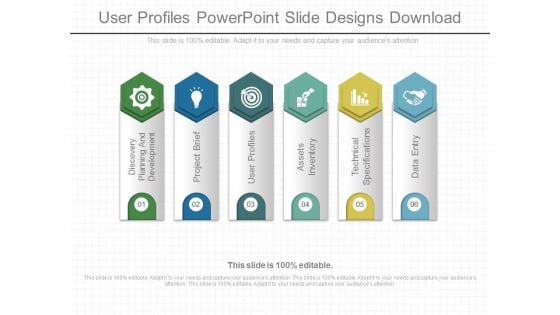
User Profiles Powerpoint Slide Designs Download
This is a user profiles powerpoint slide designs download. This is a six stage process. The stages in this process are discovery planning and development, project brief, user profiles, assets inventory, technical specifications, data entry.
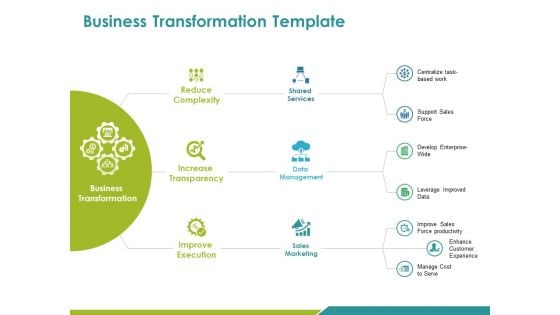
Business Transformation Template Ppt PowerPoint Presentation Layouts Styles
This is a business transformation template ppt powerpoint presentation layouts styles. This is a three stage process. The stages in this process are reduce complexity, shared services, data management, sales marketing, improve execution.
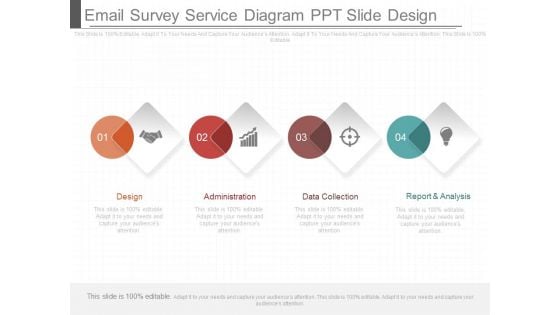
Email Survey Service Diagram Ppt Slide Design
This is a email survey service diagram ppt slide design. This is a four stage process. The stages in this process are design, administration, data collection, report and analysis.


 Continue with Email

 Home
Home


