Data Catalog
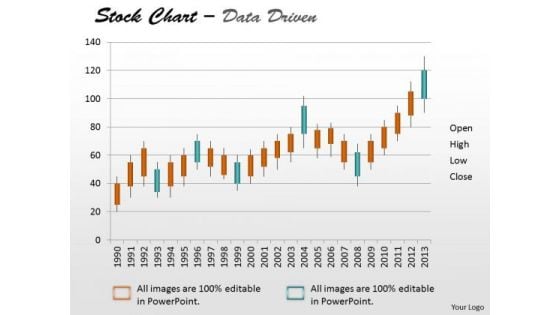
Data Analysis Template Driven Stock Chart For Market Trends PowerPoint Slides Templates
Drive Your Team Along The Road To Success. Take The Wheel With Our data analysis template driven stock chart for market trends powerpoint slides Templates .
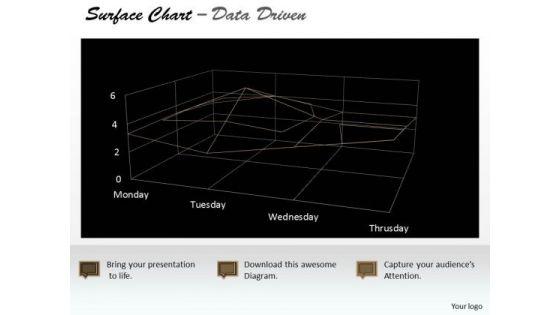
Data Analysis Template Driven Surface Chart Indicating Areas PowerPoint Slides Templates
Highlight Your Drive With Our data analysis template driven surface chart indicating areas powerpoint slides Templates . Prove The Fact That You Have Control.
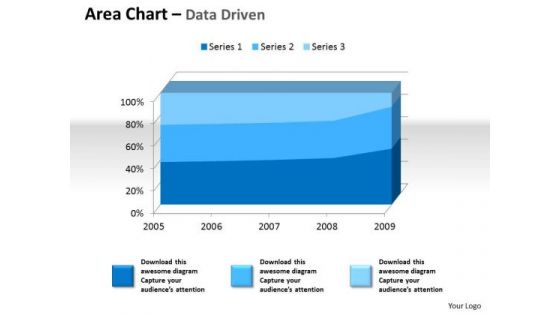
Examples Of Data Analysis Market 3d Area Chart For Quantiative PowerPoint Templates
Drum It Up With Our examples of data analysis market 3d area chart for quantiative Powerpoint Templates . Your Thoughts Will Raise The Tempo.
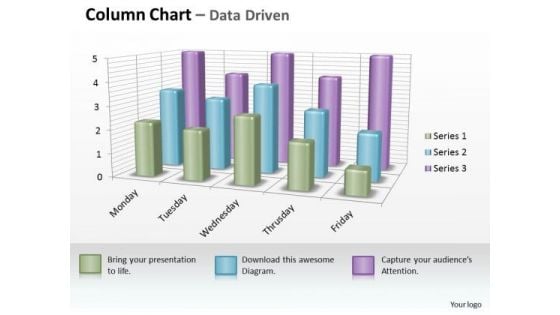
Examples Of Data Analysis Market 3d Business Inspection Procedure Chart PowerPoint Templates
However Dry Your Topic Maybe. Make It Catchy With Our examples of data analysis market 3d business inspection procedure chart Powerpoint Templates .
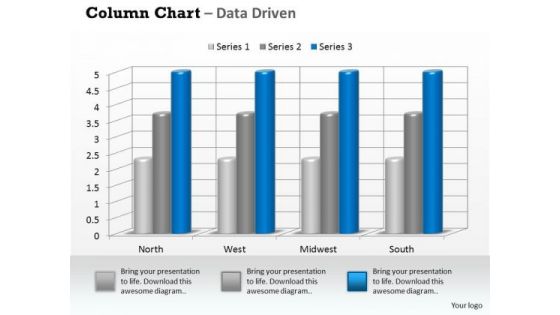
Examples Of Data Analysis Market 3d Business On Regular Intervals PowerPoint Templates
Drum It Out Loud And Clear On Our examples of data analysis market 3d business on regular intervals Powerpoint Templates . Your Words Will Ring In Their Ears.
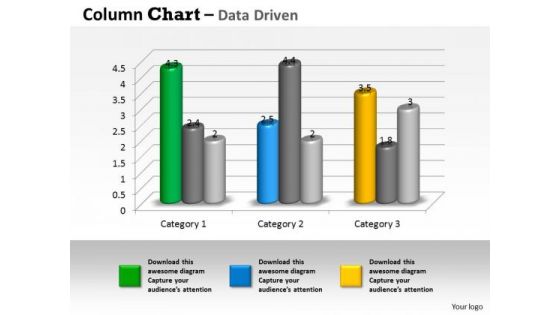
Examples Of Data Analysis Market 3d Business Trend Series Chart PowerPoint Templates
Duct It Through With Our examples of data analysis market 3d business trend series chart Powerpoint Templates . Your Ideas Will Reach Into Their Minds Intact.
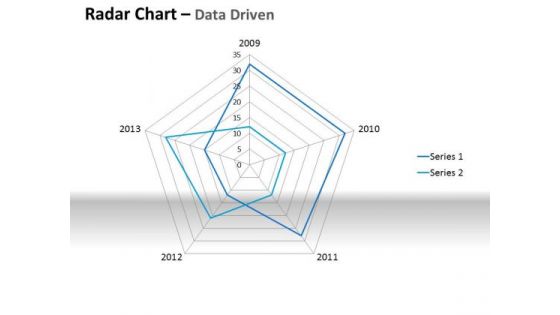
Examples Of Data Analysis Market Driven Plotting The Business Values PowerPoint Slides Templates
Ring The Duck With Our examples of data analysis market driven plotting the business values powerpoint slides Templates . Acquire The Points With Your Ideas.
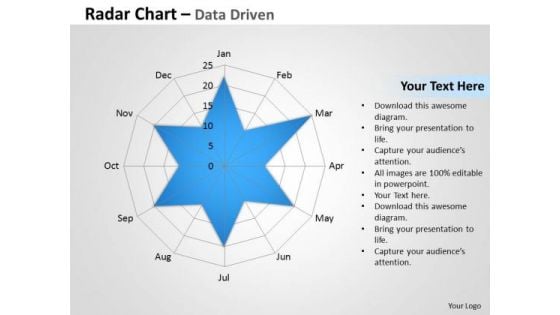
Examples Of Data Analysis Market Driven Radar Chart To Compare PowerPoint Slides Templates
Rely On Our examples of data analysis market driven radar chart to compare powerpoint slides Templates In Any Duel. They Will Drive Home Your Point.
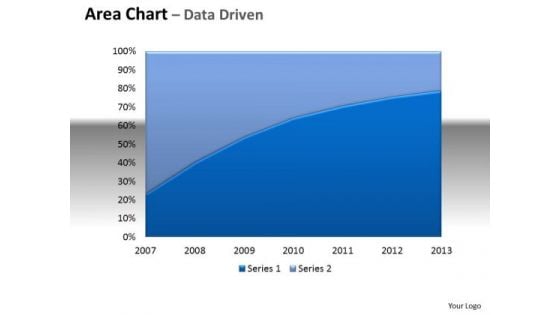
Financial Data Analysis Area Chart With Plotted Line Center PowerPoint Templates
Be The Doer With Our financial data analysis area chart with plotted line center Powerpoint Templates . Put Your Thoughts Into Practice.
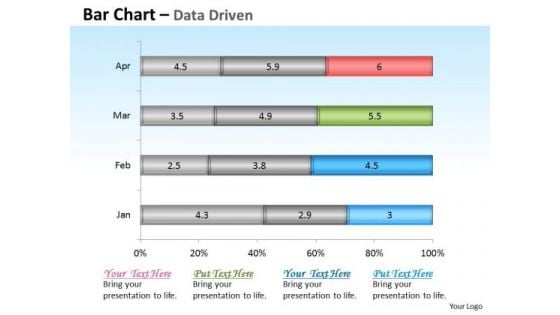
Financial Data Analysis Driven Base Bar Chart Design PowerPoint Slides Templates
Get The Domestics Right With Our financial data analysis driven base bar chart design powerpoint slides Templates . Create The Base For Thoughts To Grow.
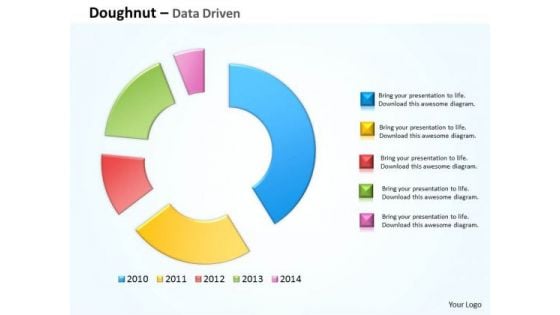
Financial Data Analysis Driven Compare Market Share Of Brand PowerPoint Templates
Doll Up Your Thoughts With Our financial data analysis driven compare market share of brand Powerpoint Templates . They Will Make A Pretty Picture.
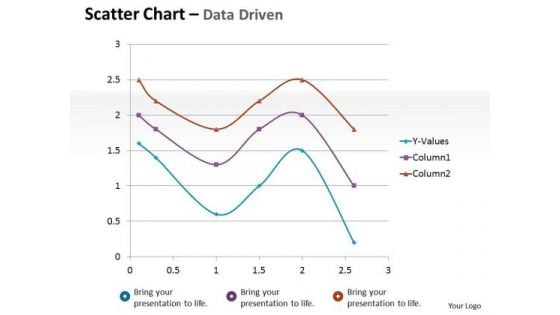
Financial Data Analysis Driven Scatter Chart Mathematical Diagram PowerPoint Slides Templates
Dominate Proceedings With Your Ideas. Our financial data analysis driven scatter chart mathematical diagram powerpoint slides Templates Will Empower Your Thoughts.
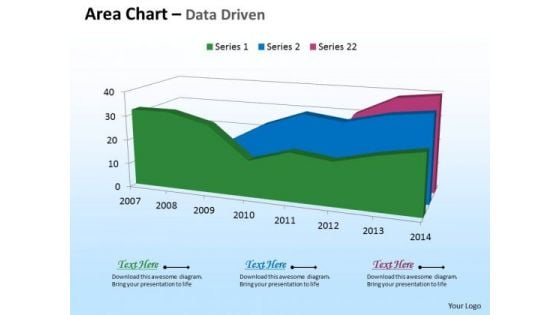
Microsoft Excel Data Analysis 3d Area Chart For Time Based PowerPoint Templates
Deliver The Right Dose With Our microsoft excel data analysis 3d area chart for time based Powerpoint Templates . Your Ideas Will Get The Correct Illumination.
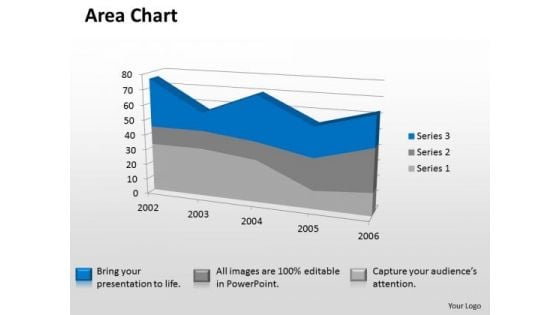
Microsoft Excel Data Analysis 3d Area Chart Showimg Change In Values PowerPoint Templates
Our microsoft excel data analysis 3d area chart showimg change in values Powerpoint Templates Deliver At Your Doorstep. Let Them In For A Wonderful Experience.
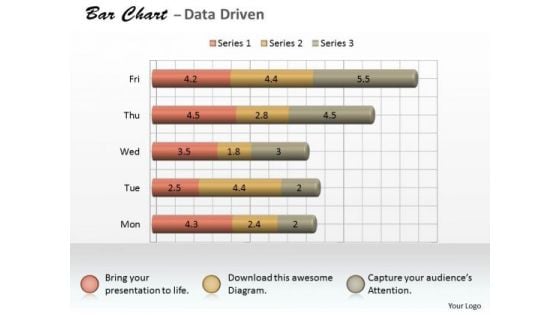
Microsoft Excel Data Analysis 3d Bar Chart As Research Tool PowerPoint Templates
Knock On The Door To Success With Our microsoft excel data analysis 3d bar chart as research tool Powerpoint Templates . Be Assured Of Gaining Entry.
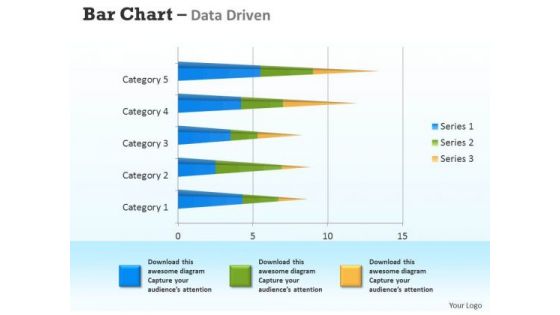
Microsoft Excel Data Analysis 3d Bar Chart For Analyzing Survey PowerPoint Templates
Connect The Dots With Our microsoft excel data analysis 3d bar chart for analyzing survey Powerpoint Templates . Watch The Whole Picture Clearly Emerge.
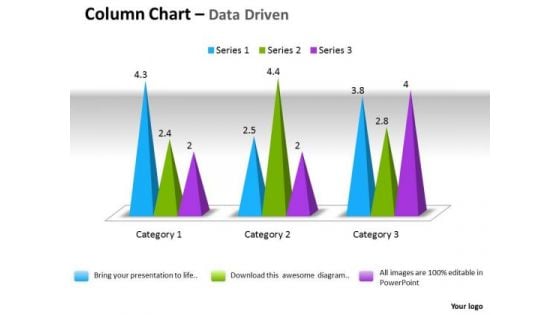
Microsoft Excel Data Analysis 3d Change In Business Process Chart PowerPoint Templates
Double Your Chances With Our microsoft excel data analysis 3d change in business process chart Powerpoint Templates . The Value Of Your Thoughts Will Increase Two-Fold.
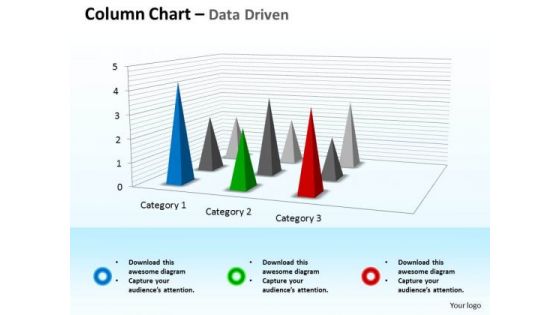
Microsoft Excel Data Analysis 3d Chart For Business Observation PowerPoint Templates
Double Up Our microsoft excel data analysis 3d chart for business observation Powerpoint Templates With Your Thoughts. They Will Make An Awesome Pair.
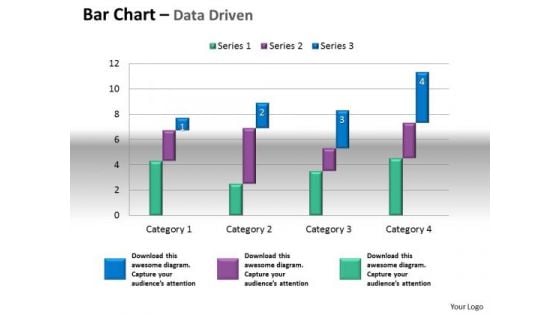
Microsoft Excel Data Analysis Bar Chart To Compare Quantities PowerPoint Templates
Our microsoft excel data analysis bar chart to compare quantities Powerpoint Templates Leave No One In Doubt. Provide A Certainty To Your Views.
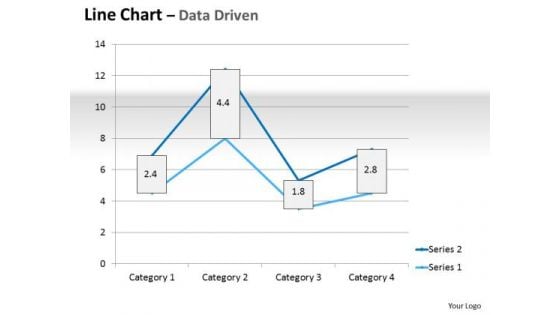
Multivariate Data Analysis Driven Line Chart Market Graph PowerPoint Slides Templates
Plan For All Contingencies With Our multivariate data analysis driven line chart market graph powerpoint slides Templates . Douse The Fire Before It Catches.
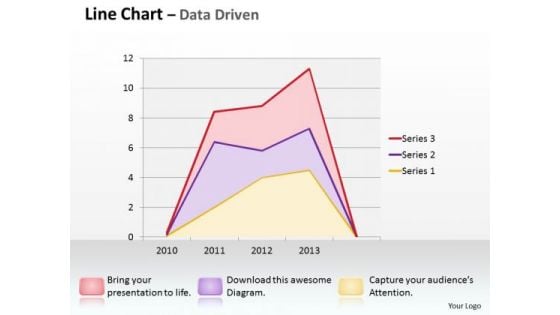
Multivariate Data Analysis Driven Line Chart Shows Revenue Trends PowerPoint Slides Templates
Good Camaraderie Is A Key To Teamwork. Our multivariate data analysis driven line chart shows revenue trends powerpoint slides Templates Can Be A Cementing Force.
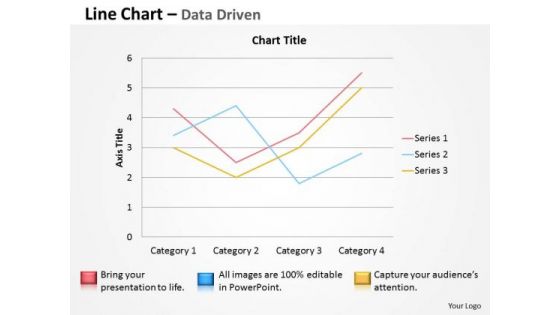
Multivariate Data Analysis Driven Line Chart To Demonstrate PowerPoint Slides Templates
Brace Yourself, Arm Your Thoughts. Prepare For The Hustle With Our multivariate data analysis driven line chart to demonstrate powerpoint slides Templates .
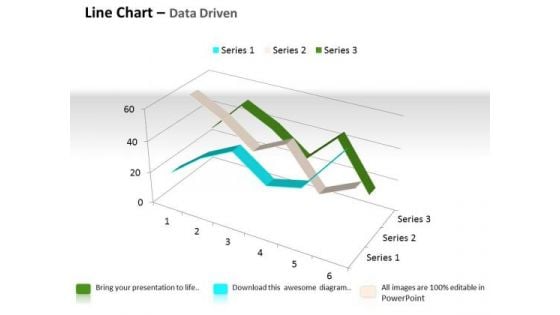
Quantitative Data Analysis 3d Line Chart For Comparison Of PowerPoint Templates
Touch Base With Our quantitative data analysis 3d line chart for comparison of Powerpoint Templates . Review Your Growth With Your Audience.

Quantitative Data Analysis 3d Pie Chart For Business Process PowerPoint Templates
Put Them On The Same Page With Our quantitative data analysis 3d pie chart for business process Powerpoint Templates . Your Team Will Sing From The Same Sheet.
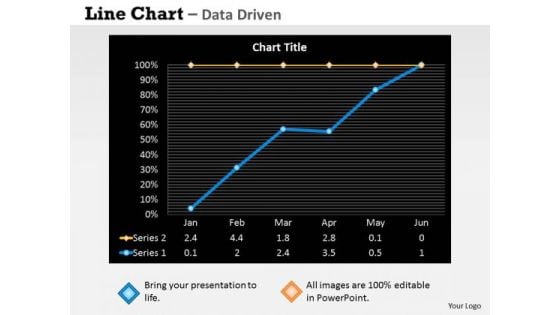
Quantitative Data Analysis Driven Economic Status Line Chart PowerPoint Slides Templates
Be The Dramatist With Our quantitative data analysis driven economic status line chart powerpoint slides Templates . Script Out The Play Of Words.
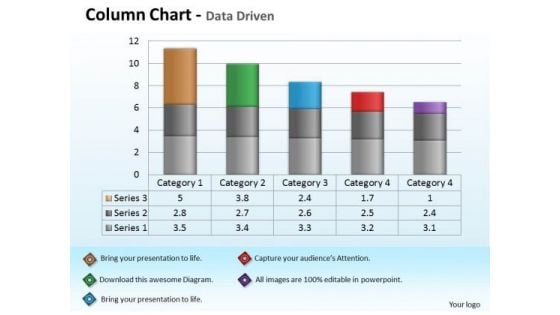
Quantitative Data Analysis Driven Economic With Column Chart PowerPoint Slides Templates
Add Some Dramatization To Your Thoughts. Our quantitative data analysis driven economic with column chart powerpoint slides Templates Make Useful Props.
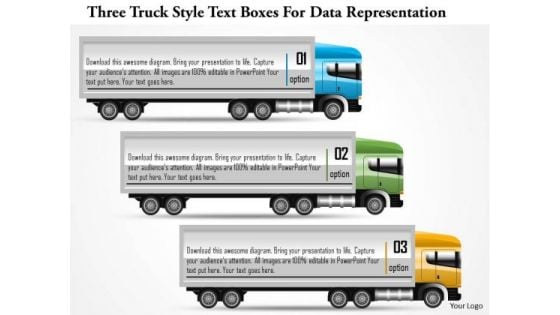
Business Diagram Three Truck Style Text Boxes For Data Representation PowerPoint Template
This power point template diagram has been designed with graphic of three truck style text boxes. These boxes are used to display the text and data. Use this PPT for your business presentation and get good comments from your viewers.
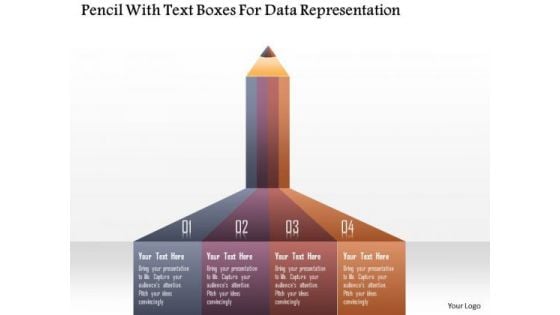
Business Diagram Pencil With Text Boxes For Data Representation PowerPoint Template
This power point template diagram has been designed with graphic of pencil style text boxes. These boxes are used to display the text and data. Use this PPT for your business presentation.
Business Diagram 3d Capsule With Multiple Icons For Business Data Flow PowerPoint Slide
This diagram has been designed with 3d graphic of capsule with multiple icons. This data driven PowerPoint slide can be used to give your presentations more effective look. It helps in clearly conveying your message to clients and audience.
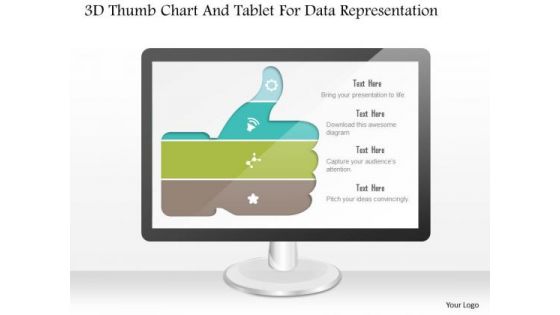
Business Diagram 3d Thumb Chart And Tablet For Data Representation PowerPoint Slide
This business diagram displays graphic of 3d thumb up chart with icons on computer screen. This business slide contains the concept of business data representation. Use this diagram to build professional presentations for your viewers.
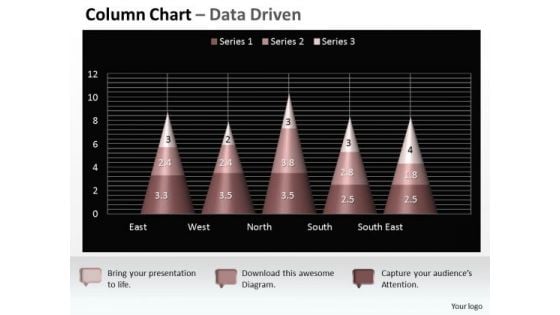
Data Analysis On Excel 3d Chart Shows Interrelated Sets Of PowerPoint Templates
Put Them On The Same Page With Our data analysis on excel 3d chart shows interrelated sets of Powerpoint Templates . Your Team Will Sing From The Same Sheet.
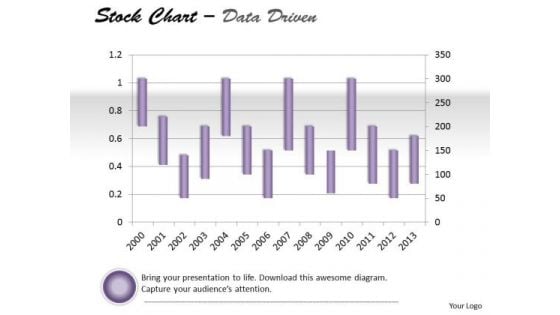
Data Analysis On Excel Driven Stock Chart For Market History PowerPoint Slides Templates
Draw Out The Best In You With Our data analysis on excel driven stock chart for market history powerpoint slides Templates . Let Your Inner Brilliance Come To The Surface.
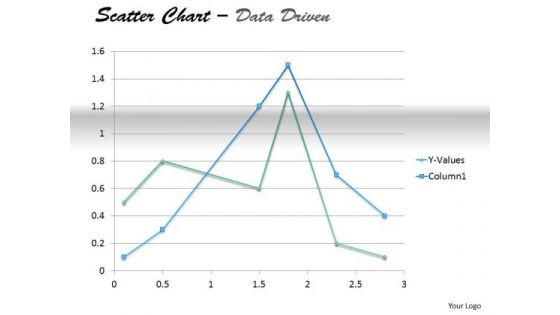
Examples Of Data Analysis Market Driven Present In Scatter Chart PowerPoint Slides Templates
Your Thoughts Will Take To Our examples of data analysis market driven present in scatter chart powerpoint slides Templates Like A Duck To Water. They Develop A Binding Affinity.
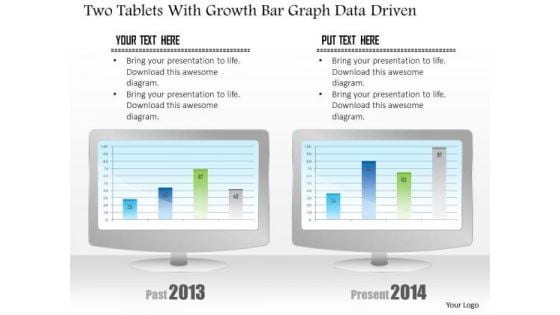
Business Diagram Two Tablets With Growth Bar Graph Data Driven PowerPoint Slide
This business diagram has been designed with comparative charts on tablets. This slide suitable for data representation. You can also use this slide to present business reports and information. Use this diagram to present your views in a wonderful manner.
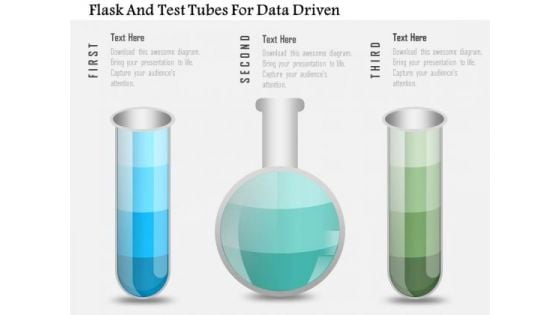
Business Diagram Flask And Test Tubes For Data Driven PowerPoint Slide
This data driven diagram has been designed with flask and test tubes. Download this diagram to give your presentations more effective look. It helps in clearly conveying your message to clients and audience.
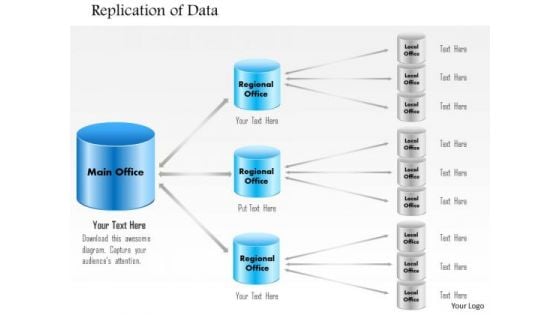
1 Replication Of Data From Main Office To Regional Office To Branch Offices Ppt Slide
This image slide explains the concept database replication in an organization. This image slide has been designed with graphic of database system transfers in main, regional and local office branches. You may change color, size and orientation of any icon to your liking. Use this image slide, in your presentations to express views on backup, storage, networking, communication and technology. Create wonderful presentations using this image slide.
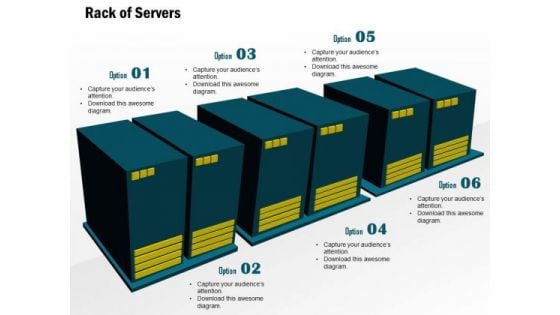
1 Editable Rack Of Servers In A Cluster For Data Warehousing In A Datacenter Ppt Slide
This image slide displays rack of servers. This image slide has been designed with graphic of computer server pairs on rack. Use this image slide, in your presentations to express views on networking, communication, storage and technology. This image slide will impart professional appearance to your presentations.
Business Diagram Infographics With Multiple Icons For Data Representation Presentation Template
This business diagram has been designed with graphic of multiple icons info graphics. Download this diagram to analyze the key points. This diagram offers a way for your audience to visually conceptualize the process.
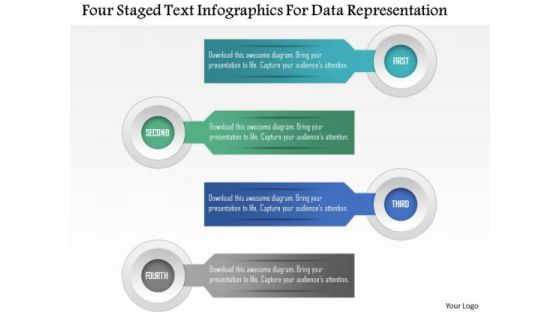
Business Diagram Four Staged Text Infographics For Data Representation Presentation Template
Four staged info graphics has been used to design this PowerPoint template. This slide can be used for text representation. Present your views using this innovative slide and be assured of leaving a lasting impression.
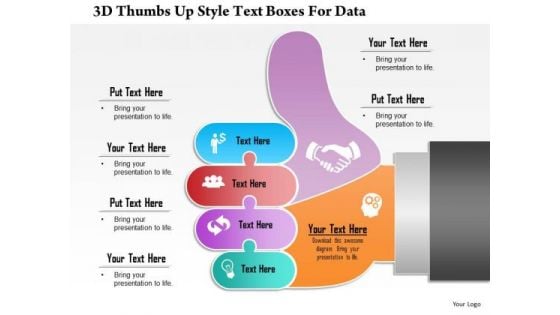
Business Diagram 3d Thumbs Up Style Text Boxes For Data Presentation Template
This Power Point diagram has been crafted with graphic of text boxes with icons. It contains diagram of thumb up hand graphics with communication icons. Use this diagram to build professional presentation for your viewers.
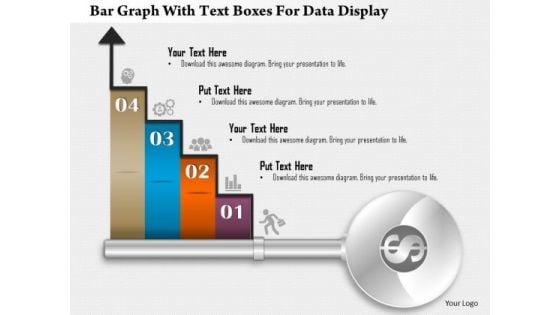
Business Diagram Bar Graph With Text Boxes For Data Display Presentation Template
Our above business diagram displays bar graph. It contains four steps on bar graph with icons. Use this diagram to display four stages of business growth. Download this Power Point slide to build quality presentation for your viewers.
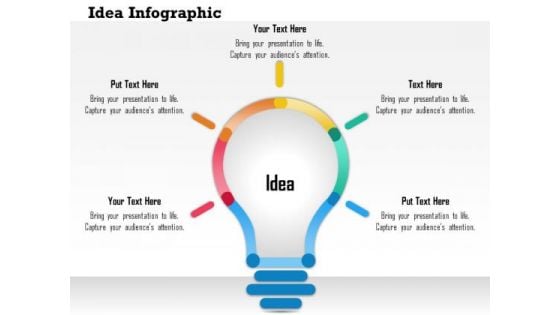
Business Diagram 3d Bulb With Text Boxes For Data Representation Presentation Template
This business diagram has been designed with 3d bulb with text boxes. This bulb graphic is displaying the concept of idea generation. Use this diagram to portray concepts like strategy, idea , success etc.
Business Diagram Three Clouds With Icons For Data Representation Presentation Template
Our above diagram is designed with graphic of clouds displaying three options. These clouds are designed with icons for text representation. Use this editable diagram for your cloud technology related presentations.
Business Diagram Technology Icons With Globe For Data Transfer Presentation Template
This business slide contains various technology icons moving towards globe. Display concept of technology and global communication in visual manner with this diagram. Download this diagram slide to make professional presentations.

Business Diagram Red Quotes With Text Box For Business Data Presentation Template
Download our above diagram to express information in a visual way. It contains text box to present a quote. Download this diagram to make professional presentations.
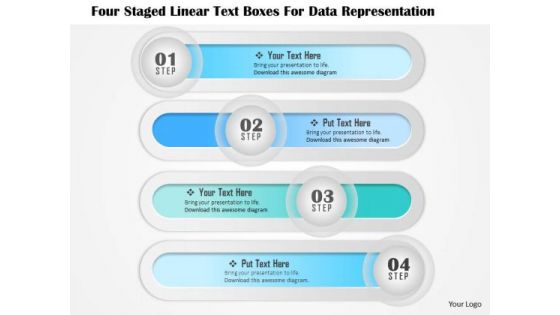
Business Diagram Four Staged Linear Text Boxes For Data Representation Presentation Template
This business diagram displays four staged linear text boxes. This diagram is suitable to depict flow of business activities or steps. Download this professional slide to present information in an attractive manner

Business Diagram Four Progressive Text Boxes For Business Data Presentation Template
This diagram has been designed with four progressive steps with text boxes. You can insert this diagram into your presentations to clarify information. Highlight your ideas broad based on strong fundamentals and illustrate how they step by step achieve the set growth factor.
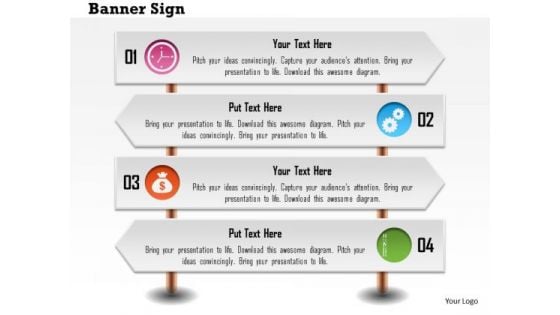
Business Diagram Four Banner Style Text Boxes For Data Representation Presentation Template
This business slide displays four banner style text boxes It contains graphic of text boxes with four steps. Use this diagram, in your presentations to express views on process, steps, stages, progress, targets, goals, success and achievements. Give professional appearance to your presentations using this business slide.
Business Diagram Four Text Boxes For Business Data Representation Presentation Template
This diagram can be used to display 4 staged business plan. Your thoughts need to be organized. This PowerPoint template contains graphics of four text boxes. Use this innovative diagram slide to build exclusive presentation.
Business Diagram Four Staged Design Diary For Data Flow Presentation Template
Four staged info graphics has been used to design this PowerPoint template. This slide can be used for text representation. Present your views using this innovative slide and be assured of leaving a lasting impression.
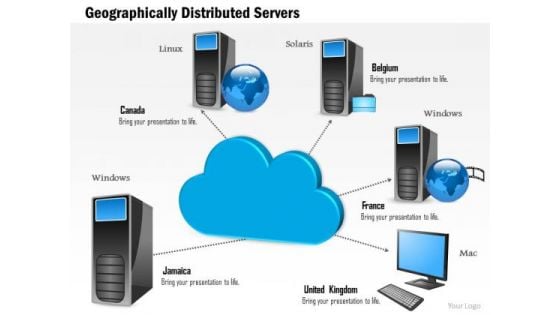
1 Geographically Distributed Servers Across Data Centers Connected To A Centralized Cloud Ppt Slides
This image slide displays geographically distributed server. This image slide has been designed with graphic of could, servers and globe. This image depicts cloud computing. You may change size, color and orientation of any icon to your liking. Use this PowerPoint template, in your presentations to explain concept of cloud computing both at local and global scale. This image slide will help you make professional presentations.
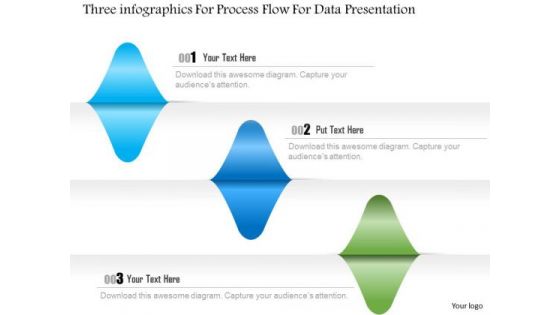
Busines Diagram Three Infographics For Process Flow For Data Presentation Template
Three info graphics has been used to design this business diagram. This slide helps to depict business process flow. This slide offers an excellent background to build professional presentations.
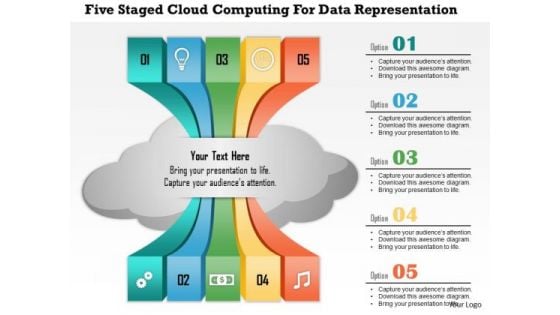
Business Diagram Five Staged Cloud Computing For Data Representation Presentation Template
Our above slide displays five steps with cloud icon. Download our above diagram to express information in a visual way. This diagram offers a way for your audience to visually conceptualize the process.
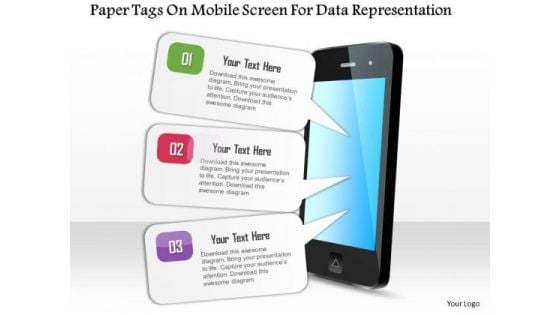
Business Diagram Paper Tags On Mobile Screen For Data Representation Presentation Template
This business diagram has been designed with graphic of text boxes with mobile phone. This diagram helps to depict concepts of technology and communication. Make your presentation more interactive with this business slide.
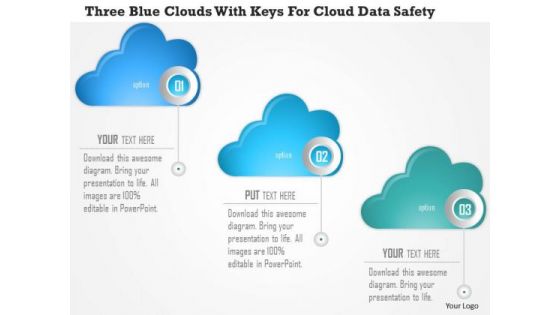
Business Diagram Three Blue Clouds With Keys For Cloud Data Safety Presentation Template
Our above business diagram contains design of three blue clouds with keys. This diagram provides an effective way of displaying information you can edit text, color, shade and style as per you need. Present your views using this innovative slide and be assured of leaving a lasting impression
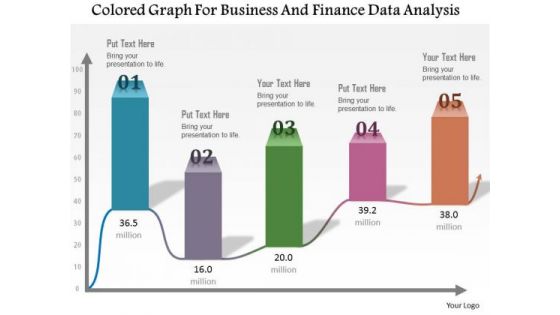
Business Diagram Colored Graph For Business And Finance Data Analysis Presentation Template
This Power Point template has been designed with graphic of colored bar graph. Use this slide to represent five steps of any business process. Use this diagram for your business presentations and get exclusive comments on your efforts.
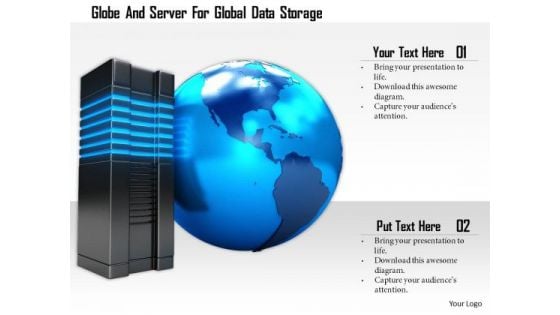
Stock Photo Globe And Server For Global Data Storage PowerPoint Slide
Graphic of globe and server has been used to design this PowerPoint template. This image slide contains the concept of technology and internet. Use this professional slide for technology related topics.
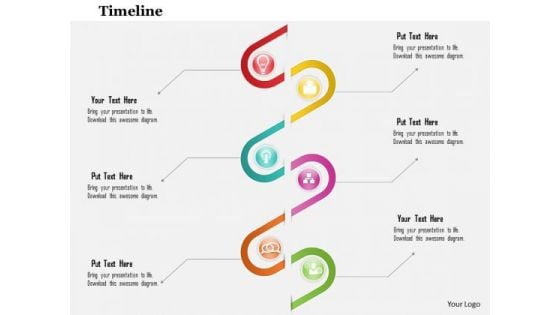
Business Diagram Six Staged Spiral Diagram For Data Flow Presentation Template
This business slide depicts six staged spiral diagram. This diagram provides an effective way of displaying information you can edit text, color, shade and style as per you need. Present your views using this innovative slide and be assured of leaving a lasting impression.
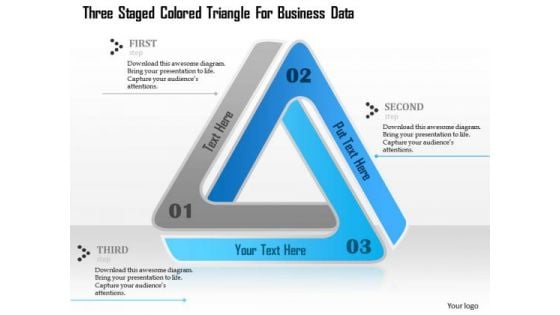
Business Diagram Three Staged Colored Triangle For Business Data Presentation Template
Three staged blue colored triangle has been used to design this business diagram. This slide contains triangle diagram to depict process flow. Use this PPT slide for your business and marketing presentations
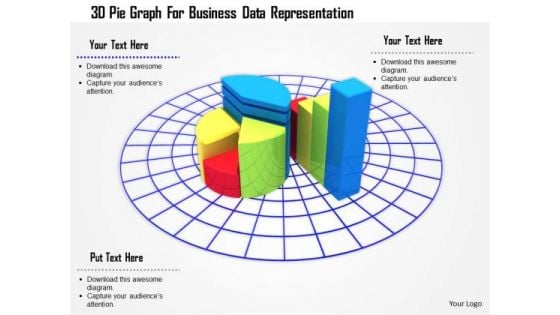
Stock Photo 3d Pie Graph For Business Data Representation PowerPoint Slide
3D business graph has been used to design this PowerPoint template. This Image slide is suitable to make business reports and charts. This slide can be used for business and marketing presentations.


 Continue with Email

 Home
Home


