Data Challenges
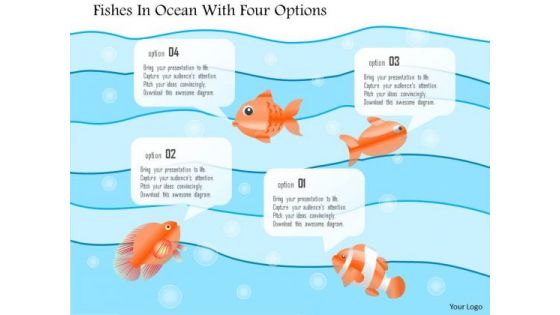
Business Diagram Fishes In Ocean With Four Options Presentation Template
This power point diagram template has been designed with graphic of ocean and fish. This PPT diagram contains the concept of idea generation and data representation. Use this PPT diagram for business and marketing related presentations.

Major Social Media Protection And Privacy Issues Template PDF
The following slide highlights some social media security threats to safeguard unauthorized access. It includes elements such as data mining, hacking, harassment, cyberbullying, privacy loophole etc. Presenting Major Social Media Protection And Privacy Issues Template PDF to dispense important information. This template comprises four stages. It also presents valuable insights into the topics including Data Mining, Harassment And Cyberbullying, Privacy Loophole. This is a completely customizable PowerPoint theme that can be put to use immediately. So, download it and address the topic impactfully.

Business Growth Handshake PowerPoint Templates And PowerPoint Backgrounds 0711
Microsoft PowerPoint Template and Background with human figures shaking hands Put up the facts and figures on our Business Growth Handshake PowerPoint Templates And PowerPoint Backgrounds 0711. Display the data for everyone's consumption.
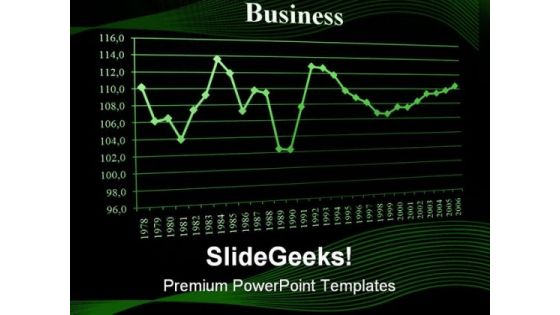
Graph03 Business PowerPoint Templates And PowerPoint Backgrounds 0411
Microsoft PowerPoint Template and Background with business chart and data from stock market showing success Manage expectations with our Graph03 Business PowerPoint Templates And PowerPoint Backgrounds 0411. You will be at the top of your game.
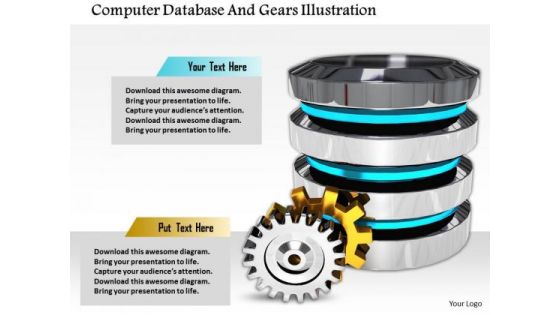
Stock Photo Computer Database And Gears Illustration PowerPoint Slide
This image slide has graphics of database icon with gears. This image contains data base icon to present topics like communication, strategy, technology etc. You can use this layout to display your content in an interesting, eye-catching manner.

Question People Eduation PowerPoint Backgrounds And Templates 1210
Microsoft PowerPoint Template and Background with 3d puppet carrying the book Put up the facts and figures on our Question People Eduation PowerPoint Backgrounds And Templates 1210. Display the data for everyone's consumption.
Teamwork And Friendship Communication PowerPoint Templates And PowerPoint Backgrounds 0611
Microsoft PowerPoint Template and Background with paper team showing concept for friendship teamwork love and help Figure out the market with our Teamwork And Friendship Communication PowerPoint Templates And PowerPoint Backgrounds 0611. Analyse the data accurately for the audience.

Man With Global Business PowerPoint Templates And PowerPoint Backgrounds 0711
Microsoft PowerPoint Template and Background with man with global business Put up the facts and figures on our Man With Global Business PowerPoint Templates And PowerPoint Backgrounds 0711. Display the data for everyone's consumption.
Books And Flasks Science PowerPoint Presentation Slides R
Microsoft Powerpoint Slides and Backgrounds with pile of books flasks microscope and magnifier on a white background Put up the facts and figures on our Books And Flasks Science PowerPoint Presentation Slides R. Display the data for everyone's consumption.
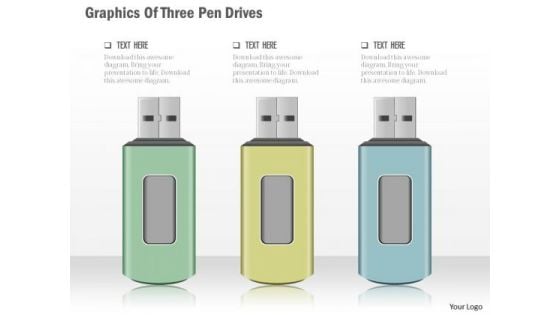
Business Diagram Graphics Of Three Pen Drives Presentation Template
Graphic of three pen drives has been sued to craft this power point template diagram. This PPT contain the concept of data storage and safety. Use this PPT for business and technology related presentations.
Concept Of Idea Business PowerPoint Templates And PowerPoint Backgrounds 0211
Microsoft PowerPoint Template and Background with concept of idea with light bulb Gather the data and present with our Concept Of Idea Business PowerPoint Templates And PowerPoint Backgrounds 0211. Try us out and see what a difference our templates make.
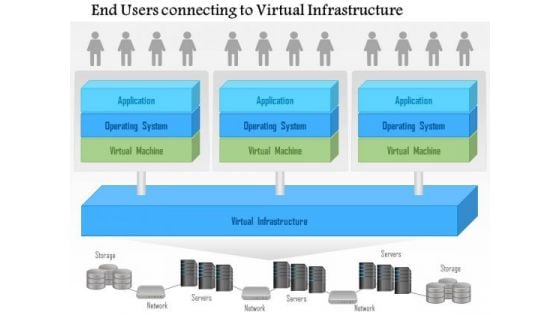
Business Diagram End Users Connecting To A Virtual Infrastructure Ppt Slide
This PowerPoint template has been designed with graphic of computer network. This slide depicts concept of end user connectivity and virtual infrastructure. This diagram is suitable to represent data and cloud structure related topics.
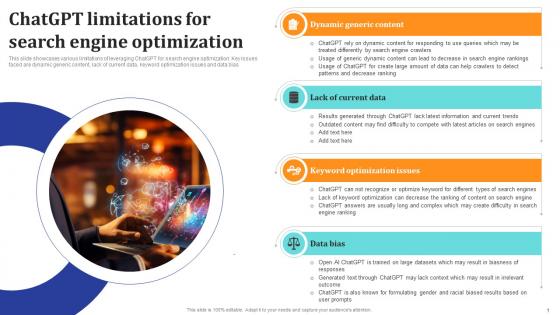
ChatGpt Comprehensive Guide ChatGpt Limitations For Search Engine Ppt Template ChatGpt SS V
This slide showcases various limitations of leveraging ChatGPT for search engine optimization. Key issues faced are dynamic generic content, lack of current data, keyword optimization issues and data bias. Slidegeeks is here to make your presentations a breeze with ChatGpt Comprehensive Guide ChatGpt Limitations For Search Engine Ppt Template ChatGpt SS V With our easy-to-use and customizable templates, you can focus on delivering your ideas rather than worrying about formatting. With a variety of designs to choose from, you are sure to find one that suits your needs. And with animations and unique photos, illustrations, and fonts, you can make your presentation pop. So whether you are giving a sales pitch or presenting to the board, make sure to check out Slidegeeks first This slide showcases various limitations of leveraging ChatGPT for search engine optimization. Key issues faced are dynamic generic content, lack of current data, keyword optimization issues and data bias.

Investment Crowdfunding Ppt PowerPoint Presentation Complete Deck With Slides
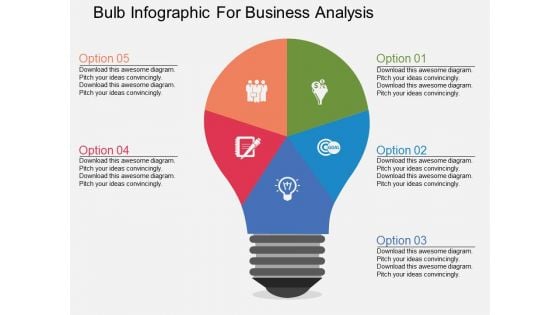
Bulb Infographic For Business Analysis Powerpoint Templates
This PowerPoint slide contains graphics of bulb diagram with icons. It helps to exhibit concepts of marketing strategy. Use this diagram to impart more clarity to data and to create more sound impact on viewers.
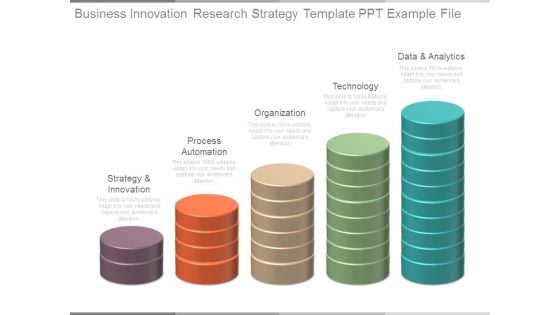
Business Innovation Research Strategy Template Ppt Example File
This is a business innovation research strategy template ppt example file. This is a five stage process. The stages in this process are strategy and innovation, process automation, organization, technology, data and analytics.
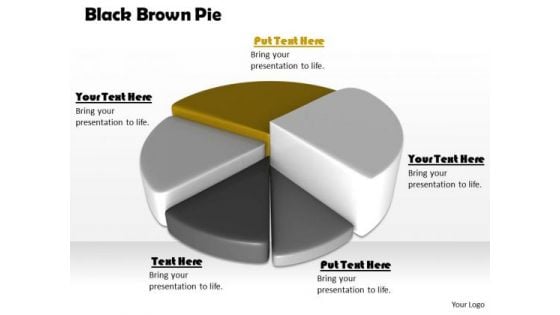
Stock Photo Black Brown Pie Chart For Business Result PowerPoint Slide
This high quality image is designed with pie chart. Use this image to make business reports. Use this outstanding image in presentations relating to data analysis and reports. Go ahead and add charm to your presentations.
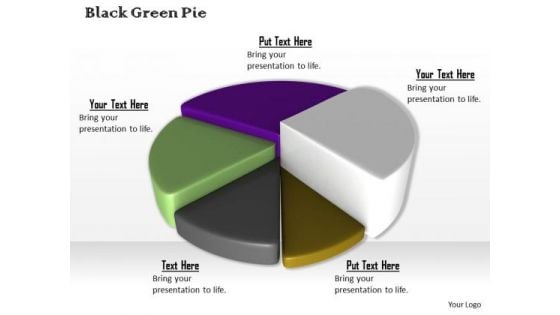
Stock Photo Colorful 3d Pie Chart For Business Result PowerPoint Slide
This high quality image is designed with pie chart. Use this image to make business reports. Use this outstanding image in presentations relating to data analysis and reports. Go ahead and add charm to your presentations.
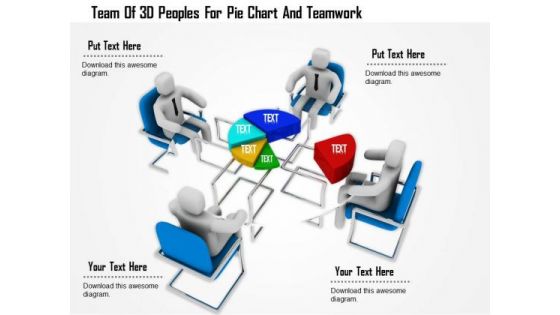
Team Of 3d Peoples For Pie Chart And Teamwork
This Power Point template has been designed with graphic of 3d team forming a pie chart. In this slide team is displaying data analysis. Use this editable slide to build innovative presentation for your viewers.
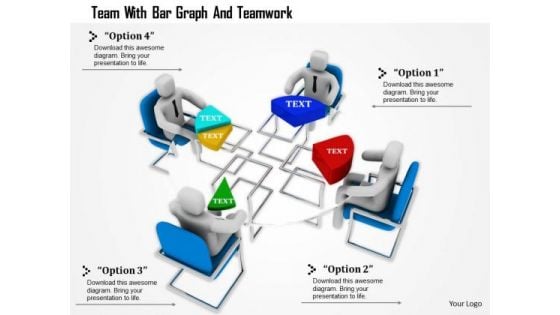
Team With Bar Graph And Teamwork
This Power Point template has been designed with graphic of 3d team forming a pie chart. In this slide team is displaying data analysis and comparison. Use this editable slide to build innovative presentation for your viewers.
Business Diagram Icons And Charts For Business Growth Presentation Template
Our above slide contains graphics of business charts and icons. It helps to display business reports and analysis. Use this diagram to impart more clarity to data and to create more sound impact on viewers.
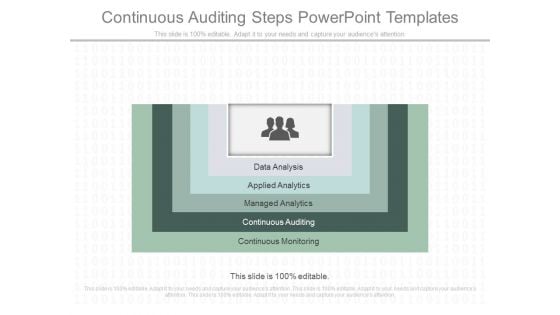
Continuous Auditing Steps Powerpoint Templates
This is a continuous auditing steps powerpoint templates. This is a five stage process. The stages in this process are data analysis, applied analytics, managed analytics, continuous auditing, continuous monitoring.
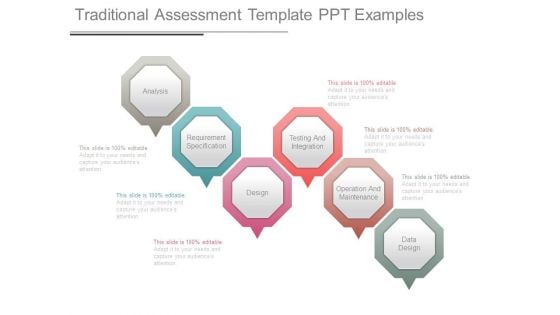
Traditional Assessment Template Ppt Examples
This is a traditional assessment template ppt examples. This is a six stage process. The stages in this process are analysis, requirement specification, design, testing and integration, operation and maintenance, data design.
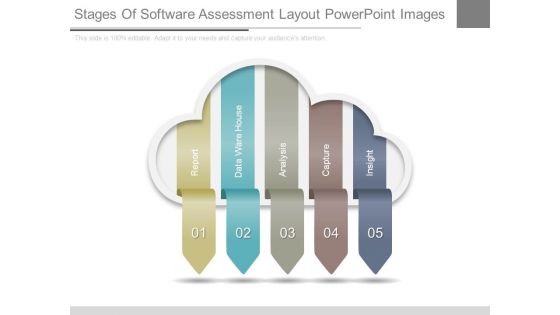
Stages Of Software Assessment Layout Powerpoint Images
This is a stages of software assessment layout powerpoint images. This is a five stage process. The stages in this process are report, data ware house, analysis, capture, insight.
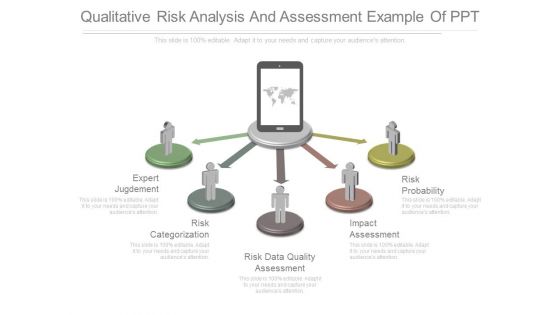
Qualitative Risk Analysis And Assessment Example Of Ppt
This is a qualitative risk analysis and assessment example of ppt. This is a five stage process. The stages in this process are expert jugdement, risk categorization, risk data quality assessment, impact assessment, risk probability.
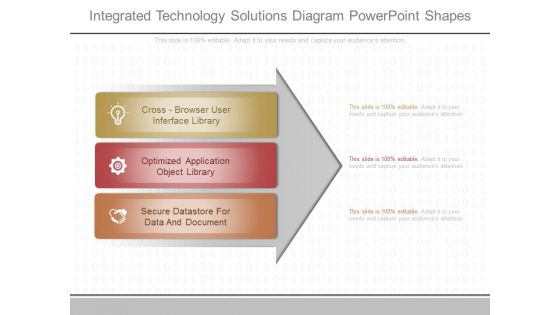
Integrated Technology Solutions Diagram Powerpoint Shapes
This is a integrated technology solutions diagram powerpoint shapes. This is a three stage process. The stages in this process are cross browser user interface library, optimized application object library, secure datastore for data and document.
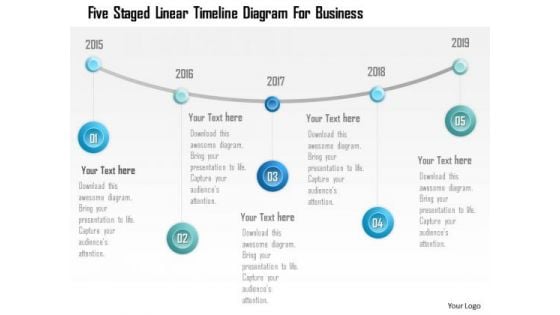
Business Diagram Five Staged Linear Timeline Diagram For Business PowerPoint Template
Five staged linear timeline diagram has been used to design this power point template. This diagram template contains the concept of business data and success strategy representation. Use this PPT for your business and sales related presentations.

Man Climbing On Books With Ladder PowerPoint Templates
Our above slide contains graphics of man climbing on books with help of ladder. It helps to display concept of education and success. Use this diagram to impart more clarity to data and to create more sound impact on viewers.
Business Diagram Navigation Icon Around Circle Presentation Template
Five staged business info graphics been used to design this power point template. This diagram contains the concept of data representation. Use this diagram for business and finance related presentations
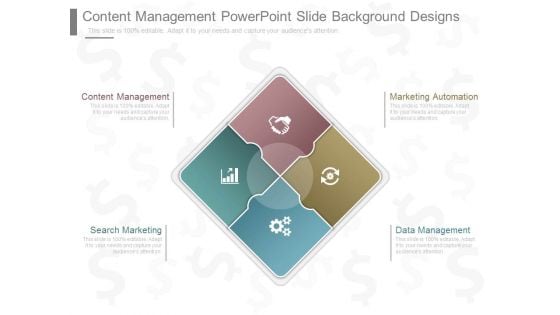
Content Management Powerpoint Slide Background Designs
This is a content management powerpoint slide background designs. This is a four stage process. The stages in this process are marketing automation, data management, content management, search marketing.
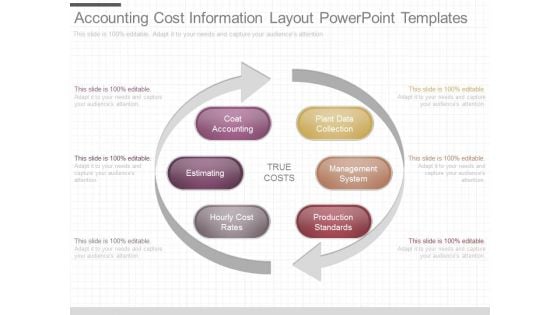
Accounting Cost Information Layout Powerpoint Templates
This is a accounting cost information layout powerpoint templates. This is a six stage process. The stages in this process are true costs, coat accounting, estimating, hourly cost rates, plant data collection, management system, production standards.

Project With Cogs Business PowerPoint Templates And PowerPoint Backgrounds 0511
Microsoft PowerPoint Template and Background with project word with cogs Gather the data and present with our Project With Cogs Business PowerPoint Templates And PowerPoint Backgrounds 0511. Try us out and see what a difference our templates make.
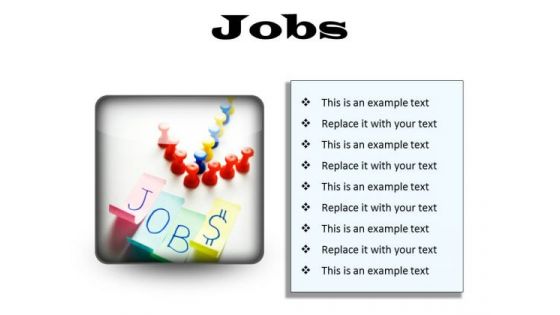
Jobs Business PowerPoint Presentation Slides S
Microsoft PowerPoint Slides and Backgrounds with conceptual image of arrow sign pointing to a word jobs Gather the data and present with our Jobs Business PowerPoint Presentation Slides S. Try us out and see what a difference our templates make.
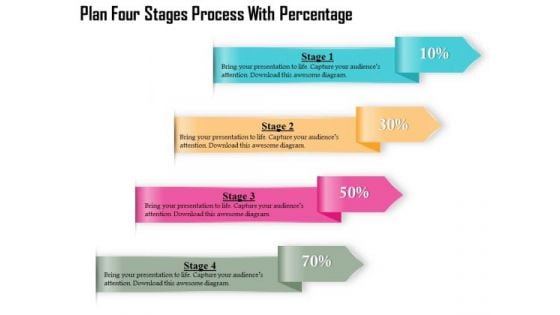
Business Diagram Four Stages Process With Percentage Presentation Template
Four multicolored tags in vertical order has been used to decorate this business diagram. This diagram contains the concept of financial data display with percent values. This diagram can be used for management and finance related presentations.

Business Diagram Three Stages Process Percentage Presentation Template
Three multicolored tags in vertical order has been used to decorate this business diagram. This diagram contains the concept of financial data display with percent values. This diagram can be used for management and finance related presentations.
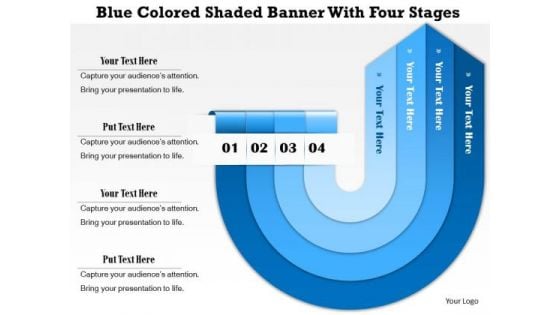
Business Diagram Blue Colored Shaded Banner With Four Stages Presentation Template
Blue colored twisted arrows are used to design this business diagram. These arrows are in banner style with four stages. Use this amazing slide for your data representation in effective manner. Build a unique presentation for your viewers
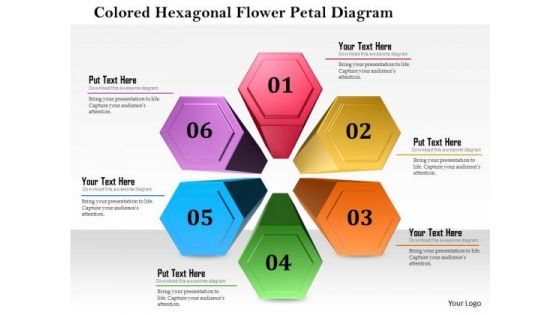
Business Diagram Colored Hexagon Flower Petal Diagram Presentation Template
This business diagram displays colored hexagon flower petal design. This Power Point slide can be used for data representation. Use this PPT slide to show flow of activities in circular manner. Get professional with this exclusive business slide.
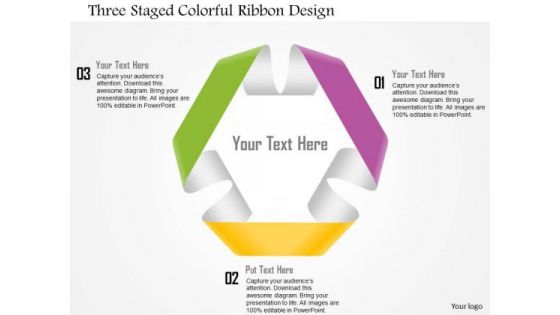
Business Diagram Three Staged Colorful Ribbon Design Presentation Template
This business diagram displays three staged circular ribbon. This Power Point slide can be used for data representation. Use this PPT slide to show flow of activities in circular manner. Get professional with this exclusive business slide.
Business Diagram Five Staged Timeline Diagram With Icons And Hands Graphics Ppt Template
Five staged timeline diagram with hand icons has been used to develop this power point template. This diagram template contains the concept of business data representation. Use this PPT for your business and sales related presentations.

Business Diagram Three Staged Process Diagram PowerPoint Template
Three staged process diagram graphic has been used to design this power point template slide. This PPT contains the concept of data representation for business or marketing. Use this PPT for your business and sales related presentations.
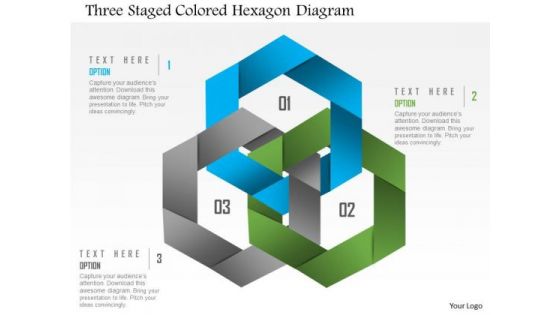
Business Diagram Three Staged Colored Hexagon Diagram PowerPoint Template
Three staged colored hexagon diagram has been used to design this power point template. This PPT contains the concept of study based data representation. This PPT is suitable for business and sales related presentations.
Balloon Banners With Icons PowerPoint Template
Create dynamic presentations with our professional template containing graphics of balloon banner with icons. This diagram is useful for data representation. Download this template to leave permanent impression on your audience.
Cloud Icons With Paper Clips PowerPoint Template
Visually support your presentation with our above template showing cloud icons with paper clips. This slide has been professionally designed to portray concepts like cloud computing and data storage. This template offers an excellent background to build impressive presentation.
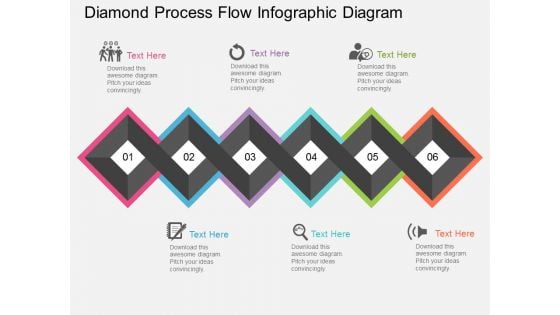
Diamond Process Flow Infographic Diagram Powerpoint Template
Our above slide contains diamond process flow infographic diagram. This PowerPoint template helps to display six steps in linear flow. Use this diagram to impart more clarity to data and to create more sound impact on viewers.
Navigation Point Four Banners And Icons Powerpoint Template
This PowerPoint template has been designed with four banners icons. This diagram is excellent visual tools for business presentations. Download this PPT slide to explain complex data immediately and clearly.
Four Staged Numeric Banners With Icons Powerpoint Template
This PowerPoint template has been designed with four staged numeric banners icons. This diagram is excellent visual tools for business presentations. Download this PPT slide to explain complex data immediately and clearly.
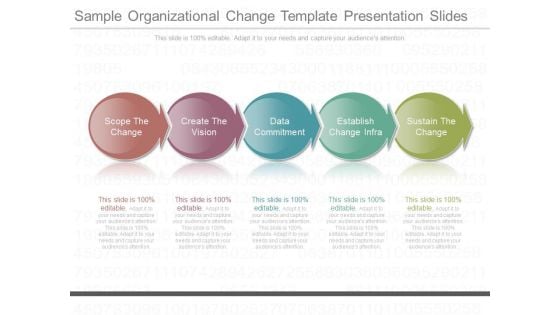
Sample Organizational Change Template Presentation Slides
This is a sample organizational change template presentation slides. This is a five stage process. The stages in this process are scope the change, create the vision, data commitment, establish change infra, sustain the change.
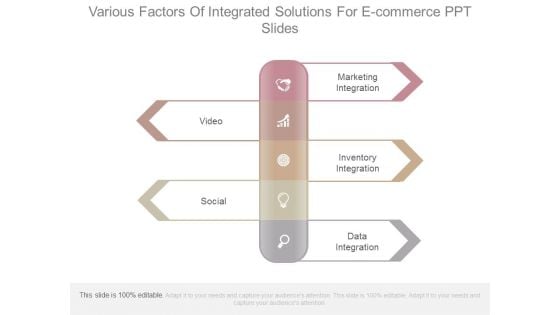
Various Factors Of Integrated Solutions For E Commerce Ppt Slides
This is a various factors of integrated solutions for e commerce ppt slides. This is a five stage process. The stages in this process are marketing integration, inventory integration, data integration, video, social.
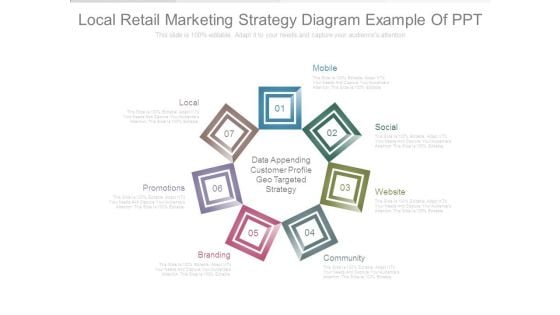
Local Retail Marketing Strategy Diagram Example Of Ppt
This is a local retail marketing strategy diagram example of ppt. This is a seven stage process. The stages in this process are local, promotions, branding, mobile, social, website, community, data appending customer profile geo targeted strategy.
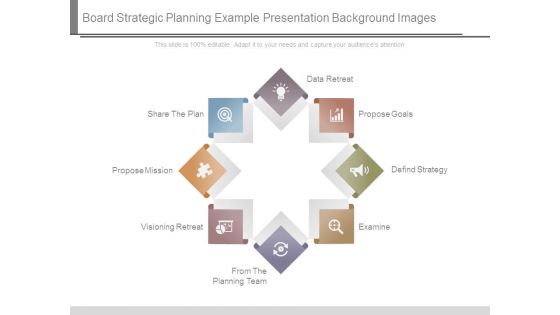
Board Strategic Planning Example Presentation Background Image
This is a board strategic planning example presentation background image. This is a eight stage process. The stages in this process are data retreat, propose goals, defind strategy, examine, share the plan, propose mission, visioning retreat, from the planning team.
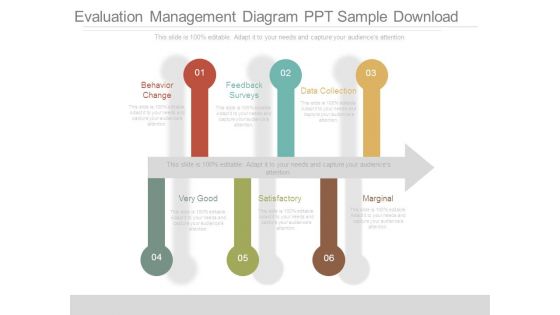
Evaluation Management Diagram Ppt Sample Download
This is a evaluation management diagram ppt sample download. This is a six stage process. The stages in this process are behavior change, feedback surveys, data collection, very good, satisfactory, marginal.
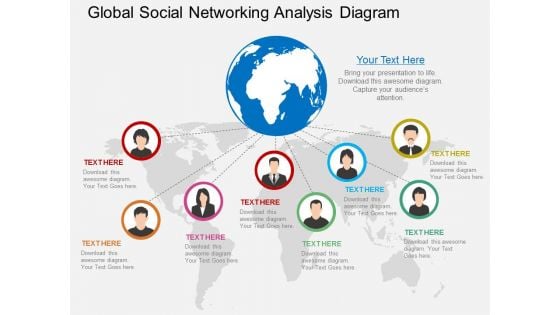
Global Social Networking Analysis Diagram Powerpoint Template
Our above PowerPoint slide contains diagram of globe with people pictures. Download this business slide to illustrate social networking. Use this diagram to impart more clarity to data and to create more sound impact on viewers.
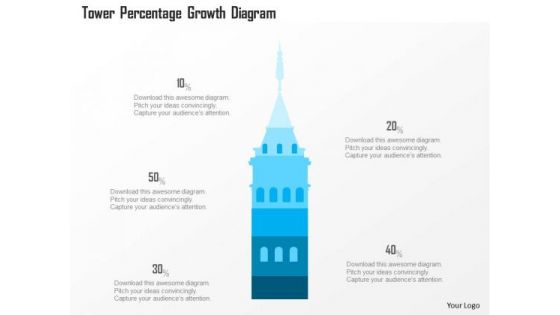
Business Diagram Tower Percentage Growth Diagram Presentation Template
This power point diagram slide has been crafted with graphic of 3d blue tower and text boxes. This PPT slide contains the concept of data and text representations. Use this PPT slide for your business and management related presentations.
Binary Abstract PowerPoint Themes And PowerPoint Slides 0211
Microsoft PowerPoint Theme and Slides with business transactions, data processing, telecommunications and Internet Address problems with our Binary Abstract PowerPoint Themes And PowerPoint Slides 0211. Download without worries with our money back guaranteee.
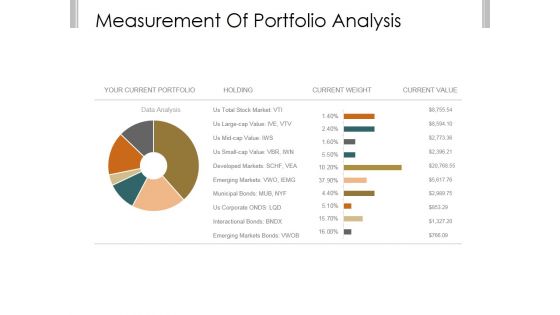
Measurement Of Portfolio Analysis Ppt PowerPoint Presentation Clipart
This is a measurement of portfolio analysis ppt powerpoint presentation clipart. This is a two stage process. The stages in this process are your current portfolio, holding, current weight, current value, data analysis.
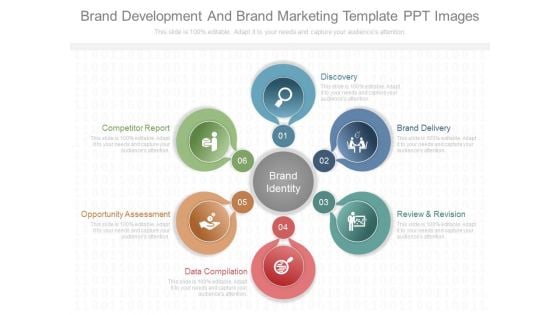
Brand Development And Brand Marketing Template Ppt Images
This is a brand development and brand marketing template ppt images. This is a six stage process. The stages in this process are discovery, brand delivery, review and revision, data compilation, opportunity assessment, competitor report, brand identity.
Battery Icons For Business Growth Levels Powerpoint Template
Levels of business growth can be displayed with this diagram. This PowerPoint template contains graphics of seven battery icons. You can use this design for data analysis in business presentations
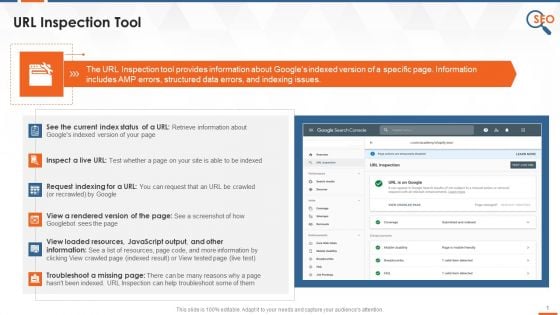
Understanding Url Inspection Tool In Google Search Console Training Ppt
This slide covers details on URL Inspection tool. It also includes information about Googles indexed version of a specific page. The Information includes AMP errors, structured data errors, and indexing issues.
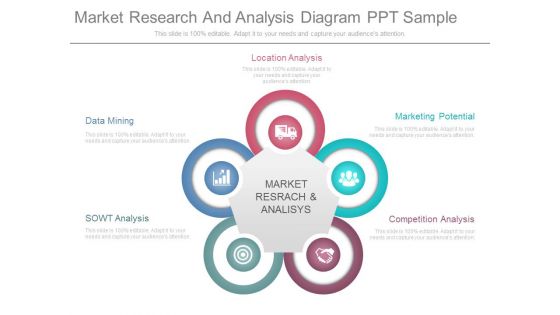
Market Research And Analysis Diagram Ppt Sample
This is a market research and analysis diagram ppt sample. This is a five stage process. The stages in this process are location analysis, data mining, sowt analysis, market research and analysis, competition analysis, marketing potential.
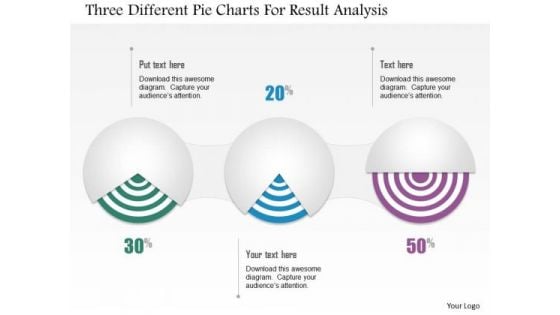
Business Diagram Three Different Pie Charts For Result Analysis Presentation Template
Three different pie charts are used to designed this power point template slide. This PPT slide contains the concept of result analysis. Use this PPT slide for your data and process related presentations.


 Continue with Email

 Home
Home


