Data Comparison
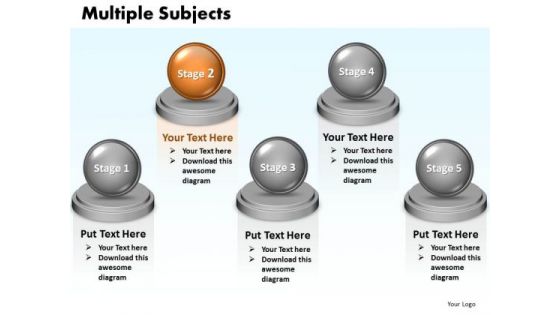
Ppt Multiple Subjects Diagram 5 Phase PowerPoint Slide Text 0812 Templates
PPT multiple subjects diagram 5 phase powerpoint slide text 0812 Templates-Present your views using our innovative slides and be assured of leaving a lasting impression. The vision of being the market leader is clear to you. Transmit your thoughts via our slides and prod your team to action.-PPT multiple subjects diagram 5 phase powerpoint slide text 0812 Templates-3d, Abstract, Backgrounds, Ball, Business, Choice, Comparison, Concept, Descriptive, Equilibrium, Grow, Illustrations, Instrument, Measurement, Metallic, Part, Partnership, Pattern, Progress, Reflections, Scales, Several, Sphere, Strategy, Success Have nothing to fear with our Ppt Multiple Subjects Diagram 5 Phase PowerPoint Slide Text 0812 Templates. Just download, type and present.
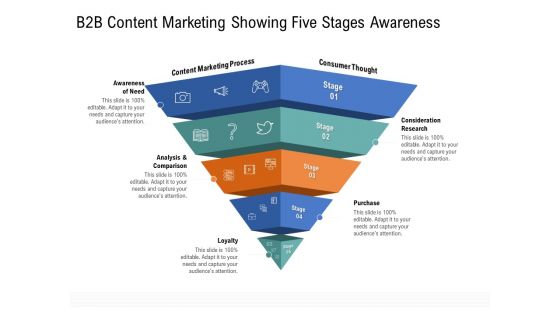
Drafting A Successful Content Plan Approach For Website B2B Content Marketing Showing Five Stages Awareness Guidelines PDF
This is a drafting a successful content plan approach for website b2b content marketing showing five stages awareness guidelines pdf template with various stages. Focus and dispense information on five stages using this creative set, that comes with editable features. It contains large content boxes to add your information on topics like content marketing process, consumer thought, consideration research, purchase, loyalty, analysis and comparison, awareness of need. You can also showcase facts, figures, and other relevant content using this PPT layout. Grab it now.
Brand Equity Management To Raise Utilizing Multiple Tracking Studies To Analyze Brand
This slide showcases various tracking studies to be conducted by brands to collect information on brand performance. It includes tracking customer feedback, non-customer preferences, marketing efforts, and competitor comparisons. Make sure to capture your audiences attention in your business displays with our gratis customizable Brand Equity Management To Raise Utilizing Multiple Tracking Studies To Analyze Brand. These are great for business strategies, office conferences, capital raising or task suggestions. If you desire to acquire more customers for your tech business and ensure they stay satisfied, create your own sales presentation with these plain slides. This slide showcases various tracking studies to be conducted by brands to collect information on brand performance. It includes tracking customer feedback, non-customer preferences, marketing efforts, and competitor comparisons.
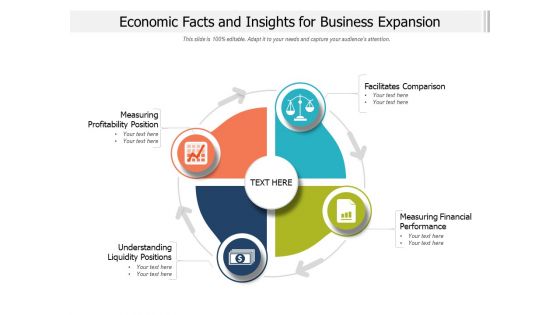
Economic Facts And Insights For Business Expansion Ppt PowerPoint Presentation Infographic Template Slide Portrait PDF
Pitch your topic with ease and precision using this economic facts and insights for business expansion ppt powerpoint presentation infographic template slide portrait pdf. This layout presents information on facilitates comparison, measuring financial performance, understanding liquidity positions, measuring profitability position. It is also available for immediate download and adjustment. So, changes can be made in the color, design, graphics or any other component to create a unique layout.
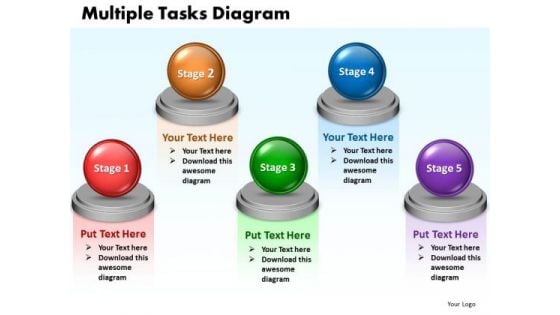
Ppt Multiple Tasks Chart 5 Stages PowerPoint Templates 2003
PPT multiple tasks chart 5 stages powerpoint templates 2003 0812-This diagram will help you to organize information, organize and run effective meetings, and generate useful member contributions.-PPT multiple tasks chart 5 stages powerpoint templates 2003 0812-3d, Abstract, Backgrounds, Ball, Business, Choice, Comparison, Concept, Descriptive, Equilibrium, Grow, Illustrations, Instrument, Measurement, Metallic, Part, Partnership, Pattern, Progress, Reflections, Scales, Several, Sphere, Strategy, Success Start driving productivity gains with our Ppt Multiple Tasks Chart 5 Stages PowerPoint Templates 2003. They will make you look good.
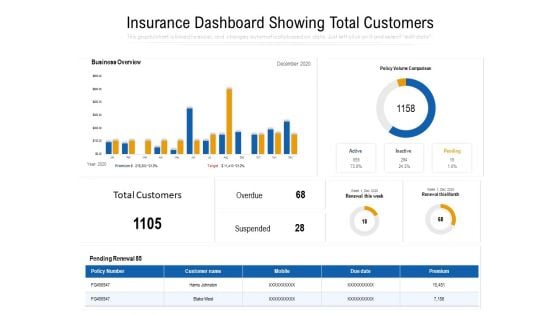
Insurance Dashboard Showing Total Customers Ppt PowerPoint Presentation Pictures Model PDF
Showcasing this set of slides titled insurance dashboard showing total customers ppt powerpoint presentation slides graphics tutorials pdf. The topics addressed in these templates are business overview, policy volume comparison, suspended, renewal this week, renewal this month, premium. All the content presented in this PPT design is completely editable. Download it and make adjustments in color, background, font etc. as per your unique business setting.
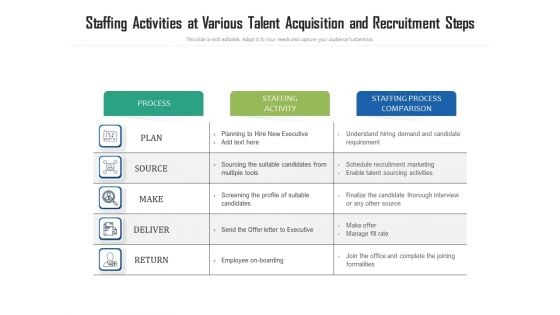
Staffing Activities At Various Talent Acquisition And Recruitment Steps Ppt PowerPoint Presentation Ideas Show PDF
Showcasing this set of slides titled staffing activities at various talent acquisition and recruitment steps ppt powerpoint presentation ideas show pdf. The topics addressed in these templates are process, staffing activity, staffing process comparison, plan, source, deliver, return. All the content presented in this PPT design is completely editable. Download it and make adjustments in color, background, font etc. as per your unique business setting.
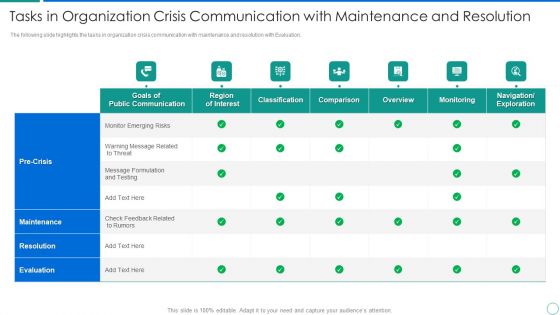
Tasks In Organization Crisis Communication With Maintenance And Resolution Topics PDF
The following slide highlights the tasks in organization crisis communication with maintenance and resolution with Evaluation. Showcasing this set of slides titled tasks in organization crisis communication with maintenance and resolution topics pdf. The topics addressed in these templates are public communication, monitoring, comparison. All the content presented in this PPT design is completely editable. Download it and make adjustments in color, background, font etc. as per your unique business setting.
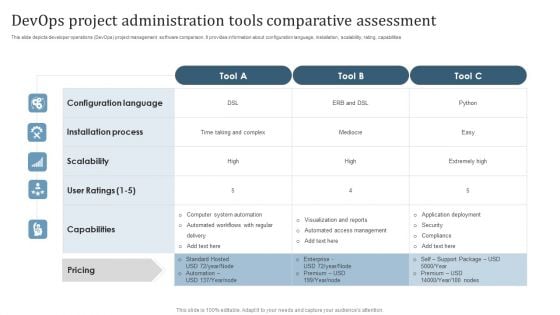
Devops Project Administration Tools Comparative Assessment Demonstration PDF
This slide depicts developer operations DevOps project management software comparison. It provides information about configuration language, installation, scalability, rating, capabilities. Pitch your topic with ease and precision using this Devops Project Administration Tools Comparative Assessment Demonstration PDF. This layout presents information on Configuration Language, Scalability, Capabilities. It is also available for immediate download and adjustment. So, changes can be made in the color, design, graphics or any other component to create a unique layout
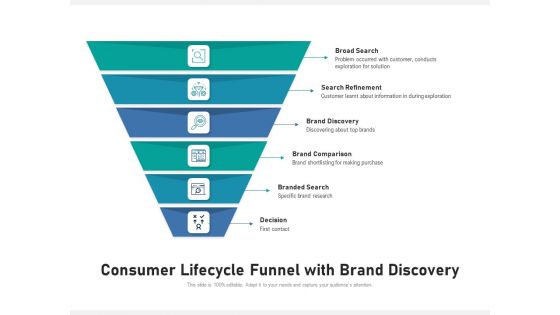
Consumer Lifecycle Funnel With Brand Discovery Ppt PowerPoint Presentation Model Graphic Tips PDF
Presenting consumer lifecycle funnel with brand discovery ppt powerpoint presentation model graphic tips pdf to dispense important information. This template comprises six stages. It also presents valuable insights into the topics including broad search, search refinement, brand discovery, brand comparison, branded search, decision. This is a completely customizable PowerPoint theme that can be put to use immediately. So, download it and address the topic impactfully.

Share Of Wallet Assessing Past Spending Ppt Inspiration Introduction PDF
The purpose of this slide is to provide information regarding the assessment of spending pattern of customers last two months. Deliver and pitch your topic in the best possible manner with this share of wallet assessing past spending ppt inspiration introduction pdf. Use them to share invaluable insights on comparison, sales group, customer, product and impress your audience. This template can be altered and modified as per your expectations. So, grab it now.
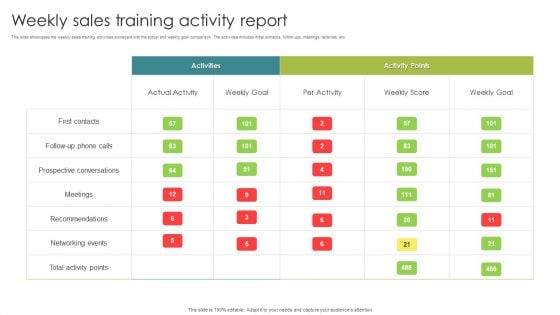
Weekly Sales Training Activity Report Ppt Ideas Graphics PDF
This slide showcases the weekly sales training activities scorecard with the actual and weekly goal comparison. The activities includes initial contacts, follow ups, meetings, referrals, etc. Pitch your topic with ease and precision using this Weekly Sales Training Activity Report Ppt Ideas Graphics PDF. This layout presents information on First Contacts, Recommendations, Networking Events. It is also available for immediate download and adjustment. So, changes can be made in the color, design, graphics or any other component to create a unique layout.
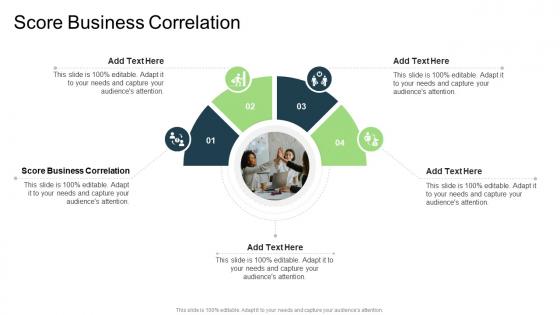
Score Business Correlation In Powerpoint And Google Slides Cpb
Introducing our well designed Score Business Correlation In Powerpoint And Google Slides Cpb. This PowerPoint design presents information on topics like Score Business Correlation. As it is predesigned it helps boost your confidence level. It also makes you a better presenter because of its high quality content and graphics. This PPT layout can be downloaded and used in different formats like PDF, PNG, and JPG. Not only this, it is available in both Standard Screen and Widescreen aspect ratios for your convenience. Therefore, click on the download button now to persuade and impress your audience. Our Score Business Correlation In Powerpoint And Google Slides Cpb are topically designed to provide an attractive backdrop to any subject. Use them to look like a presentation pro.
Correlation Coefficient Indicates In Powerpoint And Google Slides Cpb
Introducing our well designed Correlation Coefficient Indicates In Powerpoint And Google Slides Cpb. This PowerPoint design presents information on topics like Correlation Coefficient Indicates. As it is predesigned it helps boost your confidence level. It also makes you a better presenter because of its high quality content and graphics. This PPT layout can be downloaded and used in different formats like PDF, PNG, and JPG. Not only this, it is available in both Standard Screen and Widescreen aspect ratios for your convenience. Therefore, click on the download button now to persuade and impress your audience. Our Correlation Coefficient Indicates In Powerpoint And Google Slides Cpb are topically designed to provide an attractive backdrop to any subject. Use them to look like a presentation pro.

Statistical Technique And Tools DMAIC Methodology To Maintain PPT PowerPoint
This slide shows main tools that are used in analysing phase for checking reliability of data. It include tools such as hypothesis testing, regression analysis and analysis of variance, etc. Here you can discover an assortment of the finest PowerPoint and Google Slides templates. With these templates, you can create presentations for a variety of purposes while simultaneously providing your audience with an eye-catching visual experience. Download Statistical Technique And Tools DMAIC Methodology To Maintain PPT PowerPoint to deliver an impeccable presentation. These templates will make your job of preparing presentations much quicker, yet still, maintain a high level of quality. Slidegeeks has experienced researchers who prepare these templates and write high-quality content for you. Later on, you can personalize the content by editing the Statistical Technique And Tools DMAIC Methodology To Maintain PPT PowerPoint. This slide shows main tools that are used in analysing phase for checking reliability of data. It include tools such as hypothesis testing, regression analysis and analysis of variance, etc.
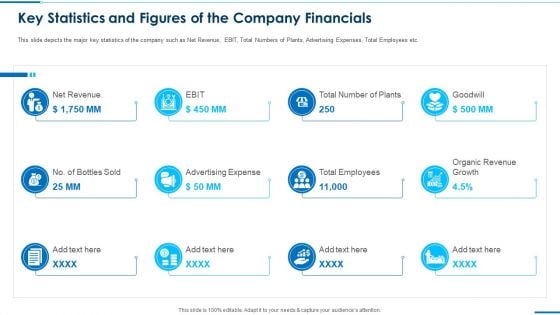
Key Statistics And Figures Of The Company Financials Pictures Pdf
This is a key statistics and figures of the company financials pictures pdf. template with various stages. Focus and dispense information on tweleve stages using this creative set, that comes with editable features. It contains large content boxes to add your information on topics like net revenue, advertising expense, total employees, organic revenue growth, ebit. You can also showcase facts, figures, and other relevant content using this PPT layout. Grab it now.
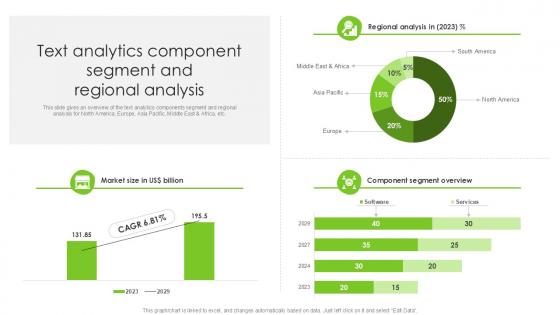
Text Analytics Component Segment And Regional Analysis PPT Template SS
This slide gives an overview of the text analytics components segment and regional analysis for North America, Europe, Asia Pacific, Middle East and Africa, etc. Presenting this PowerPoint presentation, titled Text Analytics Component Segment And Regional Analysis PPT Template SS, with topics curated by our researchers after extensive research. This editable presentation is available for immediate download and provides attractive features when used. Download now and captivate your audience. Presenting this Text Analytics Component Segment And Regional Analysis PPT Template SS. Our researchers have carefully researched and created these slides with all aspects taken into consideration. This is a completely customizable Text Analytics Component Segment And Regional Analysis PPT Template SS that is available for immediate downloading. Download now and make an impact on your audience. Highlight the attractive features available with our PPTs. This slide gives an overview of the text analytics components segment and regional analysis for North America, Europe, Asia Pacific, Middle East and Africa, etc.
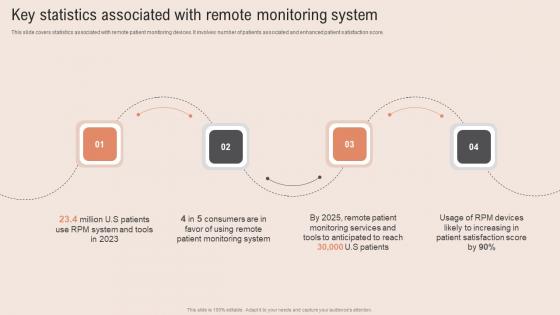
Key Statistics Associated Healthcare Information Tech To Enhance Medical Facilities Rules Pdf
This slide covers process to optimize patient portal system to improve medical efficiency. It involves key steps such as determine portals features, gather skilled developer team and plan project and control execution. This slide covers statistics associated with remote patient monitoring devices. It involves number of patients associated and enhanced patient satisfaction score. The Key Statistics Associated Healthcare Information Tech To Enhance Medical Facilities Rules Pdf is a compilation of the most recent design trends as a series of slides. It is suitable for any subject or industry presentation, containing attractive visuals and photo spots for businesses to clearly express their messages. This template contains a variety of slides for the user to input data, such as structures to contrast two elements, bullet points, and slides for written information. Slidegeeks is prepared to create an impression. This slide covers process to optimize patient portal system to improve medical efficiency. It involves key steps such as determine portals features, gather skilled developer team and plan project and control execution.This slide covers statistics associated with remote patient monitoring devices. It involves number of patients associated and enhanced patient satisfaction score.

Email Marketing Campaign Outcomes And Social Media Marketing Result Analysis Dashboard Mockup PDF
This slide depicts the dashboard for analyzing the results of email campaign and social media marketing. It includes information related to the comparison, statistics, usage, etc. Pitch your topic with ease and precision using this Email Marketing Campaign Outcomes And Social Media Marketing Result Analysis Dashboard Mockup PDF. This layout presents information on Email Marketing Campaign, Outcomes And Social Media, Marketing Result, Analysis Dashboard. It is also available for immediate download and adjustment. So, changes can be made in the color, design, graphics or any other component to create a unique layout.
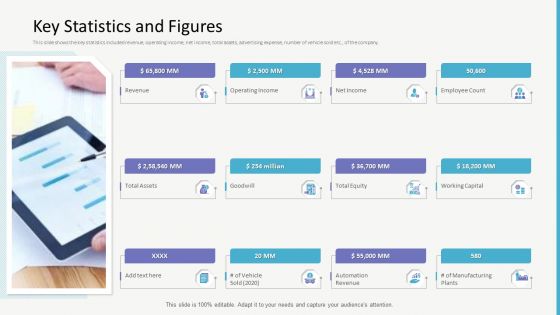
Investor Gap Financing Key Statistics And Figures Structure PDF
This slide shows the key statistics included revenue, operating income, net income, total assets, advertising expense, number of vehicle sold etc., of the company. This is a investor gap financing key statistics and figures structure pdf template with various stages. Focus and dispense information on twelve stages using this creative set, that comes with editable features. It contains large content boxes to add your information on topics like revenue, operating income, employee count. You can also showcase facts, figures, and other relevant content using this PPT layout. Grab it now.
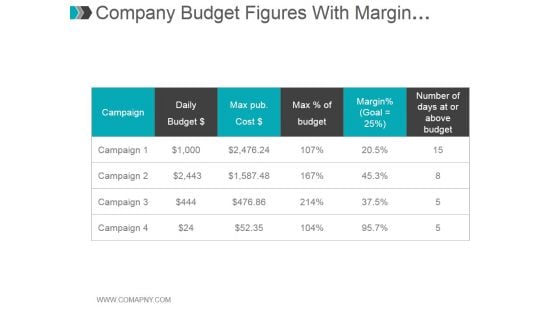
Company Budget Figures With Margin Percentages Ppt PowerPoint Presentation Templates
This is a company budget figures with margin percentages ppt powerpoint presentation templates. This is six stage process. The stages in this process are campaign, daily budget, max pub cost, max of budget, number of days at or above budget, margin.
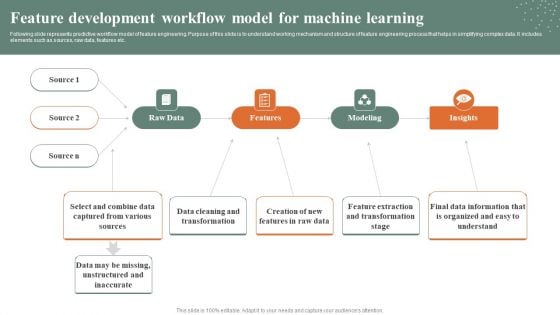
Feature Development Workflow Model For Machine Learning Pictures PDF
Following slide represents predictive workflow model of feature engineering. Purpose of this slide is to understand working mechanism and structure of feature engineering process that helps in simplifying complex data. It includes elements such as sources, raw data, features etc. Showcasing this set of slides titled Feature Development Workflow Model For Machine Learning Pictures PDF. The topics addressed in these templates are Raw Data, Features, Modeling. All the content presented in this PPT design is completely editable. Download it and make adjustments in color, background, font etc. as per your unique business setting.

Quarterly Product Impact Assessment Timeline Through Business Strategies Demonstration Pdf
This slide shows the assessment timeline for quarterly product impact via business strategies. The purpose of this slide is to launch expected product on market deadlines. It includes the process of ideation, concept, testing and release on quarterly basis. Pitch your topic with ease and precision using this Quarterly Product Impact Assessment Timeline Through Business Strategies Demonstration Pdf This layout presents information on Ideation, Concept, Release, Testing It is also available for immediate download and adjustment. So, changes can be made in the color, design, graphics or any other component to create a unique layout. This slide shows the assessment timeline for quarterly product impact via business strategies. The purpose of this slide is to launch expected product on market deadlines. It includes the process of ideation, concept, testing and release on quarterly basis.

Marketing Playbook To Maximize ROI Customer Expectations And Experience Journey Mapping Designs PDF
This slide provides information regarding customer expectations and experience journey mapping across entire buying process by managing customer goals, customer thoughts, touch points and emotional response. This is a marketing playbook to maximize roi customer expectations and experience journey mapping designs pdf template with various stages. Focus and dispense information on five stages using this creative set, that comes with editable features. It contains large content boxes to add your information on topics like decision or purchase, implementation, support or renew, evaluation or comparison, buying process. You can also showcase facts, figures, and other relevant content using this PPT layout. Grab it now.

Dynamic System Development Method Tools And Techniques IT Key Values Of DSDM Infographics PDF
This slide describes the values of DSDM to be implemented such as an individual, working software, collaboration, and including changes. This is a dynamic system development method tools and techniques it key benefits of adopting dsdm elements pdf template with various stages. Focus and dispense information on four stages using this creative set, that comes with editable features. It contains large content boxes to add your information on topics like comparison, process, knowledge, value, project. You can also showcase facts, figures, and other relevant content using this PPT layout. Grab it now.
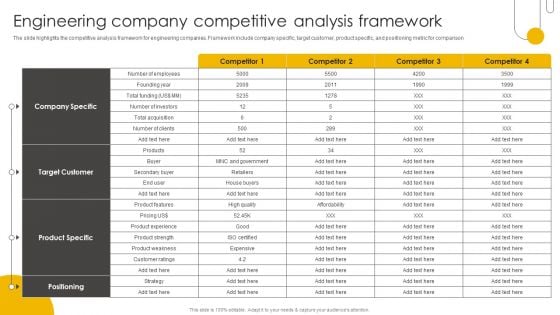
Engineering Enterprise Competitive Engineering Company Competitive Analysis Themes PDF
The slide highlights the competitive analysis framework for engineering companies. Framework include company specific, target customer, product specific, and positioning metric for comparison. Want to ace your presentation in front of a live audience Our Engineering Enterprise Competitive Engineering Company Competitive Analysis Themes PDF can help you do that by engaging all the users towards you. Slidegeeks experts have put their efforts and expertise into creating these impeccable powerpoint presentations so that you can communicate your ideas clearly. Moreover, all the templates are customizable, and easy-to-edit and downloadable. Use these for both personal and commercial use.
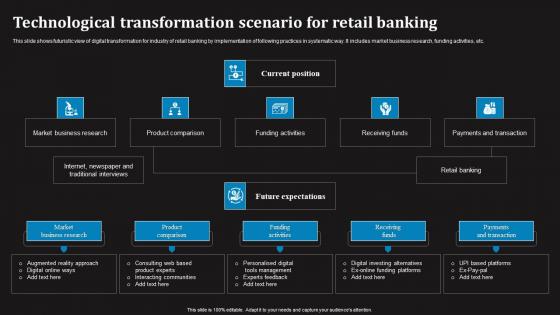
Technological Transformation Scenario For Retail Banking Slides Pdf
This slide shows futuristic view of digital transformation for industry of retail banking by implementation of following practices in systematic way. It includes market business research, funding activities, etc. Showcasing this set of slides titled Technological Transformation Scenario For Retail Banking Slides Pdf The topics addressed in these templates are Market Business Research, Product Comparison, Funding Activities All the content presented in this PPT design is completely editable. Download it and make adjustments in color, background, font etc. as per your unique business setting. This slide shows futuristic view of digital transformation for industry of retail banking by implementation of following practices in systematic way. It includes market business research, funding activities, etc.
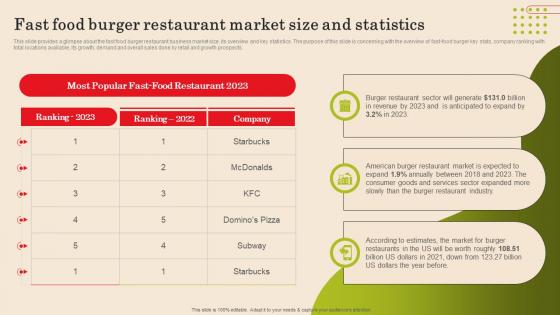
Fast Food Burger Restaurant Market Size And Statistics Fast Food Business Plan Graphics Pdf
This slide provides a glimpse about the fast food burger restaurant business market size, its overview and key statistics. The purpose of this slide is concerning with the overview of fast-food burger key stats, company ranking with total locations available, its growth, demand and overall sales done by retail and growth prospects. If your project calls for a presentation, then Slidegeeks is your go-to partner because we have professionally designed, easy-to-edit templates that are perfect for any presentation. After downloading, you can easily edit Fast Food Burger Restaurant Market Size And Statistics Fast Food Business Plan Graphics Pdf and make the changes accordingly. You can rearrange slides or fill them with different images. Check out all the handy templates This slide provides a glimpse about the fast food burger restaurant business market size, its overview and key statistics. The purpose of this slide is concerning with the overview of fast-food burger key stats, company ranking with total locations available, its growth, demand and overall sales done by retail and growth prospects.
Correlation Analysis In Powerpoint And Google Slides Cpb
Presenting our innovatively designed set of slides titled Correlation Analysis In Powerpoint And Google Slides Cpb. This completely editable PowerPoint graphic exhibits Correlation Analysis that will help you convey the message impactfully. It can be accessed with Google Slides and is available in both standard screen and widescreen aspect ratios. Apart from this, you can download this well structured PowerPoint template design in different formats like PDF, JPG, and PNG. So, click the download button now to gain full access to this PPT design. Our Correlation Analysis In Powerpoint And Google Slides Cpb are topically designed to provide an attractive backdrop to any subject. Use them to look like a presentation pro.

Pearson Correlation In Powerpoint And Google Slides Cpb
Introducing our well designed Pearson Correlation In Powerpoint And Google Slides Cpb. This PowerPoint design presents information on topics like Pearson Correlation. As it is predesigned it helps boost your confidence level. It also makes you a better presenter because of its high-quality content and graphics. This PPT layout can be downloaded and used in different formats like PDF, PNG, and JPG. Not only this, it is available in both Standard Screen and Widescreen aspect ratios for your convenience. Therefore, click on the download button now to persuade and impress your audience. Our Pearson Correlation In Powerpoint And Google Slides Cpb are topically designed to provide an attractive backdrop to any subject. Use them to look like a presentation pro.
Statistical Analysis Of Circular Chart 5 Steps Ppt Outline For Business Plan PowerPoint Slides
We present our statistical analysis of circular chart 5 steps ppt outline for business plan PowerPoint Slides.Present our Business PowerPoint Templates because Our PowerPoint Templates and Slides will definately Enhance the stature of your presentation. Adorn the beauty of your thoughts with their colourful backgrounds. Download our Signs PowerPoint Templates because They will Put the wind in your sails. Skim smoothly over the choppy waters of the market. Download our Shapes PowerPoint Templates because Our PowerPoint Templates and Slides come in all colours, shades and hues. They help highlight every nuance of your views. Download and present our Metaphors-Visual Concepts PowerPoint Templates because Our PowerPoint Templates and Slides will let your words and thoughts hit bullseye everytime. Download and present our Process and Flows PowerPoint Templates because Our PowerPoint Templates and Slides will help you be quick off the draw. Just enter your specific text and see your points hit home.Use these PowerPoint slides for presentations relating to graphically, graphic, vector, layout, business, computation, sign, infochart, visual, symbol, template, diagram, calculations, sector, data, revenue, schedule, element, analysis, drawing, report, technology, contour, classification, graph, modern, illustration, icon, comparison, object, chart, collection, science, color, growth, composition, professional, set, education, math, profits, information, symmetry, statistic, structure, infographics, button. The prominent colors used in the PowerPoint template are Pink, Gray, White. Our Statistical Analysis Of Circular Chart 5 Steps Ppt Outline For Business Plan PowerPoint Slides will ensure you get a good grade. You will be glad you tried us out.
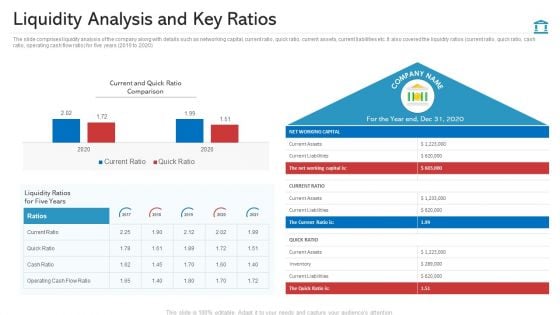
Liquidity Analysis And Key Ratios Structure PDF
The slide comprises liquidity analysis of the company along with details such as networking capital, current ratio, quick ratio, current assets, current liabilities etc. It also covered the liquidity ratios current ratio, quick ratio, cash ratio, operating cash flow ratio for five years 2016 to 2020 Deliver and pitch your topic in the best possible manner with this liquidity analysis and key ratios structure pdf. Use them to share invaluable insights on net working capital, current and quick ratio comparison, current liabilities and impress your audience. This template can be altered and modified as per your expectations. So, grab it now.
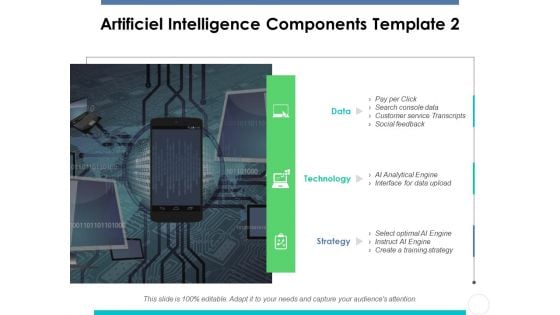
Artificiel Intelligence Components Template 2 Ppt PowerPoint Presentation Slides Inspiration
This is a artificiel intelligence components template 2 ppt powerpoint presentation slides inspiration. This is a three stage process. The stages in this process are data, technology, strategy, artificiel, intelligence, components.
Icon For Email Marketing Campaign Statistics Ideas Pdf
Pitch your topic with ease and precision using this Icon For Email Marketing Campaign Statistics Ideas Pdf. This layout presents information on Email Marketing, Campaign, Statistics. It is also available for immediate download and adjustment. So, changes can be made in the color, design, graphics or any other component to create a unique layout. Our Icon For Email Marketing Campaign Statistics Ideas Pdf are topically designed to provide an attractive backdrop to any subject. Use them to look like a presentation pro.
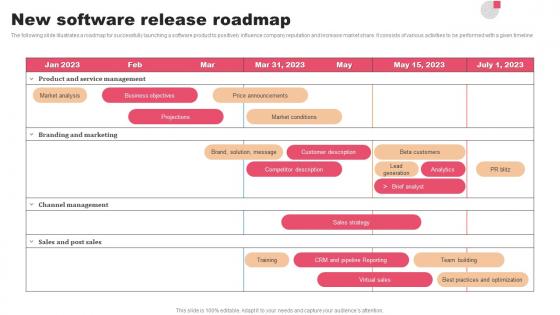
New Software Release Roadmap Template Pdf
The following slide illustrates a roadmap for successfully launching a software product to positively influence company reputation and increase market share. It consists of various activities to be performed with a given timeline Pitch your topic with ease and precision using this New Software Release Roadmap Template Pdf This layout presents information on Business Objectives, Channel Management, Sales And Post It is also available for immediate download and adjustment. So, changes can be made in the color, design, graphics or any other component to create a unique layout. The following slide illustrates a roadmap for successfully launching a software product to positively influence company reputation and increase market share. It consists of various activities to be performed with a given timeline
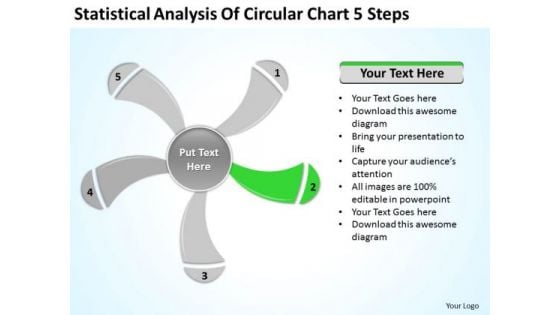
Statistical Analysis Of Circular Chart 5 Steps Ppt Business Plan PowerPoint Slide
We present our statistical analysis of circular chart 5 steps ppt business plan PowerPoint Slide.Download and present our Business PowerPoint Templates because Our PowerPoint Templates and Slides will definately Enhance the stature of your presentation. Adorn the beauty of your thoughts with their colourful backgrounds. Use our Signs PowerPoint Templates because Our PowerPoint Templates and Slides will give good value for money. They also have respect for the value of your time. Download our Shapes PowerPoint Templates because Our PowerPoint Templates and Slides team portray an attitude of elegance. Personify this quality by using them regularly. Use our Metaphors-Visual Concepts PowerPoint Templates because Our PowerPoint Templates and Slides will effectively help you save your valuable time. They are readymade to fit into any presentation structure. Use our Process and Flows PowerPoint Templates because our PowerPoint Templates and Slides are the string of your bow. Fire of your ideas and conquer the podium.Use these PowerPoint slides for presentations relating to graphically, graphic, vector, layout, business, computation, sign, infochart, visual, symbol, template, diagram, calculations, sector, data, revenue, schedule, element, analysis, drawing, report, technology, contour, classification, graph, modern, illustration, icon, comparison, object, chart, collection, science, color, growth, composition, professional, set, education, math, profits, information, symmetry, statistic, structure, infographics, button. The prominent colors used in the PowerPoint template are Green, Gray, White. Get a blue-chip client list with your ideas. Attract the best customers with our Statistical Analysis Of Circular Chart 5 Steps Ppt Business Plan PowerPoint Slide.
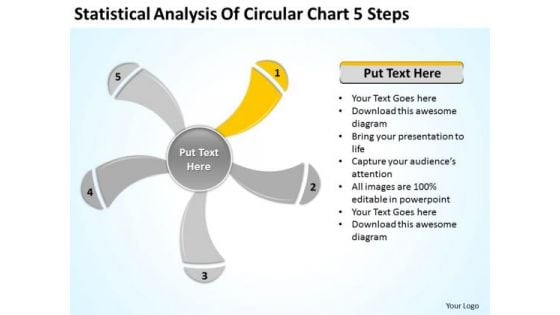
Statistical Analysis Of Circular Chart 5 Steps Ppt Business Plan PowerPoint Slides
We present our statistical analysis of circular chart 5 steps ppt business plan PowerPoint Slides.Download and present our Business PowerPoint Templates because Timeline crunches are a fact of life. Meet all deadlines using our PowerPoint Templates and Slides. Present our Signs PowerPoint Templates because You can Zap them with our PowerPoint Templates and Slides. See them reel under the impact. Use our Shapes PowerPoint Templates because It can Bubble and burst with your ideas. Download our Metaphors-Visual Concepts PowerPoint Templates because You can Create a matrix with our PowerPoint Templates and Slides. Feel the strength of your ideas click into place. Present our Process and Flows PowerPoint Templates because Our PowerPoint Templates and Slides has conjured up a web of all you need with the help of our great team. Use them to string together your glistening ideas.Use these PowerPoint slides for presentations relating to graphically, graphic, vector, layout, business, computation, sign, infochart, visual, symbol, template, diagram, calculations, sector, data, revenue, schedule, element, analysis, drawing, report, technology, contour, classification, graph, modern, illustration, icon, comparison, object, chart, collection, science, color, growth, composition, professional, set, education, math, profits, information, symmetry, statistic, structure, infographics, button. The prominent colors used in the PowerPoint template are Yellow, Gray, White. Use our Statistical Analysis Of Circular Chart 5 Steps Ppt Business Plan PowerPoint Slides to brainstorm. You will be amazed at the ideas that emerge.
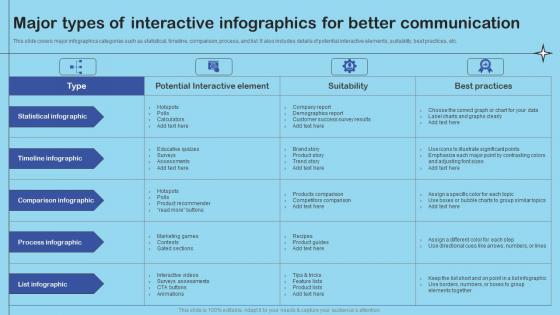
Major Types Of Interactive Infographics Enhance Client Engagement With Interactive Information Pdf
This slide covers major infographics categories such as statistical, timeline, comparison, process, and list. It also includes details of potential interactive elements, suitability, best practices, etc. Presenting this PowerPoint presentation, titled Major Types Of Interactive Infographics Enhance Client Engagement With Interactive Information Pdf, with topics curated by our researchers after extensive research. This editable presentation is available for immediate download and provides attractive features when used. Download now and captivate your audience. Presenting this Major Types Of Interactive Infographics Enhance Client Engagement With Interactive Information Pdf. Our researchers have carefully researched and created these slides with all aspects taken into consideration. This is a completely customizable Major Types Of Interactive Infographics Enhance Client Engagement With Interactive Information Pdf that is available for immediate downloading. Download now and make an impact on your audience. Highlight the attractive features available with our PPTs. This slide covers major infographics categories such as statistical, timeline, comparison, process, and list. It also includes details of potential interactive elements, suitability, best practices, etc.
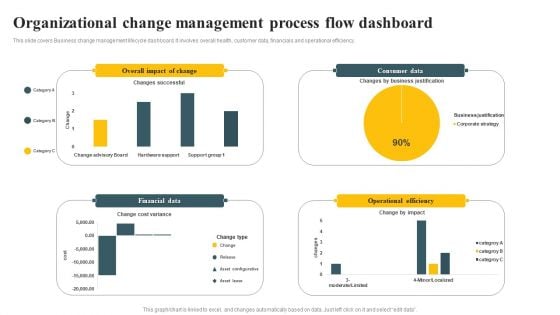
Organizational Change Management Process Flow Dashboard Ppt PowerPoint Presentation Diagram PDF
This slide covers Business change management lifecycle dashboard. It involves overall health, customer data, financials and operational efficiency. Pitch your topic with ease and precision using this Organizational Change Management Process Flow Dashboard Ppt PowerPoint Presentation Diagram PDF. This layout presents information on Financial Data, Operational Efficiency, Consumer Data. It is also available for immediate download and adjustment. So, changes can be made in the color, design, graphics or any other component to create a unique layout.
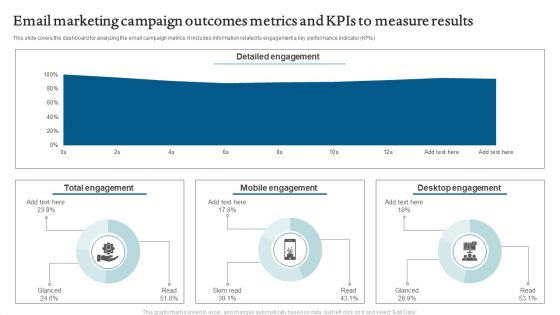
Email Marketing Campaign Outcomes Metrics And Kpis To Measure Results Rules PDF
This slide depicts the dashboard for analyzing the results of email campaign and social media marketing. It includes information related to the comparison, statistics, usage, etc. Showcasing this set of slides titled Email Marketing Campaign Outcomes Metrics And Kpis To Measure Results Rules PDF. The topics addressed in these templates are Detailed Engagement, Mobile Engagement, Desktop Engagement. All the content presented in this PPT design is completely editable. Download it and make adjustments in color, background, font etc. as per your unique business setting.
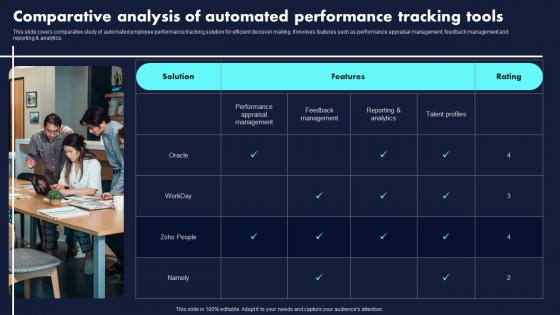
Comparative Analysis Of Automated Proven Techniques For Enhancing Infographics Pdf
This slide covers comparative study of automated employee performance tracking solution for efficient decision making. It involves features such as performance appraisal management, feedback management and reporting analytics.The Comparative Analysis Of Automated Proven Techniques For Enhancing Infographics Pdf is a compilation of the most recent design trends as a series of slides. It is suitable for any subject or industry presentation, containing attractive visuals and photo spots for businesses to clearly express their messages. This template contains a variety of slides for the user to input data, such as structures to contrast two elements, bullet points, and slides for written information. Slidegeeks is prepared to create an impression. This slide covers comparative study of automated employee performance tracking solution for efficient decision making. It involves features such as performance appraisal management, feedback management and reporting analytics.
Best Calculators Statistics In Powerpoint And Google Slides Cpb
Introducing our well-designed Best Calculators Statistics In Powerpoint And Google Slides Cpb. This PowerPoint design presents information on topics like Best Calculators Statistics. As it is predesigned it helps boost your confidence level. It also makes you a better presenter because of its high-quality content and graphics. This PPT layout can be downloaded and used in different formats like PDF, PNG, and JPG. Not only this, it is available in both Standard Screen and Widescreen aspect ratios for your convenience. Therefore, click on the download button now to persuade and impress your audience. Our Best Calculators Statistics In Powerpoint And Google Slides Cpb are topically designed to provide an attractive backdrop to any subject. Use them to look like a presentation pro.

Statistical Tools For Evidence Descriptive And Inferential Methods Of Statistical Analysis
This slide represents the different techniques of descriptive and inferential statistical analysis. These are univariate, bivariate, multivariate, central limit theorem, binomial theorem, hypothesis testing, normal distribution, applied to means, etc. Make sure to capture your audiences attention in your business displays with our gratis customizable Statistical Tools For Evidence Descriptive And Inferential Methods Of Statistical Analysis. These are great for business strategies, office conferences, capital raising or task suggestions. If you desire to acquire more customers for your tech business and ensure they stay satisfied, create your own sales presentation with these plain slides. This slide represents the different techniques of descriptive and inferential statistical analysis. These are univariate, bivariate, multivariate, central limit theorem, binomial theorem, hypothesis testing, normal distribution, applied to means, etc.

Definitive Guide Creating Strategy Most Effective Content For Consideration Stage Microsoft PDF
The following slide lists out the most effective forms of content during the third stage of the customer journey i.e. Consideration- when the customer starts comparing different brands to find the best product. Presenting definitive guide creating strategy most effective content for consideration stage microsoft pdf to provide visual cues and insights. Share and navigate important information on eleven stages that need your due attention. This template can be used to pitch topics like sales enablement, product marketing, comparison. In addition, this PPT design contains high-resolution images, graphics, etc, that are easily editable and available for immediate download.
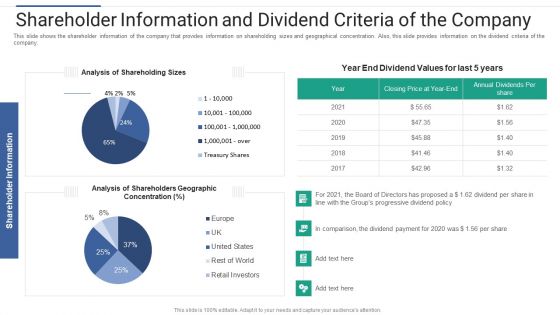
Shareholder Governance Enhance Comprehensive Corporate Performance Shareholder Information Dividend Introduction PDF
This slide shows the shareholder information of the company that provides information on shareholding sizes and geographical concentration. Also, this slide provides information on the dividend criteria of the company. Deliver and pitch your topic in the best possible manner with this shareholder governance enhance comprehensive corporate performance shareholder information dividend introduction pdf. Use them to share invaluable insights on shareholding, concentration, comparison, payment, progressive and impress your audience. This template can be altered and modified as per your expectations. So, grab it now.
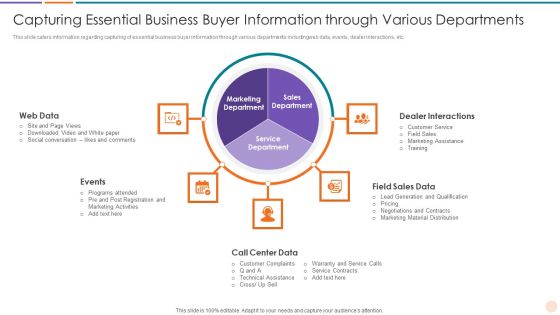
Improving Lead Generation Capturing Essential Business Buyer Information Through Slides PDF
This slide caters information regarding capturing of essential business buyer information through various departments includingweb data, events, dealer interactions, etc. This is a improving lead generation capturing essential business buyer information through slides pdf template with various stages. Focus and dispense information on five stages using this creative set, that comes with editable features. It contains large content boxes to add your information on topics like web data, events, call center data, field sales data, dealer interactions. You can also showcase facts, figures, and other relevant content using this PPT layout. Grab it now.
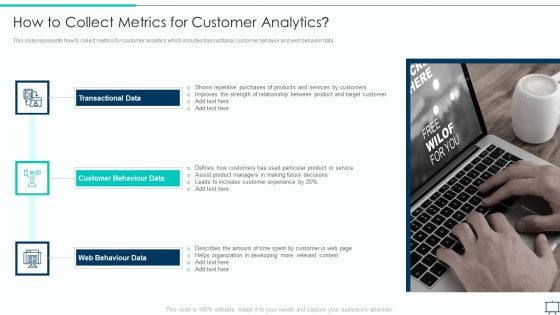
Formulating Competitive Plan Of Action For Effective Product Leadership How To Collect Metrics Infographics PDF
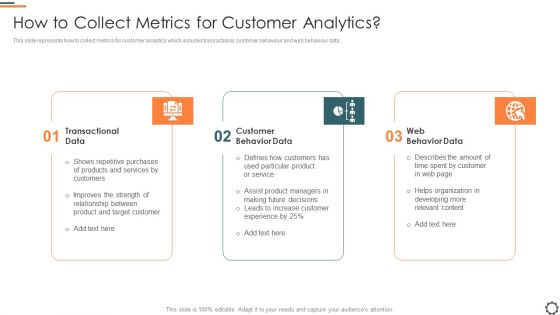
This slide represents how to collect metrics for customer analytics which includes transactional, customer behavior and web behavior data. This is a formulating competitive plan of action for effective product leadership how to collect metrics infographics pdf template with various stages. Focus and dispense information on three stages using this creative set, that comes with editable features. It contains large content boxes to add your information on topics like transactional data, customer behaviour data, web behaviour data. You can also showcase facts, figures, and other relevant content using this PPT layout. Grab it now.
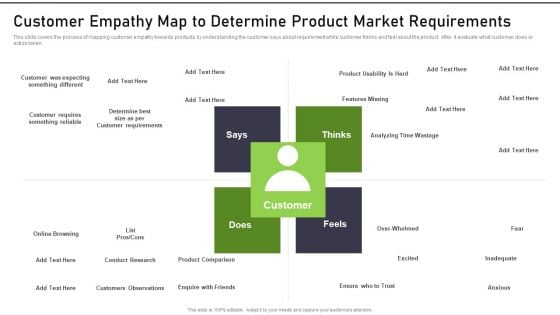
Modernization And Product Customer Empathy Map To Determine Product Market Information PDF
This slide covers the process of mapping customer empathy towards products by understanding the customer says about requirement while customer thinks and feel about the product. After it evaluate what customer does or action taken. Presenting modernization and product customer empathy map to determine product market information pdf to provide visual cues and insights. Share and navigate important information on four stages that need your due attention. This template can be used to pitch topics like customer, online browsing, product comparison, enquire friends. In addtion, this PPT design contains high resolution images, graphics, etc, that are easily editable and available for immediate download.

Key Statistics Associated With Asset Management RFID Solutions For Asset Traceability Rules Pdf
This slide covers statistics associated with effective asset management. It involves information related to asset tracking system, ownership cost and tax and insurance etc. This Key Statistics Associated With Asset Management RFID Solutions For Asset Traceability Rules Pdf is perfect for any presentation, be it in front of clients or colleagues. It is a versatile and stylish solution for organizing your meetings. The Key Statistics Associated With Asset Management RFID Solutions For Asset Traceability Rules Pdf features a modern design for your presentation meetings. The adjustable and customizable slides provide unlimited possibilities for acing up your presentation. Slidegeeks has done all the homework before launching the product for you. So, do not wait, grab the presentation templates today This slide covers statistics associated with effective asset management. It involves information related to asset tracking system, ownership cost and tax and insurance etc.
Agile Group For Product Development How To Collect Metrics For Customer Analytics Guidelines PDF
This slide represents how to collect metrics for customer analytics which includes transactional, customer behaviour and web behaviour data. This is a agile group for product development how to collect metrics for customer analytics guidelines pdf template with various stages. Focus and dispense information on three stages using this creative set, that comes with editable features. It contains large content boxes to add your information on topics like transactional data, customer behavior data, web behavior data. You can also showcase facts, figures, and other relevant content using this PPT layout. Grab it now.

Deliver Efficiency Innovation How To Collect Metrics For Customer Analytics Designs PDF
This slide represents how to collect metrics for customer analytics which includes transactional, customer behavior and web behavior data. This is a Deliver Efficiency Innovation How To Collect Metrics For Customer Analytics Designs PDF template with various stages. Focus and dispense information on three stages using this creative set, that comes with editable features. It contains large content boxes to add your information on topics like Transactional Data, Customer Behavior Data, Web Behavior Data. You can also showcase facts, figures, and other relevant content using this PPT layout. Grab it now.
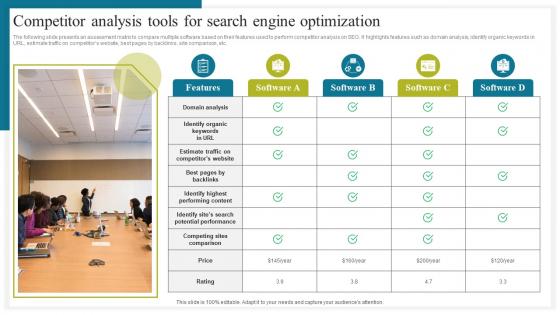
Competitor Analysis Tools How To Conduct Competitive Assessment Professional Pdf
The following slide presents an assessment matrix to compare multiple software based on their features used to perform competitor analysis on SEO. It highlights features such as domain analysis, identify organic keywords in URL, estimate traffic on competitors website, best pages by backlinks, site comparison, etc. Formulating a presentation can take up a lot of effort and time, so the content and message should always be the primary focus. The visuals of the PowerPoint can enhance the presenters message, so our Competitor Analysis Tools How To Conduct Competitive Assessment Professional Pdf was created to help save time. Instead of worrying about the design, the presenter can concentrate on the message while our designers work on creating the ideal templates for whatever situation is needed. Slidegeeks has experts for everything from amazing designs to valuable content, we have put everything into Competitor Analysis Tools How To Conduct Competitive Assessment Professional Pdf The following slide presents an assessment matrix to compare multiple software based on their features used to perform competitor analysis on SEO. It highlights features such as domain analysis, identify organic keywords in URL, estimate traffic on competitors website, best pages by backlinks, site comparison, etc.
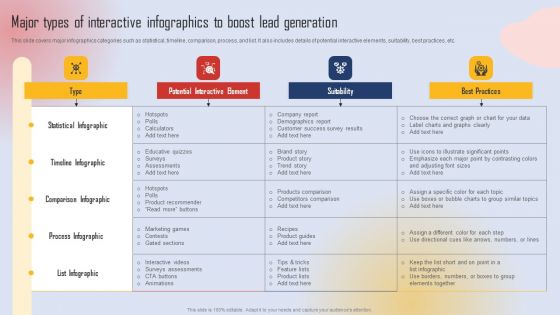
Effective Lead Generation For Higher Conversion Rates Major Types Of Interactive Infographics To Boost Mockup PDF
This slide covers major infographics categories such as statistical, timeline, comparison, process, and list. It also includes details of potential interactive elements, suitability, best practices, etc. From laying roadmaps to briefing everything in detail, our templates are perfect for you. You can set the stage with your presentation slides. All you have to do is download these easy to edit and customizable templates. Effective Lead Generation For Higher Conversion Rates Major Types Of Interactive Infographics To Boost Mockup PDF will help you deliver an outstanding performance that everyone would remember and praise you for. Do download this presentation today.
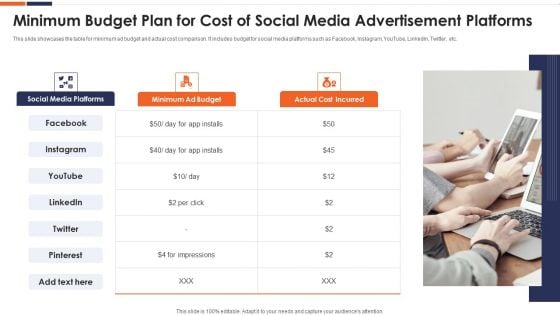
Minimum Budget Plan For Cost Of Social Media Advertisement Platforms Ppt Infographic Template Background Designs PDF
This slide showcases the table for minimum ad budget and actual cost comparison. It includes budget for social media platforms such as Facebook, Instagram, YouTube, LinkedIn, Twitter, etc. Presenting minimum budget plan for cost of social media advertisement platforms ppt infographic template background designs pdf to dispense important information. This template comprises three stages. It also presents valuable insights into the topics including social media platforms, minimum ad budget, actual cost incurred. This is a completely customizable PowerPoint theme that can be put to use immediately. So, download it and address the topic impactfully.
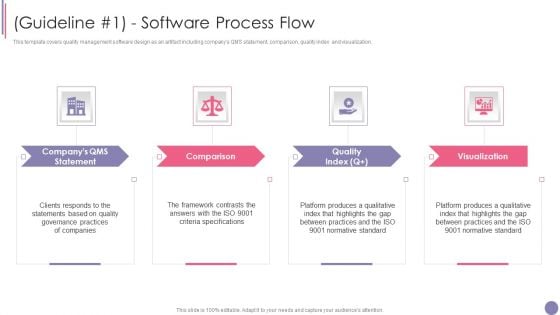
ISO 9001 Quality Assurance Software Accreditation Guideline 1 Software Process Flow Brochure PDF
This template covers quality management software design as an artifact including companys QMS statement, comparison, quality index and visualization. This is a ISO 9001 Quality Assurance Software Accreditation Guideline 1 Software Process Flow Brochure PDF template with various stages. Focus and dispense information on four stages using this creative set, that comes with editable features. It contains large content boxes to add your information on topics like Quality Index, Visualization, Companys Qms Statement. You can also showcase facts, figures, and other relevant content using this PPT layout. Grab it now.
Steps To Achieve ISO 9001 Certification Guideline 1 Software Process Flow Icons PDF
This template covers quality management software design as an artifact including companys QMS statement, comparison, quality index and visualization. This is a Steps To Achieve ISO 9001 Certification Guideline 1 Software Process Flow Icons PDF template with various stages. Focus and dispense information on four stages using this creative set, that comes with editable features. It contains large content boxes to add your information on topics like Quality Index, Visualization, Software Process Flow. You can also showcase facts, figures, and other relevant content using this PPT layout. Grab it now.
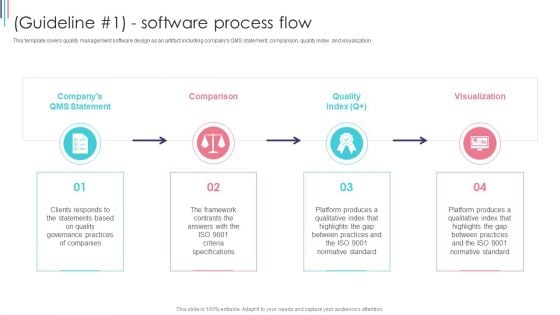
ISO 9001 Standard For Quality Control Guideline 1 Software Process Flow Graphics PDF
This template covers quality management software design as an artifact including companys QMS statement, comparison, quality index and visualization. This is a ISO 9001 Standard For Quality Control Guideline 1 Software Process Flow Graphics PDF template with various stages. Focus and dispense information on four stages using this creative set, that comes with editable features. It contains large content boxes to add your information on topics like Platform Produces, Software Process Flow. You can also showcase facts, figures, and other relevant content using this PPT layout. Grab it now.
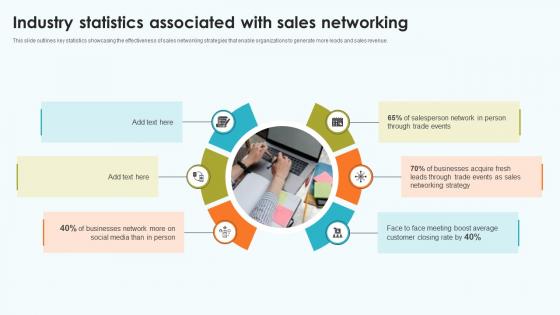
Elevating Sales Networks Industry Statistics Associated With Sales Networking SA SS V
This slide outlines key statistics showcasing the effectiveness of sales networking strategies that enable organizations to generate more leads and sales revenue. Are you searching for a Elevating Sales Networks Industry Statistics Associated With Sales Networking SA SS V that is uncluttered, straightforward, and original Its easy to edit, and you can change the colors to suit your personal or business branding. For a presentation that expresses how much effort you have put in, this template is ideal With all of its features, including tables, diagrams, statistics, and lists, its perfect for a business plan presentation. Make your ideas more appealing with these professional slides. Download Elevating Sales Networks Industry Statistics Associated With Sales Networking SA SS V from Slidegeeks today. This slide outlines key statistics showcasing the effectiveness of sales networking strategies that enable organizations to generate more leads and sales revenue.
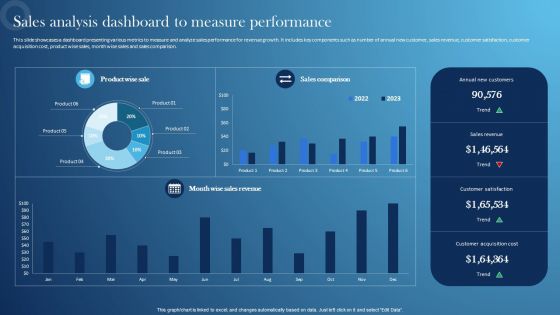
Inspecting Sales Optimization Areas Sales Analysis Dashboard To Measure Performance Demonstration PDF
This slide showcases a dashboard presenting various metrics to measure and analyze sales performance for revenue growth. It includes key components such as number of annual new customer, sales revenue, customer satisfaction, customer acquisition cost, product wise sales, month wise sales and sales comparison. From laying roadmaps to briefing everything in detail, our templates are perfect for you. You can set the stage with your presentation slides. All you have to do is download these easy-to-edit and customizable templates. Inspecting Sales Optimization Areas Sales Analysis Dashboard To Measure Performance Demonstration PDF will help you deliver an outstanding performance that everyone would remember and praise you for. Do download this presentation today.
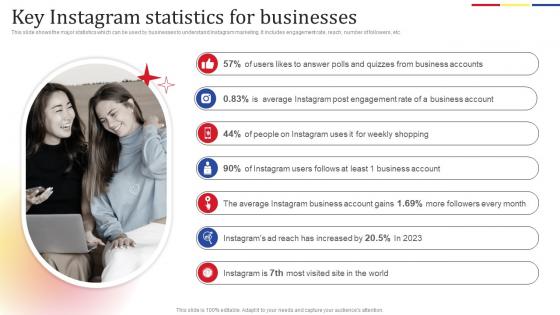
Key Instagram Statistics Social Media Platform Advertising To Enhance Brand Awareness Clipart Pdf
This slide shows the major statistics which can be used by businesses to understand Instagram marketing. It includes engagement rate, reach, number of followers, etc. This Key Instagram Statistics Social Media Platform Advertising To Enhance Brand Awareness Clipart Pdf is perfect for any presentation, be it in front of clients or colleagues. It is a versatile and stylish solution for organizing your meetings. The Key Instagram Statistics Social Media Platform Advertising To Enhance Brand Awareness Clipart Pdf features a modern design for your presentation meetings. The adjustable and customizable slides provide unlimited possibilities for acing up your presentation. Slidegeeks has done all the homework before launching the product for you. So, do not wait, grab the presentation templates today This slide shows the major statistics which can be used by businesses to understand Instagram marketing. It includes engagement rate, reach, number of followers, etc.


 Continue with Email

 Home
Home


