Data Dashboard
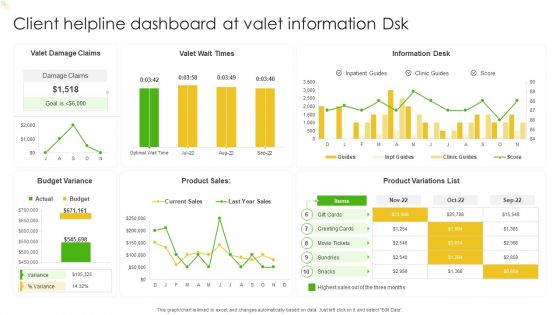
Client Helpline Dashboard At Valet Information Dsk Ppt Gallery Slide Portrait PDF
This graph or chart is linked to excel, and changes automatically based on data. Just left click on it and select Edit Data. Pitch your topic with ease and precision using this Client Helpline Dashboard At Valet Information Dsk Ppt Gallery Slide Portrait PDF. This layout presents information on Valet Damage Claims, Valet Wait Times, Information Desk. It is also available for immediate download and adjustment. So, changes can be made in the color, design, graphics or any other component to create a unique layout.
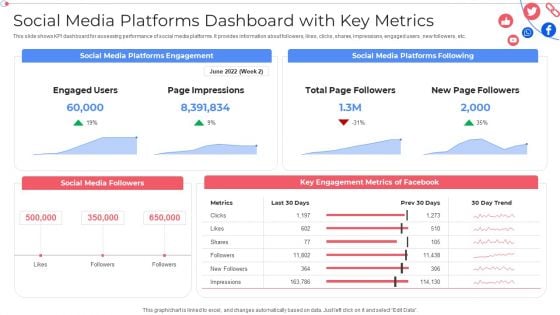
Social Media Platforms Dashboard With Key Metrics Customer Group Engagement Through Social Media Channels Infographics PDF
This slide shows KPI dashboard for assessing performance of social media platforms. It provides information about followers, likes, clicks, shares, impressions, engaged users , new followers, etc. Deliver an awe inspiring pitch with this creative Social Media Platforms Dashboard With Key Metrics Customer Group Engagement Through Social Media Channels Infographics PDF bundle. Topics like Social Media Followers, Key Engagement Metrics can be discussed with this completely editable template. It is available for immediate download depending on the needs and requirements of the user.
KPI Dashboard For Tracking Hospitality And Tourism Management Plan Performance Infographics PDF
This slide shows the KPI dashboard for monitoring the performance of strategy implemented. It covers KPIs such as bookings, location, housekeeping, etc. Pitch your topic with ease and precision using this KPI Dashboard For Tracking Hospitality And Tourism Management Plan Performance Infographics PDF. This layout presents information on Booking Type, Housekeeping, Check In Guest. It is also available for immediate download and adjustment. So, changes can be made in the color, design, graphics or any other component to create a unique layout.
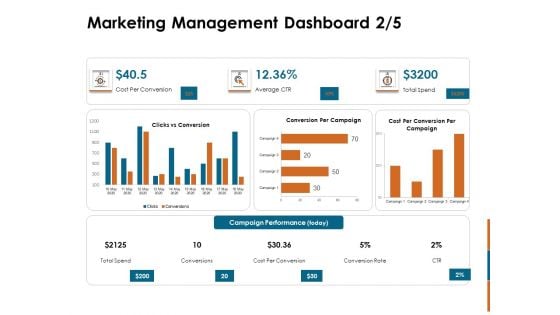
Key Statistics Of Marketing Marketing Management Dashboard Cost Ppt PowerPoint Presentation Infographics Slideshow PDF
Deliver an awe-inspiring pitch with this creative key statistics of marketing marketing management dashboard cost ppt powerpoint presentation infographics slideshow pdf bundle. Topics like cost per conversion, campaign performance, conversion rate, conversions, total speed, average ctr can be discussed with this completely editable template. It is available for immediate download depending on the needs and requirements of the user.
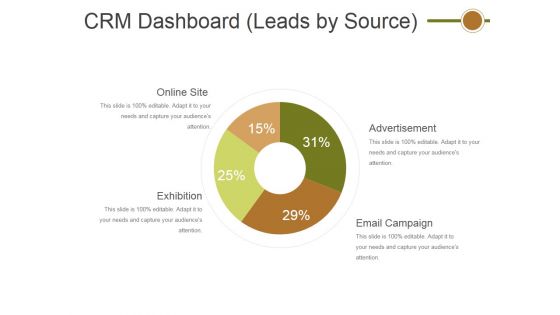
Crm Dashboard Leads By Source Ppt PowerPoint Presentation File Graphics Template
This is a crm dashboard leads by source ppt powerpoint presentation file graphics template. This is a four stage process. The stages in this process are online site, exhibition, advertisement, email campaign.
Construction Management Services And Action Plan KPI Metrics And Dashboard Download PDF
Presenting construction management services and action plan kpi metrics and dashboard download pdf to provide visual cues and insights. Share and navigate important information on two stages that need your due attention. This template can be used to pitch topics like kpi metrics and dashboard. In addtion, this PPT design contains high resolution images, graphics, etc, that are easily editable and available for immediate download.
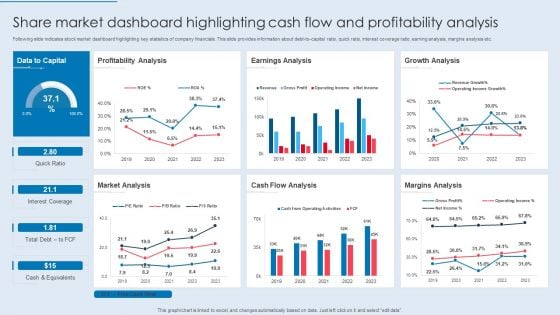
Share Market Dashboard Highlighting Cash Flow And Profitability Analysis Information PDF
Following slide indicates stock market dashboard highlighting key statistics of company financials. This slide provides information about debt-to-capital ratio, quick ratio, interest coverage ratio, earning analysis, margins analysis etc. Showcasing this set of slides titled Share Market Dashboard Highlighting Cash Flow And Profitability Analysis Information PDF. The topics addressed in these templates are Profitability Analysis, Earnings Analysis, Growth Analysis. All the content presented in this PPT design is completely editable. Download it and make adjustments in color, background, font etc. as per your unique business setting.
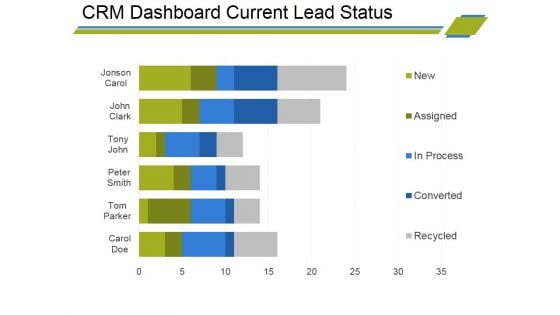
Crm Dashboard Current Lead Status Ppt PowerPoint Presentation Infographic Template Visual Aids
This is a crm dashboard current lead status ppt powerpoint presentation infographic template visual aids. This is a six stage process. The stages in this process are bar graph, finance, marketing, strategy, business, analysis.
Crm Dashboard Deals By Expected Close Date Ppt PowerPoint Presentation Portfolio Icons
This is a crm dashboard deals by expected close date ppt powerpoint presentation portfolio icons. This is a three stage process. The stages in this process are bar graph, finance, marketing, strategy, business, analysis, growth.

Supply Chain Kpi Dashboard Ppt PowerPoint Presentation Complete Deck With Slides
This is a supply chain kpi dashboard ppt powerpoint presentation complete deck with slides. This is a one stage process. The stages in this process are business, strategy, marketing, analysis, business model.
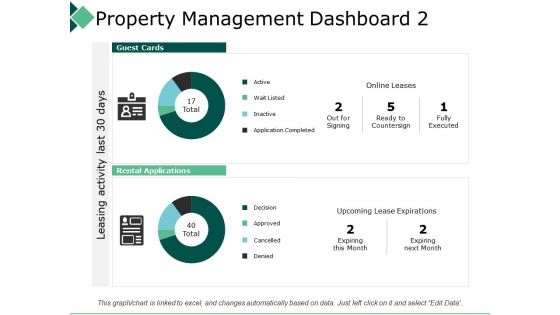
Property Management Dashboard 2 Leasing Activity Ppt PowerPoint Presentation Infographic Template Templates
This is a property management dashboard 2 leasing activity ppt powerpoint presentation infographic template templates. This is a two stage process. The stages in this process are business, management, strategy, analysis, marketing.
Dashboard Low Medium Ppt Powerpoint Presentation Infographics Icons Ppt Powerpoint Presentation Layouts Format
This is a dashboard low medium ppt powerpoint presentation infographics icons ppt powerpoint presentation layouts format. This is a three stage process. The stages in this process are finance, marketing, management, investment, analysis.

Retail KPI Dashboard Showing Revenue Vs Units Sold Ppt PowerPoint Presentation Professional Smartart
This is a retail kpi dashboard showing revenue vs units sold ppt powerpoint presentation professional smartart. This is a four stage process. The stages in this process are finance, analysis, business, investment, marketing.
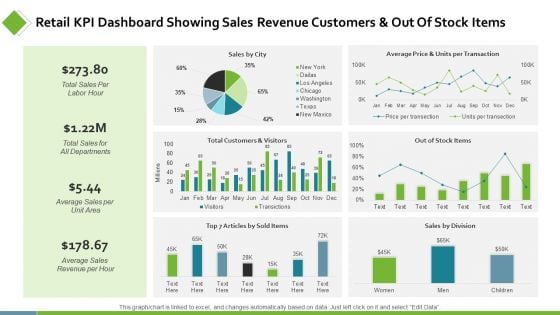
Retail KPI Dashboard Showing Sales Revenue Customers Ppt PowerPoint Presentation Show Background Designs
This is a retail kpi dashboard showing sales revenue customers ppt powerpoint presentation show background designs. This is a six stage process. The stages in this process are finance, analysis, business, investment, marketing.
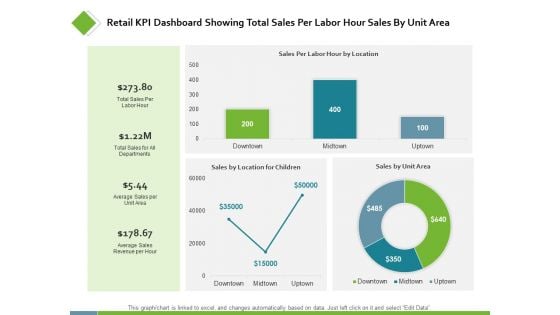
Retail KPI Dashboard Showing Total Sales Per Labor Ppt PowerPoint Presentation Styles Examples
This is a retail kpi dashboard showing total sales per labor ppt powerpoint presentation styles examples. This is a three stage process. The stages in this process are finance, analysis, business, investment, marketing.
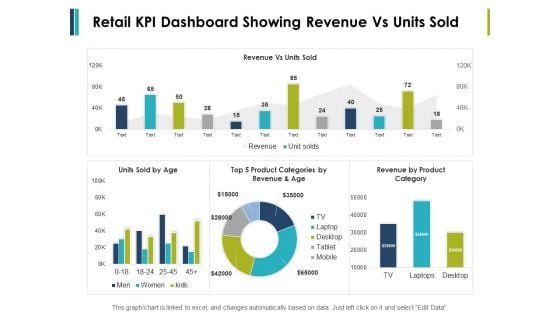
Retail Kpi Dashboard Showing Revenue Vs Units Sold Ppt PowerPoint Presentation File Formats
This is a retail kpi dashboard showing revenue vs units sold ppt powerpoint presentation file formats. This is a three stage process. The stages in this process are finance, marketing, management, investment, analysis.

Project Management Monthly Growth Dashboard Marketing Ppt PowerPoint Presentation Model Slide Download
This is a project management monthly growth dashboard marketing ppt powerpoint presentation model slide download. This is a four stage process. The stages in this process are finance, marketing, management, investment, analysis.
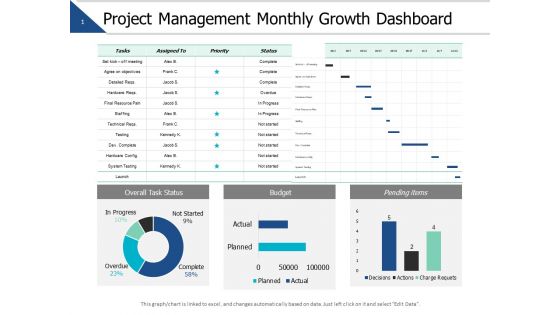
Project Management Monthly Growth Dashboard Ppt PowerPoint Presentation Slides Master Slide
This is a project management monthly growth dashboard ppt powerpoint presentation slides master slide. This is a three stage process. The stages in this process are finance, marketing, management, investment, analysis.
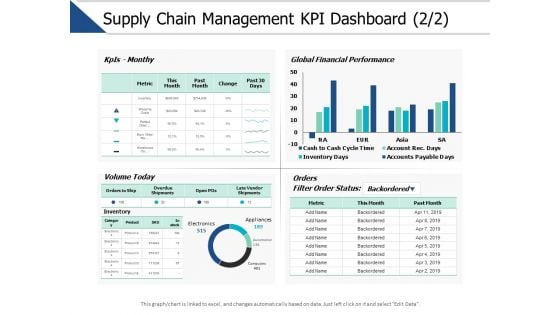
Supply Chain Management Kpi Dashboard Marketing Ppt PowerPoint Presentation File Tips
This is a supply chain management kpi dashboard marketing ppt powerpoint presentation file tips. This is a three stage process. The stages in this process are finance, marketing, management, investment, analysis.
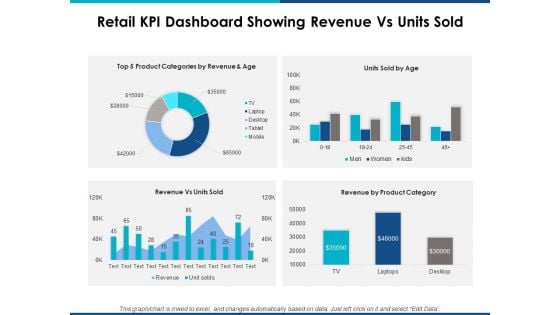
Retail Kpi Dashboard Showing Revenue Vs Units Sold Ppt Powerpoint Presentation Layouts Show
This is a retail kpi dashboard showing revenue vs units sold ppt powerpoint presentation layouts show. This is a four stage process. The stages in this process are finance, marketing, management, investment, analysis.
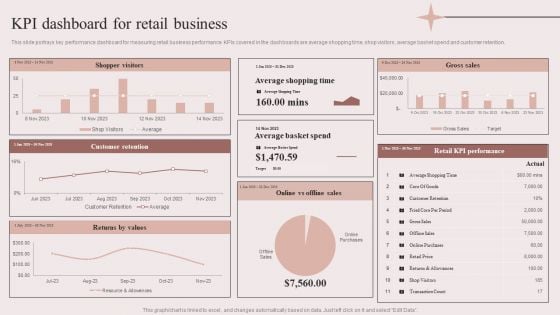
Enhancing Retail Process By Effective Inventory Management KPI Dashboard For Retail Business Inspiration PDF
This slide portrays key performance dashboard for measuring retail business performance. KPIs covered in the dashboards are average shopping time, shop visitors, average basket spend and customer retention. If you are looking for a format to display your unique thoughts, then the professionally designed Enhancing Retail Process By Effective Inventory Management KPI Dashboard For Retail Business Inspiration PDF is the one for you. You can use it as a Google Slides template or a PowerPoint template. Incorporate impressive visuals, symbols, images, and other charts. Modify or reorganize the text boxes as you desire. Experiment with shade schemes and font pairings. Alter, share or cooperate with other people on your work. Download Enhancing Retail Process By Effective Inventory Management KPI Dashboard For Retail Business Inspiration PDF and find out how to give a successful presentation. Present a perfect display to your team and make your presentation unforgettable.
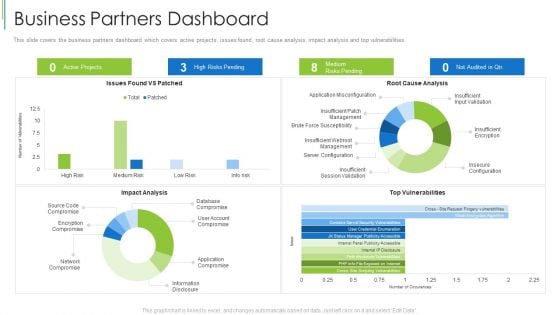
Business Partners Dashboard Effective Partnership Administration With Clients Channel And Corporate Partners Guidelines PDF
This slide covers the business partners dashboard which covers active projects, issues found, root cause analysis, impact analysis and top vulnerabilities. Deliver an awe inspiring pitch with this creative business partners dashboard effective partnership administration with clients channel and corporate partners guidelines pdf bundle. Topics like impact analysis, vulnerabilities, root cause analysis can be discussed with this completely editable template. It is available for immediate download depending on the needs and requirements of the user.
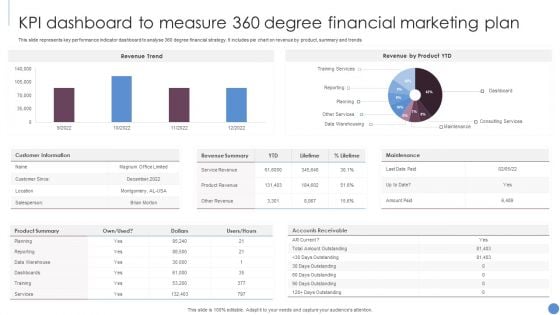
KPI Dashboard To Measure 360 Degree Financial Marketing Plan Slides PDF
This slide represents key performance indicator dashboard to analyse 360 degree financial strategy. It includes pie chart on revenue by product, summary and trends. Showcasing this set of slides titled KPI Dashboard To Measure 360 Degree Financial Marketing Plan Slides PDF. The topics addressed in these templates are Revenue Trend, Revenue Product YTD, Customer Information. All the content presented in this PPT design is completely editable. Download it and make adjustments in color, background, font etc. as per your unique business setting.
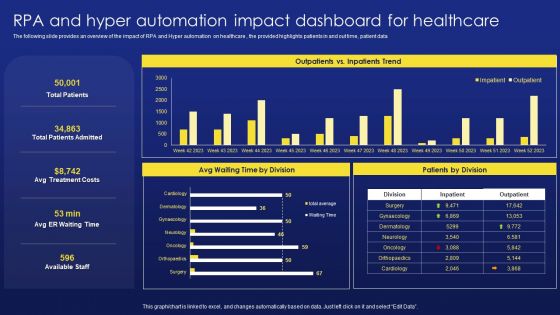
Deployment Procedure Of Hyper Automation RPA And Hyper Automation Impact Dashboard For Healthcare Formats PDF
The following slide provides an overview of the impact of RPA and Hyper automation on healthcare , the provided highlights patients in and out time, patient data. There are so many reasons you need a Deployment Procedure Of Hyper Automation RPA And Hyper Automation Impact Dashboard For Healthcare Formats PDF. The first reason is you can not spend time making everything from scratch, Thus, Slidegeeks has made presentation templates for you too. You can easily download these templates from our website easily.
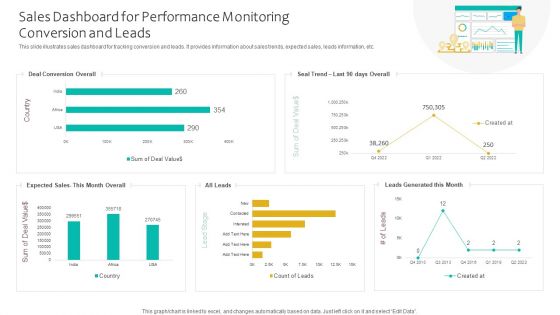
Sales Dashboard For Performance Monitoring Conversion And Leads Ppt Infographics Smartart PDF
This slide illustrates sales dashboard for tracking conversion and leads. It provides information about sales trends, expected sales, leads information, etc. Showcasing this set of slides titled Sales Dashboard For Performance Monitoring Conversion And Leads Ppt Infographics Smartart PDF. The topics addressed in these templates are Deal Conversion Overall, Expected Sales, Leads Generated. All the content presented in this PPT design is completely editable. Download it and make adjustments in color, background, font etc. as per your unique business setting.
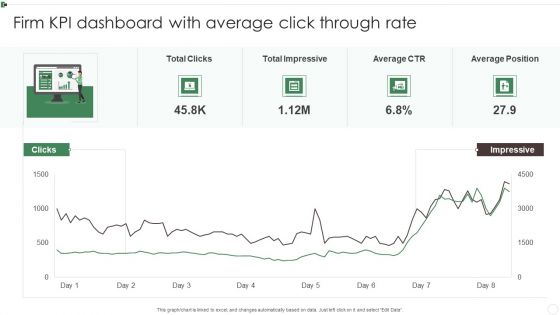
Firm KPI Dashboard With Average Click Through Rate Ppt Inspiration Sample PDF
This graph or chart is linked to excel, and changes automatically based on data. Just left click on it and select Edit Data. Pitch your topic with ease and precision using this Firm KPI Dashboard With Average Click Through Rate Ppt Inspiration Sample PDF. This layout presents information on Total Clicks, Total Impressive, Average CTR, Average Position. It is also available for immediate download and adjustment. So, changes can be made in the color, design, graphics or any other component to create a unique layout.

Firm KPI Dashboard With Schedule Performance Index Ppt Visual Aids PDF
This graph or chart is linked to excel, and changes automatically based on data. Just left click on it and select Edit Data. Pitch your topic with ease and precision using this Firm KPI Dashboard With Schedule Performance Index Ppt Visual Aids PDF. This layout presents information on Project Cost Performance, Project Planning Stage, Monitor And Control. It is also available for immediate download and adjustment. So, changes can be made in the color, design, graphics or any other component to create a unique layout.
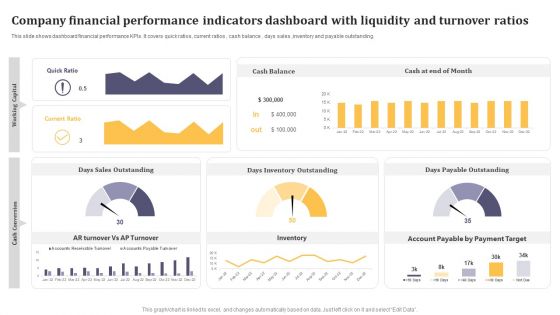
Company Financial Performance Indicators Dashboard With Liquidity And Turnover Ratios Formats PDF
This graph or chart is linked to excel, and changes automatically based on data. Just left click on it and select Edit Data. Pitch your topic with ease and precision using this Company Financial Performance Indicators Dashboard With Liquidity And Turnover Ratios Formats PDF. This layout presents information on Cash Balance, Days Inventory Outstanding, Days Payable Outstanding. It is also available for immediate download and adjustment. So, changes can be made in the color, design, graphics or any other component to create a unique layout.
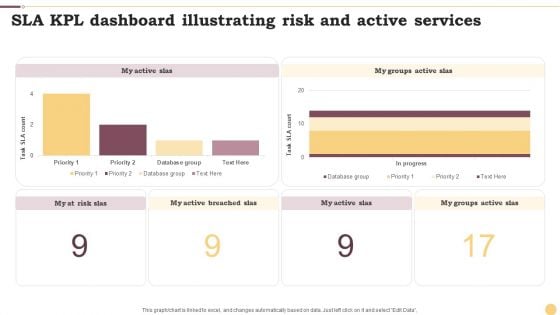
SLA KPL Dashboard Illustrating Risk And Active Services Ppt Portfolio Design Inspiration PDF
This graph or chart is linked to excel, and changes automatically based on data. Just left click on it and select Edit Data. Pitch your topic with ease and precision using this SLA KPL Dashboard Illustrating Risk And Active Services Ppt Portfolio Design Inspiration PDF. This layout presents information on My Active SLAs, Database Group, Priority. It is also available for immediate download and adjustment. So, changes can be made in the color, design, graphics or any other component to create a unique layout.
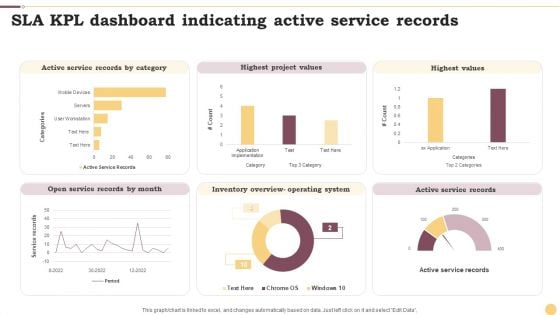
SLA KPL Dashboard Indicating Active Service Records Ppt Professional Graphics Example PDF
This graph or chart is linked to excel, and changes automatically based on data. Just left click on it and select Edit Data. Pitch your topic with ease and precision using this SLA KPL Dashboard Indicating Active Service Records Ppt Professional Graphics Example PDF. This layout presents information on Active Service Records, Highest Project Values, Highest Values. It is also available for immediate download and adjustment. So, changes can be made in the color, design, graphics or any other component to create a unique layout.
Cloud Security KPI Dashboard With Key Statistics Ppt Icon Examples PDF
Pitch your topic with ease and precision using this Cloud Security KPI Dashboard With Key Statistics Ppt Icon Examples PDF. This layout presents information on Compliance Trend, Risk Status, Risk Severity. It is also available for immediate download and adjustment. So, changes can be made in the color, design, graphics or any other component to create a unique layout.
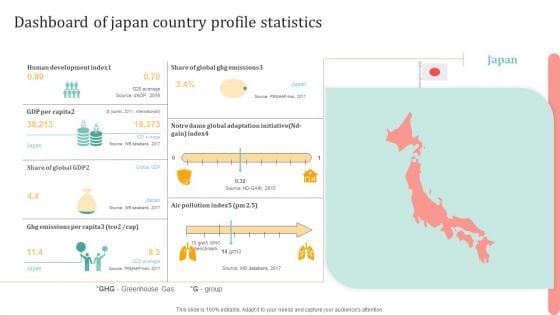
Dashboard Of Japan Country Profile Statistics Ppt Styles Infographic Template PDF
Presenting Dashboard Of Japan Country Profile Statistics Ppt Styles Infographic Template PDF to dispense important information. This template comprises one stages. It also presents valuable insights into the topics including Share Global GDP, Ghg Emissions, Per Capital. This is a completely customizable PowerPoint theme that can be put to use immediately. So, download it and address the topic impactfully.
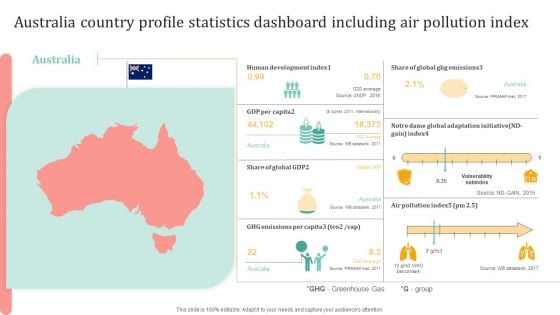
Australia Country Profile Statistics Dashboard Including Air Pollution Index Professional PDF
Presenting Australia Country Profile Statistics Dashboard Including Air Pollution Index Professional PDF to dispense important information. This template comprises one stages. It also presents valuable insights into the topics including Global Ghg Emissions, Human Development Index, GDP Per Capita. This is a completely customizable PowerPoint theme that can be put to use immediately. So, download it and address the topic impactfully.
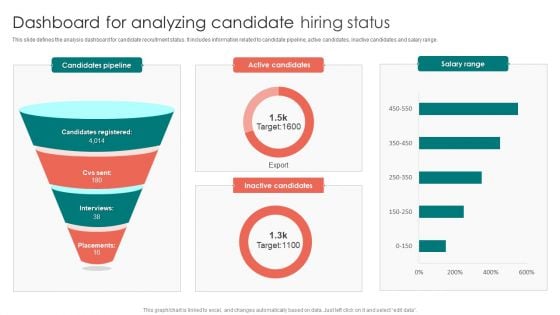
Dashboard For Analyzing Candidate Hiring Status Ppt PowerPoint Presentation File Tips PDF
This slide defines the analysis dashboard for candidate recruitment status. It includes information related to candidate pipeline, active candidates, inactive candidates and salary range. Showcasing this set of slides titled Dashboard For Analyzing Candidate Hiring Status Ppt PowerPoint Presentation File Tips PDF. The topics addressed in these templates are Candidates Pipeline, Active Candidates, Salary Range. All the content presented in this PPT design is completely editable. Download it and make adjustments in color, background, font etc. as per your unique business setting.
Market Penetration Dashboard With Population Metrics Ppt Icon Graphics Design PDF
This slide shows market penetration dashboard with key demographics. It provides information about census population, per capita income, leads to be penetrated and footfall. Showcasing this set of slides titled Market Penetration Dashboard With Population Metrics Ppt Icon Graphics Design PDF. The topics addressed in these templates are Census Population, Per Capita Income, Footfall. All the content presented in this PPT design is completely editable. Download it and make adjustments in color, background, font etc. as per your unique business setting.
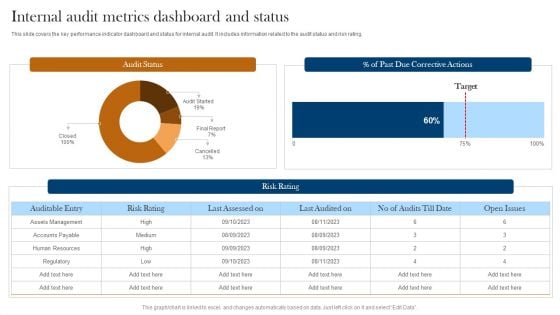
Internal Audit Metrics Dashboard And Status Ppt Layouts Graphic Images PDF
This slide covers the key performance indicator dashboard and status for internal audit. It includes information related to the audit status and risk rating. Pitch your topic with ease and precision using this Internal Audit Metrics Dashboard And Status Ppt Layouts Graphic Images PDF. This layout presents information on Audit Status, Risk Rating, Auditable Entry. It is also available for immediate download and adjustment. So, changes can be made in the color, design, graphics or any other component to create a unique layout.
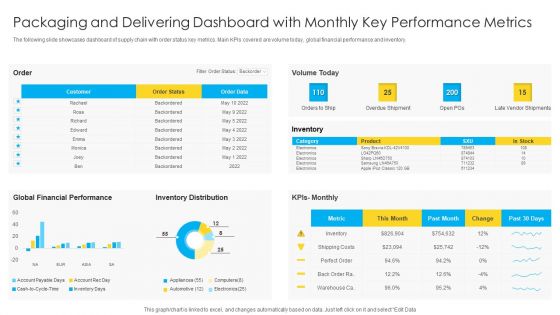
Packaging And Delivering Dashboard With Monthly Key Performance Metrics Microsoft PDF
The following slide showcases dashboard of supply chain with order status key metrics. Main KPIs covered are volume today, global financial performance and inventory. Pitch your topic with ease and precision using this Packaging And Delivering Dashboard With Monthly Key Performance Metrics Microsoft PDF. This layout presents information on Customer, Global Financial Performance, Inventory Distribution. It is also available for immediate download and adjustment. So, changes can be made in the color, design, graphics or any other component to create a unique layout.
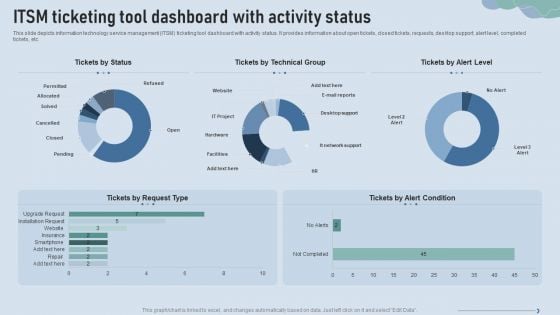
Improve IT Service Desk ITSM Ticketing Tool Dashboard With Activity Status Brochure PDF
This slide depicts information technology service management ITSM ticketing tool dashboard with activity status. It provides information about open tickets, closed tickets, requests, desktop support, alert level, completed tickets, etc. Deliver an awe inspiring pitch with this creative Improve IT Service Desk ITSM Ticketing Tool Dashboard With Activity Status Brochure PDF bundle. Topics like Alert Condition, Installation Request, Upgrade Request can be discussed with this completely editable template. It is available for immediate download depending on the needs and requirements of the user.
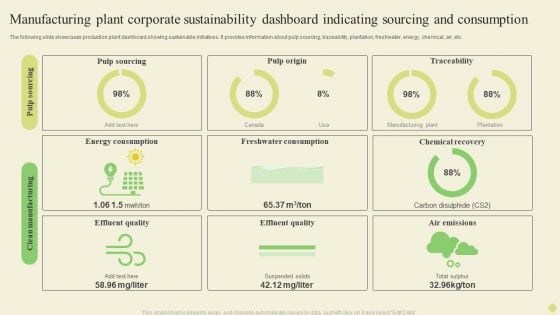
Manufacturing Plant Corporate Sustainability Dashboard Indicating Sourcing And Consumption Infographics PDF
The following slide showcases business sustainability dashboard highlighting multiple sources of technology. It provides information about renewable energy, plant age, solar, wind, biomass, regionality, etc.Pitch your topic with ease and precision using this Manufacturing Plant Corporate Sustainability Dashboard Indicating Sourcing And Consumption Infographics PDF. This layout presents information on Energy Consumption, Freshwater Consumption, Chemical Recovery. It is also available for immediate download and adjustment. So, changes can be made in the color, design, graphics or any other component to create a unique layout.
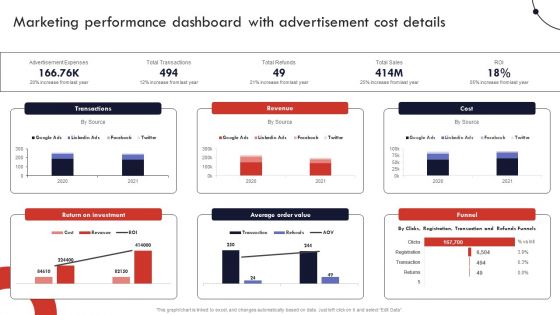
Product And Services Promotion Marketing Performance Dashboard With Advertisement Graphics PDF
This graph or chart is linked to excel, and changes automatically based on data. Just left click on it and select Edit Data. Slidegeeks is here to make your presentations a breeze with Product And Services Promotion Marketing Performance Dashboard With Advertisement Graphics PDF With our easy-to-use and customizable templates, you can focus on delivering your ideas rather than worrying about formatting. With a variety of designs to choose from, youre sure to find one that suits your needs. And with animations and unique photos, illustrations, and fonts, you can make your presentation pop. So whether youre giving a sales pitch or presenting to the board, make sure to check out Slidegeeks first.
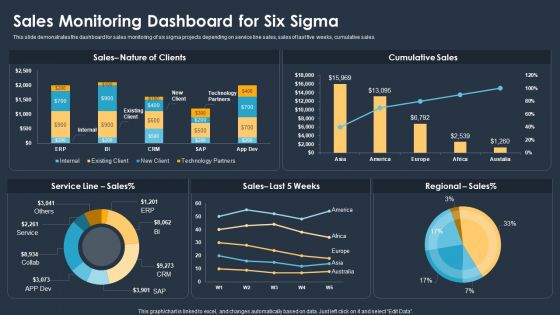
Six Sigma Methodologies For Process Optimization Sales Monitoring Dashboard For Six Sigma Elements PDF
This slide demonstrates the dashboard for sales monitoring of six sigma projects depending on service line sales, sales of last five weeks, cumulative sales. Showcasing this set of slides titled Six Sigma Methodologies For Process Optimization Sales Monitoring Dashboard For Six Sigma Elements PDF. The topics addressed in these templates are Sales, Service Line, Technology Partners. All the content presented in this PPT design is completely editable. Download it and make adjustments in color, background, font etc. as per your unique business setting.
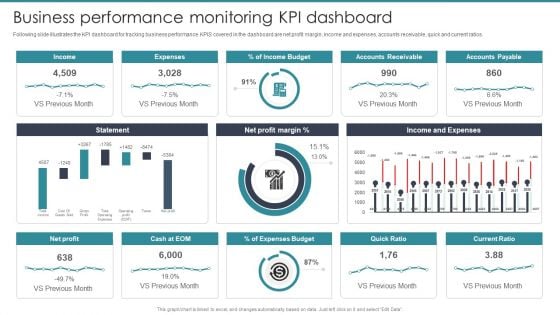
Guide To Mergers And Acquisitions Business Performance Monitoring KPI Dashboard Designs PDF
Following slide illustrates the KPI dashboard for tracking business performance. KPIS covered in the dashboard are net profit margin, income and expenses, accounts receivable, quick and current ratios. Here you can discover an assortment of the finest PowerPoint and Google Slides templates. With these templates, you can create presentations for a variety of purposes while simultaneously providing your audience with an eye catching visual experience. Download Guide To Mergers And Acquisitions Business Performance Monitoring KPI Dashboard Designs PDF to deliver an impeccable presentation. These templates will make your job of preparing presentations much quicker, yet still, maintain a high level of quality. Slidegeeks has experienced researchers who prepare these templates and write high quality content for you. Later on, you can personalize the content by editing the Guide To Mergers And Acquisitions Business Performance Monitoring KPI Dashboard Designs PDF.
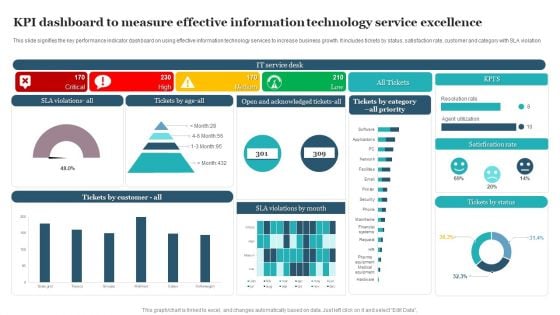
KPI Dashboard To Measure Effective Information Technology Service Excellence Information PDF
This slide signifies the key performance indicator dashboard on using effective information technology services to increase business growth. It includes tickets by status, satisfaction rate, customer and category with SLA violation. Showcasing this set of slides titled KPI Dashboard To Measure Effective Information Technology Service Excellence Information PDF. The topics addressed in these templates are Satisfication Rate, Tickets Status, Service Desk. All the content presented in this PPT design is completely editable. Download it and make adjustments in color, background, font etc. as per your unique business setting.
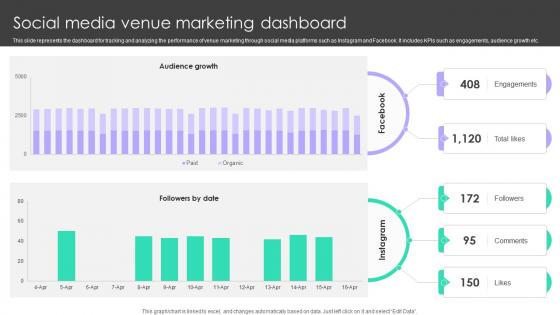
Online Venue Advertising Plan Social Media Venue Marketing Dashboard Strategy SS V
This slide represents the dashboard for tracking and analyzing the performance of venue marketing through social media platforms such as Instagram and Facebook. It includes KPIs such as engagements, audience growth etc. Explore a selection of the finest Online Venue Advertising Plan Social Media Venue Marketing Dashboard Strategy SS V here. With a plethora of professionally designed and pre-made slide templates, you can quickly and easily find the right one for your upcoming presentation. You can use our Online Venue Advertising Plan Social Media Venue Marketing Dashboard Strategy SS V to effectively convey your message to a wider audience. Slidegeeks has done a lot of research before preparing these presentation templates. The content can be personalized and the slides are highly editable. Grab templates today from Slidegeeks. This slide represents the dashboard for tracking and analyzing the performance of venue marketing through social media platforms such as Instagram and Facebook. It includes KPIs such as engagements, audience growth etc.
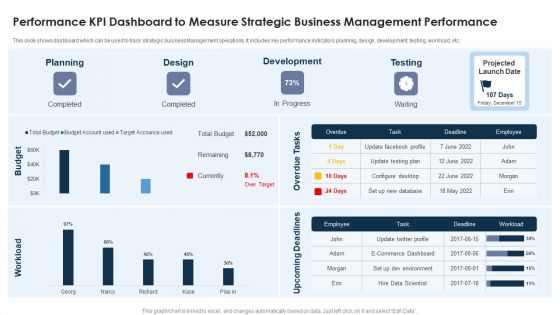
Performance KPI Dashboard To Measure Strategic Business Management Performance Pictures PDF
This slide shows dashboard which can be used to track strategic business Management operations. It includes key performance indicators planning, design, development, testing, workload, etc.Showcasing this set of slides titled Performance KPI Dashboard To Measure Strategic Business Management Performance Pictures PDF The topics addressed in these templates are Development, Projected Launch, Planning All the content presented in this PPT design is completely editable. Download it and make adjustments in color, background, font etc. as per your unique business setting.

Asset Assessment Dashboard With Cash Flow And Market Value Summary PDF
This slide illustrates asset valuation dashboard with key financial metrics. It provides information about cash flow, market value, intrinsic value, assumptions, market cap, discount rate, etc.Showcasing this set of slides titled Asset Assessment Dashboard With Cash Flow And Market Value Summary PDF. The topics addressed in these templates are Discount Rate, Capital Expenditure, Market Capitalization. All the content presented in this PPT design is completely editable. Download it and make adjustments in color, background, font etc. as per your unique business setting.
HR Recruitment Dashboard Kpis With Active Pipeline Ppt Icon Slide Portrait PDF
This slide showcases the recruitment dashboard metrics to know monthly hiring rate. It include KPIs like sources, decline reasons, active pipeline, recruitment funnel. Showcasing this set of slides titled HR Recruitment Dashboard Kpis With Active Pipeline Ppt Icon Slide Portrait PDF. The topics addressed in these templates are Recruitment Funnel, Monthly Metrics, Application Sources. All the content presented in this PPT design is completely editable. Download it and make adjustments in color, background, font etc. as per your unique business setting.
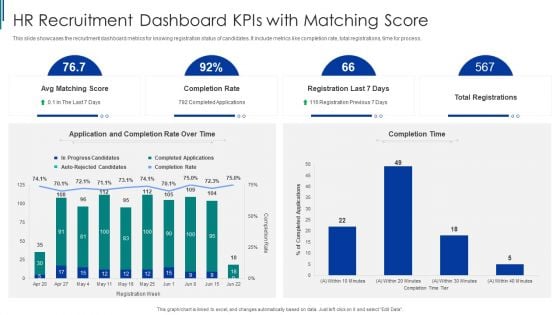
HR Recruitment Dashboard Kpis With Matching Score Ppt Layouts Example PDF
This slide showcases the recruitment dashboard metrics for knowing registration status of candidates. It include metrics like completion rate, total registrations, time for process. Showcasing this set of slides titled HR Recruitment Dashboard Kpis With Matching Score Ppt Layouts Example PDF. The topics addressed in these templates are Completion Rate, Application And Completion, HR Recruitment. All the content presented in this PPT design is completely editable. Download it and make adjustments in color, background, font etc. as per your unique business setting.
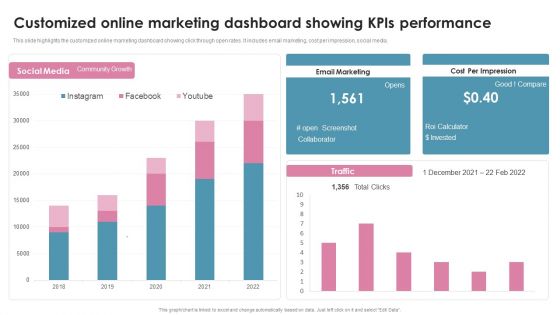
Customized Online Marketing Dashboard Showing Kpis Performance Ppt Portfolio Guidelines PDF
This slide highlights the customized online marketing dashboard showing click through open rates. It includes email marketing, cost per impression, social media. Showcasing this set of slides titled Customized Online Marketing Dashboard Showing Kpis Performance Ppt Portfolio Guidelines PDF. The topics addressed in these templates are Email Marketing, Cost Per Impression, ROI Calculator. All the content presented in this PPT design is completely editable. Download it and make adjustments in color, background, font etc. as per your unique business setting.
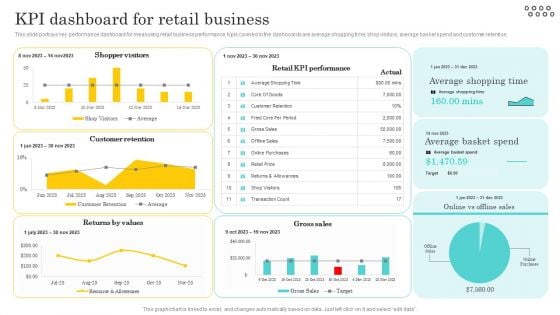
Optimizing And Managing Retail Kpi Dashboard For Retail Business Clipart PDF
This slide portrays key performance dashboard for measuring retail business performance. Kpis covered in the dashboards are average shopping time, shop visitors, average basket spend and customer retention. Explore a selection of the finest Optimizing And Managing Retail Kpi Dashboard For Retail Business Clipart PDF here. With a plethora of professionally designed and pre-made slide templates, you can quickly and easily find the right one for your upcoming presentation. You can use our Optimizing And Managing Retail Kpi Dashboard For Retail Business Clipart PDF to effectively convey your message to a wider audience. Slidegeeks has done a lot of research before preparing these presentation templates. The content can be personalized and the slides are highly editable. Grab templates today from Slidegeeks.
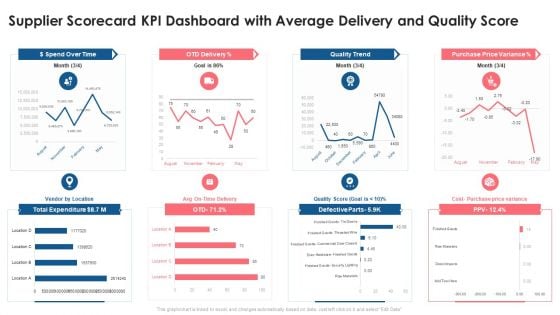
Supplier Scorecard Supplier Scorecard KPI Dashboard With Average Delivery And Quality Score Introduction PDF
This graph or chart is linked to excel, and changes automatically based on data. Just left click on it and select Edit Data. Deliver an awe inspiring pitch with this creative supplier scorecard supplier scorecard kpi dashboard with average delivery and quality score introduction pdf bundle. Topics like dollar spend over time, otd delivery, quality trend, purchase price variance, total expenditure can be discussed with this completely editable template. It is available for immediate download depending on the needs and requirements of the user.
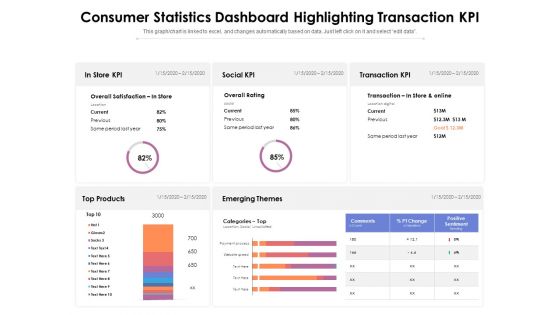
Consumer Statistics Dashboard Highlighting Transaction KPI Ppt PowerPoint Presentation Gallery Graphics Design PDF
Presenting this set of slides with name consumer statistics dashboard highlighting transaction kpi ppt powerpoint presentation gallery graphics design pdf. The topics discussed in these slides are transaction, social, process. This is a completely editable PowerPoint presentation and is available for immediate download. Download now and impress your audience.
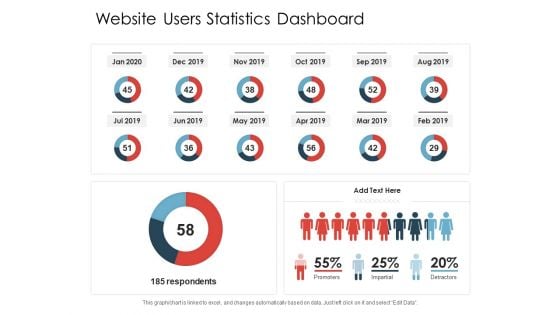
Website Users Statistics Dashboard Ppt PowerPoint Presentation Gallery Design Inspiration PDF
Presenting this set of slides with name website users statistics dashboard ppt powerpoint presentation gallery design inspiration pdf. The topics discussed in these slides are promoters, impartial, detractors. This is a completely editable PowerPoint presentation and is available for immediate download. Download now and impress your audience.

Employee Statistics Dashboard With Satisfaction Survey Result Ppt PowerPoint Presentation Portfolio Slide Download PDF
Presenting this set of slides with name employee statistics dashboard with satisfaction survey result ppt powerpoint presentation portfolio slide download pdf. The topics discussed in these slides are satisfaction survey result, employee age breakdown, employee turnover rate, employee absenteeism, employee status, employee gender split. This is a completely editable PowerPoint presentation and is available for immediate download. Download now and impress your audience.
Key Statistics Of Marketing Marketing Management Dashboard Customers Ppt PowerPoint Presentation Icon Microsoft PDF
Deliver an awe-inspiring pitch with this key statistics of marketing marketing management dashboard customers ppt powerpoint presentation icon microsoft pdf bundle. Topics like active customers, solid units, total revenue, net profit, customers region, new customer signups can be discussed with this completely editable template. It is available for immediate download depending on the needs and requirements of the user.
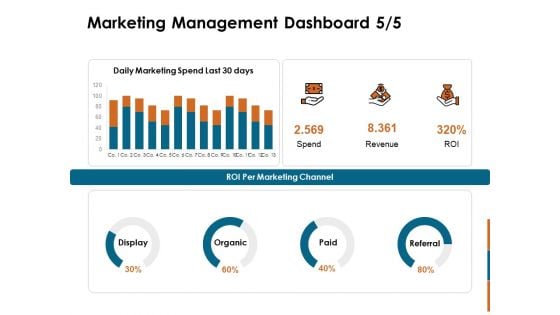
Key Statistics Of Marketing Marketing Management Dashboard Spend Ppt PowerPoint Presentation Portfolio Slide Portrait PDF
Deliver an awe-inspiring pitch with this creative key statistics of marketing marketing management dashboard spend ppt powerpoint presentation portfolio slide portrait pdf bundle. Topics like display, organic, paid, referral, roi per marketing channel, spend, revenue, roi can be discussed with this completely editable template. It is available for immediate download depending on the needs and requirements of the user.
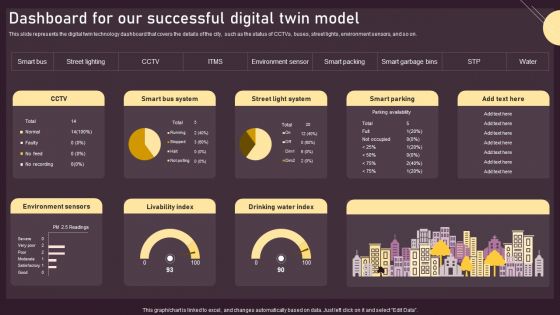
Dashboard For Our Successful Digital Twin Model Ppt PowerPoint Presentation Diagram Templates PDF
This slide represents the digital twin technology dashboard that covers the details of the city, such as the status of CCTVs, buses, street lights, environment sensors, and so on. Presenting this PowerPoint presentation, titled Dashboard For Our Successful Digital Twin Model Ppt PowerPoint Presentation Diagram Templates PDF, with topics curated by our researchers after extensive research. This editable presentation is available for immediate download and provides attractive features when used. Download now and captivate your audience. Presenting this Dashboard For Our Successful Digital Twin Model Ppt PowerPoint Presentation Diagram Templates PDF. Our researchers have carefully researched and created these slides with all aspects taken into consideration. This is a completely customizable Dashboard For Our Successful Digital Twin Model Ppt PowerPoint Presentation Diagram Templates PDF that is available for immediate downloading. Download now and make an impact on your audience. Highlight the attractive features available with our PPTs.
Comprehensive Promotion Guidelines To Administer Brand Overall Brand Performance Tracking Dashboard Mockup PDF
This slide provides information regarding brand performance tracking dashboard capturing KPIs such as brand metric, brand commitment, advertising metrics, and purchase metrics. Presenting this PowerPoint presentation, titled Comprehensive Promotion Guidelines To Administer Brand Overall Brand Performance Tracking Dashboard Mockup PDF, with topics curated by our researchers after extensive research. This editable presentation is available for immediate download and provides attractive features when used. Download now and captivate your audience. Presenting this Comprehensive Promotion Guidelines To Administer Brand Overall Brand Performance Tracking Dashboard Mockup PDF. Our researchers have carefully researched and created these slides with all aspects taken into consideration. This is a completely customizable Comprehensive Promotion Guidelines To Administer Brand Overall Brand Performance Tracking Dashboard Mockup PDF that is available for immediate downloading. Download now and make an impact on your audience. Highlight the attractive features available with our PPTs.
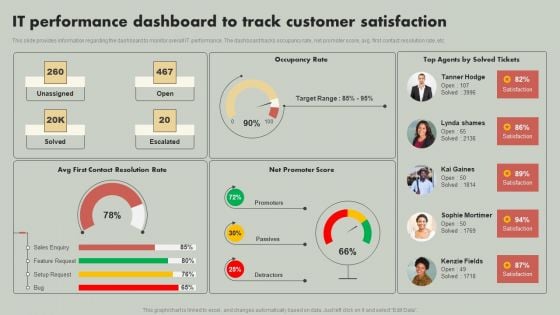
IT Reducing Costs And Management Tips IT Performance Dashboard To Track Customer Satisfaction Graphics PDF
This slide provides information regarding the dashboard to monitor overall IT performance. The dashboard tracks occupancy rate, net promoter score, avg. first contact resolution rate, etc. Formulating a presentation can take up a lot of effort and time, so the content and message should always be the primary focus. The visuals of the PowerPoint can enhance the presenters message, so our IT Reducing Costs And Management Tips IT Performance Dashboard To Track Customer Satisfaction Graphics PDF was created to help save time. Instead of worrying about the design, the presenter can concentrate on the message while our designers work on creating the ideal templates for whatever situation is needed. Slidegeeks has experts for everything from amazing designs to valuable content, we have put everything into IT Reducing Costs And Management Tips IT Performance Dashboard To Track Customer Satisfaction Graphics PDF
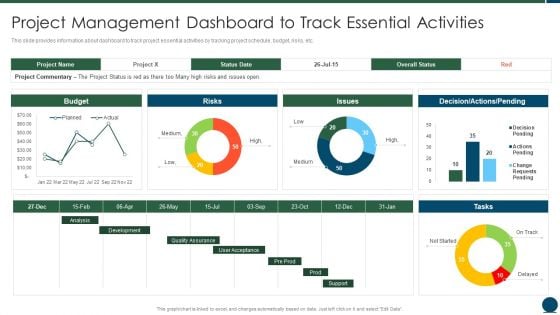
Project Scope Management Playbook Project Management Dashboard To Track Essential Activities Background PDF
This slide provides information about dashboard to track project essential activities by tracking project schedule, budget, risks, etc. Deliver an awe inspiring pitch with this creative Project Scope Management Playbook Project Management Dashboard To Track Essential Activities Background PDF bundle. Topics like Quality Assurance, Development, Analysis can be discussed with this completely editable template. It is available for immediate download depending on the needs and requirements of the user.


 Continue with Email

 Home
Home


