Data Gap Analysis

Global Data Security Industry Report Law And Regulations Governing Cybersecurity Industry IR SS V
The slide provides a comprehensive overview of the rules and regulations governing the cybersecurity industry. The slide aims to inform stakeholders regarding the laws in different countries such as USA, Europe, China And UK. Formulating a presentation can take up a lot of effort and time, so the content and message should always be the primary focus. The visuals of the PowerPoint can enhance the presenters message, so our Global Data Security Industry Report Law And Regulations Governing Cybersecurity Industry IR SS V was created to help save time. Instead of worrying about the design, the presenter can concentrate on the message while our designers work on creating the ideal templates for whatever situation is needed. Slidegeeks has experts for everything from amazing designs to valuable content, we have put everything into Global Data Security Industry Report Law And Regulations Governing Cybersecurity Industry IR SS V The slide provides a comprehensive overview of the rules and regulations governing the cybersecurity industry. The slide aims to inform stakeholders regarding the laws in different countries such as USA, Europe, China And UK.
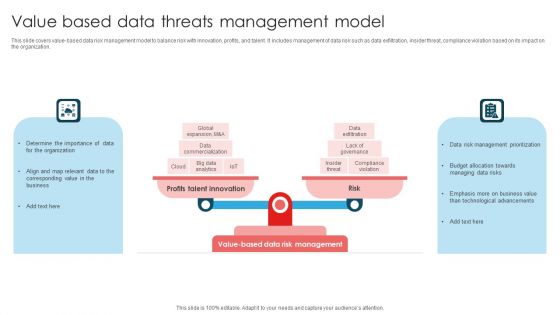
Value Based Data Threats Management Model Ppt Layouts Clipart Images PDF
This slide covers value-based data risk management model to balance risk with innovation, profits, and talent. It includes management of data risk such as data exfiltration, insider threat, compliance violation based on its impact on the organization. Presenting Value Based Data Threats Management Model Ppt Layouts Clipart Images PDF to dispense important information. This template comprises TWO stages. It also presents valuable insights into the topics including Profits Talent Innovation, Risk, Value Based, Data Risk Management. This is a completely customizable PowerPoint theme that can be put to use immediately. So, download it and address the topic impactfully.
Enhanced Sensing Technologies Sweat Biomedical Data Science And Health Informatics Icons Pdf
This slide depicts the enhanced sensing technologies such as sweat detection that examine biomarkers extracted from a persons sweat. The Sweatronics is a wearable device that can detect on body sweat as well as gathers sweating in a nickel sized region. Welcome to our selection of the Enhanced Sensing Technologies Sweat Biomedical Data Science And Health Informatics Icons Pdf. These are designed to help you showcase your creativity and bring your sphere to life. Planning and Innovation are essential for any business that is just starting out. This collection contains the designs that you need for your everyday presentations. All of our PowerPoints are 100 percent editable, so you can customize them to suit your needs. This multi purpose template can be used in various situations. Grab these presentation templates today This slide depicts the enhanced sensing technologies such as sweat detection that examine biomarkers extracted from a persons sweat. The Sweatronics is a wearable device that can detect on body sweat as well as gathers sweating in a nickel sized region.
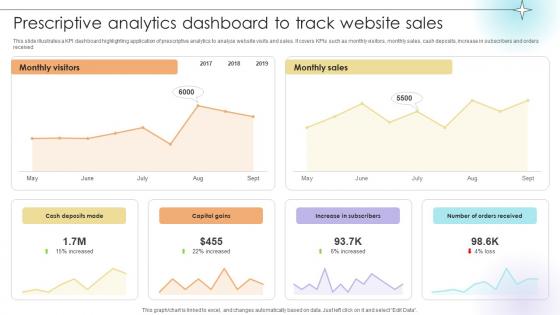
Prescriptive Analytics Dashboard To Track Website Sales Data Analytics SS V
This slide illustrates a KPI dashboard highlighting application of prescriptive analytics to analyze website visits and sales. It covers KPIs such as monthly visitors, monthly sales, cash deposits, increase in subscribers and orders received.This modern and well-arranged Prescriptive Analytics Dashboard To Track Website Sales Data Analytics SS V provides lots of creative possibilities. It is very simple to customize and edit with the Powerpoint Software. Just drag and drop your pictures into the shapes. All facets of this template can be edited with Powerpoint, no extra software is necessary. Add your own material, put your images in the places assigned for them, adjust the colors, and then you can show your slides to the world, with an animated slide included. This slide illustrates a KPI dashboard highlighting application of prescriptive analytics to analyze website visits and sales. It covers KPIs such as monthly visitors, monthly sales, cash deposits, increase in subscribers and orders received.
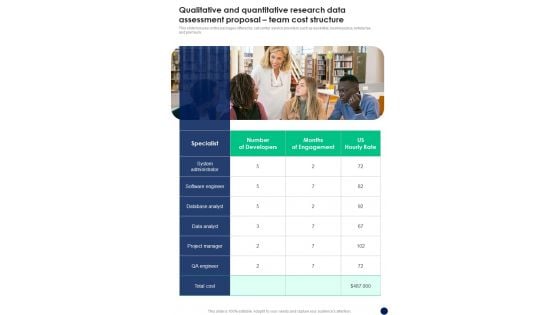
Qualitative And Quantitative Research Data Assessment Proposal Team Cost Structure One Pager Sample Example Document
This slide focuses on the packages offered by call center service providers such as essential, business plus, enterprise, and premium. Presenting you an exemplary Qualitative And Quantitative Research Data Assessment Proposal Team Cost Structure One Pager Sample Example Document. Our one pager comprises all the must have essentials of an inclusive document. You can edit it with ease, as its layout is completely editable. With such freedom, you can tweak its design and other elements to your requirements. Download this Qualitative And Quantitative Research Data Assessment Proposal Team Cost Structure One Pager Sample Example Document brilliant piece now.

Strategic Staffing Using Data Recruitment Database Management Tools Comparison CRP DK SS V
This slide showcases comparative assessment between various recruitment database software such as Pinpoint, Manatal, Fetcher, TalentReef and Teamtailor. Do you know about Slidesgeeks Strategic Staffing Using Data Recruitment Database Management Tools Comparison CRP DK SS V These are perfect for delivering any kind od presentation. Using it, create PowerPoint presentations that communicate your ideas and engage audiences. Save time and effort by using our pre-designed presentation templates that are perfect for a wide range of topic. Our vast selection of designs covers a range of styles, from creative to business, and are all highly customizable and easy to edit. Download as a PowerPoint template or use them as Google Slides themes. This slide showcases comparative assessment between various recruitment database software such as Pinpoint, Manatal, Fetcher, TalentReef and Teamtailor.
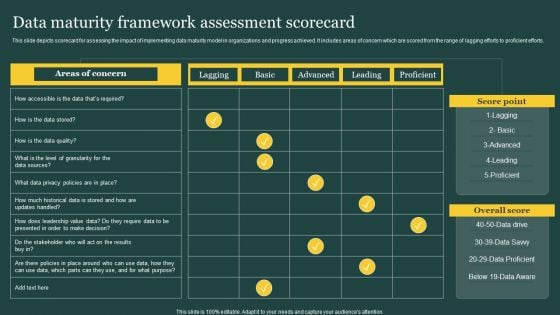
Data Maturity Framework Assessment Scorecard Ppt PowerPoint Presentation Gallery Design Ideas PDF
This slide depicts scorecard for assessing the impact of implementing data maturity model in organizations and progress achieved. It includes areas of concern which are scored from the range of lagging efforts to proficient efforts. Showcasing this set of slides titled Data Maturity Framework Assessment Scorecard Ppt PowerPoint Presentation Gallery Design Ideas PDF. The topics addressed in these templates are Areas Concern, Data Stored, Data Sources. All the content presented in this PPT design is completely editable. Download it and make adjustments in color, background, font etc. as per your unique business setting.
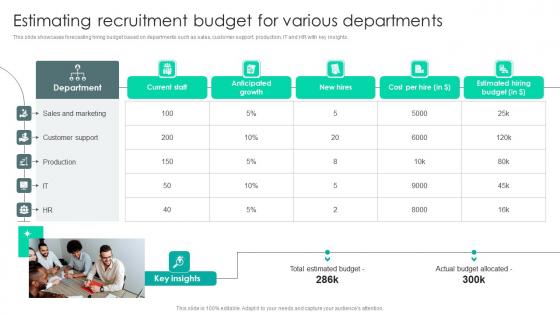
Strategic Staffing Using Data Estimating Recruitment Budget For Various Departments CRP DK SS V
This slide showcases forecasting hiring budget based on departments such as sales, customer support, production, IT and HR with key insights. Coming up with a presentation necessitates that the majority of the effort goes into the content and the message you intend to convey. The visuals of a PowerPoint presentation can only be effective if it supplements and supports the story that is being told. Keeping this in mind our experts created Strategic Staffing Using Data Estimating Recruitment Budget For Various Departments CRP DK SS V to reduce the time that goes into designing the presentation. This way, you can concentrate on the message while our designers take care of providing you with the right template for the situation. This slide showcases forecasting hiring budget based on departments such as sales, customer support, production, IT and HR with key insights.

Revenue Streams Email And Data Protection Platform Capital Funding Pitch Deck PPT PowerPoint
This slide covers the pricing model for the software company. It includes information about various pricing plans which include facilities such as HIPAA compliant email encryption, inbound emails, inbound mail security protection. This modern and well-arranged Revenue Streams Email And Data Protection Platform Capital Funding Pitch Deck PPT PowerPoint provides lots of creative possibilities. It is very simple to customize and edit with the Powerpoint Software. Just drag and drop your pictures into the shapes. All facets of this template can be edited with Powerpoint, no extra software is necessary. Add your own material, put your images in the places assigned for them, adjust the colors, and then you can show your slides to the world, with an animated slide included. This slide covers the pricing model for the software company. It includes information about various pricing plans which include facilities such as HIPAA compliant email encryption, inbound emails, inbound mail security protection.
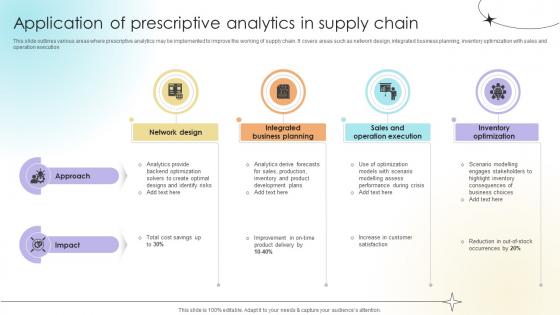
Application Of Prescriptive Analytics In Supply Chain Data Analytics SS V
This slide outlines various areas where prescriptive analytics may be implemented to improve the working of supply chain. It covers areas such as network design, integrated business planning, inventory optimization with sales and operation execution There are so many reasons you need a Application Of Prescriptive Analytics In Supply Chain Data Analytics SS V. The first reason is you can not spend time making everything from scratch, Thus, Slidegeeks has made presentation templates for you too. You can easily download these templates from our website easily. This slide outlines various areas where prescriptive analytics may be implemented to improve the working of supply chain. It covers areas such as network design, integrated business planning, inventory optimization with sales and operation execution
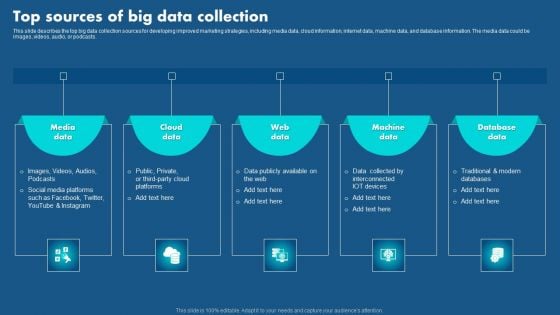
Role Of Hyperautomation In Redefining Business Top Sources Of Big Data Collection Pictures PDF
This slide describes the top big data collection sources for developing improved marketing strategies, including media data, cloud information, internet data, machine data, and database information. The media data could be images, videos, audio, or podcasts. Whether you have daily or monthly meetings, a brilliant presentation is necessary. Role Of Hyperautomation In Redefining Business Top Sources Of Big Data Collection Pictures PDF can be your best option for delivering a presentation. Represent everything in detail using Role Of Hyperautomation In Redefining Business Top Sources Of Big Data Collection Pictures PDF and make yourself stand out in meetings. The template is versatile and follows a structure that will cater to your requirements. All the templates prepared by Slidegeeks are easy to download and edit. Our research experts have taken care of the corporate themes as well. So, give it a try and see the results.
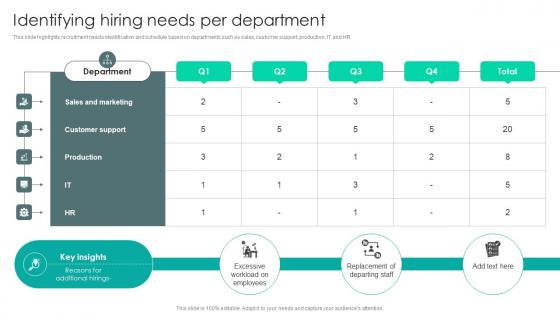
Strategic Staffing Using Data Identifying Hiring Needs Per Department CRP DK SS V
This slide highlights recruitment needs identification and schedule based on departments such as sales, customer support, production, IT and HR. Welcome to our selection of the Strategic Staffing Using Data Identifying Hiring Needs Per Department CRP DK SS V. These are designed to help you showcase your creativity and bring your sphere to life. Planning and Innovation are essential for any business that is just starting out. This collection contains the designs that you need for your everyday presentations. All of our PowerPoints are 100Percent editable, so you can customize them to suit your needs. This multi-purpose template can be used in various situations. Grab these presentation templates today. This slide highlights recruitment needs identification and schedule based on departments such as sales, customer support, production, IT and HR.

Business Strategy Review 8 Stages Zigzag Movement Of Data Change Management Ppt Slide
Drive confidently over all the bumps. Our Timeline Ppt Template 8 Stages Zigzag Movement Of Data will absorb the shocks. Take a drive into
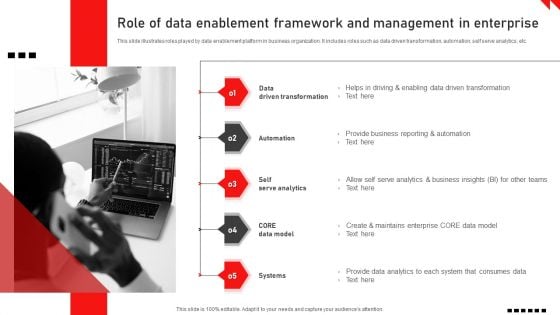
Role Of Data Enablement Framework And Management In Enterprise Background PDF
This slide illustrates roles played by data enablement platform in business organization. It includes roles such as data driven transformation, automation, self serve analytics, etc. Presenting Role Of Data Enablement Framework And Management In Enterprise Background PDF to dispense important information. This template comprises five stages. It also presents valuable insights into the topics including Data Driven Transformation, Automation, Self Serve Analytics. This is a completely customizable PowerPoint theme that can be put to use immediately. So, download it and address the topic impactfully.
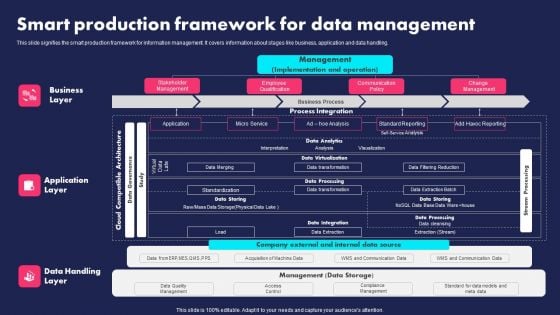
Smart Production Framework For Data Management Ppt PowerPoint Presentation Gallery Portrait PDF
This slide signifies the smart production framework for information management. It covers information about stages like business, application and data handling. Pitch your topic with ease and precision using this Smart Production Framework For Data Management Ppt PowerPoint Presentation Gallery Portrait PDF. This layout presents information on Business Layer, Application Layer, Data Handling Layer. It is also available for immediate download and adjustment. So, changes can be made in the color, design, graphics or any other component to create a unique layout.
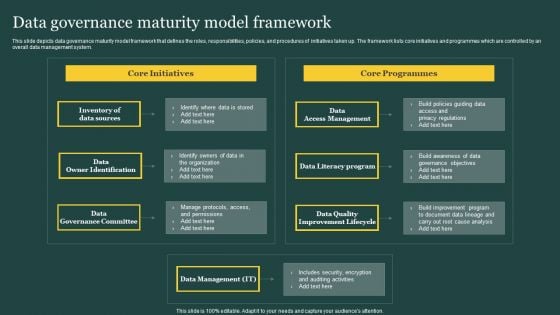
Data Governance Maturity Model Framework Ppt PowerPoint Presentation Gallery Layout PDF
This slide depicts data governance maturity model framework that defines the roles, responsibilities, policies, and procedures of initiatives taken up. The framework lists core initiatives and programmes which are controlled by an overall data management system. Pitch your topic with ease and precision using this Data Governance Maturity Model Framework Ppt PowerPoint Presentation Gallery Layout PDF. This layout presents information on Core Initiatives, Core Programmes, Data Access Management. It is also available for immediate download and adjustment. So, changes can be made in the color, design, graphics or any other component to create a unique layout.
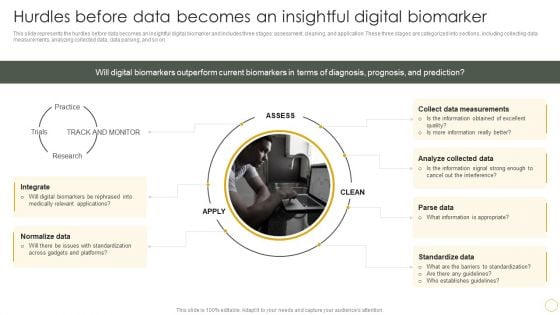
Digital Resilience Biomarker Technologies IT Hurdles Before Data Becomes An Insightful Digital Biomarker Clipart PDF
This slide represents the hurdles before data becomes an insightful digital biomarker and includes three stages assessment, cleaning, and application. These three stages are categorized into sections, including collecting data measurements, analyzing collected data, data parsing, and so on. Crafting an eye catching presentation has never been more straightforward. Let your presentation shine with this tasteful yet straightforward Digital Resilience Biomarker Technologies IT Hurdles Before Data Becomes An Insightful Digital Biomarker Clipart PDF template. It offers a minimalistic and classy look that is great for making a statement. The colors have been employed intelligently to add a bit of playfulness while still remaining professional. Construct the ideal Digital Resilience Biomarker Technologies IT Hurdles Before Data Becomes An Insightful Digital Biomarker Clipart PDF that effortlessly grabs the attention of your audience Begin now and be certain to wow your customers.
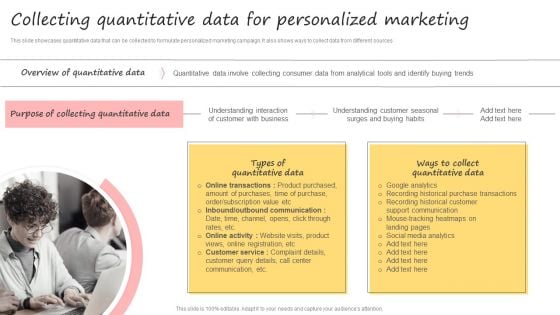
Developing Promotional Strategic Plan For Online Marketing Collecting Quantitative Data Pictures PDF
This slide showcases quantitative data that can be collected to formulate personalized marketing campaign. It also shows ways to collect data from different sources. If your project calls for a presentation, then Slidegeeks is your go-to partner because we have professionally designed, easy-to-edit templates that are perfect for any presentation. After downloading, you can easily edit Developing Promotional Strategic Plan For Online Marketing Collecting Quantitative Data Pictures PDF and make the changes accordingly. You can rearrange slides or fill them with different images. Check out all the handy templates
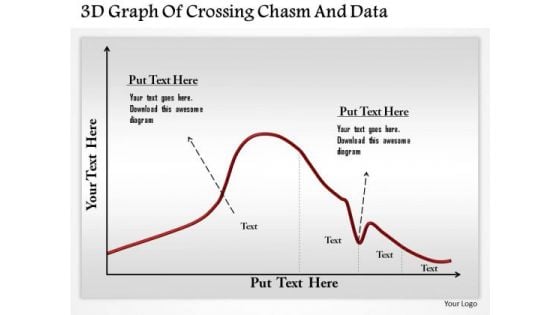
Business Diagram 3d Graph Of Crossing Chasm And Data Presentation Template
This business diagram has been designed with graphic of 3d graph. This slide contains the concept of chasm and data calculation. Use this slide to display chasm crossing condition. This business diagram adds value to your ideas.
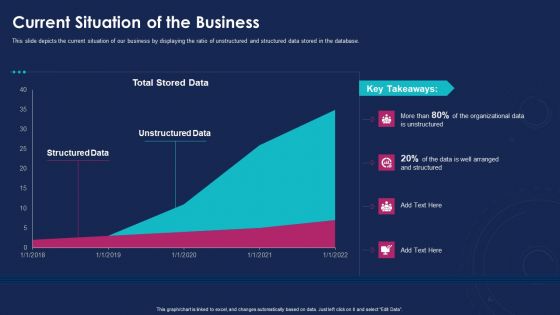
Data Analytics IT Current Situation Of The Business Ppt Inspiration Designs Download PDF
This slide depicts the current situation of our business by displaying the ratio of unstructured and structured data stored in the database. Deliver an awe inspiring pitch with this creative data analytics it current situation of the business ppt inspiration designs download pdf bundle. Topics like current situation of the business can be discussed with this completely editable template. It is available for immediate download depending on the needs and requirements of the user.
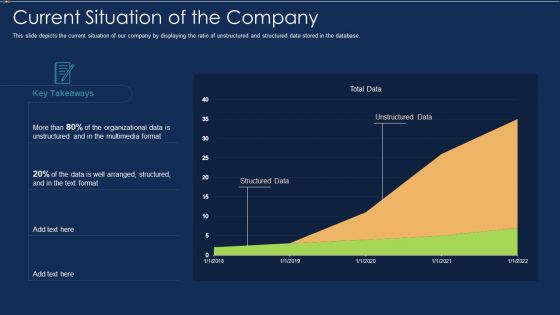
Data Warehousing IT Current Situation Of The Company Ppt Outline Slide Portrait PDF
This slide depicts the current situation of our company by displaying the ratio of unstructured and structured data stored in the database. Deliver an awe inspiring pitch with this creative data warehousing it current situation of the company ppt outline slide portrait pdf bundle. Topics like current situation of the company can be discussed with this completely editable template. It is available for immediate download depending on the needs and requirements of the user.
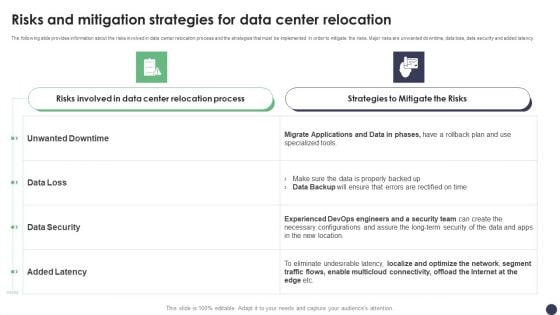
Risks And Mitigation Strategies For Data Center Relocation Ppt PowerPoint Presentation File Example PDF
The following slide provides information about the risks involved in data center relocation process and the strategies that must be implemented in order to mitigate the risks. Major risks are unwanted downtime, data loss, data security and added latency. If you are looking for a format to display your unique thoughts, then the professionally designed Risks And Mitigation Strategies For Data Center Relocation Ppt PowerPoint Presentation File Example PDF is the one for you. You can use it as a Google Slides template or a PowerPoint template. Incorporate impressive visuals, symbols, images, and other charts. Modify or reorganize the text boxes as you desire. Experiment with shade schemes and font pairings. Alter, share or cooperate with other people on your work. Download Risks And Mitigation Strategies For Data Center Relocation Ppt PowerPoint Presentation File Example PDF and find out how to give a successful presentation. Present a perfect display to your team and make your presentation unforgettable.
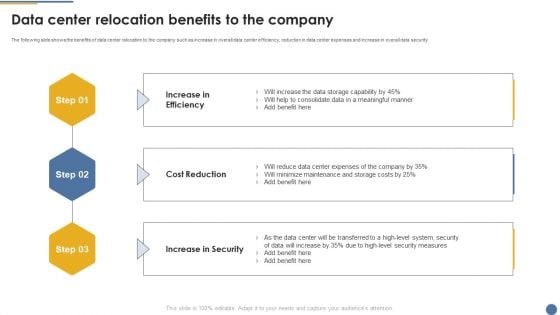
Assessment And Workflow Data Center Relocation Benefits To The Company Summary PDF
The following slide shows the benefits of data center relocation to the company such as increase in overall data center efficiency, reduction in data center expenses and increase in overall data security. Do you have to make sure that everyone on your team knows about any specific topic I yes, then you should give Assessment And Workflow Data Center Relocation Benefits To The Company Summary PDF a try. Our experts have put a lot of knowledge and effort into creating this impeccable Assessment And Workflow Data Center Relocation Benefits To The Company Summary PDF. You can use this template for your upcoming presentations, as the slides are perfect to represent even the tiniest detail. You can download these templates from the Slidegeeks website and these are easy to edit. So grab these today.
Iot And Data Analytics Applications For In Agricultural Industry Value Chain Ppt Icon Shapes PDF
This slide covers applications for internet of things and predictive data analytics to improve quality of farming techniques and value chain. It includes elements such as technologies used comprising of big data, IOT, cloud computing, GPS system, remote sensing , etc. along with information required. Pitch your topic with ease and precision using this Iot And Data Analytics Applications For In Agricultural Industry Value Chain Ppt Icon Shapes PDF. This layout presents information on Technologies, Big Data Analytics, Cloud Computing. It is also available for immediate download and adjustment. So, changes can be made in the color, design, graphics or any other component to create a unique layout.
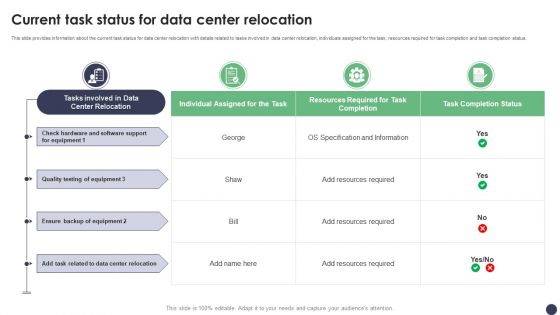
Current Task Status For Data Center Relocation Ppt PowerPoint Presentation File Infographics PDF
This slide provides information about the current task status for data center relocation with details related to tasks involved in data center relocation, individuals assigned for the task, resources required for task completion and task completion status. From laying roadmaps to briefing everything in detail, our templates are perfect for you. You can set the stage with your presentation slides. All you have to do is download these easy to edit and customizable templates. Current Task Status For Data Center Relocation Ppt PowerPoint Presentation File Infographics PDF will help you deliver an outstanding performance that everyone would remember and praise you for. Do download this presentation today.
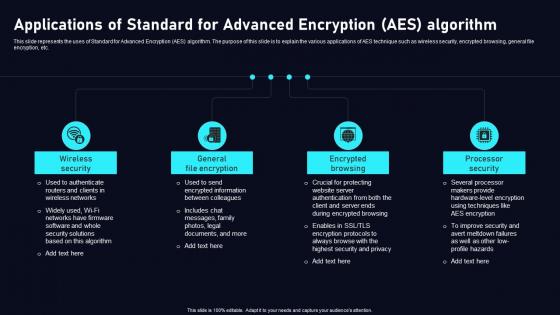
Applications Of Standard Advanced Cloud Data Security Using Cryptography Topics Pdf
This slide represents the uses of Standard for Advanced Encryption AES algorithm. The purpose of this slide is to explain the various applications of AES technique such as wireless security, encrypted browsing, general file encryption, etc. If your project calls for a presentation, then Slidegeeks is your go to partner because we have professionally designed, easy to edit templates that are perfect for any presentation. After downloading, you can easily edit Applications Of Standard Advanced Cloud Data Security Using Cryptography Topics Pdf and make the changes accordingly. You can rearrange slides or fill them with different images. Check out all the handy templates This slide represents the uses of Standard for Advanced Encryption AES algorithm. The purpose of this slide is to explain the various applications of AES technique such as wireless security, encrypted browsing, general file encryption, etc.
Data Assessment Of Business Productivity For Future Planning Ppt Infographics Portrait PDF
Persuade your audience using this data assessment of business productivity for future planning ppt infographics portrait pdf. This PPT design covers four stages, thus making it a great tool to use. It also caters to a variety of topics including data assessment of business productivity for future planning. Download this PPT design now to present a convincing pitch that not only emphasizes the topic but also showcases your presentation skills.
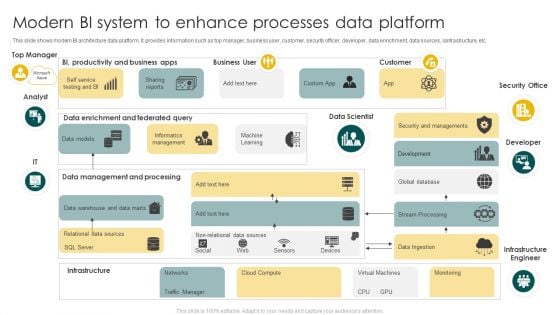
Modern BI System To Enhance Processes Data Platform Ppt Summary Shapes PDF
This slide shows modern BI architecture data platform. It provides information such as top manager, business user, customer, security officer, developer, data enrichment, data sources, ianfrastructure, etc. Presenting Modern BI System To Enhance Processes Data Platform Ppt Summary Shapes PDF to dispense important information. This template comprises one stages. It also presents valuable insights into the topics including Business User, Customer, Security Office. This is a completely customizable PowerPoint theme that can be put to use immediately. So, download it and address the topic impactfully.
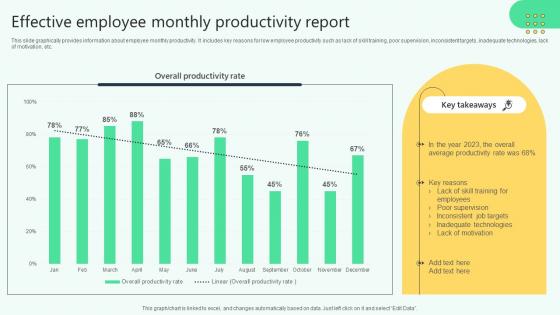
Effective Employee Monthly Productivity Report Analysing Hr Data For Effective Decision Making
This slide graphically provides information about employee monthly productivity. It includes key reasons for low employee productivity such as lack of skill training, poor supervision, inconsistent targets, inadequate technologies, lack of motivation, etc. If your project calls for a presentation, then Slidegeeks is your go-to partner because we have professionally designed, easy-to-edit templates that are perfect for any presentation. After downloading, you can easily edit Effective Employee Monthly Productivity Report Analysing Hr Data For Effective Decision Making and make the changes accordingly. You can rearrange slides or fill them with different images. Check out all the handy templates This slide graphically provides information about employee monthly productivity. It includes key reasons for low employee productivity such as lack of skill training, poor supervision, inconsistent targets, inadequate technologies, lack of motivation, etc.

Global Data Security Industry Report Growth Drivers Accelerating Cybersecurity Industry IR SS V
The purpose of the slide is to provide a comprehensive overview of the growth prospects in the cybersecurity market. It assists stakeholders to navigate the evolving landscape and make informed strategic decisions. It includes various growth factors such as increasing cyber threats, digital transformation, zero trust architecture, cyber insurance, IoT devices. Crafting an eye-catching presentation has never been more straightforward. Let your presentation shine with this tasteful yet straightforward Global Data Security Industry Report Growth Drivers Accelerating Cybersecurity Industry IR SS V template. It offers a minimalistic and classy look that is great for making a statement. The colors have been employed intelligently to add a bit of playfulness while still remaining professional. Construct the ideal Global Data Security Industry Report Growth Drivers Accelerating Cybersecurity Industry IR SS V that effortlessly grabs the attention of your audience Begin now and be certain to wow your customers The purpose of the slide is to provide a comprehensive overview of the growth prospects in the cybersecurity market. It assists stakeholders to navigate the evolving landscape and make informed strategic decisions. It includes various growth factors such as increasing cyber threats, digital transformation, zero trust architecture, cyber insurance, IoT devices.
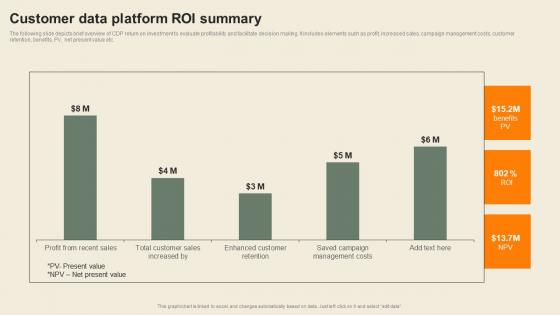
Customer Data Platform ROI Summary Usability Of CDP Software Tool Brochure Pdf
The following slide depicts brief overview of CDP return on investment to evaluate profitability and facilitate decision making. It includes elements such as profit, increased sales, campaign management costs, customer retention, benefits, PV, net present value etc. If your project calls for a presentation, then Slidegeeks is your go-to partner because we have professionally designed, easy-to-edit templates that are perfect for any presentation. After downloading, you can easily edit Customer Data Platform ROI Summary Usability Of CDP Software Tool Brochure Pdf and make the changes accordingly. You can rearrange slides or fill them with different images. Check out all the handy templates The following slide depicts brief overview of CDP return on investment to evaluate profitability and facilitate decision making. It includes elements such as profit, increased sales, campaign management costs, customer retention, benefits, PV, net present value etc.

Global Data Security Industry Report Exploring Recent Developments In Cybersecurity Industry IR SS V
The slide highlights recent news and developments of major key players in the cybersecurity industry, enabling stakeholders to stay informed and make informed decisions. It covers developments related to acquisitions, collaborations, new product launches, and investments. Whether you have daily or monthly meetings, a brilliant presentation is necessary. Global Data Security Industry Report Exploring Recent Developments In Cybersecurity Industry IR SS V can be your best option for delivering a presentation. Represent everything in detail using Global Data Security Industry Report Exploring Recent Developments In Cybersecurity Industry IR SS V and make yourself stand out in meetings. The template is versatile and follows a structure that will cater to your requirements. All the templates prepared by Slidegeeks are easy to download and edit. Our research experts have taken care of the corporate themes as well. So, give it a try and see the results. The slide highlights recent news and developments of major key players in the cybersecurity industry, enabling stakeholders to stay informed and make informed decisions. It covers developments related to acquisitions, collaborations, new product launches, and investments.

Global Data Security Industry Report Executive Summary Of Cybersecurity Industry Report IR SS V
The purpose of the slide is to provide a concise overview of the cybersecurity industry, serving as a valuable resource for industry professionals, investors, and policymakers. It includes a short description of the market, growth factors, restraints, and competitive landscape. Do you have an important presentation coming up Are you looking for something that will make your presentation stand out from the rest Look no further than Global Data Security Industry Report Executive Summary Of Cybersecurity Industry Report IR SS V. With our professional designs, you can trust that your presentation will pop and make delivering it a smooth process. And with Slidegeeks, you can trust that your presentation will be unique and memorable. So why wait Grab Global Data Security Industry Report Executive Summary Of Cybersecurity Industry Report IR SS V today and make your presentation stand out from the rest The purpose of the slide is to provide a concise overview of the cybersecurity industry, serving as a valuable resource for industry professionals, investors, and policymakers. It includes a short description of the market, growth factors, restraints, and competitive landscape.
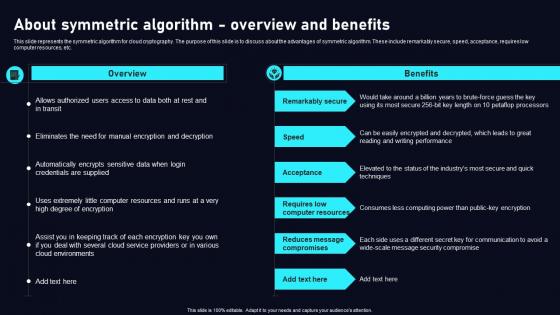
About Symmetric Algorithm Overview Cloud Data Security Using Cryptography Microsoft Pdf
This slide represents the symmetric algorithm for cloud cryptography. The purpose of this slide is to discuss about the advantages of symmetric algorithm. These include remarkably secure, speed, acceptance, requires low computer resources, etc. Whether you have daily or monthly meetings, a brilliant presentation is necessary. About Symmetric Algorithm Overview Cloud Data Security Using Cryptography Microsoft Pdf can be your best option for delivering a presentation. Represent everything in detail using About Symmetric Algorithm Overview Cloud Data Security Using Cryptography Microsoft Pdf and make yourself stand out in meetings. The template is versatile and follows a structure that will cater to your requirements. All the templates prepared by Slidegeeks are easy to download and edit. Our research experts have taken care of the corporate themes as well. So, give it a try and see the results. This slide represents the symmetric algorithm for cloud cryptography. The purpose of this slide is to discuss about the advantages of symmetric algorithm. These include remarkably secure, speed, acceptance, requires low computer resources, etc.
Business Financial Data Assessment Report Ppt PowerPoint Presentation File Format Ideas PDF
Pitch your topic with ease and precision using this business financial data assessment report ppt powerpoint presentation file format ideas pdf. This layout presents information on business financial data assessment report. It is also available for immediate download and adjustment. So, changes can be made in the color, design, graphics or any other component to create a unique layout.
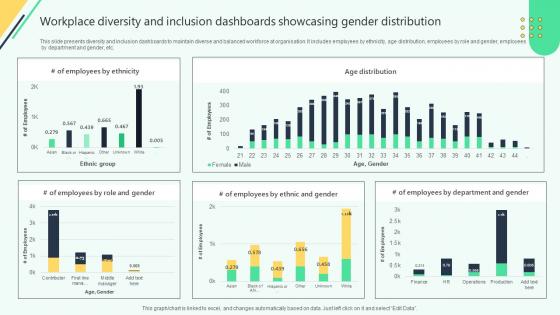
Workplace Diversity And Inclusion Dashboards Analysing Hr Data For Effective Decision Making
This slide presents diversity and inclusion dashboards to maintain diverse and balanced workforce at organisation. It includes employees by ethnicity, age distribution, employees by role and gender, employees by department and gender, etc. Whether you have daily or monthly meetings, a brilliant presentation is necessary. Workplace Diversity And Inclusion Dashboards Analysing Hr Data For Effective Decision Making can be your best option for delivering a presentation. Represent everything in detail using Workplace Diversity And Inclusion Dashboards Analysing Hr Data For Effective Decision Making and make yourself stand out in meetings. The template is versatile and follows a structure that will cater to your requirements. All the templates prepared by Slidegeeks are easy to download and edit. Our research experts have taken care of the corporate themes as well. So, give it a try and see the results. This slide presents diversity and inclusion dashboards to maintain diverse and balanced workforce at organisation. It includes employees by ethnicity, age distribution, employees by role and gender, employees by department and gender, etc.
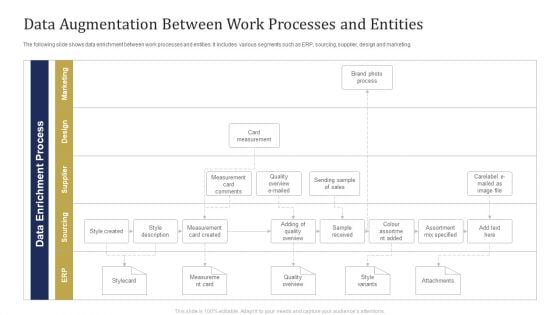
Data Augmentation Between Work Processes And Entities Ppt Model Inspiration PDF
The following slide shows data enrichment between work processes and entities. It includes various segments such as ERP, sourcing, supplier, design and marketing. Pitch your topic with ease and precision using this Data Augmentation Between Work Processes And Entities Ppt Model Inspiration PDF. This layout presents information on Data Enrichment Process, Card Measurement, Style Description. It is also available for immediate download and adjustment. So, changes can be made in the color, design, graphics or any other component to create a unique layout.
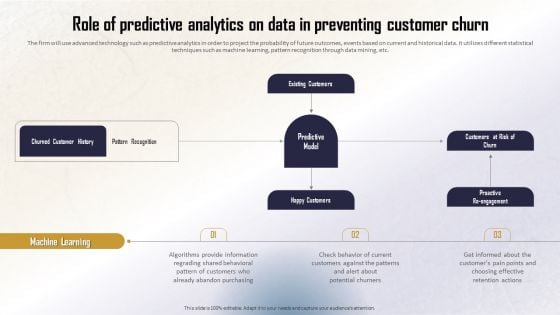
Identifying Direct And Indirect Role Of Predictive Analytics On Data In Preventing Summary PDF
The firm will use advanced technology such as predictive analytics in order to project the probability of future outcomes, events based on current and historical data. It utilizes different statistical techniques such as machine learning, pattern recognition through data mining, etc. Are you searching for a Identifying Direct And Indirect Role Of Predictive Analytics On Data In Preventing Summary PDF that is uncluttered, straightforward, and original Its easy to edit, and you can change the colors to suit your personal or business branding. For a presentation that expresses how much effort youve put in, this template is ideal With all of its features, including tables, diagrams, statistics, and lists, its perfect for a business plan presentation. Make your ideas more appealing with these professional slides. Download Identifying Direct And Indirect Role Of Predictive Analytics On Data In Preventing Summary PDF from Slidegeeks today.
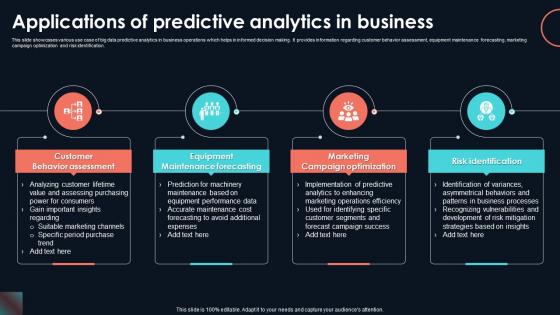
Applications Of Predictive Analytics In Developing Strategic Insights Using Big Data Analytics SS V
This slide showcases various use case of big data predictive analytics in business operations which helps in informed decision making. It provides information regarding customer behavior assessment, equipment maintenance forecasting, marketing campaign optimization and risk identification. There are so many reasons you need a Applications Of Predictive Analytics In Developing Strategic Insights Using Big Data Analytics SS V. The first reason is you can not spend time making everything from scratch, Thus, Slidegeeks has made presentation templates for you too. You can easily download these templates from our website easily. This slide showcases various use case of big data predictive analytics in business operations which helps in informed decision making. It provides information regarding customer behavior assessment, equipment maintenance forecasting, marketing campaign optimization and risk identification.

Stages Of Pie Chart Data Interpretation Business Plan Template PowerPoint Templates
We present our stages of pie chart data interpretation business plan template PowerPoint templates.Download and present our Circle Charts PowerPoint Templates because You can Stir your ideas in the cauldron of our PowerPoint Templates and Slides. Cast a magic spell on your audience. Download our Marketing PowerPoint Templates because Our PowerPoint Templates and Slides will let you Hit the target. Go the full distance with ease and elan. Use our Business PowerPoint Templates because Our PowerPoint Templates and Slides are truly out of this world. Even the MIB duo has been keeping tabs on our team. Download our Shapes PowerPoint Templates because Watching this your Audience will Grab their eyeballs, they wont even blink. Download our Process and Flows PowerPoint Templates because It will Give impetus to the hopes of your colleagues. Our PowerPoint Templates and Slides will aid you in winning their trust.Use these PowerPoint slides for presentations relating to achievement, analysis, background, bank, banking, business, calculation, chart, circle, commerce, commercial, commission, concept, credit, crisis, debt, deposit, design, detail, diagram, earnings, economics, economy, element, finance, goal, gold, golden, graph, graphic, growth, icon, idea, illustration, income, increase, invest, isolated, level, loss, market, marketing, metal, modern, money, new, object, part, percent, percentage, pie, plot, politics, profit, progress, ratio, reflection, reflective. The prominent colors used in the PowerPoint template are Blue, Gray, Black. Feed their curiosity with our Stages Of Pie Chart Data Interpretation Business Plan Template PowerPoint Templates. Arouse expectations with your thoughts.
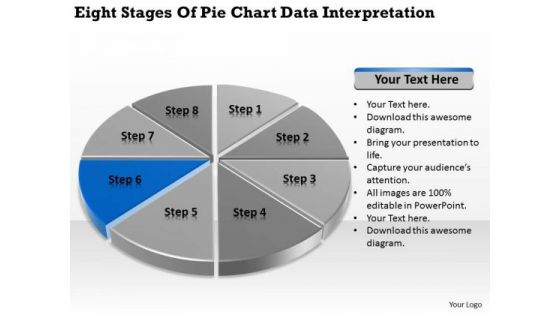
Stages Of Pie Chart Data Interpretation Example Business Plan PowerPoint Slides
We present our stages of pie chart data interpretation example business plan PowerPoint Slides.Download and present our Circle Charts PowerPoint Templates because It will let you Set new benchmarks with our PowerPoint Templates and Slides. They will keep your prospects well above par. Download our Marketing PowerPoint Templates because Our PowerPoint Templates and Slides will weave a web of your great ideas. They are gauranteed to attract even the most critical of your colleagues. Use our Business PowerPoint Templates because It will Strengthen your hand with your thoughts. They have all the aces you need to win the day. Present our Shapes PowerPoint Templates because It will get your audience in sync. Present our Process and Flows PowerPoint Templates because Our PowerPoint Templates and Slides will generate and maintain the level of interest you desire. They will create the impression you want to imprint on your audience.Use these PowerPoint slides for presentations relating to achievement, analysis, background, bank, banking, business, calculation, chart, circle, commerce, commercial, commission, concept, credit, crisis, debt, deposit, design, detail, diagram, earnings, economics, economy, element, finance, goal, gold, golden, graph, graphic, growth, icon, idea, illustration, income, increase, invest, isolated, level, loss, market, marketing, metal, modern, money, new, object, part, percent, percentage, pie, plot, politics, profit, progress, ratio, reflection, reflective. The prominent colors used in the PowerPoint template are Blue navy, Gray, Black. Add emphasis to your ideas with our Stages Of Pie Chart Data Interpretation Example Business Plan PowerPoint Slides. Lend greater credence to your expression.
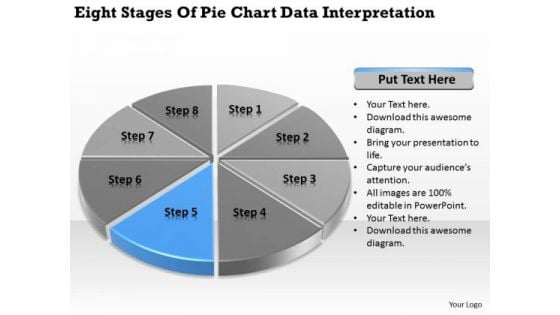
Stages Of Pie Chart Data Interpretation How To Write Business Plan PowerPoint Templates
We present our stages of pie chart data interpretation how to write business plan PowerPoint templates.Present our Circle Charts PowerPoint Templates because Our PowerPoint Templates and Slides will provide you a launch platform. Give a lift off to your ideas and send them into orbit. Present our Marketing PowerPoint Templates because Our PowerPoint Templates and Slides will let you Hit the right notes. Watch your audience start singing to your tune. Use our Business PowerPoint Templates because Our PowerPoint Templates and Slides come in all colours, shades and hues. They help highlight every nuance of your views. Download our Shapes PowerPoint Templates because It can Leverage your style with our PowerPoint Templates and Slides. Charm your audience with your ability. Use our Process and Flows PowerPoint Templates because You can Connect the dots. Fan expectations as the whole picture emerges.Use these PowerPoint slides for presentations relating to achievement, analysis, background, bank, banking, business, calculation, chart, circle, commerce, commercial, commission, concept, credit, crisis, debt, deposit, design, detail, diagram, earnings, economics, economy, element, finance, goal, gold, golden, graph, graphic, growth, icon, idea, illustration, income, increase, invest, isolated, level, loss, market, marketing, metal, modern, money, new, object, part, percent, percentage, pie, plot, politics, profit, progress, ratio, reflection, reflective. The prominent colors used in the PowerPoint template are Blue, Gray, Black. Our Stages Of Pie Chart Data Interpretation How To Write Business Plan PowerPoint Templates avoid exaggerations. They keep you away from any farce.
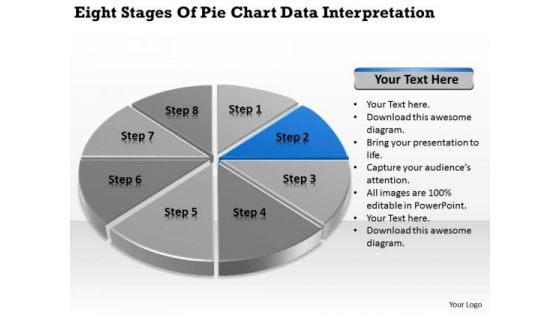
Stages Of Pie Chart Data Interpretation Vending Machine Business Plan PowerPoint Slides
We present our stages of pie chart data interpretation vending machine business plan PowerPoint Slides.Present our Circle Charts PowerPoint Templates because You should Bet on your luck with our PowerPoint Templates and Slides. Be assured that you will hit the jackpot. Present our Marketing PowerPoint Templates because Our PowerPoint Templates and Slides will provide you the cutting edge. Slice through the doubts in the minds of your listeners. Download our Business PowerPoint Templates because you should Experience excellence with our PowerPoint Templates and Slides. They will take your breath away. Download our Shapes PowerPoint Templates because It will Raise the bar of your Thoughts. They are programmed to take you to the next level. Present our Process and Flows PowerPoint Templates because Our PowerPoint Templates and Slides will give good value for money. They also have respect for the value of your time.Use these PowerPoint slides for presentations relating to achievement, analysis, background, bank, banking, business, calculation, chart, circle, commerce, commercial, commission, concept, credit, crisis, debt, deposit, design, detail, diagram, earnings, economics, economy, element, finance, goal, gold, golden, graph, graphic, growth, icon, idea, illustration, income, increase, invest, isolated, level, loss, market, marketing, metal, modern, money, new, object, part, percent, percentage, pie, plot, politics, profit, progress, ratio, reflection, reflective. The prominent colors used in the PowerPoint template are Blue, Gray, Black. Our Stages Of Pie Chart Data Interpretation Vending Machine Business Plan PowerPoint Slides come at a comfortable cost. They are definitely an economical choice.

Cloud Security Assessment Cloud Security Checklist Backup And Data Recovery Diagrams PDF
This slide represents the importance of data backup and data recovery in cloud security. It also shows how organizations should know about the data backup policies of service providers before investing in them. Presenting Cloud Security Assessment Cloud Security Checklist Backup And Data Recovery Diagrams PDF to provide visual cues and insights. Share and navigate important information on three stages that need your due attention. This template can be used to pitch topics like Service Provider, Effective Plans, Natural Disasters In addtion, this PPT design contains high resolution images, graphics, etc, that are easily editable and available for immediate download.
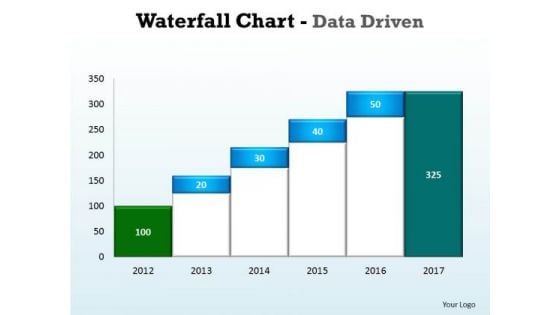
Business Graphic PowerPoint Templates Business Waterfall Chart Data Driven Ppt Slides
Business Graphic PowerPoint Templates Business waterfall chart data driven PPT Slides- This Water Fall chart can display continuous data over time, set against a common scale, and are therefore ideal for showing trends in data at equal intervals-This ppt can be used for concepts relating to-chart,, graph, growth, investment, , market, percentage, , presentation report, results, statistics, stock, success and business. Expose your team to a brave new world. Challenge preset boundaries with our Business Graphic PowerPoint Templates Business Waterfall Chart Data Driven Ppt Slides.
Assessment And Workflow Data Center Relocation Process Step 2 Mapping Existing Icons PDF
This slide shows the second step that is involved in data center relocation process which is to be implemented for minimizing data center costs and improving scalability i.e. mapping existing functionality to new data center. From laying roadmaps to briefing everything in detail, our templates are perfect for you. You can set the stage with your presentation slides. All you have to do is download these easy-to-edit and customizable templates. Assessment And Workflow Data Center Relocation Process Step 2 Mapping Existing Icons PDF will help you deliver an outstanding performance that everyone would remember and praise you for. Do download this presentation today.
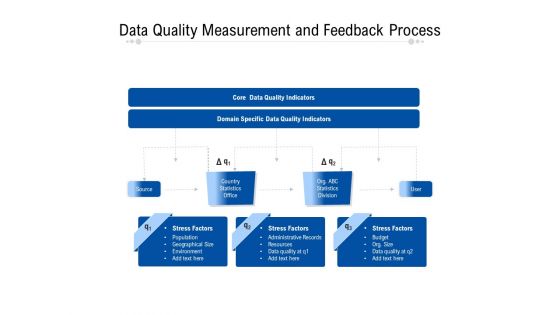
Data Quality Measurement And Feedback Process Ppt PowerPoint Presentation File Guidelines PDF
Pitch your topic with ease and precision using this data quality measurement and feedback process ppt powerpoint presentation file guidelines pdf. This layout presents information on source, country statistics office, stress factors, core data quality indicators, domain specific data quality indicators. It is also available for immediate download and adjustment. So, changes can be made in the color, design, graphics or any other component to create a unique layout.
Information And Data Assessment Vector Icon Ppt PowerPoint Presentation Gallery Themes PDF
Presentinginformation and data assessment vector icon ppt powerpoint presentation gallery themes pdf to dispense important information. This template comprises three stages. It also presents valuable insights into the topics including information and data assessment vector icon. This is a completely customizable PowerPoint theme that can be put to use immediately. So, download it and address the topic impactfully.
Competitive Assessment Spider Graph For Multivariate Data Ppt PowerPoint Presentation Icon Background Images PDF
Pitch your topic with ease and precision using this competitive assessment spider graph for multivariate data ppt powerpoint presentation icon background images pdf. This layout presents information on competitive assessment spider graph for multivariate data. It is also available for immediate download and adjustment. So, changes can be made in the color, design, graphics or any other component to create a unique layout.
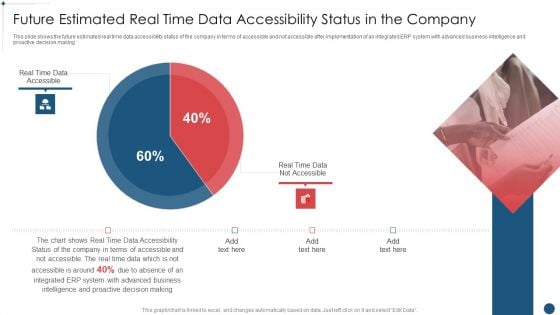
Enterprise Resource Planning System Framework Future Estimated Real Time Data Accessibility Status Infographics PDF
This slide shows the future estimated real time data accessibility status of the company in terms of accessible and not accessible after implementation of an integrated ERP system with advanced business intelligence and proactive decision making Deliver and pitch your topic in the best possible manner with this Enterprise Resource Planning System Framework Future Estimated Real Time Data Accessibility Status Infographics PDF Use them to share invaluable insights on Data Accessibility, Accessible Is Around, Proactive Decision Making and impress your audience. This template can be altered and modified as per your expectations. So, grab it now.
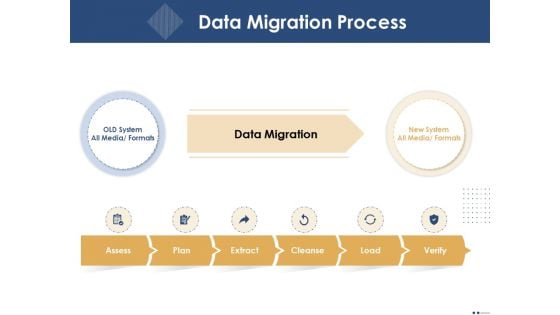
Introducing And Implementing Approaches Within The Business Data Migration Process Ppt Professional Example PDF
Presenting this set of slides with name introducing and implementing approaches within the business data migration process ppt professional example pdf. This is a two stage process. The stages in this process are assess, plan, extract, cleanse, load, verify, data migration. This is a completely editable PowerPoint presentation and is available for immediate download. Download now and impress your audience.

Data Process Model With System Decommissioning Ppt PowerPoint Presentation Inspiration PDF
Pitch your topic with ease and precision using this data process model with system decommissioning ppt powerpoint presentation inspiration pdf. This layout presents information on retention management, data archiving, system decommissioning, db volume management, end oflife data, end of life systems. It is also available for immediate download and adjustment. So, changes can be made in the color, design, graphics or any other component to create a unique layout.
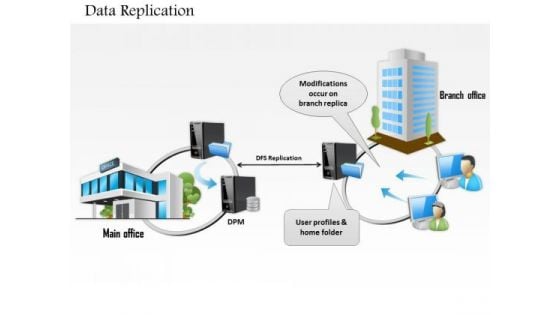
1 Data Replication Between Main Office And Branch Over Network Wan Lan Ppt Slides
This image slide displays data replication. This image slide has been designed with graphic of main office and branch data replication over network. This image slide depicts process of data replication. Database replication can be used on many database management systems, usually with a master slave relationship between the original and the copies. The master logs the updates, which then pass through to the slaves. You may change size, color and orientation of any icon to your liking. Use this PowerPoint template, in your presentations to explain concept of data replication. This image slide will enhance the quality of your presentations.

Introduction Of New Human Resource Management Analysing Hr Data For Effective Decision Making
Following slide showcases the development of a new human resource management process aimed at increasing employee performance. It includes internal recruitment, external recruitment, selection, training, assessing performance, motivating, This Introduction Of New Human Resource Management Analysing Hr Data For Effective Decision Making from Slidegeeks makes it easy to present information on your topic with precision. It provides customization options, so you can make changes to the colors, design, graphics, or any other component to create a unique layout. It is also available for immediate download, so you can begin using it right away. Slidegeeks has done good research to ensure that you have everything you need to make your presentation stand out. Make a name out there for a brilliant performance. Following slide showcases the development of a new human resource management process aimed at increasing employee performance. It includes internal recruitment, external recruitment, selection, training, assessing performance, motivating,
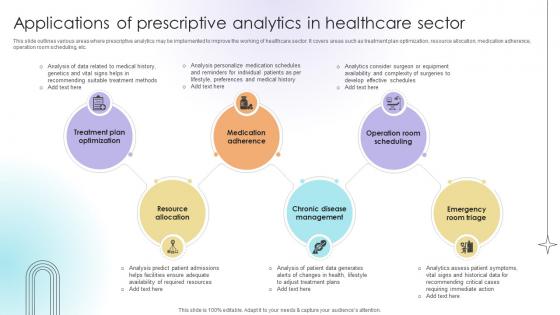
Applications Of Prescriptive Analytics In Healthcare Sector Data Analytics SS V
This slide outlines various areas where prescriptive analytics may be implemented to improve the working of healthcare sector. It covers areas such as treatment plan optimization, resource allocation, medication adherence, operation room scheduling, etc.Slidegeeks is here to make your presentations a breeze with Applications Of Prescriptive Analytics In Healthcare Sector Data Analytics SS V With our easy-to-use and customizable templates, you can focus on delivering your ideas rather than worrying about formatting. With a variety of designs to choose from, you are sure to find one that suits your needs. And with animations and unique photos, illustrations, and fonts, you can make your presentation pop. So whether you are giving a sales pitch or presenting to the board, make sure to check out Slidegeeks first This slide outlines various areas where prescriptive analytics may be implemented to improve the working of healthcare sector. It covers areas such as treatment plan optimization, resource allocation, medication adherence, operation room scheduling, etc.
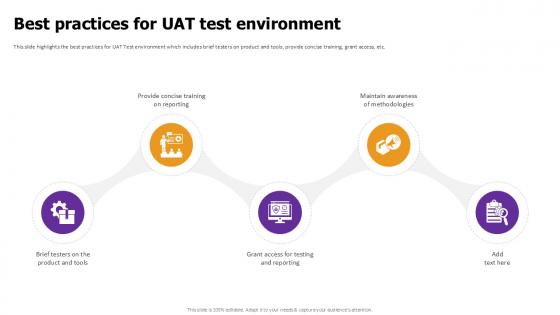
Best Practices For UAT Test Effective Test Data Management Ppt Powerpoint
This slide highlights the best practices for UAT Test environment which includes brief testers on product and tools, provide concise training, grant access, etc. Present like a pro with Best Practices For UAT Test Effective Test Data Management Ppt Powerpoint Create beautiful presentations together with your team, using our easy-to-use presentation slides. Share your ideas in real-time and make changes on the fly by downloading our templates. So whether you are in the office, on the go, or in a remote location, you can stay in sync with your team and present your ideas with confidence. With Slidegeeks presentation got a whole lot easier. Grab these presentations today. This slide highlights the best practices for UAT Test environment which includes brief testers on product and tools, provide concise training, grant access, etc.
Data Maturity Framework Stages Icon Ppt PowerPoint Presentation File Graphics Design PDF
Pitch your topic with ease and precision using this Data Maturity Framework Stages Icon Ppt PowerPoint Presentation File Graphics Design PDF. This layout presents information on Data Maturity, Framework Stages, Icon. It is also available for immediate download and adjustment. So, changes can be made in the color, design, graphics or any other component to create a unique layout.

Data Management Framework Strategy On White Board Ppt PowerPoint Presentation File Show PDF
Pitch your topic with ease and precision using this data management framework strategy on white board ppt powerpoint presentation file show pdf. This layout presents information on data management framework strategy on white board. It is also available for immediate download and adjustment. So, changes can be made in the color, design, graphics or any other component to create a unique layout.
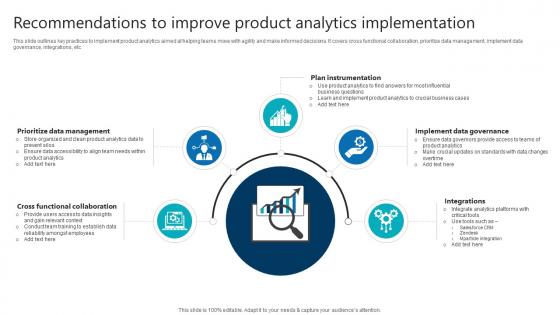
Recommendations To Improve Product Analytics Implementation Product Analytics Implementation Data Analytics V
This slide outlines key practices to implement product analytics aimed at helping teams move with agility and make informed decisions. It covers cross functional collaboration, prioritize data management, implement data governance, integrations, etc Find highly impressive Recommendations To Improve Product Analytics Implementation Product Analytics Implementation Data Analytics V on Slidegeeks to deliver a meaningful presentation. You can save an ample amount of time using these presentation templates. No need to worry to prepare everything from scratch because Slidegeeks experts have already done a huge research and work for you. You need to download Recommendations To Improve Product Analytics Implementation Product Analytics Implementation Data Analytics V for your upcoming presentation. All the presentation templates are 100 percent editable and you can change the color and personalize the content accordingly. Download now This slide outlines key practices to implement product analytics aimed at helping teams move with agility and make informed decisions. It covers cross functional collaboration, prioritize data management, implement data governance, integrations, etc
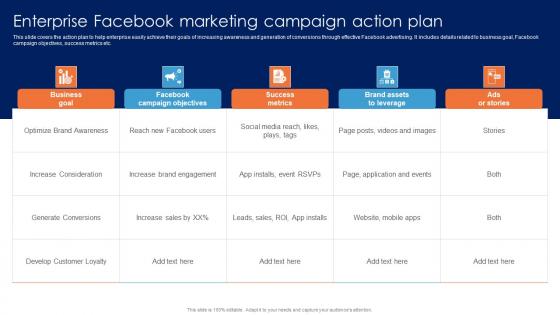
Enterprise Facebook Marketing Campaign Guide For Data Driven Advertising Introduction Pdf
This slide covers the action plan to help enterprise easily achieve their goals of increasing awareness and generation of conversions through effective Facebook advertising. It includes details related to business goal, Facebook campaign objectives, success metrics etc.This Enterprise Facebook Marketing Campaign Guide For Data Driven Advertising Introduction Pdf from Slidegeeks makes it easy to present information on your topic with precision. It provides customization options, so you can make changes to the colors, design, graphics, or any other component to create a unique layout. It is also available for immediate download, so you can begin using it right away. Slidegeeks has done good research to ensure that you have everything you need to make your presentation stand out. Make a name out there for a brilliant performance. This slide covers the action plan to help enterprise easily achieve their goals of increasing awareness and generation of conversions through effective Facebook advertising. It includes details related to business goal, Facebook campaign objectives, success metrics etc.


 Continue with Email

 Home
Home


