Data Governance Icon
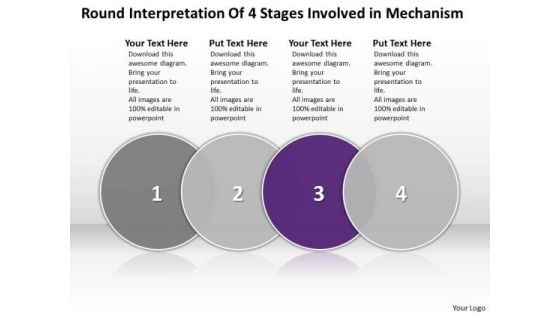
Ppt Summary Of 4 State PowerPoint Project Diagram Involved Mechanism Templates
PPT summary of 4 state powerpoint project diagram involved mechanism Templates-This diagram is a graphical illustration of the relationships between and among sets of data, groups of objects that share something in common. They are indicators of the path you have in mind.-PPT summary of 4 state powerpoint project diagram involved mechanism Templates-abstract, background, balance, business, circle, colorful, complement, concept, conceptual, connected, control, cooperation, design, gear, harmony, icon, ideal, illustration, involved, machine, progress, rhythm, round, shape, spin, support, system, teamwork, technology, together, wheel Ask any favour of our Ppt Summary Of 4 State PowerPoint Project Diagram Involved Mechanism Templates. You will find them truly accomodating.
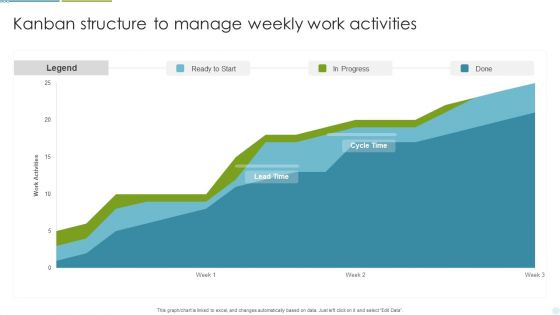
Kanban Structure To Manage Weekly Work Activities Ppt Professional Aids PDF
This graph or chart is linked to excel, and changes automatically based on data. Just left click on it and select Edit Data. Pitch your topic with ease and precision using this Kanban Structure To Manage Weekly Work Activities Ppt Professional Aids PDF. This layout presents information on Legend, Ready To Start, In Progress. It is also available for immediate download and adjustment. So, changes can be made in the color, design, graphics or any other component to create a unique layout.
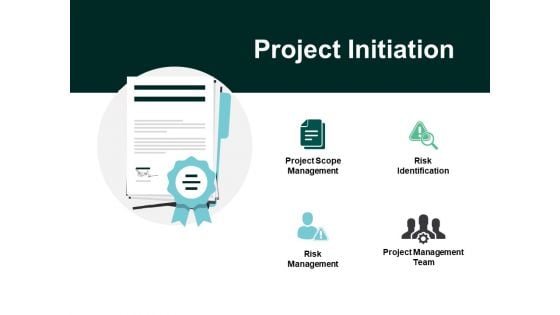
Project Initiation Risk Management Ppt PowerPoint Presentation Pictures Show
This is a project initiation risk management ppt powerpoint presentation pictures show. This is a four stage process. The stages in this process are icons, business, management, strategy, analysis.
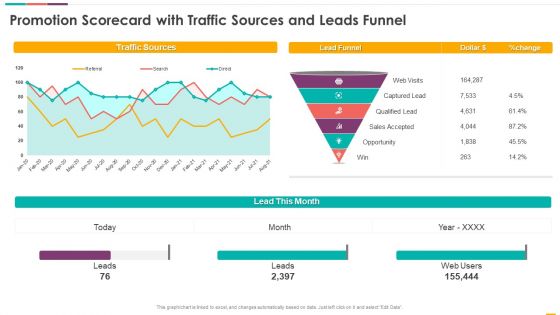
Promotion Scorecard With Traffic Sources And Leads Funnel Ppt Layouts Background PDF
This graph or chart is linked to excel, and changes automatically based on data. Just left click on it and select Edit Data. Deliver and pitch your topic in the best possible manner with this promotion scorecard with traffic sources and leads funnel ppt layouts background pdf. Use them to share invaluable insights on lead month, lead funnel, dollar, traffic sources and impress your audience. This template can be altered and modified as per your expectations. So, grab it now.
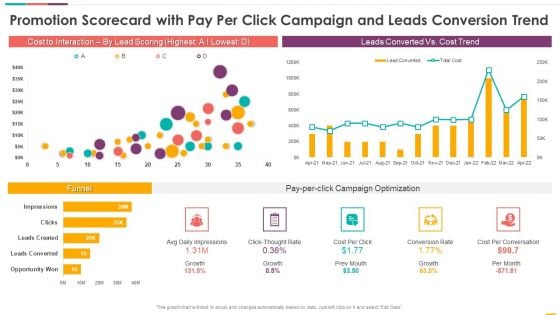
Promotion Scorecard With Pay Per Click Campaign And Leads Conversion Trend Topics PDF
This graph or chart is linked to excel, and changes automatically based on data. Just left click on it and select Edit Data. Deliver an awe inspiring pitch with this creative promotion scorecard with pay per click campaign and leads conversion trend topics pdf bundle. Topics like cost to interaction, by lead scoring, leads converted vs cost trend, funnel can be discussed with this completely editable template. It is available for immediate download depending on the needs and requirements of the user.
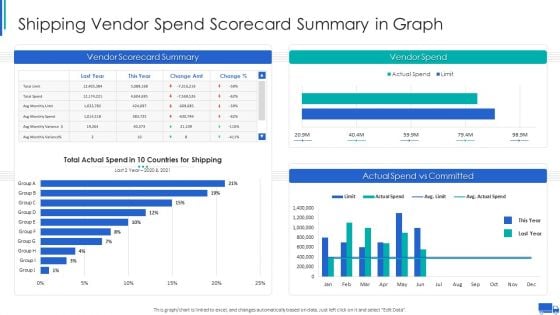
Shipping Vendor Spend Scorecard Summary In Graph Ppt Pictures Introduction PDF
This graph or chart is linked to excel, and changes automatically based on data. Just left click on it and select Edit Data. Deliver and pitch your topic in the best possible manner with this Shipping Vendor Spend Scorecard Summary In Graph Ppt Pictures Introduction PDF. Use them to share invaluable insights on Vendor Scorecard Summary, Vendor Spend Shipping, Actual Spend Vs and impress your audience. This template can be altered and modified as per your expectations. So, grab it now.
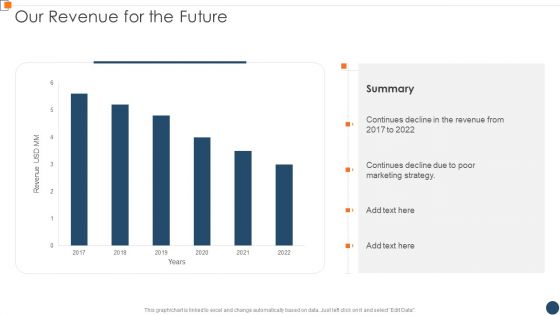
BANT Sales Lead Qualification Model Our Revenue For The Future Mockup PDF
This graph or chart is linked to excel and change automatically based on data. Just left click on it and select Edit Data. Deliver an awe inspiring pitch with this creative BANT Sales Lead Qualification Model Our Revenue For The Future Mockup PDF bundle. Topics like Continues Decline, Marketing Strategy, 2017 To 2022 can be discussed with this completely editable template. It is available for immediate download depending on the needs and requirements of the user.
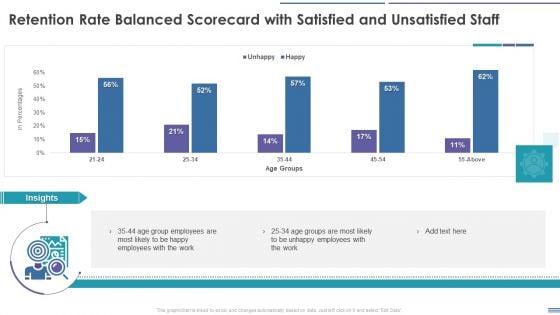
Staff Retention Balanced Scorecard Retention Rate Balanced Scorecard With Satisfied And Unsatisfied Summary PDF
This graph or chart is linked to excel, and changes automatically based on data. Just left click on it and select Edit Data. Deliver an awe inspiring pitch with this creative Staff Retention Balanced Scorecard Retention Rate Balanced Scorecard With Satisfied And Unsatisfied Summary PDF bundle. Topics like Employee, Retention Rate Balanced Scorecard, Satisfied And Unsatisfied Staff can be discussed with this completely editable template. It is available for immediate download depending on the needs and requirements of the user.
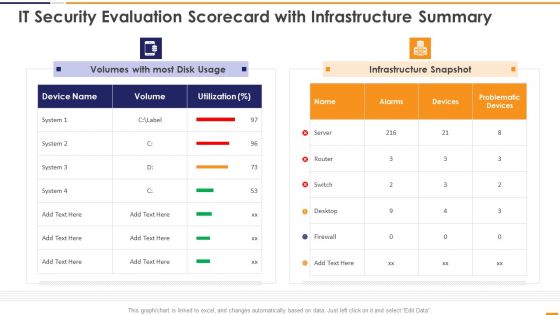
IT Security Evaluation Scorecard With Infrastructure Summary Ppt Slides Portrait PDF
This graph or chart is linked to excel, and changes automatically based on data. Just left click on it and select Edit Data. Deliver an awe inspiring pitch with this creative IT Security Evaluation Scorecard With Infrastructure Summary Ppt Slides Portrait PDF bundle. Topics like Volumes Most Disk, Usage Infrastructure Snapshot can be discussed with this completely editable template. It is available for immediate download depending on the needs and requirements of the user.
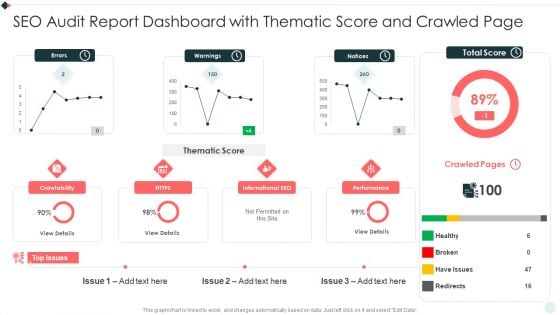
SEO Audit Summary To Increase SEO Audit Report Dashboard With Thematic Score Download PDF
This graph or chart is linked to excel, and changes automatically based on data. Just left click on it and select Edit Data. Deliver an awe inspiring pitch with this creative SEO Audit Summary To Increase SEO Audit Report Dashboard With Thematic Score Download PDF bundle. Topics like Total Score, Crawled Pages, Top Issues can be discussed with this completely editable template. It is available for immediate download depending on the needs and requirements of the user.
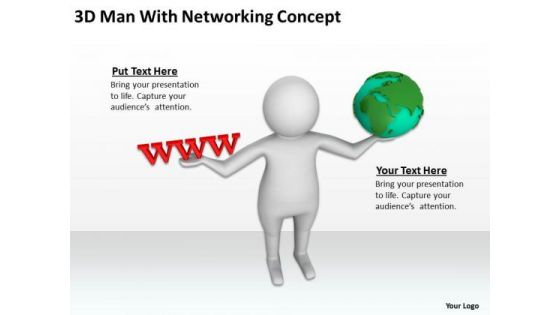
Business Diagram 3d Man With Networking Concept PowerPoint Templates
We present our business diagram 3d man with networking concept PowerPoint templates.Download and present our Intenet PowerPoint Templates because Our PowerPoint Templates and Slides will let you Clearly mark the path for others to follow. Download and present our Business PowerPoint Templates because You can Create a matrix with our PowerPoint Templates and Slides. Feel the strength of your ideas click into place. Download and present our Computer PowerPoint Templates because You can Bask in the warmth of our PowerPoint Templates and Slides. Enjoy the heartfelt glowing response of your listeners. Present our Communication PowerPoint Templates because You can Raise a toast with our PowerPoint Templates and Slides. Spread good cheer amongst your audience. Present our Metaphors-Visual Concepts PowerPoint Templates because you can Break through with our PowerPoint Templates and Slides. Bring down the mental barriers of your audience.Use these PowerPoint slides for presentations relating to 3d, business, character, chart, communication, computer, concept, connection, data, e-mail, earth, firewall, fun, global, graphic, illustration, information, internet, isolated, male, map, men, network, people, planet, puppet, render, server, sharing, social, support, teamwork, technology, web, wire, www. The prominent colors used in the PowerPoint template are Red, Green, Gray. PowerPoint presentation experts tell us our business diagram 3d man with networking concept PowerPoint templates are effectively colour coded to prioritise your plans They automatically highlight the sequence of events you desire. Professionals tell us our communication PowerPoint templates and PPT Slides will save the presenter time. People tell us our business diagram 3d man with networking concept PowerPoint templates are the best it can get when it comes to presenting. Presenters tell us our character PowerPoint templates and PPT Slides are visually appealing. Professionals tell us our business diagram 3d man with networking concept PowerPoint templates look good visually. We assure you our chart PowerPoint templates and PPT Slides will make you look like a winner. Improve the apprearance of your slides with our Business Diagram 3d Man With Networking Concept PowerPoint Templates. Dont waste time struggling with PowerPoint. Let us do it for you.
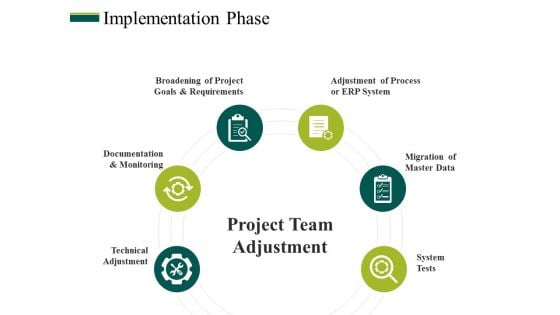
Implementation Phase Ppt PowerPoint Presentation Show Visuals
This is a implementation phase ppt powerpoint presentation show visuals. This is a six stage process. The stages in this process are technical adjustment, documentation and monitoring, broadening of project goals and requirements, adjustment of process or erp system, migration of master data.
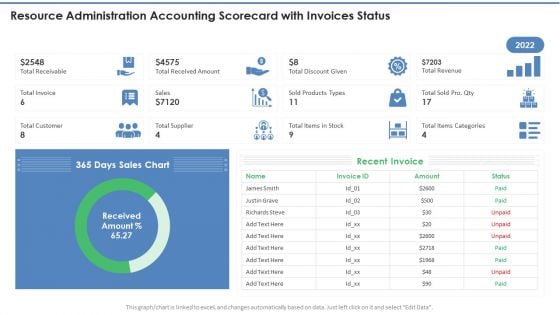
Resource Administration Accounting Scorecard With Invoices Status Topics PDF
This graph or chart is linked to excel, and changes automatically based on data. Just left click on it and select Edit Data. Deliver an awe inspiring pitch with this creative Resource Administration Accounting Scorecard With Invoices Status Topics PDF bundle. Topics like Recent Invoice, Sales Chart, Total Receivable can be discussed with this completely editable template. It is available for immediate download depending on the needs and requirements of the user.
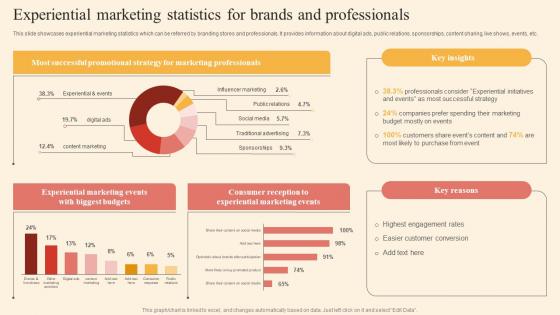
Experiential Marketing Statistics Driving Business Success By Hosting Experiential Pictures Pdf
This slide showcases experiential marketing statistics which can be referred by branding stores and professionals. It provides information about digital ads, public relations, sponsorships, content sharing, live shows, events, etc. The Experiential Marketing Statistics Driving Business Success By Hosting Experiential Pictures Pdf is a compilation of the most recent design trends as a series of slides. It is suitable for any subject or industry presentation, containing attractive visuals and photo spots for businesses to clearly express their messages. This template contains a variety of slides for the user to input data, such as structures to contrast two elements, bullet points, and slides for written information. Slidegeeks is prepared to create an impression. This slide showcases experiential marketing statistics which can be referred by branding stores and professionals. It provides information about digital ads, public relations, sponsorships, content sharing, live shows, events, etc.
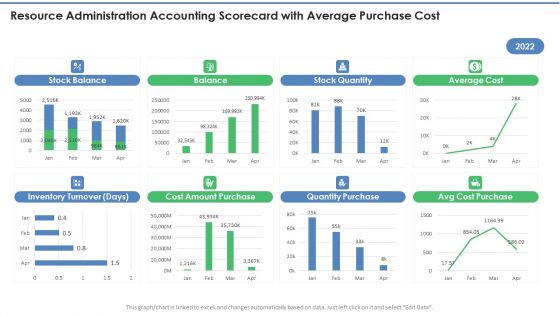
Resource Administration Accounting Scorecard With Average Purchase Cost Structure PDF
This graph or chart is linked to excel, and changes automatically based on data. Just left click on it and select Edit Data. Deliver and pitch your topic in the best possible manner with this Resource Administration Accounting Scorecard With Average Purchase Cost Structure PDF. Use them to share invaluable insights on Stock Balance, Stock Quantity, Average Cost and impress your audience. This template can be altered and modified as per your expectations. So, grab it now.
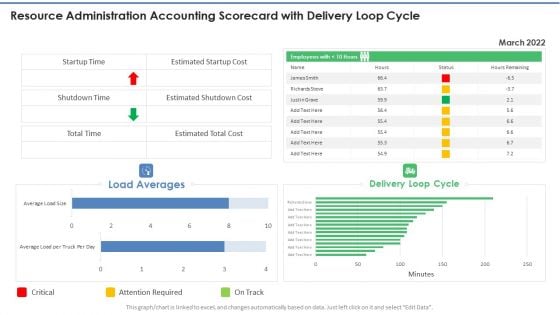
Resource Administration Accounting Scorecard With Delivery Loop Cycle Graphics PDF
This graph or chart is linked to excel, and changes automatically based on data. Just left click on it and select Edit Data. Deliver an awe inspiring pitch with this creative Resource Administration Accounting Scorecard With Delivery Loop Cycle Graphics PDF bundle. Topics like Load Averages, Delivery Loop Cycle, Attention Required can be discussed with this completely editable template. It is available for immediate download depending on the needs and requirements of the user.
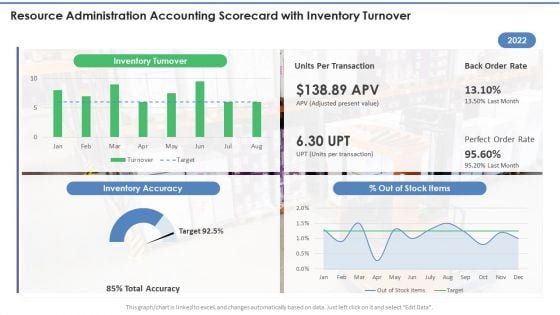
Resource Administration Accounting Scorecard With Inventory Turnover Microsoft PDF
This graph or chart is linked to excel, and changes automatically based on data. Just left click on it and select Edit Data. Deliver an awe inspiring pitch with this creative Resource Administration Accounting Scorecard With Inventory Turnover Microsoft PDF bundle. Topics like Inventory Turnover, Inventory Accuracy, Back Order Rate can be discussed with this completely editable template. It is available for immediate download depending on the needs and requirements of the user.

Resource Administration Accounting Scorecard With Inventory Value Infographics PDF
This graph or chart is linked to excel, and changes automatically based on data. Just left click on it and select Edit Data. Deliver and pitch your topic in the best possible manner with this Resource Administration Accounting Scorecard With Inventory Value Infographics PDF. Use them to share invaluable insights on Current Inventory, Stock Positions, Missing Stock and impress your audience. This template can be altered and modified as per your expectations. So, grab it now.
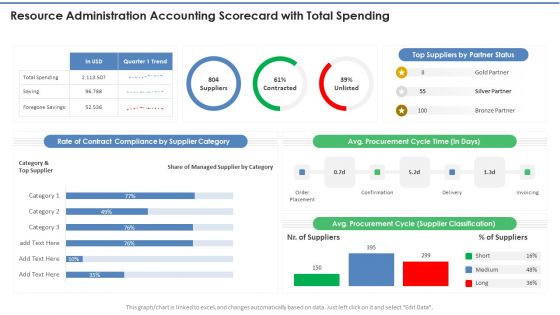
Resource Administration Accounting Scorecard With Total Spending Professional PDF
This graph or chart is linked to excel, and changes automatically based on data. Just left click on it and select Edit Data. Deliver and pitch your topic in the best possible manner with this Resource Administration Accounting Scorecard With Total Spending Professional PDF. Use them to share invaluable insights on Supplier Category, Cycle Time, Top Suppliers and impress your audience. This template can be altered and modified as per your expectations. So, grab it now.
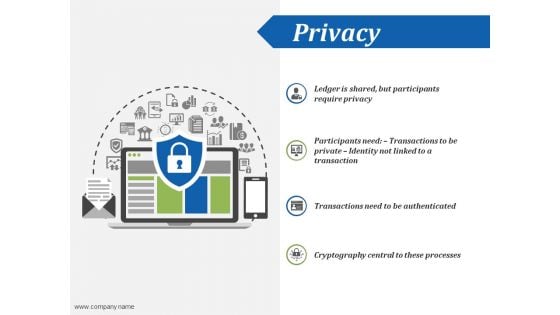
Privacy Ppt PowerPoint Presentation Outline File Formats
This is a privacy ppt powerpoint presentation outline file formats. This is a four stage process. The stages in this process are transactions need to be authenticated, cryptography central to these processes, icons, strategy.
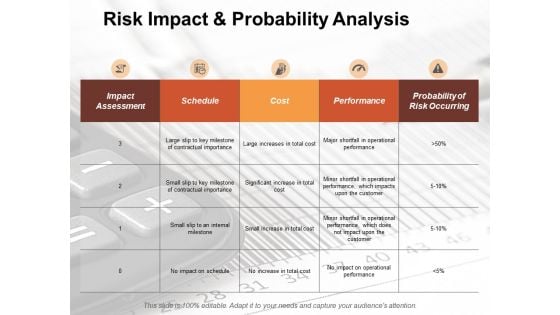
Risk Impact And Probability Analysis Risk Estimator Ppt PowerPoint Presentation File Design Inspiration
This is a risk impact and probability analysis risk estimator ppt powerpoint presentation file design inspiration. This is a five stage process. The stages in this process are business, management, strategy, analysis, icons.
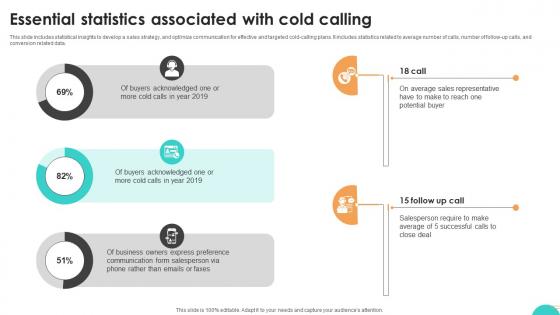
Ultimate Guide To Cold Essential Statistics Associated With Cold Calling SA SS V
This slide includes statistical insights to develop a sales strategy, and optimize communication for effective and targeted cold-calling plans. It includes statistics related to average number of calls, number of follow-up calls, and conversion related data. Formulating a presentation can take up a lot of effort and time, so the content and message should always be the primary focus. The visuals of the PowerPoint can enhance the presenters message, so our Ultimate Guide To Cold Essential Statistics Associated With Cold Calling SA SS V was created to help save time. Instead of worrying about the design, the presenter can concentrate on the message while our designers work on creating the ideal templates for whatever situation is needed. Slidegeeks has experts for everything from amazing designs to valuable content, we have put everything into Ultimate Guide To Cold Essential Statistics Associated With Cold Calling SA SS V. This slide includes statistical insights to develop a sales strategy, and optimize communication for effective and targeted cold-calling plans. It includes statistics related to average number of calls, number of follow-up calls, and conversion related data.
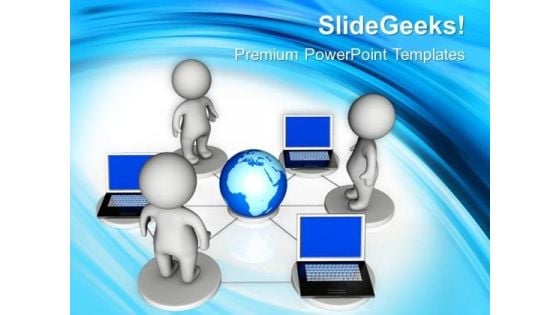
Global Networking Computer PowerPoint Templates And PowerPoint Themes 0712
Global Networking Computer PowerPoint Templates And PowerPoint Themes Power Point-Microsoft Powerpoint Templates and Background with global networking Establish your knowledge of the system. Trace the circuit with our Global Networking Computer PowerPoint Templates And PowerPoint Themes 0712.

Four Circles For Information Display Powerpoint Templates
This PowerPoint slide contains graphics of four circles. This professional slide may be used for visual explanation of data. Adjust the above diagram in your business presentations to give professional impact.
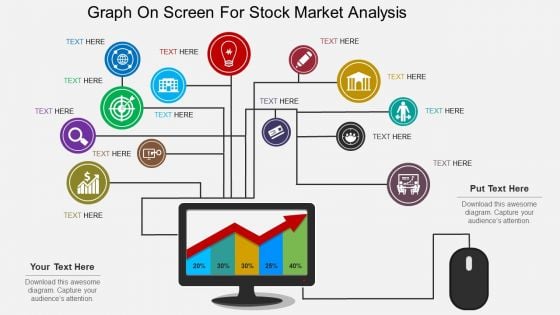
Graph On Screen For Stock Market Analysis Powerpoint Template
This PowerPoint slide contains computer screen with business graph. This professional slide may be used for visual explanation of data. Adjust the above diagram in your business presentations to give professional impact.
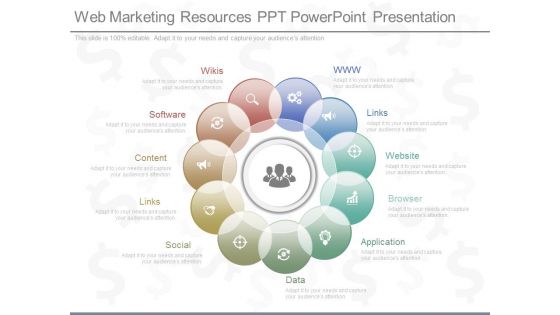
Web Marketing Resources Ppt Powerpoint Presentation
This is a web marketing resources ppt powerpoint presentation. This is a eleven stage process. The stages in this process are www, links, website, browser, application, data, social, links, content, software, wikis.
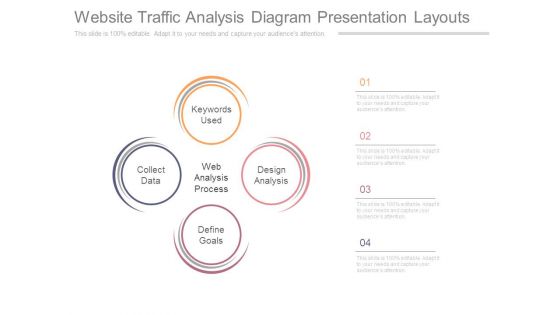
Website Traffic Analysis Diagram Presentation Layouts
This is a website traffic analysis diagram presentation layouts. This is a four stage process. The stages in this process are keywords used, design analysis, define goals, collect data, web analysis process.
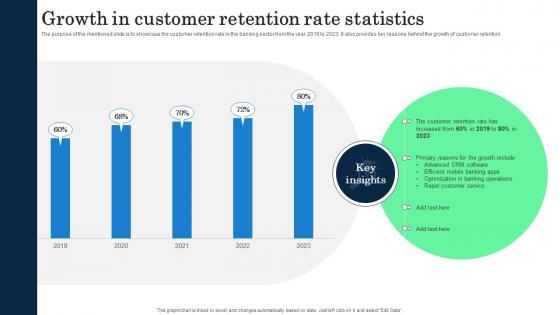
Growth In Customer Retention Rate Statistics Incorporating Banking Operational Growth
The purpose of the mentioned slide is to showcase the customer retention rate in the banking sector from the year 2019 to 2023. it also provides key reasons behind the growth of customer retention. The Growth In Customer Retention Rate Statistics Incorporating Banking Operational Growth is a compilation of the most recent design trends as a series of slides. It is suitable for any subject or industry presentation, containing attractive visuals and photo spots for businesses to clearly express their messages. This template contains a variety of slides for the user to input data, such as structures to contrast two elements, bullet points, and slides for written information. Slidegeeks is prepared to create an impression. The purpose of the mentioned slide is to showcase the customer retention rate in the banking sector from the year 2019 to 2023. it also provides key reasons behind the growth of customer retention
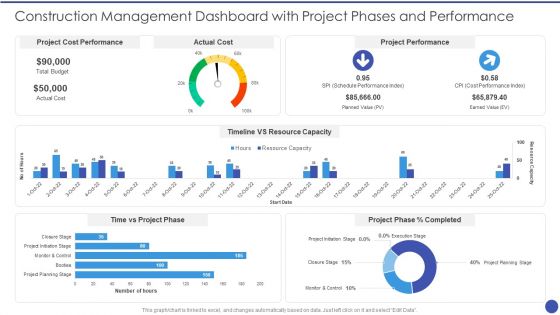
Construction Management Dashboard With Project Phases And Performance Inspiration PDF
This graph for chart is linked to excel, and changes automatically based on data. Just left click on it and select Edit Data. Deliver and pitch your topic in the best possible manner with this Construction Management Dashboard With Project Phases And Performance Inspiration PDF. Use them to share invaluable insights on Project Cost Performance, Actual Cost, Project Performance, Timeline VS Resource Capacity, Time vs Project Phase and impress your audience. This template can be altered and modified as per your expectations. So, grab it now.
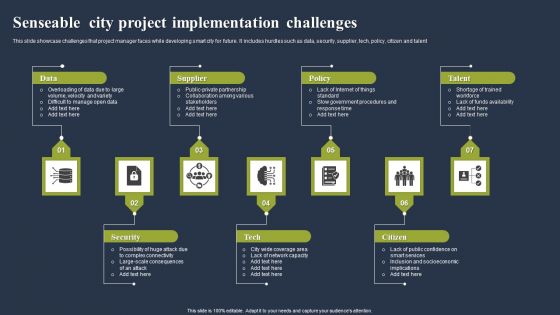
Senseable City Project Implementation Challenges Topics PDF
This slide showcase challenges that project manager faces while developing smart city for future. It includes hurdles such as data, security, supplier, tech, policy, citizen and talent. Presenting Senseable City Project Implementation Challenges Topics PDF to dispense important information. This template comprises seven stages. It also presents valuable insights into the topics including Data, Supplier, Policy. This is a completely customizable PowerPoint theme that can be put to use immediately. So, download it and address the topic impactfully.
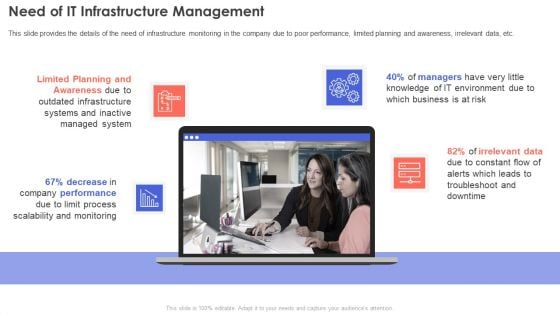
IT Infrastructure Management Need Of IT Infrastructure Management Diagrams PDF
This slide provides the details of the need of infrastructure monitoring in the company due to poor performance, limited planning and awareness, irrelevant data, etc.Presenting IT Infrastructure Management Need Of IT Infrastructure Management Diagrams PDF to provide visual cues and insights. Share and navigate important information on four stages that need your due attention. This template can be used to pitch topics like Irrelevant Data, Limited Planning, Performance Due. In addtion, this PPT design contains high resolution images, graphics, etc, that are easily editable and available for immediate download.
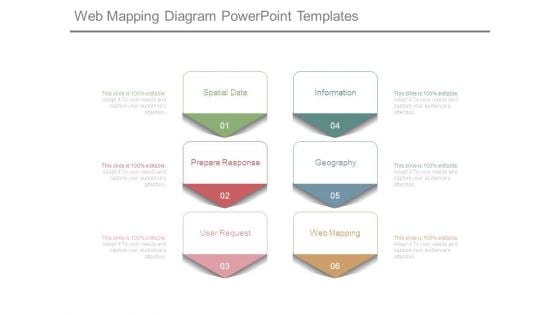
Web Mapping Diagram Powerpoint Templates
This is a web mapping diagram powerpoint templates. This is a six stage process. The stages in this process are spatial data, prepare response, user request, information, geography, web mapping.
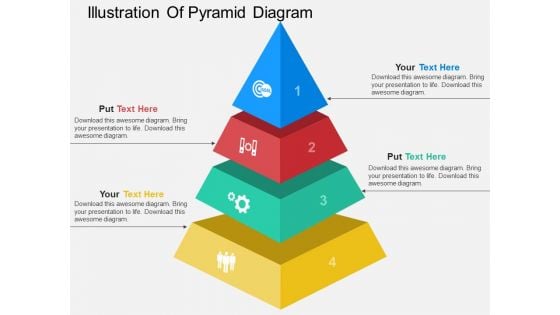
Illustration Of Pyramid Diagram Powerpoint Template
This PowerPoint slide contains illustration of pyramid diagram. This professional slide may be used for visual explanation of data. Adjust the above diagram in your business presentations to give professional impact.
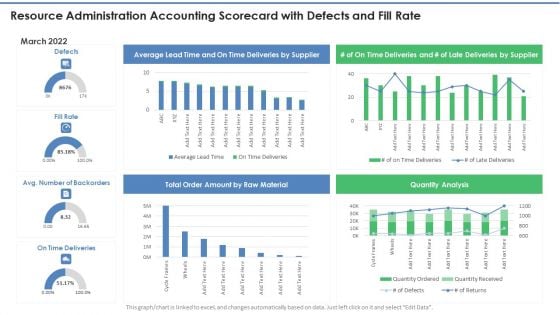
Resource Administration Accounting Scorecard With Defects And Fill Rate Mockup PDF
This graph or chart is linked to excel, and changes automatically based on data. Just left click on it and select Edit Data. Deliver and pitch your topic in the best possible manner with this Resource Administration Accounting Scorecard With Defects And Fill Rate Mockup PDF. Use them to share invaluable insights on Total Order Amount, Raw Material, Quantity Analysis and impress your audience. This template can be altered and modified as per your expectations. So, grab it now.
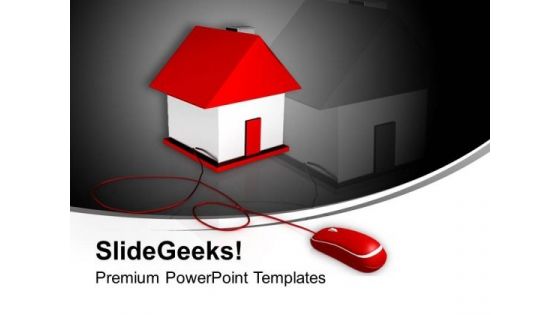
House Connected To A Computer Mouse PowerPoint Templates Ppt Backgrounds For Slides 0213
We present our House Connected To A Computer Mouse PowerPoint Templates PPT Backgrounds For Slides 0213.Download and present our Computer PowerPoint Templates because Our PowerPoint Templates and Slides will let you Illuminate the road ahead to Pinpoint the important landmarks along the way. Use our Construction PowerPoint Templates because you should once Tap the ingenuity of our PowerPoint Templates and Slides. They are programmed to succeed. Download and present our Network Diagrams PowerPoint Templates because you can Break through with our PowerPoint Templates and Slides. Bring down the mental barriers of your audience. Download our Communication PowerPoint Templates because Our PowerPoint Templates and Slides are topically designed to provide an attractive backdrop to any subject. Download and present our Technology PowerPoint Templates because Our PowerPoint Templates and Slides will let you Leave a lasting impression to your audiences. They possess an inherent longstanding recall factor.Use these PowerPoint slides for presentations relating to House connected to a computer mouse, communication, construction, computer, network diagrams, technology. The prominent colors used in the PowerPoint template are Red, White, Black. Our House Connected To A Computer Mouse PowerPoint Templates Ppt Backgrounds For Slides 0213 are designed by an avant-garde team. They are always abreast of the state of the art.
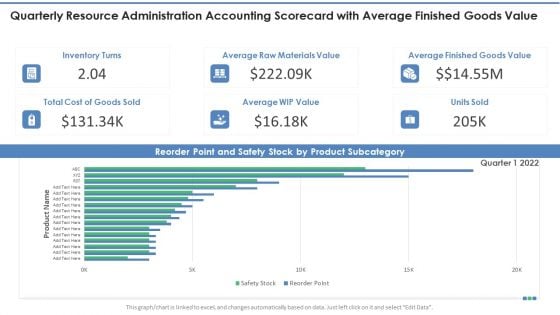
Quarterly Resource Administration Accounting Scorecard With Average Finished Goods Value Introduction PDF
This graph or chart is linked to excel, and changes automatically based on data. Just left click on it and select Edit Data. Deliver an awe inspiring pitch with this creative Quarterly Resource Administration Accounting Scorecard With Average Finished Goods Value Introduction PDF bundle. Topics like Inventory Turns, Average WIP Value, Total Cost Goods can be discussed with this completely editable template. It is available for immediate download depending on the needs and requirements of the user.
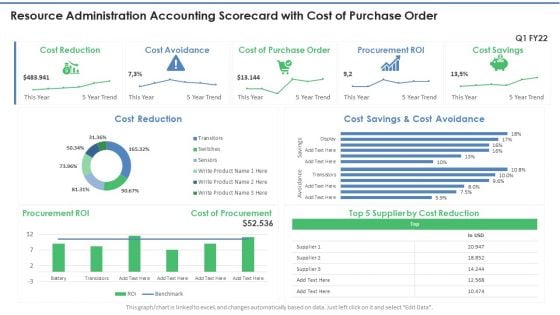
Resource Administration Accounting Scorecard With Cost Of Purchase Order Download PDF
This graph or chart is linked to excel, and changes automatically based on data. Just left click on it and select Edit Data. Deliver an awe inspiring pitch with this creative Resource Administration Accounting Scorecard With Cost Of Purchase Order Download PDF bundle. Topics like Cost Reduction, Cost Avoidance, Procurement ROI can be discussed with this completely editable template. It is available for immediate download depending on the needs and requirements of the user.

Resource Administration Accounting Scorecard With Order And Inventory Details Mockup PDF
This graph or chart is linked to excel, and changes automatically based on data. Just left click on it and select Edit Data. Deliver and pitch your topic in the best possible manner with this Resource Administration Accounting Scorecard With Order And Inventory Details Mockup PDF. Use them to share invaluable insights on Volume Today, Financial Performance, State wise and impress your audience. This template can be altered and modified as per your expectations. So, grab it now.
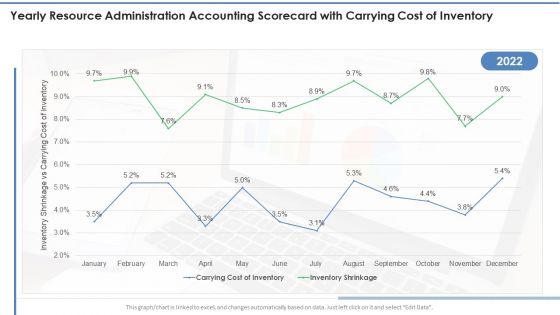
Yearly Resource Administration Accounting Scorecard With Carrying Cost Of Inventory Slides PDF
This graph or chart is linked to excel, and changes automatically based on data. Just left click on it and select Edit Data. Deliver an awe inspiring pitch with this creative Yearly Resource Administration Accounting Scorecard With Carrying Cost Of Inventory Slides PDF bundle. Topics like Carrying Cost Inventory, Inventory Shrinkage can be discussed with this completely editable template. It is available for immediate download depending on the needs and requirements of the user.
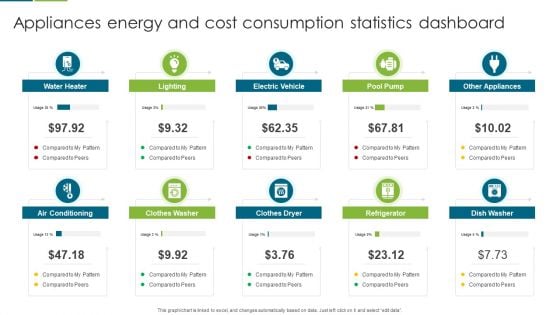
Appliances Energy And Cost Consumption Statistics Dashboard Download PDF
This graph or chart is linked to excel, and changes automatically based on data. Just left click on it and select edit data. Presenting Appliances Energy And Cost Consumption Statistics Dashboard Download PDF to dispense important information. This template comprises ten stages. It also presents valuable insights into the topics including Water Heater, Electric Vehicle, Pool Pump. This is a completely customizable PowerPoint theme that can be put to use immediately. So, download it and address the topic impactfully.
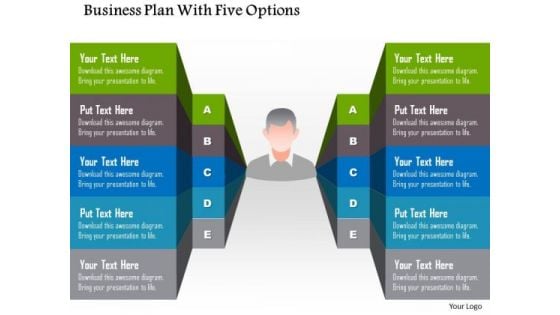
Business Diagram Business Plan With Five Options Presentation Template
This business slide helps to displays business plan with five options. This diagram can help by summarizing the key features of the data. Use this editable diagram for your business and management related presentations.
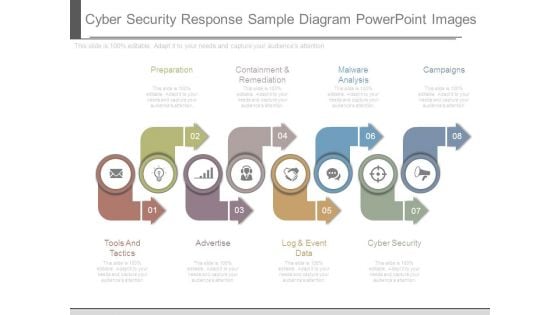
Cyber Security Response Sample Diagram Powerpoint Images
This is a cyber security response sample diagram powerpoint images. This is a eight stage process. The stages in this process are preparation, containment and remediation, malware analysis, campaigns, cyber security, log and event data, advertise, tools and tactics.
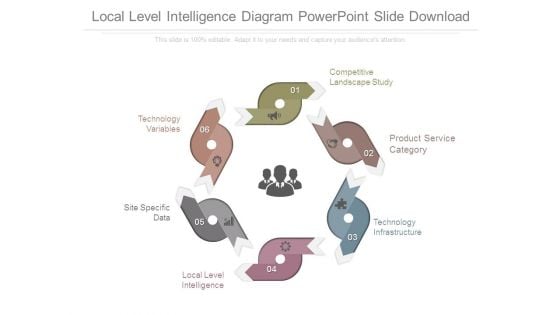
Local Level Intelligence Diagram Powerpoint Slide Download
This is a local level intelligence diagram powerpoint slide download. This is a six stage process. The stages in this process are technology variables, site specific, data, local level intelligence, technology infrastructure, product service category, competitive landscape study.
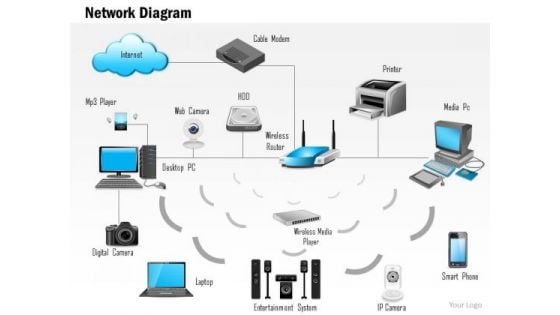
1 Network Diagram Showing A Fully Connected Home Connected To The Internet Ppt Slides
To explain the internet connectivity for domestic use, you may use this Powerpoint image slide. This slide contains the graphic of network diagram which displays the internet connected home. Build a presentation for internet connectivity related topics by using the network PPT slide.
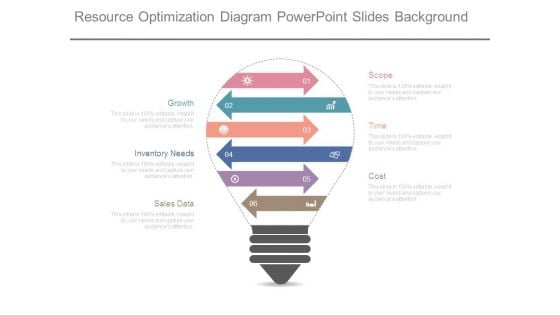
Resource Optimization Diagram Powerpoint Slides Background
This is a resource optimization diagram powerpoint slides background. This is a six stage process. The stages in this process are scope, time, cost, growth, inventory needs, sales data.

Set Of Seven Vertical Steps Powerpoint Templates
This PowerPoint slide contains graphics of seven vertical steps. This professional slide may be used for visual explanation of data. Adjust the above diagram in your business presentations to give professional impact.
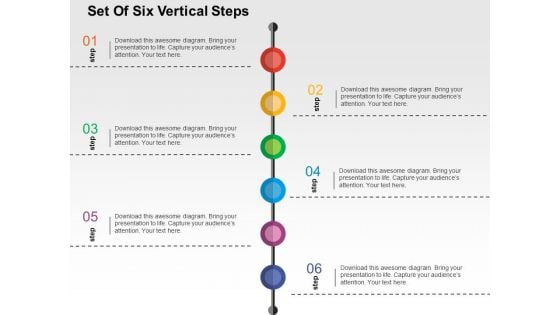
Set Of Six Vertical Steps Powerpoint Templates
This PowerPoint slide contains graphics of six vertical steps. This professional slide may be used for visual explanation of data. Adjust the above diagram in your business presentations to give professional impact.
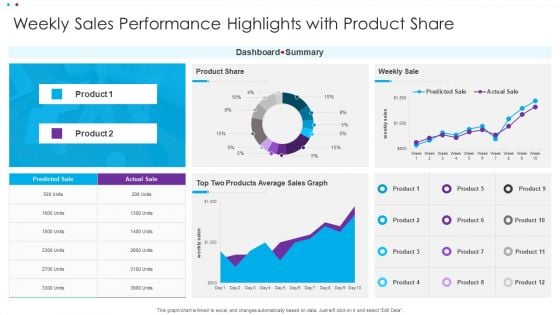
Weekly Sales Performance Highlights With Product Share Ppt File Information PDF
This graph or chart is linked to excel, and changes automatically based on data. Just left click on it and select Edit Data. Pitch your topic with ease and precision using this Weekly Sales Performance Highlights With Product Share Ppt File Information PDF. This layout presents information on Dashboard Summary, Weekly Sale, Product Share. It is also available for immediate download and adjustment. So, changes can be made in the color, design, graphics or any other component to create a unique layout.
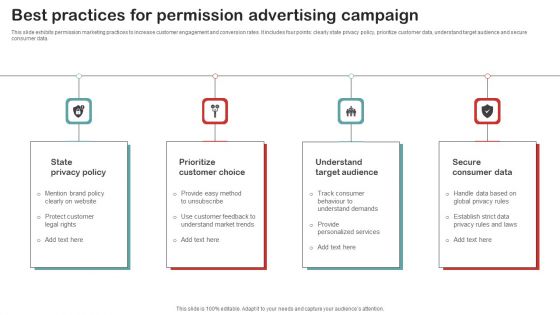
Best Practices For Permission Advertising Campaign Mockup PDF
This slide exhibits permission marketing practices to increase customer engagement and conversion rates. It includes four points clearly state privacy policy, prioritize customer data, understand target audience and secure consumer data. Presenting Best Practices For Permission Advertising Campaign Mockup PDF to dispense important information. This template comprises four stages. It also presents valuable insights into the topics including Understand Target Audience, Secure Consumer Data, Prioritize Customer Choice. This is a completely customizable PowerPoint theme that can be put to use immediately. So, download it and address the topic impactfully.
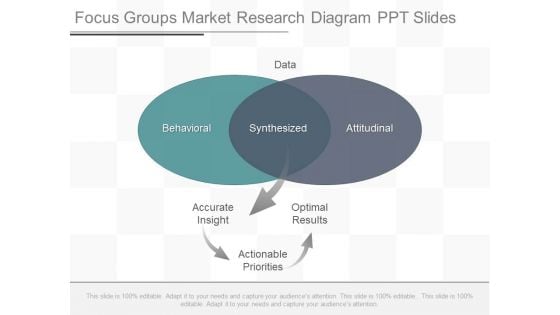
Focus Groups Market Research Diagram Ppt Slides
This is a focus groups market research diagram ppt slides. This is a two stage process. The stages in this process are data, behavioral, synthesized, attitudinal, accurate insight, optimal results, actionable priorities.
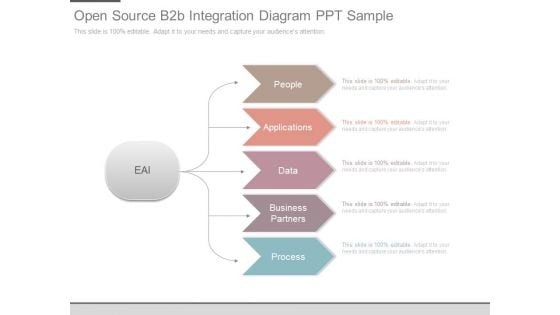
Open Source B2b Integration Diagram Ppt Sample
This is a open source b2b integration diagram ppt sample. This is a five stage process. The stages in this process are eai, people, applications, data, business partners, process.
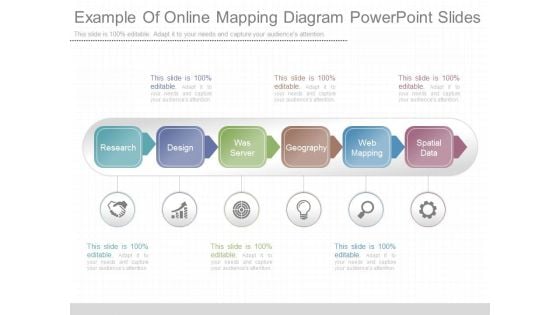
Example Of Online Mapping Diagram Powerpoint Slides
This is a example of online mapping diagram powerpoint slides. This is a six stage process. The stages in this process are research, design, was server, geography, web mapping, spatial data.
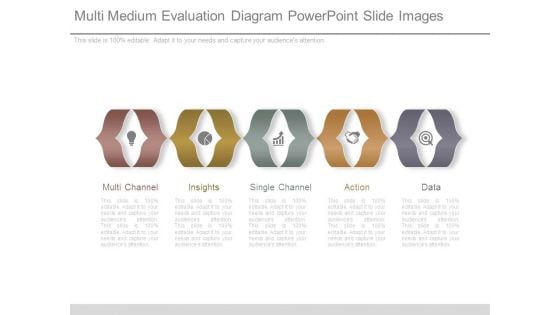
Multi Medium Evaluation Diagram Powerpoint Slide Images
This is a multi medium evaluation diagram powerpoint slide images. This is a five stage process. The stages in this process are multi channel, insights, single channel, action, data.
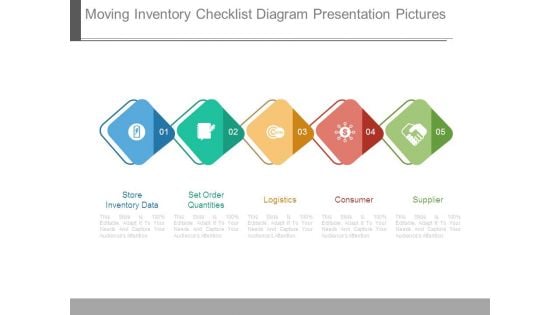
Moving Inventory Checklist Diagram Presentation Pictures
This is a moving inventory checklist diagram presentation pictures. This is a five stage process. The stages in this process are store inventory data, set order quantities, logistics, consumer, supplier.
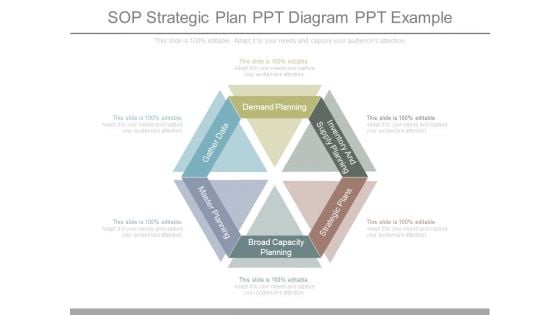
Sop Strategic Plan Ppt Diagram Ppt Example
This is a sop strategic plan ppt diagram ppt example. This is a six stage process. The stages in this process are demand planning, inventory and supply planning, strategic plans, broad capacity planning, master planning, gather data.
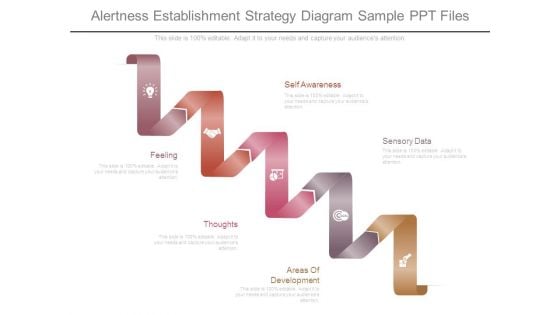
Alertness Establishment Strategy Diagram Sample Ppt Files
This is a alertness establishment strategy diagram sample ppt files. This is a five stage process. The stages in this process are self awareness, sensory data, feeling, thoughts, areas of development.
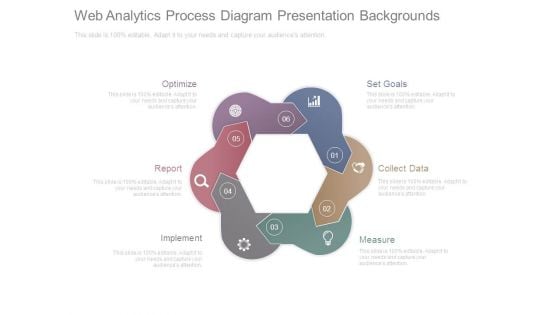
Web Analytics Process Diagram Presentation Backgrounds
This is a web analytics process diagram presentation backgrounds. This is a six stage process. The stages in this process are optimize, report, implement, measure, collect data, set goals.
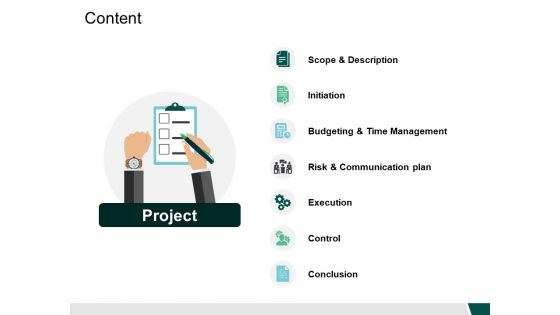
Content Execution Ppt PowerPoint Presentation Outline Vector
This is a content execution ppt powerpoint presentation outline vector. This is a seven stage process. The stages in this process are icons, planning, strategy, analysis, marketing.
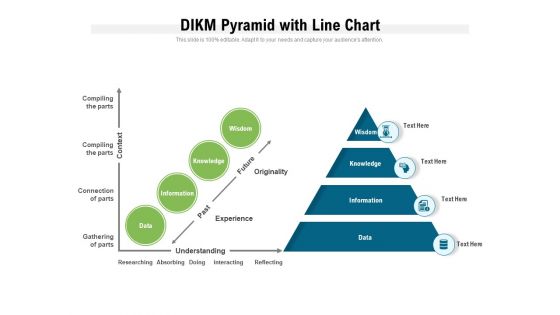
DIKM Pyramid With Line Chart Ppt PowerPoint Presentation Summary Format Ideas PDF
Presenting dikm pyramid with line chart ppt powerpoint presentation summary format ideas pdf to dispense important information. This template comprises four stages. It also presents valuable insights into the topics including wisdom, knowledge, information, data, originality, experience, context, understanding. This is a completely customizable PowerPoint theme that can be put to use immediately. So, download it and address the topic impactfully.
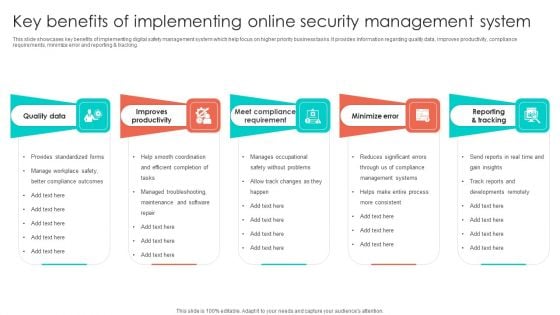
Key Benefits Of Implementing Online Security Management System Infographics PDF
This slide showcases key benefits of implementing digital safety management system which help focus on higher priority business tasks. It provides information regarding quality data, improves productivity, compliance requirements, minimize error and reporting and tracking. Presenting Key Benefits Of Implementing Online Security Management System Infographics PDF to dispense important information. This template comprises five stages. It also presents valuable insights into the topics including Improves Productivity, Quality Data, Minimize Error. This is a completely customizable PowerPoint theme that can be put to use immediately. So, download it and address the topic impactfully.

 Home
Home