Data Governance
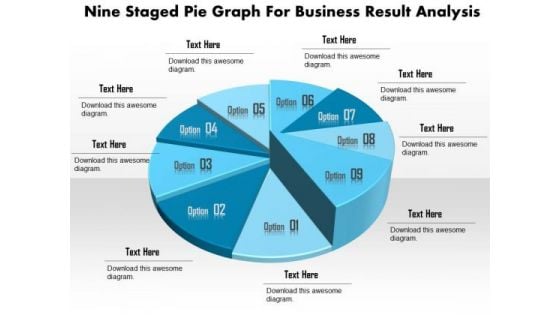
Business Diagram Nine Staged Pie Graph For Business Result Analysis Presentation Template
This business slide displays nine staged pie chart. This diagram is a data visualization tool that gives you a simple way to present statistical information. This slide helps your audience examine and interpret the data you present.
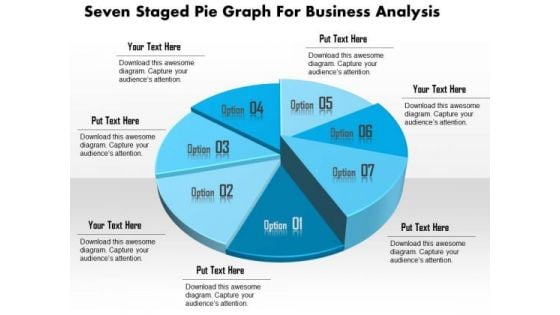
Business Diagram Seven Staged Pie Graph For Business Analysis Presentation Template
This business slide displays seven staged pie chart. This diagram is a data visualization tool that gives you a simple way to present statistical information. This slide helps your audience examine and interpret the data you present.
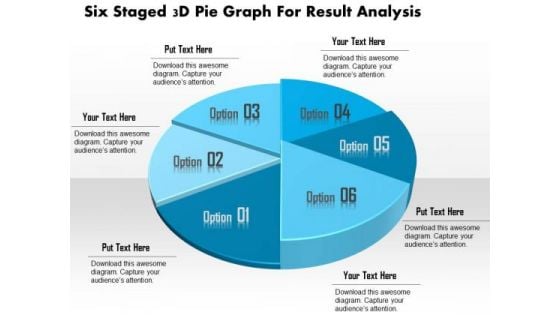
Business Diagram Six Staged 3d Pie Graph For Result Analysis Presentation Template
This business slide displays six staged pie chart. This diagram is a data visualization tool that gives you a simple way to present statistical information. This slide helps your audience examine and interpret the data you present.
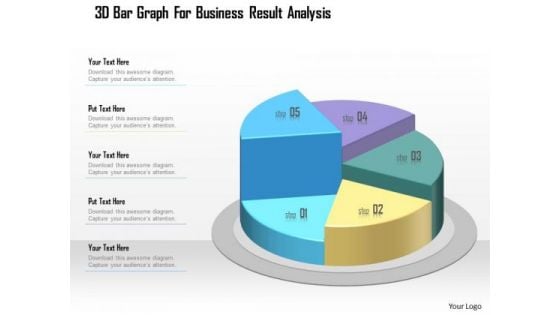
Business Diagram 3d Bar Graph For Business Result Analysis Presentation Template
This business slide displays five staged pie chart. This diagram is a data visualization tool that gives you a simple way to present statistical information. This slide helps your audience examine and interpret the data you present.
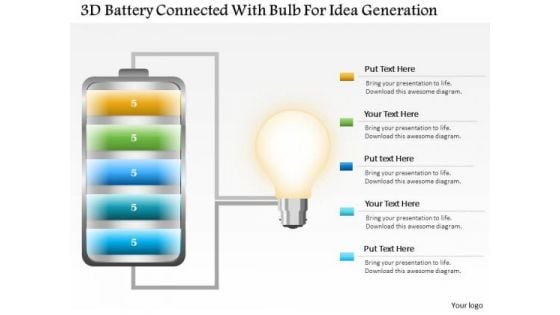
Business Diagram 3d Battery Connected With Bulb For Idea Generation PowerPoint Slide
This business slide displays battery icon connected with bulb. This diagram is a data visualization tool that gives you a simple way to present statistical information. This slide helps your audience examine and interpret the data you present.
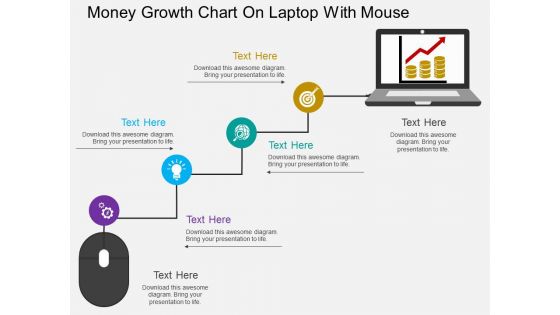
Money Growth Chart On Laptop With Mouse Powerpoint Template
This business slide displays money growth chart on laptop with mouse. This diagram is a data visualization tool that gives you a simple way to present statistical information. This slide helps your audience examine and interpret the data you present.

Three Text Tags Compare Chart Powerpoint Slides
This PowerPoint template has been designed with text tags and percentage data. You may download this PPT slide to display data comparison and analysis. Add this slide to your presentation and impress your superiors.
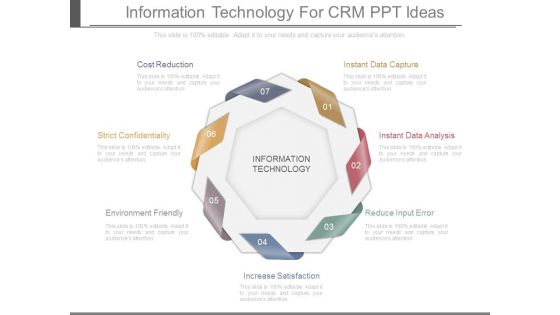
Information Technology For Crm Ppt Ideas
This is a information technology for crm ppt ideas. This is a seven stage process. The stages in this process are cost reduction, strict confidentiality, environment friendly, instant data capture, instant data analysis, reduce input error, increase satisfaction, information technology.
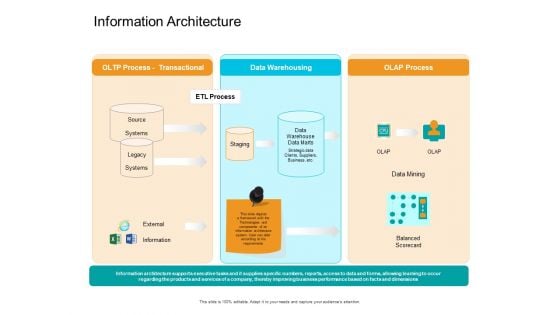
Facts Assessment Information Architecture Ppt PowerPoint Presentation Pictures Graphics Template PDF
Presenting this set of slides with name facts assessment information architecture ppt powerpoint presentation pictures graphics template pdf. This is a three stage process. The stages in this process are oltp process transactional, data warehousing, olap process, etl process, external, information, balanced scorecard, data mining, data warehouse data marts. This is a completely editable PowerPoint presentation and is available for immediate download. Download now and impress your audience.
Six Unidirectional Arrows With Business Icons Process Flow Powerpoint Templates
This business slide displays spiral road map design with icons. This diagram is a data visualization tool that gives you a simple way to present statistical information. This slide helps your audience examine and interpret the data you present.
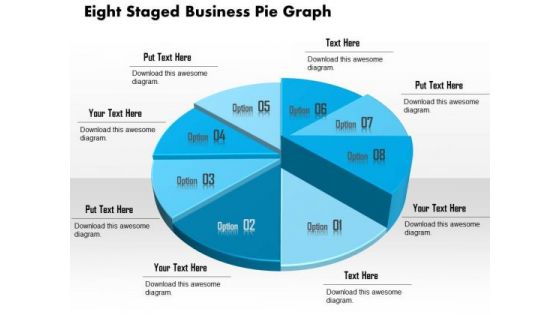
Business Diagram Eight Staged Business Pie Graph Presentation Template
This business slide displays eight staged pie chart. This diagram is a data visualization tool that gives you a simple way to present statistical information. This slide helps your audience examine and interpret the data you present.
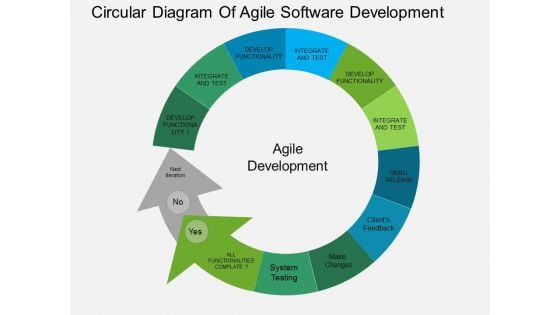
Circular Diagram Of Agile Software Development Powerpoint Templates
This PowerPoint template has been designed with circular diagram This diagram is a data visualization tool that gives you a simple way to present statistical information. This slide helps your audience examine and interpret the data you present.
Three Text Boxes With Percentage Values And Icons Powerpoint Slides
This PowerPoint template has been designed with text boxes and percentage data. You may download this PPT slide to display data comparison and analysis. Add this slide to your presentation and impress your superiors.
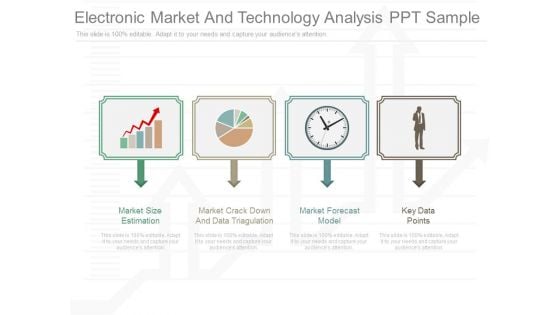
Electronic Market And Technology Analysis Ppt Sample
This is a electrnic market and technology analysis ppt sample. This is a four stage process. The stages in this process are market size estimation, market crack down and data triagulation, market forecast model, key data points.
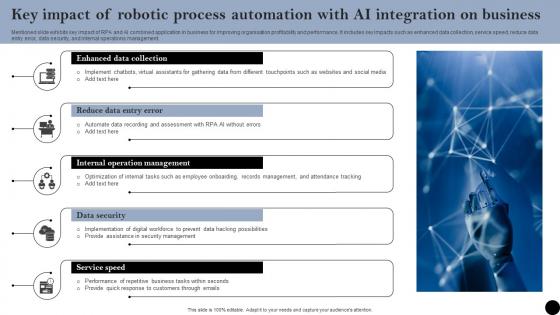
Key Impact Of Robotic Process Automation With AI Integration On Business Infographics Pdf
Mentioned slide exhibits key impact of RPA and AI combined application in business for improving organisation profitability and performance. It includes key impacts such as enhanced data collection, service speed, reduce data entry error, data security, and internal operations management. Showcasing this set of slides titled Key Impact Of Robotic Process Automation With AI Integration On Business Infographics Pdf. The topics addressed in these templates are Reduce Data Entry, Data Security, Internal Operations Management. All the content presented in this PPT design is completely editable. Download it and make adjustments in color, background, font etc. as per your unique business setting. Mentioned slide exhibits key impact of RPA and AI combined application in business for improving organisation profitability and performance. It includes key impacts such as enhanced data collection, service speed, reduce data entry error, data security, and internal operations management.
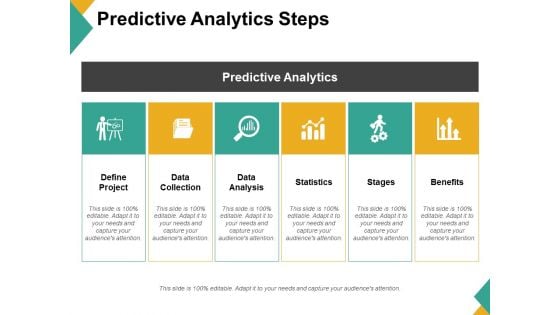
Predictive Analytics Steps Ppt PowerPoint Presentation Styles Guidelines
This is a predictive analytics steps ppt powerpoint presentation styles guidelines. This is a six stage process. The stages in this process are define project, data collection, data analysis, statistics, stages, benefits.
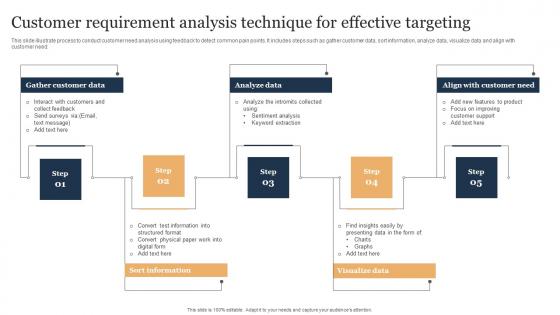
Customer Requirement Analysis Technique For Effective Targeting Mockup Pdf
This slide illustrate process to conduct customer need analysis using feedback to detect common pain points. It includes steps such as gather customer data, sort information, analyze data, visualize data and align with customer need. Pitch your topic with ease and precision using this Customer Requirement Analysis Technique For Effective Targeting Mockup Pdf. This layout presents information on Analyze Data, Align With Customer Need, Gather Customer Data, Sort Information. It is also available for immediate download and adjustment. So, changes can be made in the color, design, graphics or any other component to create a unique layout. This slide illustrate process to conduct customer need analysis using feedback to detect common pain points. It includes steps such as gather customer data, sort information, analyze data, visualize data and align with customer need.
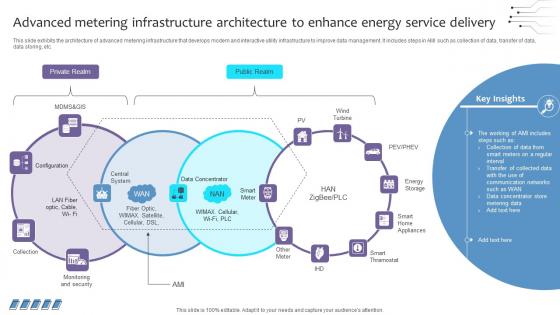
Empowering The Future Advanced Metering Infrastructure Architecture To Enhance IoT SS V
This slide exhibits the architecture of advanced metering infrastructure that develops modern and interactive utility infrastructure to improve data management. It includes steps in AMI such as collection of data, transfer of data, data storing, etc. There are so many reasons you need a Empowering The Future Advanced Metering Infrastructure Architecture To Enhance IoT SS V. The first reason is you can not spend time making everything from scratch, Thus, Slidegeeks has made presentation templates for you too. You can easily download these templates from our website easily. This slide exhibits the architecture of advanced metering infrastructure that develops modern and interactive utility infrastructure to improve data management. It includes steps in AMI such as collection of data, transfer of data, data storing, etc.

Market Research Analysis Template Presentation Powerpoint
This is a market research analysis template presentation powerpoint. This is a five stage process. The stages in this process are market research data analysis, web survey analysis, product research, data processing, brand valuation, market research analysis.
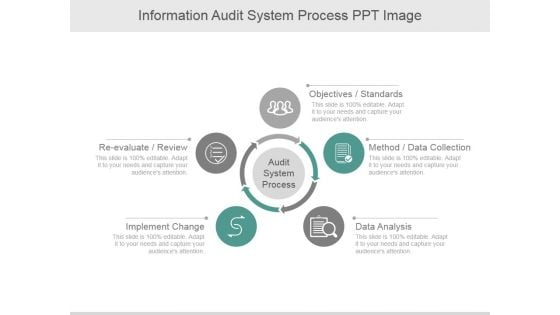
Information Audit System Process Ppt PowerPoint Presentation Ideas
This is a information audit system process ppt powerpoint presentation ideas. This is a five stage process. The stages in this process are objectives standards, method data collection, data analysis, implement change, re evaluate review.

Reducing Cost Dollar Sign With Cloud On Mobile Ppt Powerpoint Presentation Styles File Formats
This is a reducing cost dollar sign with cloud on mobile ppt powerpoint presentation styles file formats. This is a four stage process. The stages in this process are data analysis, data science, information science.

Industrial Marketing Research Ppt Background Template
This is a industrial marketing research ppt background template. This is a five stage process. The stages in this process are identify the problem, develop research design, collect data or info, process and analyze the data, create a report.
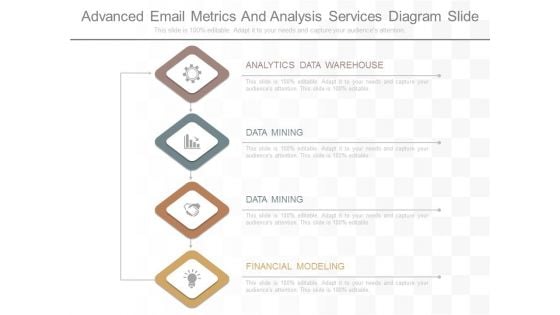
Advanced Email Metrics And Analysis Services Diagram Slide
This is a advanced email metrics and analysis services diagram slide. This is a four stage process. The stages in this process are analytics data warehouse, data mining, financial modeling.
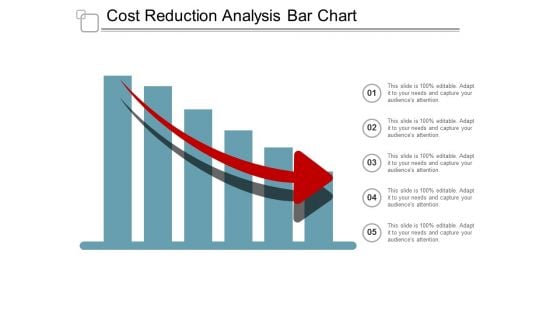
Cost Reduction Analysis Bar Chart Ppt Powerpoint Presentation File Graphics Design
This is a cost reduction analysis bar chart ppt powerpoint presentation file graphics design. This is a five stage process. The stages in this process are data analysis, data science, information science.
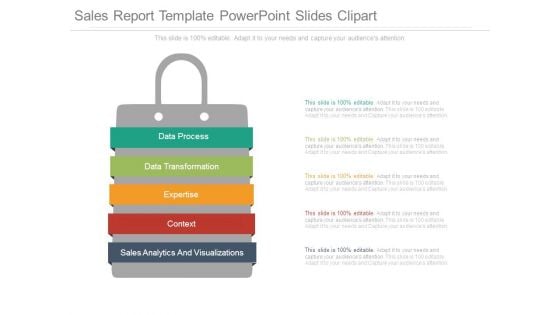
Sales Report Template Powerpoint Slides Clipart
This is a sales report template powerpoint slides clipart. This is a five stage process. The stages in this process are data process, data transformation, expertise, context, sales analytics and visualizations.
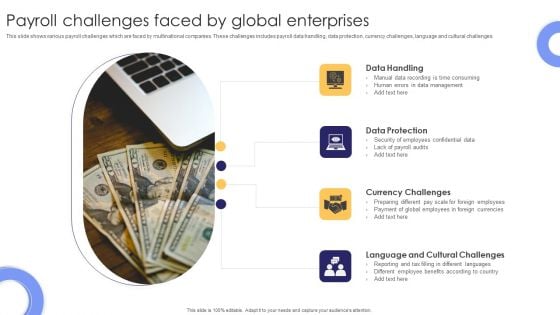
Payroll Challenges Faced By Global Enterprises Summary PDF
This slide shows various payroll challenges which are faced by multinational companies. These challenges includes payroll data handling, data protection, currency challenges, language and cultural challenges. Presenting Payroll Challenges Faced By Global Enterprises Summary PDF to dispense important information. This template comprises four stages. It also presents valuable insights into the topics including Data Handling, Data Protection, Currency Challenges . This is a completely customizable PowerPoint theme that can be put to use immediately. So, download it and address the topic impactfully.

Red Flag On Mountain For Victory PowerPoint Template
Our above funnel diagram displays processing stage that copies multiple input data sets to a single output data set. This slide is truly eye catching. Its visual appeal is magnetic in nature.
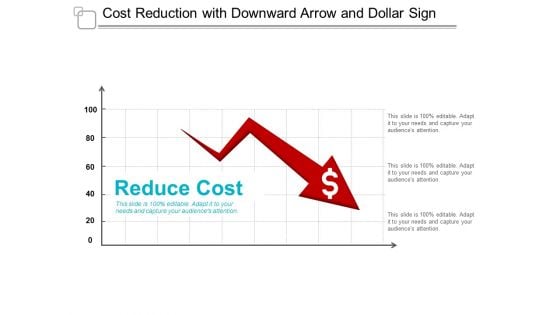
Cost Reduction With Downward Arrow And Dollar Sign Ppt Powerpoint Presentation Infographics Templates
This is a cost reduction with downward arrow and dollar sign ppt powerpoint presentation infographics templates. This is a three stage process. The stages in this process are data analysis, data science, information science.

Minimize Expenses To Reduce Business Cost Ppt Powerpoint Presentation Inspiration Pictures
This is a minimize expenses to reduce business cost ppt powerpoint presentation inspiration pictures. This is a four stage process. The stages in this process are data analysis, data science, information science.
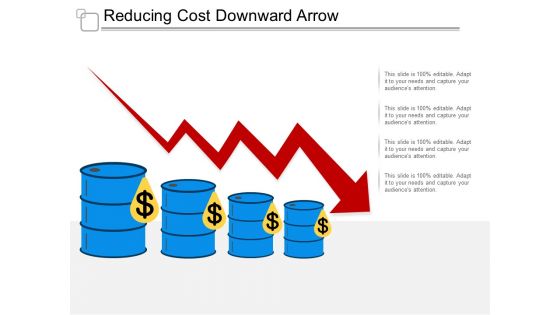
Reducing Cost Downward Arrow Ppt Powerpoint Presentation Outline Inspiration
This is a reducing cost downward arrow ppt powerpoint presentation outline inspiration. This is a four stage process. The stages in this process are data analysis, data science, information science.

Reducing Cost Vector Dollar Sign With Down Arrow Ppt Powerpoint Presentation Model Outline
This is a reducing cost vector dollar sign with down arrow ppt powerpoint presentation model outline. This is a four stage process. The stages in this process are data analysis, data science, information science.

Ways To Reduce Business Costs Ppt Powerpoint Presentation Portfolio Images
This is a ways to reduce business costs ppt powerpoint presentation portfolio images. This is a four stage process. The stages in this process are data analysis, data science, information science.
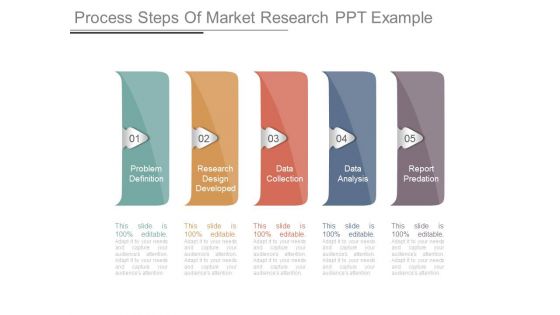
Process Steps Of Market Research Ppt Example
This is a process steps of market research ppt example. This is a five stage process. The stages in this process are problem definition, research design developed, data collection, data analysis, report predation.
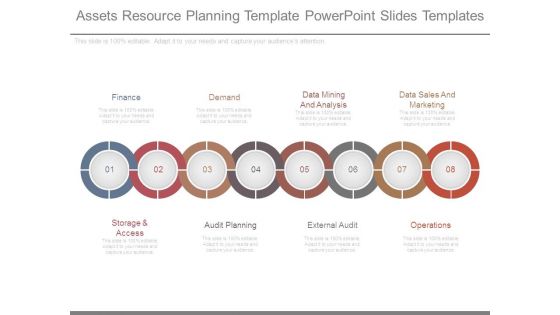
Assets Resource Planning Template Powerpoint Slides Templates
This is a assets resource planning template powerpoint slides templates. This is a eight stage process. The stages in this process are finance, storage and access, demand, data mining and analysis, external audit, data sales and marketing, operations.
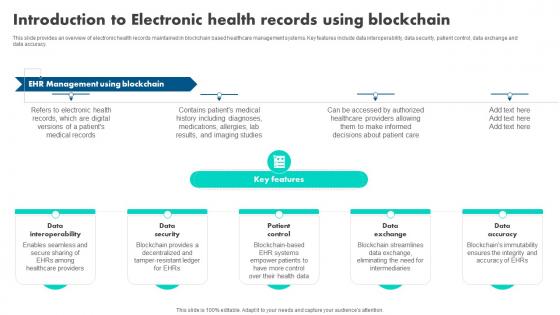
How Blockchain Is Reshaping Introduction To Electronic Health Records BCT SS V
This slide provides an overview of electronic health records maintained in blockchain based healthcare management systems. Key features include data interoperability, data security, patient control, data exchange and data accuracy. Find a pre-designed and impeccable How Blockchain Is Reshaping Introduction To Electronic Health Records BCT SS V. The templates can ace your presentation without additional effort. You can download these easy-to-edit presentation templates to make your presentation stand out from others. So, what are you waiting for Download the template from Slidegeeks today and give a unique touch to your presentation. This slide provides an overview of electronic health records maintained in blockchain based healthcare management systems. Key features include data interoperability, data security, patient control, data exchange and data accuracy.
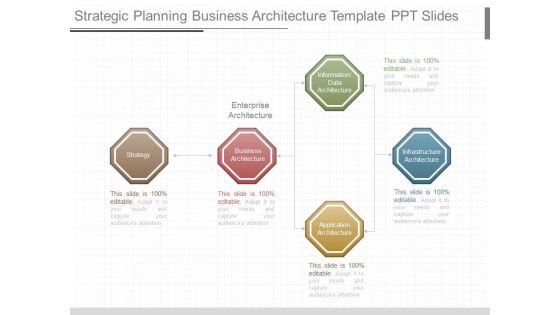
Strategic Planning Business Architecture Template Ppt Slides
This is a strategic planning business architecture template ppt slides. This is a five stage process. The stages in this process are strategy, business architecture, enterprise architecture, information data architecture, information data architecture, application architecture.
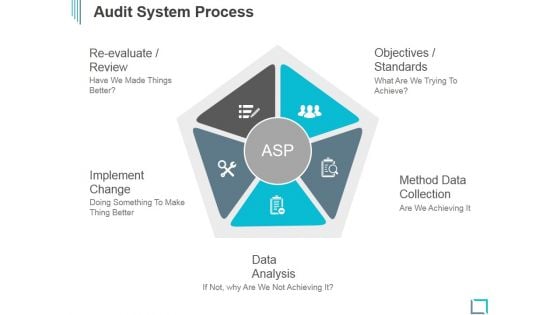
Audit System Process Ppt PowerPoint Presentation Good
This is a audit system process ppt powerpoint presentation good. This is a five stage process. The stages in this process are re evaluate review, objectives standards, implement change, method data collection, data analysis.

Basic Value Stream Mapping Slide Ppt Example
This is a basic value stream mapping slide ppt example. This is a five stage process. The stages in this process are information flow, material and data flow, timeline, process, data, customer.
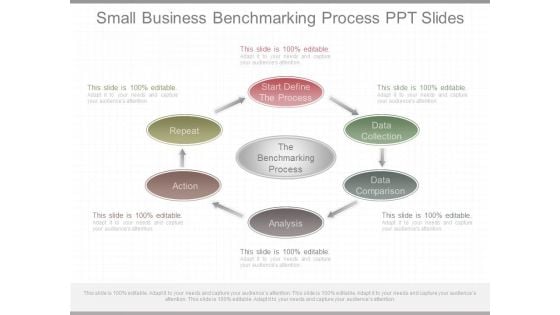
Small Business Benchmarking Process Ppt Slides
This is a small business benchmarking process ppt slides. This is a six stage process. The stages in this process are the benchmarking process, start define the process, data collection, data comparison, analysis, action, repeat.
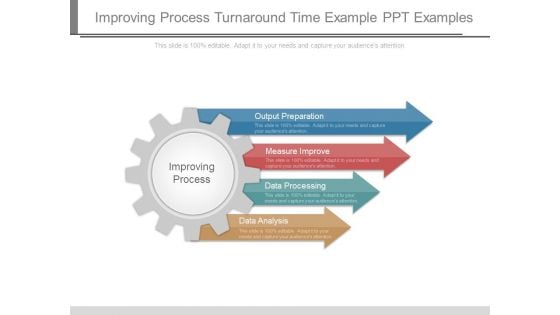
Improving Process Turnaround Time Example Ppt Examples
This is a improving process turnaround time example ppt examples. This is a four stage process. The stages in this process are output preparation, measure improve, data processing, data analysis, improving process.
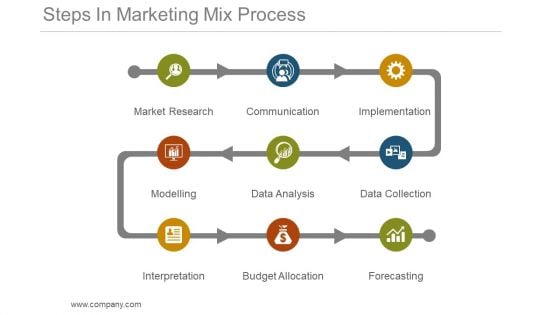
Steps In Marketing Mix Process Powerpoint Slide Deck
This is a steps in marketing mix process powerpoint slide deck. This is a nine stage process. The stages in this process are market research, communication, implementation, data collection, data analysis, modelling, interpretation, budget allocation, forecasting.
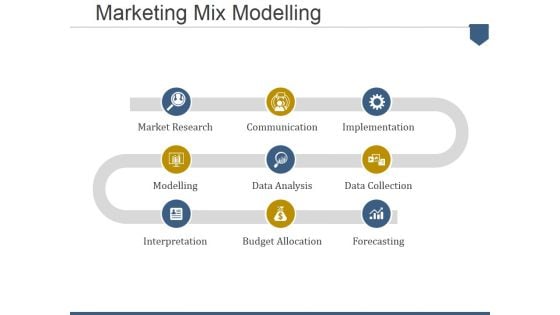
Marketing Mix Modelling Ppt PowerPoint Presentation Portfolio Graphics Template
This is a marketing mix modelling ppt powerpoint presentation portfolio graphics template. This is a three stage process. The stages in this process are market research, communication, implementation, data collection, forecasting, budget allocation, data analysis, modelling, interpretation.
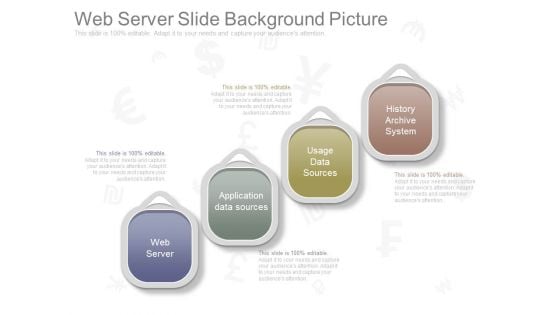
Web Server Slide Background Picture
This is a web server slide background picture. This is a four stage process. The stages in this process are web server, application data sources, usage data sources, history archive system.
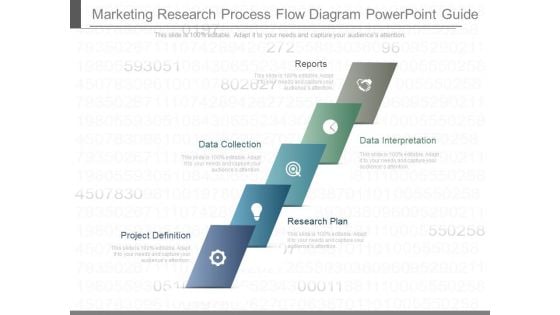
Marketing Research Process Flow Diagram Powerpoint Guide
This is a marketing research process flow diagram powerpoint guide. This is a five stage process. The stages in this process are reports, data interpretation, data collection, research plan, project definition.
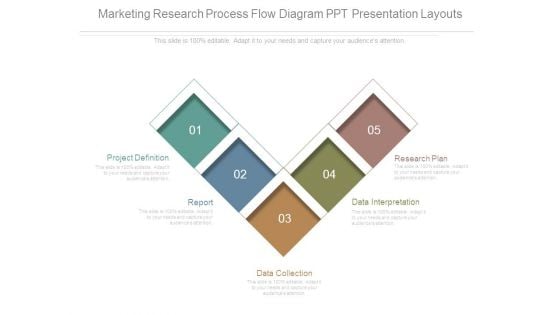
Marketing Research Process Flow Diagram Ppt Presentation Layouts
This is a marketing research process flow diagram ppt presentation layouts. This is a five stage process. The stages in this process are project definition, report, data collection, data interpretation, research plan.
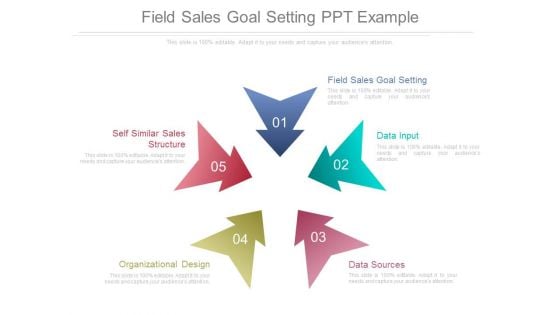
Field Sales Goal Setting Ppt Example
This is a field sales goal setting ppt example. This is a five stage process. The stages in this process are field sales goal setting, data input, data sources, organizational design, self similar sales structure.
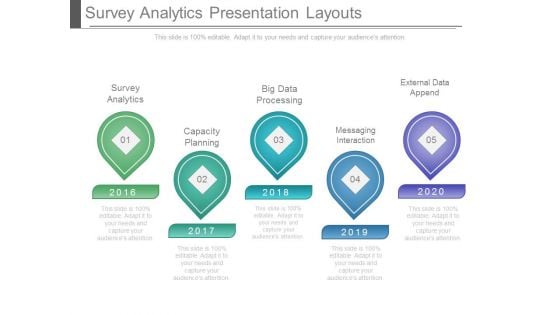
Survey Analytics Presentation Layouts
This is a survey analytics presentation layouts. This is a five stage process. The stages in this process are survey analytics, capacity planning, big data processing, messaging interaction, external data append.

Corporate Marketing Example Ppt Sample
This is a corporate marketing example ppt sample. This is a four stage process. The stages in this process are corporate marketing, big data processing, external data append, messaging interaction.
Online Niche Marketing Ppt Sample File
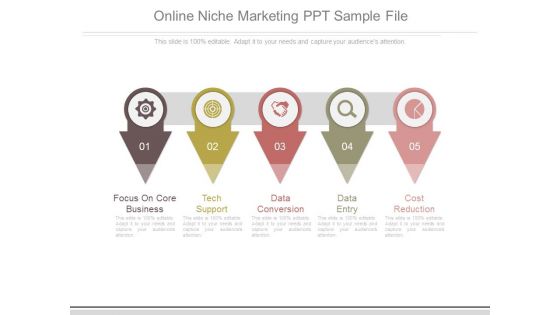
This is a online niche marketing ppt sample file. This is a five stage process. The stages in this process are focus on core business, tech support, data conversion, data entry, cost reduction.
Challenges Faced By Our Clients Template 1 Ppt PowerPoint Presentation Diagrams
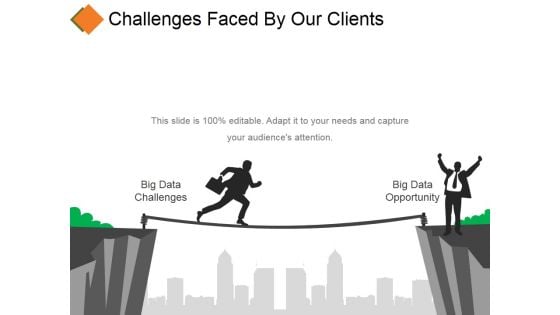
This is a challenges faced by our clients template 1 ppt powerpoint presentation diagrams. This is a two stage process. The stages in this process are big data challenges, big data opportunity, threat, communication.
Quick Scoping Review And Rapid Evidence Assessment Ppt PowerPoint Presentation Pictures Template
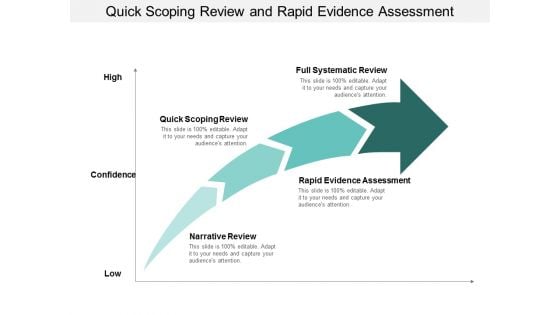
Presenting this set of slides with name quick scoping review and rapid evidence assessment ppt powerpoint presentation pictures template. This is a four stage process. The stages in this process are Data analysis, Data Review, Data Evaluation. This is a completely editable PowerPoint presentation and is available for immediate download. Download now and impress your audience.
Workforce Management Strategies For Effective Hiring Process Workforce Analytics Tools Ideas PDF
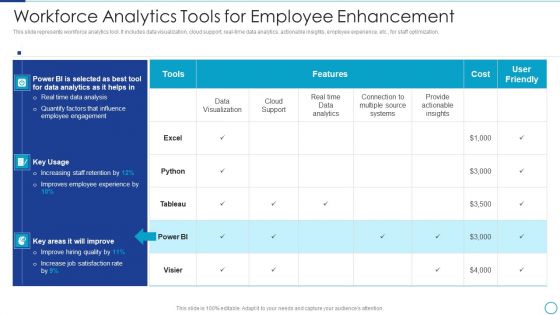
This slide represents workforce analytics tool. It includes data visualization, cloud support, real time data analytics, actionable insights, employee experience, etc. for staff optimization. Deliver an awe inspiring pitch with this creative Workforce Management Strategies For Effective Hiring Process Workforce Analytics Tools Ideas PDF bundle. Topics like Data Analytics, Systems, Data Visualization can be discussed with this completely editable template. It is available for immediate download depending on the needs and requirements of the user.
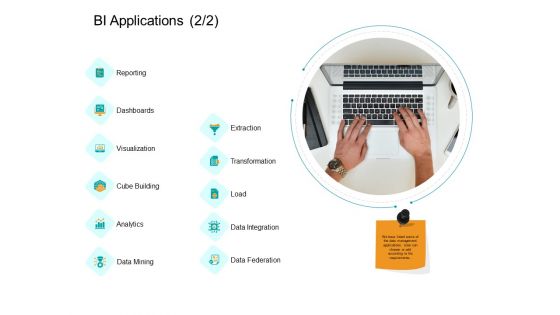
Facts Assessment BI Applications Reporting Ppt PowerPoint Presentation Model Example PDF
Presenting this set of slides with name facts assessment bi applications reporting ppt powerpoint presentation model example pdf. This is a eleven stage process. The stages in this process are reporting, dashboards, visualization, cube building, analytics, data mining, extraction, transformation load, data integration, data federation. This is a completely editable PowerPoint presentation and is available for immediate download. Download now and impress your audience.

Artificial Intelligence Machine Learning Deep Learning Machine Learning Process Ppt PowerPoint Presentation Summary Outfit PDF
Presenting this set of slides with name artificial intelligence machine learning deep learning machine learning process ppt powerpoint presentation summary outfit pdf. This is a eight stage process. The stages in this process are data gathering, data cleaning, selecting right algorithms, building model and finalising, data transformation predictions, visualisation, modelling, data. This is a completely editable PowerPoint presentation and is available for immediate download. Download now and impress your audience.
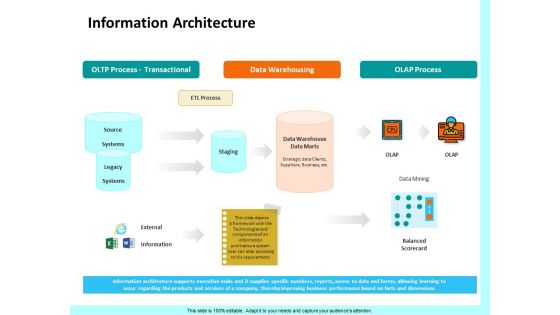
Firm Productivity Administration Information Architecture Ppt PowerPoint Presentation Gallery Skills PDF
Presenting this set of slides with name firm productivity administration information architecture ppt powerpoint presentation gallery skills pdf. This is a three stage process. The stages in this process are oltp process transactional, data warehousing, olap process, etl process, external, information, balanced scorecard, data mining, data warehouse data marts. This is a completely editable PowerPoint presentation and is available for immediate download. Download now and impress your audience.
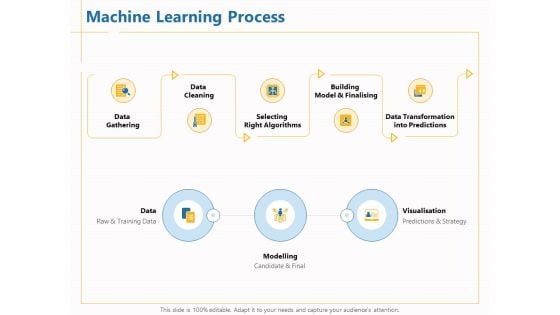
Boosting Machine Learning Machine Learning Process Ppt PowerPoint Presentation Infographic Template Demonstration PDF
Presenting this set of slides with name boosting machine learning machine learning process ppt powerpoint presentation infographic template demonstration pdf. This is a eight stage process. The stages in this process are data gathering, data cleaning, selecting right algorithms, building model and finalising, data transformation predictions, visualisation, modelling, data. This is a completely editable PowerPoint presentation and is available for immediate download. Download now and impress your audience.
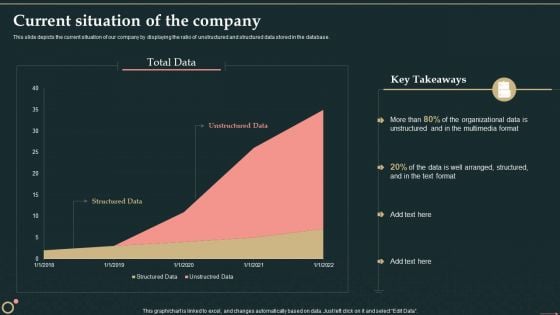
Management Information System Current Situation Of The Company Background PDF
This slide depicts the current situation of our company by displaying the ratio of unstructured and structured data stored in the database.Deliver an awe inspiring pitch with this creative Management Information System Current Situation Of The Company Background PDF bundle. Topics like Unstructured Data, Structured Data, Organizational Data can be discussed with this completely editable template. It is available for immediate download depending on the needs and requirements of the user.
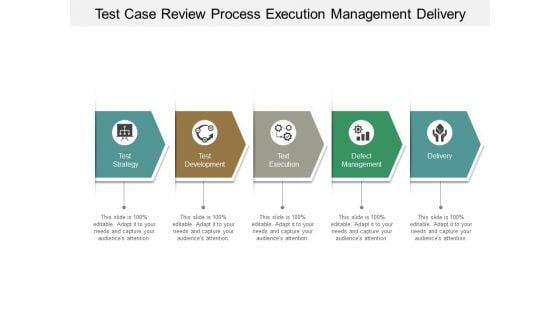
Test Case Review Process Execution Management Delivery Ppt PowerPoint Presentation Infographics Aids
Presenting this set of slides with name test case review process execution management delivery ppt powerpoint presentation infographics aids. This is a four stage process. The stages in this process are Data analysis, Data Review, Data Evaluation. This is a completely editable PowerPoint presentation and is available for immediate download. Download now and impress your audience.
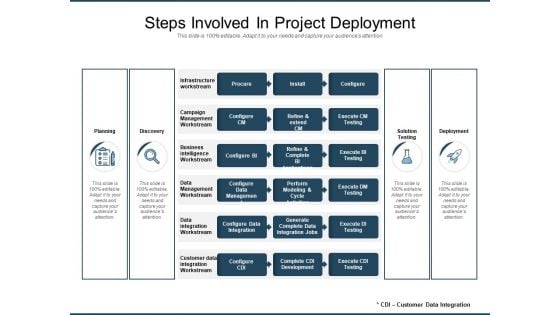
Steps Involved In Project Deployment Ppt PowerPoint Presentation Gallery Shapes PDF
Presenting this set of slides with name steps involved in project deployment ppt powerpoint presentation gallery shapes pdf. The topics discussed in these slides are planning, discovery, solution testing, deployment, data management workstream, data integration workstream, customer data integration, workstream business intelligence. This is a completely editable PowerPoint presentation and is available for immediate download. Download now and impress your audience.
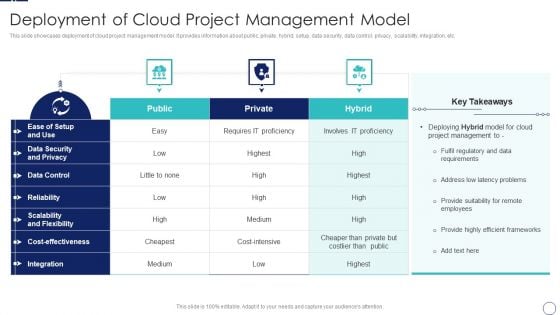
How To Implement Cloud Collaboration Deployment Of Cloud Project Management Model Pictures PDF
This slide showcases deployment of cloud project management model. It provides information about public, private, hybrid, setup, data security, data control, privacy, scalability, integration, etc. Deliver an awe inspiring pitch with this creative How To Implement Cloud Collaboration Deployment Of Cloud Project Management Model Pictures PDF bundle. Topics like Data Security, Data Control, Scalability Flexibility can be discussed with this completely editable template. It is available for immediate download depending on the needs and requirements of the user.


 Continue with Email

 Home
Home


