Data Icon
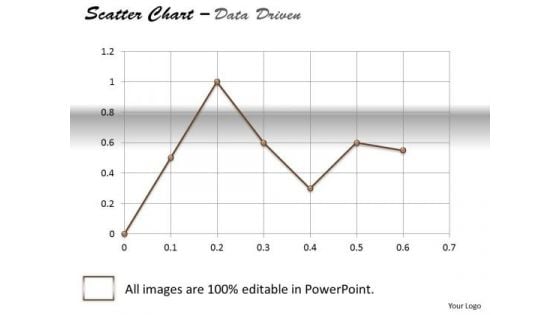
Data Analysis Excel Business Tool Scatter Chart PowerPoint Templates
Dominate Proceedings With Your Ideas. Our data analysis excel business tool scatter chart Powerpoint Templates Will Empower Your Thoughts.
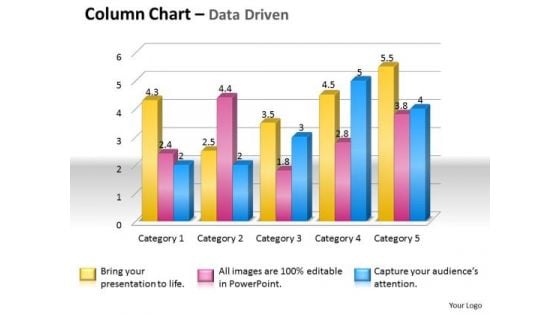
Data Analysis Techniques 3d Grouped Bar Chart PowerPoint Templates
Place The Orders With Your Thoughts. Our data analysis techniques 3d grouped bar chart Powerpoint Templates Know The Drill.
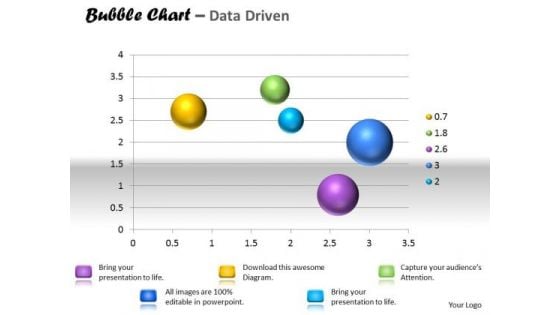
Data Analysis Template Interactive Bubble Chart PowerPoint Templates
Our data analysis template interactive bubble chart Powerpoint Templates Are A Wonder Drug. They Help Cure Almost Any Malaise.
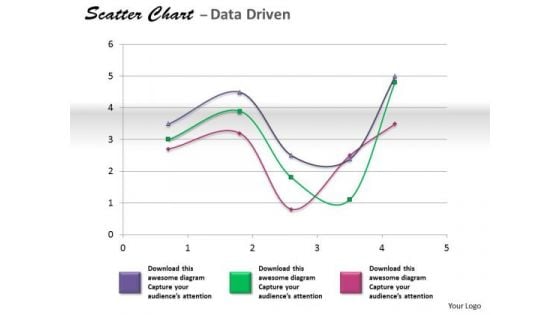
Financial Data Analysis Coordinate With Scatter Chart PowerPoint Templates
Get The Doers Into Action. Activate Them With Our financial data analysis coordinate with scatter chart Powerpoint Templates .
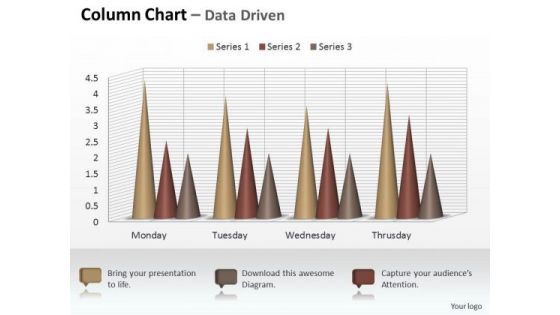
Marketing Data Analysis 3d Sets Of Column Chart PowerPoint Templates
Your Listeners Will Never Doodle. Our marketing data analysis 3d sets of column chart Powerpoint Templates Will Hold Their Concentration.
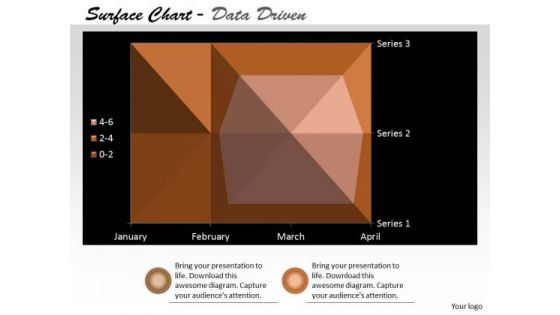
Multivariate Data Analysis Surface Chart Plots Trends PowerPoint Templates
Our multivariate data analysis surface chart plots trends Powerpoint Templates Heighten Concentration. Your Audience Will Be On The Edge.
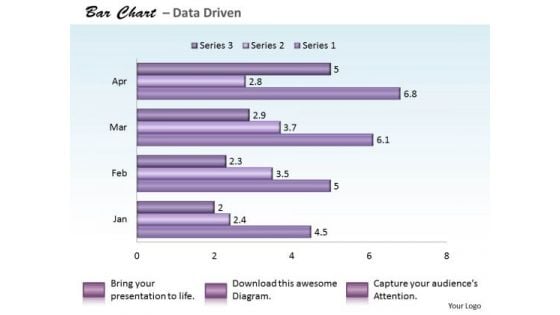
Quantitative Data Analysis Bar Chart For PowerPoint Templates
Reduce The Drag With Our quantitative data analysis bar chart for Powerpoint Templates . Give More Lift To Your Thoughts.

Data Analysis Techniques 3d Effective Display Chart PowerPoint Templates
Dribble Away With Our data analysis techniques 3d effective display chart Powerpoint Templates . Score A Goal With Your Ideas.
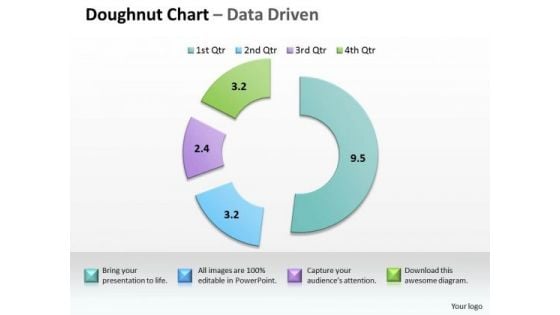
Data Analysis In Excel Completion Project Management PowerPoint Templates
Touch Base With Our data analysis in excel completion project management Powerpoint Templates . Review Your Growth With Your Audience.
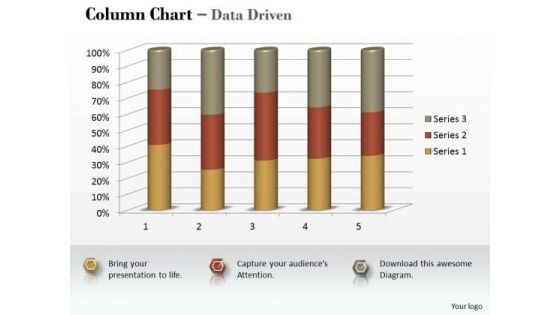
Marketing Data Analysis 3d Statistical Process Column Chart PowerPoint Templates
Be A Donor Of Great Ideas. Display Your Charity On Our marketing data analysis 3d statistical process column chart Powerpoint Templates .
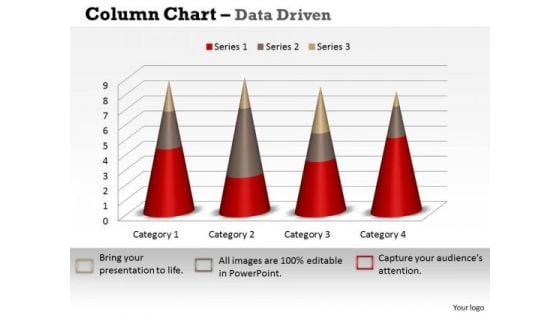
Marketing Data Analysis 3d Statistical Process Control Chart PowerPoint Templates
Open Up Doors That Lead To Success. Our marketing data analysis 3d statistical process control chart Powerpoint Templates Provide The Handles.

Business Data Analysis Chart For Case Studies PowerPoint Templates
Get Out Of The Dock With Our business data analysis chart for case studies Powerpoint Templates. Your Mind Will Be Set Free.
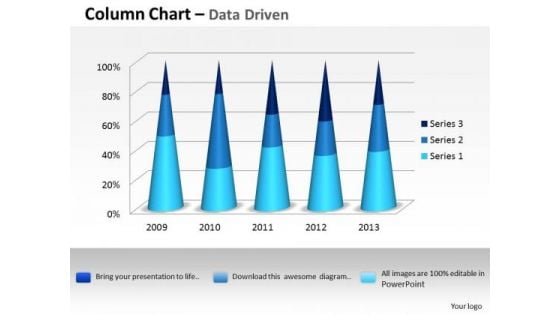
Data Analysis Excel 3d Process Variation Column Chart PowerPoint Templates
Put In A Dollop Of Our data analysis excel 3d process variation column chart Powerpoint Templates. Give Your Thoughts A Distinctive Flavor.
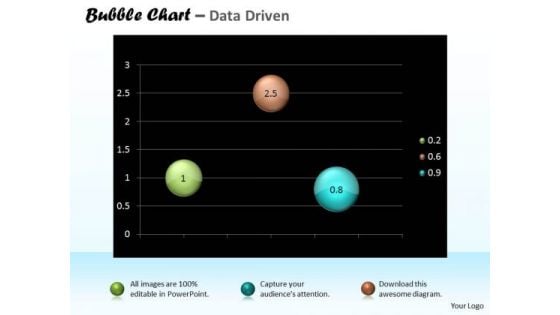
Data Analysis Excel Bubble Chart For Business Tasks PowerPoint Templates
Doll Up Your Thoughts With Our data analysis excel bubble chart for business tasks Powerpoint Templates. They Will Make A Pretty Picture.
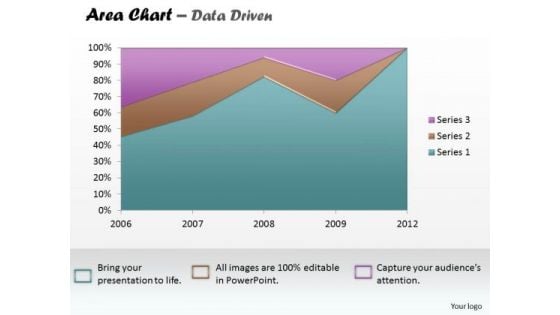
Data Analysis Excel Business Reporting Area Chart PowerPoint Templates
Establish The Dominance Of Your Ideas. Our data analysis excel business reporting area chart Powerpoint Templates Will Put Them On Top.
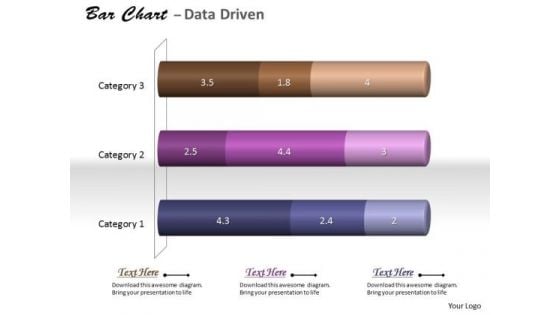
Data Analysis In Excel 3d Classification Of Chart PowerPoint Templates
With Our data analysis in excel 3d classification of chart Powerpoint Templates You Will Be Doubly Sure. They Possess That Stamp Of Authority.
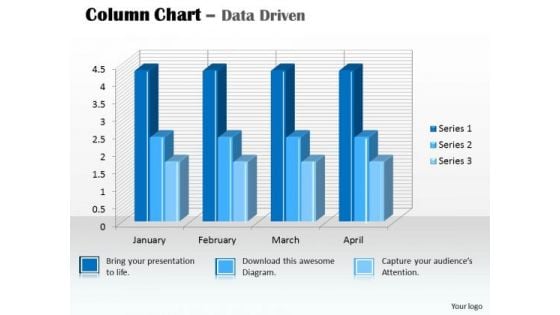
Data Analysis In Excel 3d Column Chart For PowerPoint Templates
Our data analysis in excel 3d column chart for Powerpoint Templates And Your Ideas Make A Great Doubles Pair. Play The Net With Assured Hands.
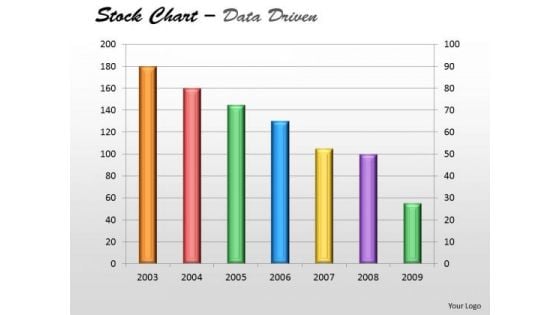
Data Analysis In Excel Of Stock Chart PowerPoint Templates
Plan Your Storyboard With Our data analysis in excel of stock chart Powerpoint Templates . Give An Outline To The Solutions You Have.
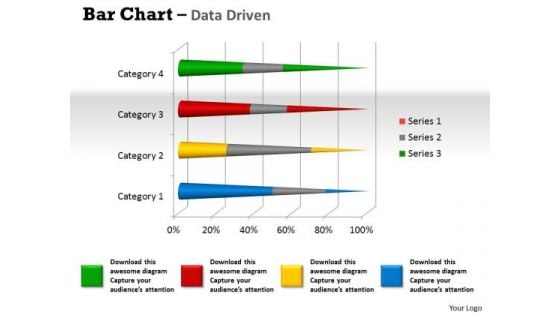
Data Analysis Programs 3d Bar Chart To Dispaly PowerPoint Templates
Lower The Drawbridge With Our data analysis programs 3d bar chart to dispaly Powerpoint Templates . Capture The Minds Of Your Audience.
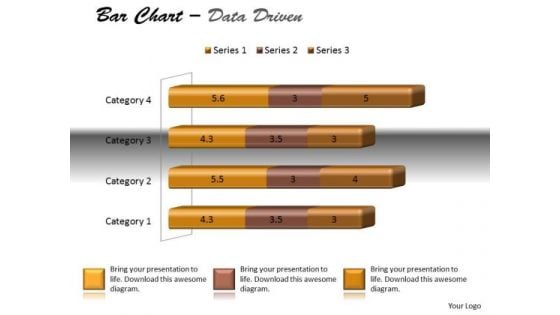
Data Analysis Techniques 3d Bar Chart For Modification PowerPoint Templates
Dreams Generate Thoughts, Thoughts Generate Ideas. Give Them Life With Our data analysis techniques 3d bar chart for modification Powerpoint Templates .
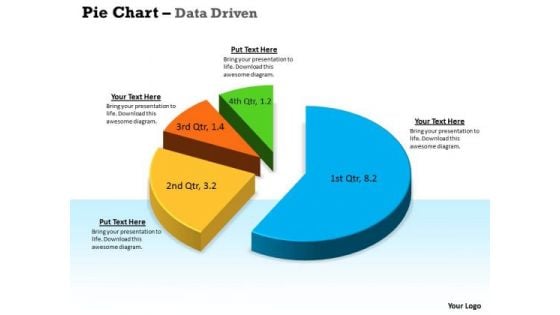
Data Analysis Techniques 3d In Segments Pie Chart PowerPoint Templates
Drink To The Success Of Your Campaign. Our data analysis techniques 3d in segments pie chart Powerpoint Templates Will Raise A Toast.
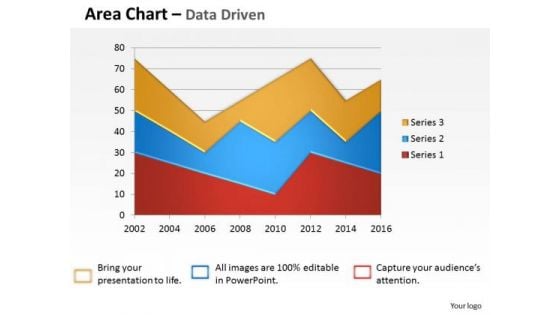
Data Analysis Template Driven Visualization Area Chart PowerPoint Slides Templates
Draw On The Energy Of Our data analysis template driven visualization area chart powerpoint slides Templates . Your Thoughts Will Perk Up.
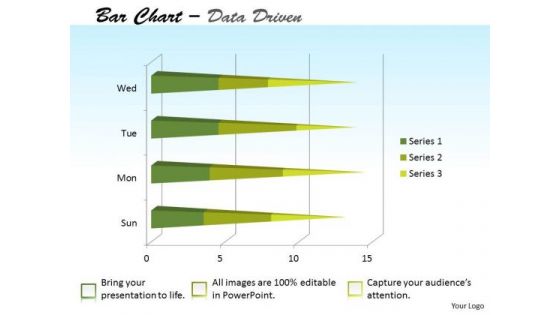
Data Analysis Template Forex Market Bar Chart PowerPoint Templates
Attract A Crowd With Our data analysis template forex market bar chart Powerpoint Templates . They Will Drop It All And Come To Hear You.
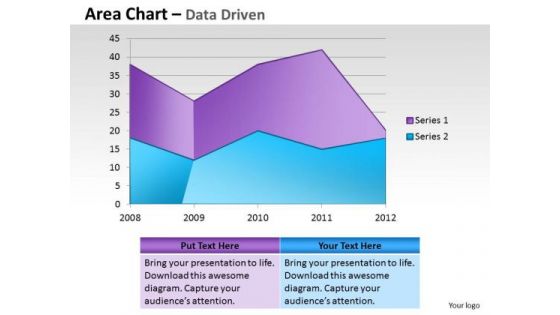
Financial Data Analysis Area Chart For Showing Trends PowerPoint Templates
Document Your Views On Our financial data analysis area chart for showing trends Powerpoint Templates . They Will Create A Strong Impression.
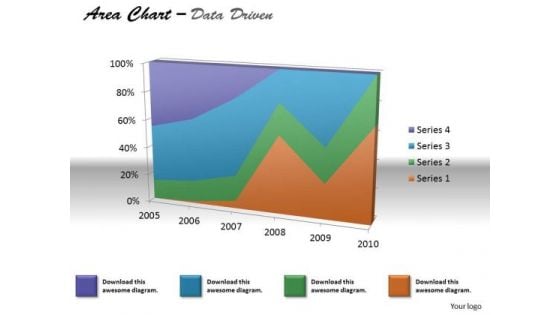
Financial Data Analysis Area Chart For Various Values PowerPoint Templates
Document The Process On Our financial data analysis area chart for various values Powerpoint Templates . Make A Record Of Every Detail.
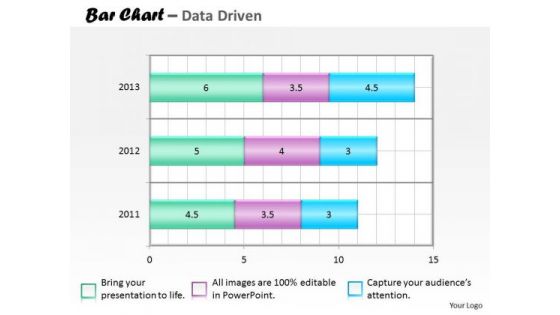
Financial Data Analysis Bar Chart For Collection Of PowerPoint Templates
Our financial data analysis bar chart for collection of Powerpoint Templates Team Are A Dogged Lot. They Keep At It Till They Get It Right.
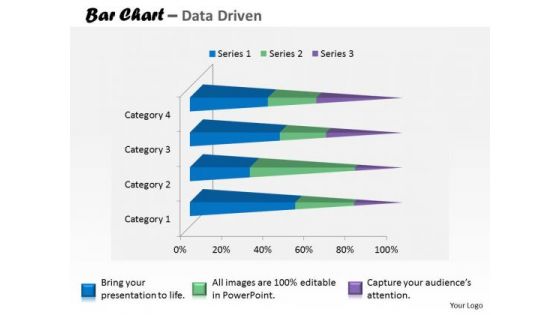
Financial Data Analysis Currency Trading Bar Chart PowerPoint Templates
Put In A Dollop Of Our financial data analysis currency trading bar chart Powerpoint Templates . Give Your Thoughts A Distinctive Flavor.

Microsoft Excel Data Analysis Bar Chart To Handle PowerPoint Templates
Our microsoft excel data analysis bar chart to handle Powerpoint Templates And Your Ideas Make A Great Doubles Pair. Play The Net With Assured Hands.
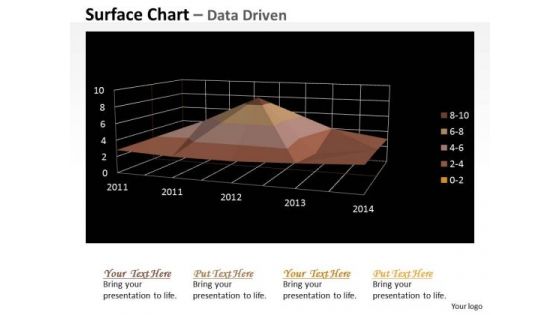
Multivariate Data Analysis Numeric Values Surface Chart PowerPoint Templates
Your Grasp Of Economics Is Well Known. Help Your Audience Comprehend Issues With Our multivariate data analysis numeric values surface chart Powerpoint Templates .
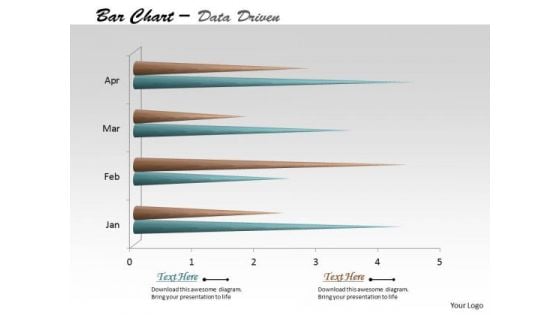
Multivariate Data Analysis Time Based Bar Chart PowerPoint Templates
Edit Your Work With Our multivariate data analysis time based bar chart Powerpoint Templates . They Will Help You Give The Final Form.
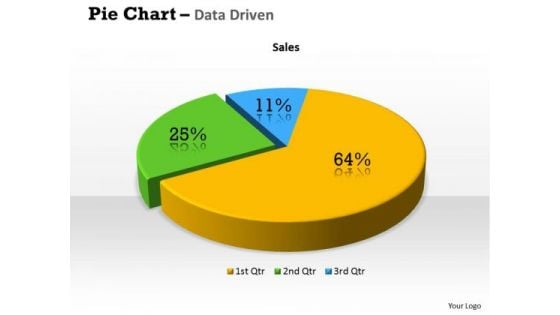
Quantitative Data Analysis 3d Percentage Ratio Pie Chart PowerPoint Templates
Plan Your Storyboard With Our quantitative data analysis 3d percentage ratio pie chart Powerpoint Templates . Give An Outline To The Solutions You Have.
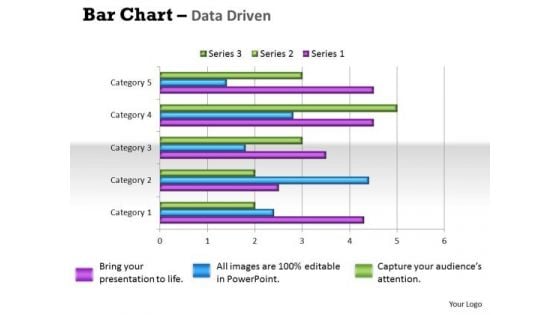
Quantitative Data Analysis Bar Chart For Different Categories PowerPoint Templates
Make Some Dough With Our quantitative data analysis bar chart for different categories Powerpoint Templates . Your Assets Will Rise Significantly.
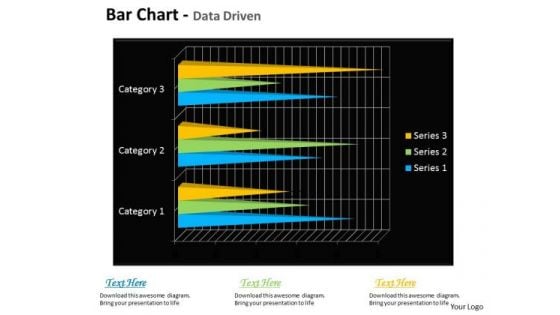
Quantitative Data Analysis Bar Chart For Financial Markets PowerPoint Templates
Draft It Out On Our quantitative data analysis bar chart for financial markets Powerpoint Templates . Give The Final Touches With Your Ideas.
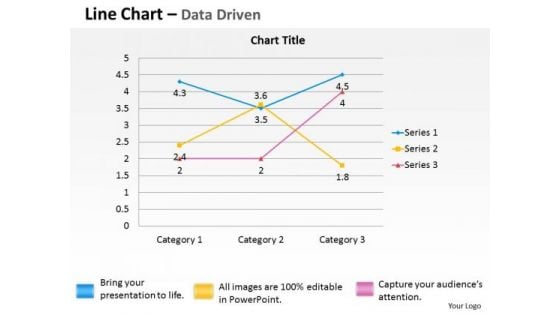
Quantitative Data Analysis Driven Economic Line Chart PowerPoint Slides Templates
Break The Deadlock With Our quantitative data analysis driven economic line chart powerpoint slides Templates . Let The Words Start To Flow.

Data Analysis Excel Bar Graph To Compare PowerPoint Templates
Get The Domestics Right With Our data analysis excel bar graph to compare Powerpoint Templates. Create The Base For Thoughts To Grow.
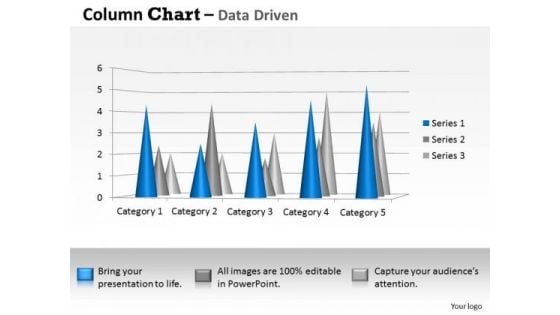
Data Analysis Techniques 3d Distribution Of In Sets PowerPoint Templates
Your Thoughts Will Be The Main Course. Provide The Dressing With Our data analysis techniques 3d distribution of in sets Powerpoint Templates .
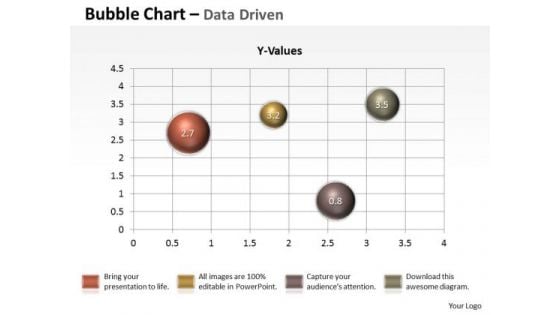
Data Analysis Techniques 3d Graphical Presentation Of PowerPoint Templates
Our data analysis techniques 3d graphical presentation of Powerpoint Templates Will Follow The Drill. They Accomplish The Task Assigned To Them.
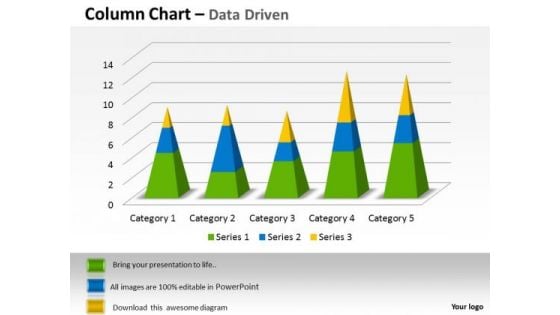
Examples Of Data Analysis Market 3d Categories Sets PowerPoint Templates
Our examples of data analysis market 3d categories sets Powerpoint Templates Give Your Thoughts Their Due. They Project Them With Full Intensity.
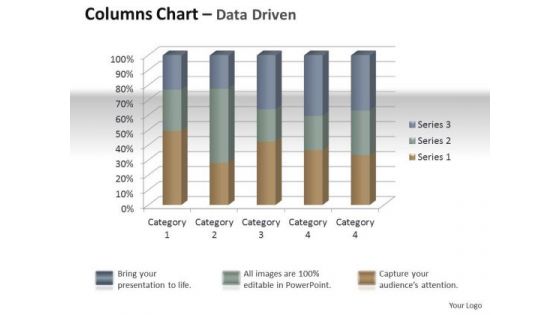
Marketing Data Analysis 3d Quality Control Of Units PowerPoint Templates
Establish Your Dominion With Our marketing data analysis 3d quality control of units Powerpoint Templates . Rule The Stage With Your Thoughts.
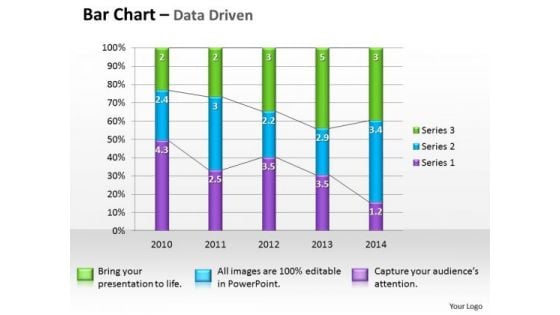
Microsoft Excel Data Analysis Bar Graph PowerPoint Templates
Double The Impact With Our microsoft excel data analysis bar graph Powerpoint Templates . Your Thoughts Will Have An Imposing Effect.
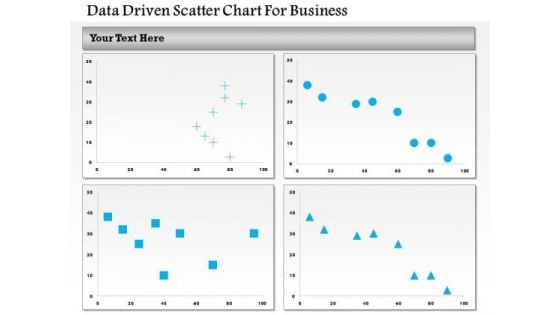
Business Diagram Data Driven Scatter Chart For Business PowerPoint Slide
This business diagram has been designed with four comparative charts. This slide suitable for data representation. You can also use this slide to present business analysis and reports. Use this diagram to present your views in a wonderful manner.
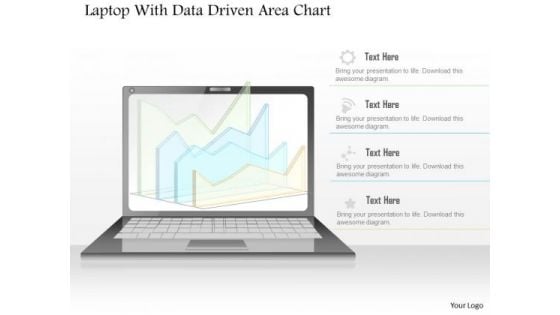
Business Diagram Laptop With Data Driven Area Chart PowerPoint Slide
This diagram has been designed with laptop and data driven area chart. Download this diagram to give your presentations more effective look. It helps in clearly conveying your message to clients and audience.
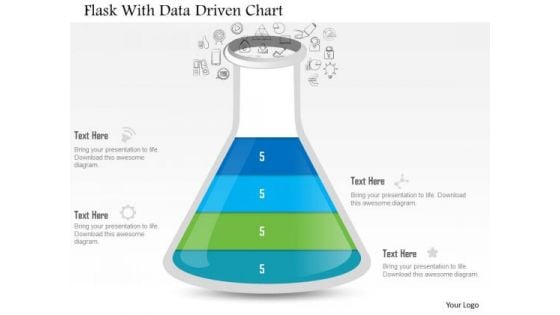
Business Diagram Flask With Data Driven Chart PowerPoint Slide
This data driven diagram has been designed with flask graphics. Download this diagram to give your presentations more effective look. It helps in clearly conveying your message to clients and audience.
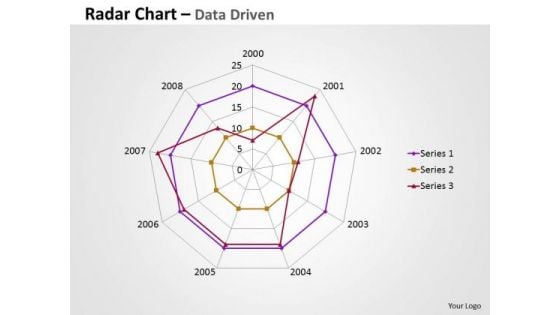
Business Data Analysis Chart Comparing Multiple Entities PowerPoint Templates
Analyze Ailments On Our business data analysis chart comparing multiple entities Powerpoint Templates. Bring Out The Thinking Doctor In You. Dock Your Thoughts With Our Financial Analysis . They Will Launch Them Into Orbit.
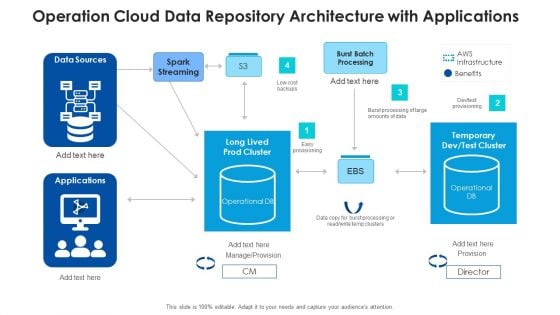
Operation Cloud Data Repository Architecture With Applications Download PDF
Presenting operation cloud data repository architecture with applications download pdf to dispense important information. This template comprises four stages. It also presents valuable insights into the topics including data sources, applications, long lived prod cluster, temporary dev or test cluster. This is a completely customizable PowerPoint theme that can be put to use immediately. So, download it and address the topic impactfully.
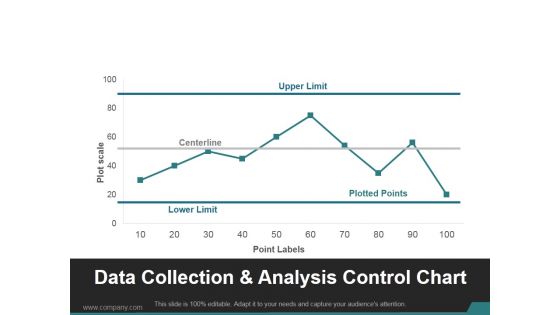
Data Collection And Analysis Control Chart Ppt PowerPoint Presentation Visuals
This is a data collection and analysis control chart ppt powerpoint presentation visuals. This is a ten stage process. The stages in this process are upper limit, centerline, lower limit, plotted points.
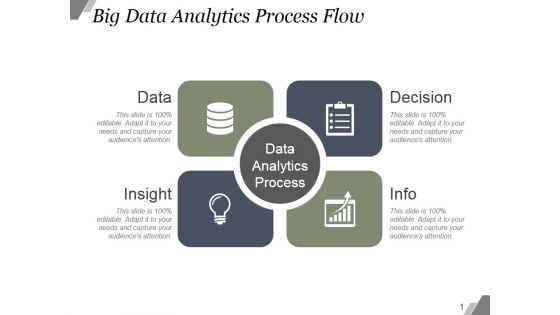
Big Data Analytics Process Flow Ppt PowerPoint Presentation Diagrams
This is a big data analytics process flow ppt powerpoint presentation diagrams. This is a four stage process. The stages in this process are data, decision, insight, info.
Administered Data And Analytic Quality Playbook How To Fix The Business Intelligence Problem Icons PDF
This template covers the solution for BI problems such as analytics transformation and business intelligence program. It also depicts that switching to next-generation analytics platform that gives business users data driven insights.This is a Administered Data And Analytic Quality Playbook How To Fix The Business Intelligence Problem Icons PDF template with various stages. Focus and dispense information on six stages using this creative set, that comes with editable features. It contains large content boxes to add your information on topics like Driven Analytics, Automated Discovery, Bridging Business You can also showcase facts, figures, and other relevant content using this PPT layout. Grab it now.
Data Processing Services Delivery How AI And Machine Learning Can Revolutionize Sales Icons PDF
This template covers the benefits of AI for the Sales and Marketing team. AI and Machine Learning benefits in the area of lead quality, engagement, and better understanding of buyer intent. Deliver and pitch your topic in the best possible manner with this Data Processing Services Delivery How AI And Machine Learning Can Revolutionize Sales Icons PDF. Use them to share invaluable insights on Social Media Posts, Terms Favorability, Brand, Product and impress your audience. This template can be altered and modified as per your expectations. So, grab it now.
Using Data Science Technologies For Business Transformation Tasks And Skills Of Machine Learning Engineer Icons PDF
This slide represents the machine learning engineers tasks and skills, including a deep knowledge of machine learning, ML algorithms, and Python and C. Coming up with a presentation necessitates that the majority of the effort goes into the content and the message you intend to convey. The visuals of a PowerPoint presentation can only be effective if it supplements and supports the story that is being told. Keeping this in mind our experts created Using Data Science Technologies For Business Transformation Tasks And Skills Of Machine Learning Engineer Icons PDF to reduce the time that goes into designing the presentation. This way, you can concentrate on the message while our designers take care of providing you with the right template for the situation.
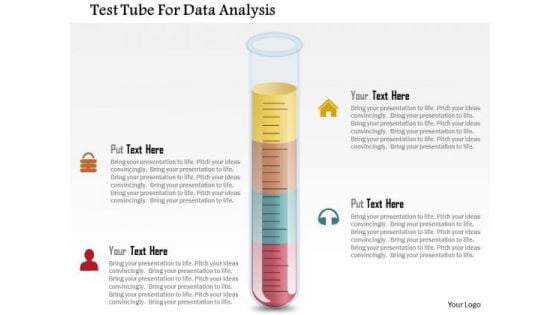
Business Diagram Test Tube For Data Analysis Presentation Template
Graphic of test tube with lock and headphone icons have been used to design this Power Point template. You may use this diagram for data analysis and research. Present your views using our innovative slide and be assured of leaving a lasting impression.
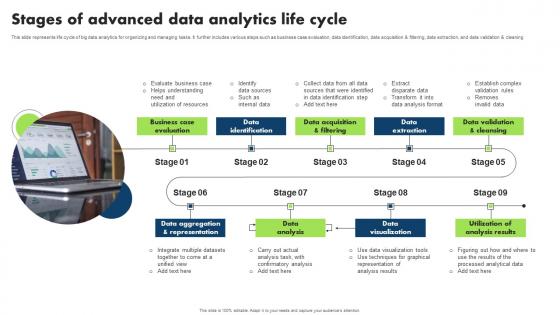
Stages Of Advanced Data Analytics Life Cycle Diagrams Pdf
This slide represents life cycle of big data analytics for organizing and managing tasks. It further includes various steps such as business case evaluation, data identification, data acquisition and filtering, data extraction, and data validation and cleaning Showcasing this set of slides titled Stages Of Advanced Data Analytics Life Cycle Diagrams Pdf. The topics addressed in these templates are Business Case Evaluation, Data Identification, Data Extraction. All the content presented in this PPT design is completely editable. Download it and make adjustments in color, background, font etc. as per your unique business setting. This slide represents life cycle of big data analytics for organizing and managing tasks. It further includes various steps such as business case evaluation, data identification, data acquisition and filtering, data extraction, and data validation and cleaning
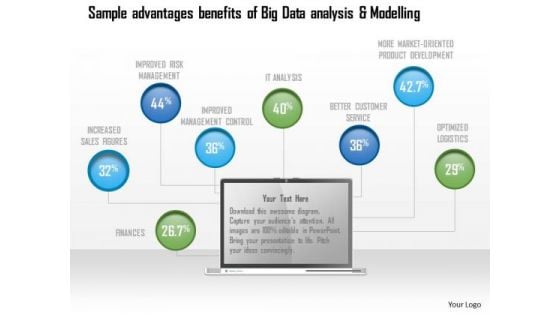
Business Diagram Sample Advantages Benefits Of Big Data Analysis And Modelling Ppt Slide
Explain the concept of sample advantages and benefits of big data analysis with this unique diagram. This slide contains the graphic of data icons. Use this slide to present data analysis and modeling related topics in any presentation.
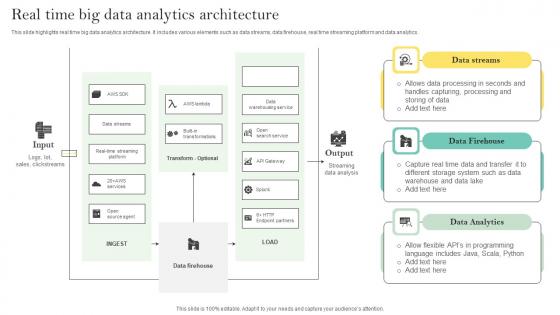
Real Time Big Data Analytics Architecture Ppt Infographics Microsoft Pdf
This slide highlights real time big data analytics architecture. It includes various elements such as data streams, data firehouse, real time streaming platform and data analytics. Showcasing this set of slides titled Real Time Big Data Analytics Architecture Ppt Infographics Microsoft Pdf. The topics addressed in these templates are Data Streams, Data Firehouse, Real Time. All the content presented in this PPT design is completely editable. Download it and make adjustments in color, background, font etc. as per your unique business setting. This slide highlights real time big data analytics architecture. It includes various elements such as data streams, data firehouse, real time streaming platform and data analytics.
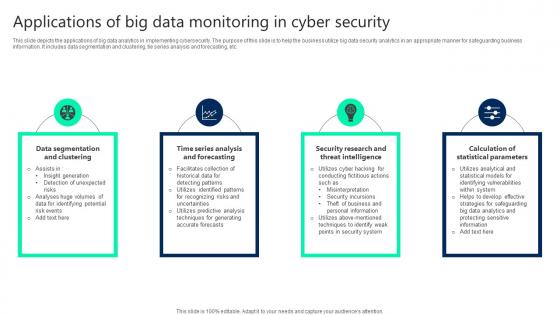
Applications Of Big Data Monitoring In Cyber Security Themes pdf
This slide depicts the applications of big data analytics in implementing cybersecurity. The purpose of this slide is to help the business utilize big data security analytics in an appropriate manner for safeguarding business information. It includes data segmentation and clustering, tie series analysis and forecasting, etc. Pitch your topic with ease and precision using this Applications Of Big Data Monitoring In Cyber Security Themes pdf. This layout presents information on Data Segmentation, Security Research, Threat Intelligence. It is also available for immediate download and adjustment. So, changes can be made in the color, design, graphics or any other component to create a unique layout. This slide depicts the applications of big data analytics in implementing cybersecurity. The purpose of this slide is to help the business utilize big data security analytics in an appropriate manner for safeguarding business information. It includes data segmentation and clustering, tie series analysis and forecasting, etc.
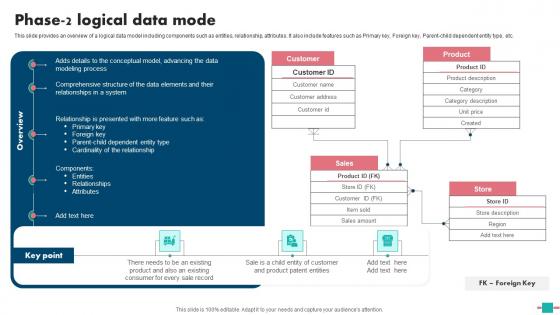
Database Modeling Phase 2 Logical Data Mode Themes Pdf
This slide provides an overview of a logical data model including components such as entities, relationship, attributes. It also include features such as Primary key, Foreign key, Parent child dependent entity type, etc. Crafting an eye catching presentation has never been more straightforward. Let your presentation shine with this tasteful yet straightforward Database Modeling Phase 2 Logical Data Mode Themes Pdf template. It offers a minimalistic and classy look that is great for making a statement. The colors have been employed intelligently to add a bit of playfulness while still remaining professional. Construct the ideal Database Modeling Phase 2 Logical Data Mode Themes Pdf that effortlessly grabs the attention of your audience Begin now and be certain to wow your customers This slide provides an overview of a logical data model including components such as entities, relationship, attributes. It also include features such as Primary key, Foreign key, Parent child dependent entity type, etc.
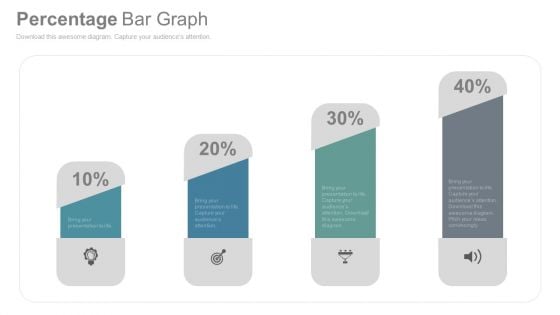
Bar Graph To Compare Business Data PowerPoint Slides
This is the slide which can solve many purposes of yours. Be it growth in your company, need to show your company?s status in the market as compared to others, or how your business has improved so far. An ideal PowerPoint template to display all of these. You can easily use this graph to show the growth of your company using the percentage icons. You can use this visual to show the status of your company in the market in comparison with others. You can edit the icons and replace them with the logo of your company and the others. You can also show it to your colleagues how your company has built its image in the market or how it has improved over the time. A perfect bar graph image which needs to be included in your business PPT presentations.
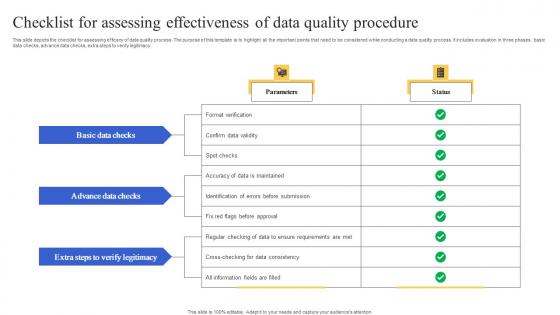
Checklist For Assessing Effectiveness Of Data Quality Procedure Structure Pdf
This slide depicts the checklist for assessing efficacy of data quality process. The purpose of this template is to highlight all the important points that need to be considered while conducting a data quality process. It includes evaluation in three phases basic data checks, advance data checks, extra steps to verify legitimacy. Showcasing this set of slides titled Checklist For Assessing Effectiveness Of Data Quality Procedure Structure Pdf. The topics addressed in these templates are Basic Data Checks, Advance Data Checks, Data Quality Procedure. All the content presented in this PPT design is completely editable. Download it and make adjustments in color, background, font etc. as per your unique business setting. This slide depicts the checklist for assessing efficacy of data quality process. The purpose of this template is to highlight all the important points that need to be considered while conducting a data quality process. It includes evaluation in three phases basic data checks, advance data checks, extra steps to verify legitimacy.
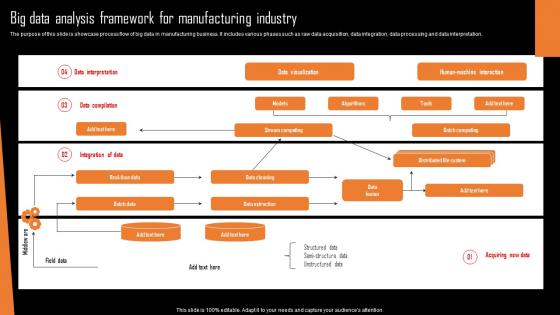
Big Data Analysis Framework For Manufacturing Industry Background Pdf
The purpose of this slide is showcase process flow of big data in manufacturing business. It includes various phases such as raw data acquisition, data integration, data processing and data interpretation.Showcasing this set of slides titled Big Data Analysis Framework For Manufacturing Industry Background Pdf The topics addressed in these templates are Data Visualization, Data Extraction, Data Cleaning All the content presented in this PPT design is completely editable. Download it and make adjustments in color, background, font etc. as per your unique business setting. The purpose of this slide is showcase process flow of big data in manufacturing business. It includes various phases such as raw data acquisition, data integration, data processing and data interpretation.
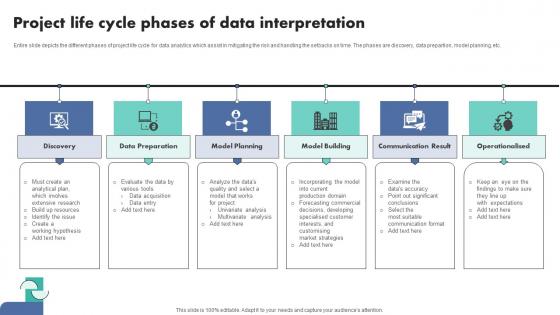
Project Life Cycle Phases Of Data Interpretation Demonstration Pdf
Entire slide depicts the different phases of project life cycle for data analytics which assist in mitigating the risk and handling the setbacks on time. The phases are discovery, data prepartion, model planning, etc.Pitch your topic with ease and precision using this Project Life Cycle Phases Of Data Interpretation Demonstration Pdf This layout presents information on Data Preparation, Model Planning, Model Building It is also available for immediate download and adjustment. So, changes can be made in the color, design, graphics or any other component to create a unique layout. Entire slide depicts the different phases of project life cycle for data analytics which assist in mitigating the risk and handling the setbacks on time. The phases are discovery, data prepartion, model planning, etc.


 Continue with Email

 Home
Home


