Data Icon
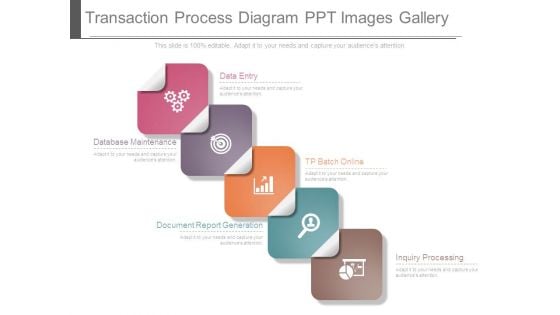
Transaction Process Diagram Ppt Images Gallery
This is a transaction process diagram ppt images gallery. This is a five stage process. The stages in this process are data entry, tp batch online, database maintenance, document report generation, inquiry processing.
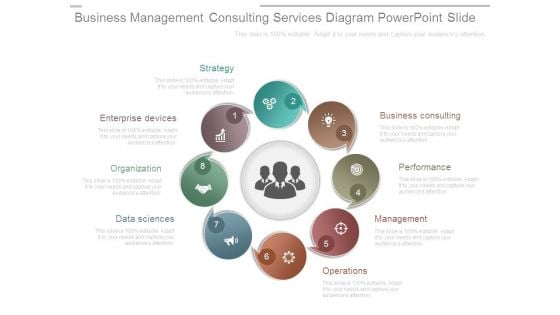
Business Management Consulting Services Diagram Powerpoint Slide
This is a business management consulting services diagram powerpoint slide. This is a eight stage process. The stages in this process are strategy, business consulting, performance, management, operations, data sciences, organization, enterprise devices.
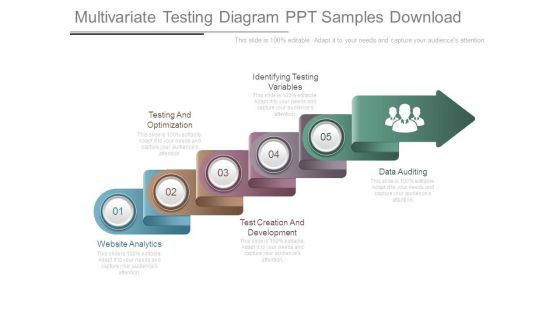
Multivariate Testing Diagram Ppt Samples Download
This is a multivariate testing diagram ppt samples download. This is a five stage process. The stages in this process are website analytics, testing and optimization, test creation and development, identifying testing variables, data auditing.
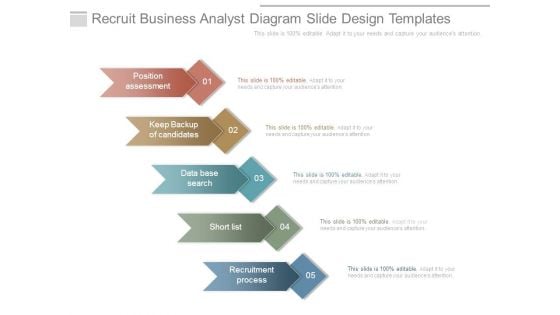
Recruit Business Analyst Diagram Slide Design Templates
This is a recruit business analyst diagram slide design templates. This is a five stage process. The stages in this process are position assessment, keep backup of candidates, data base search, short list, recruitment process.
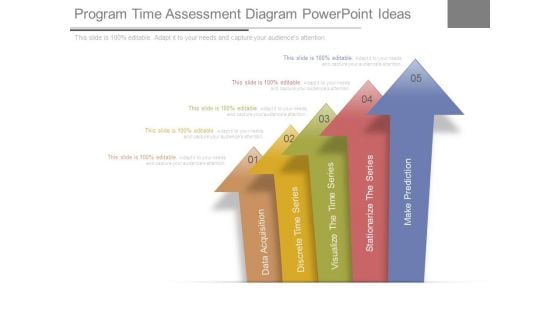
Program Time Assessment Diagram Powerpoint Ideas
This is a program time assessment diagram powerpoint ideas. This is a five stage process. The stages in this process are data acquisition, discrete time series, visualize the time series, stationarize the series, make prediction.
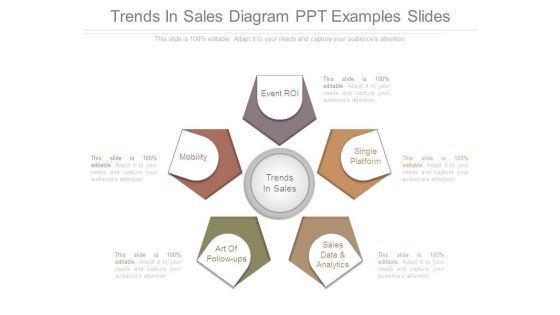
Trends In Sales Diagram Ppt Examples Slides
This is a trends in sales diagram ppt examples slides. This is a five stage process. The stages in this process are event roi, single platform, sales data and analytics, art of follow ups, mobility, trends in sales.
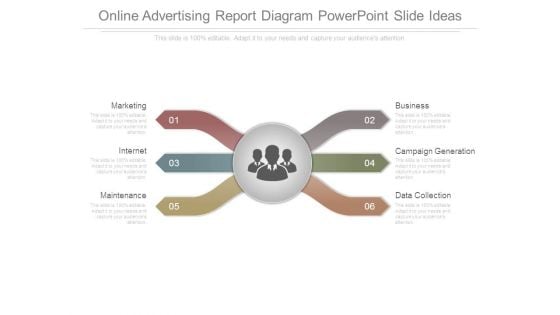
Online Advertising Report Diagram Powerpoint Slide Ideas
This is a online advertising report diagram powerpoint slide ideas. This is a six stage process. The stages in this process are marketing, internet, maintenance, business, campaign generation, data collection.
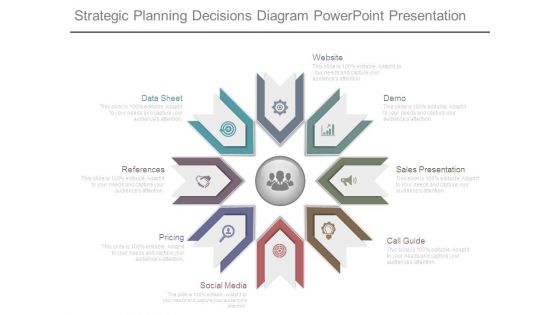
Strategic Planning Decisions Diagram Powerpoint Presentation
This is a strategic planning decisions diagram powerpoint presentation. This is a eight stage process. The stages in this process are data sheet, references, pricing, social media, call guide, sales presentation, demo, website.
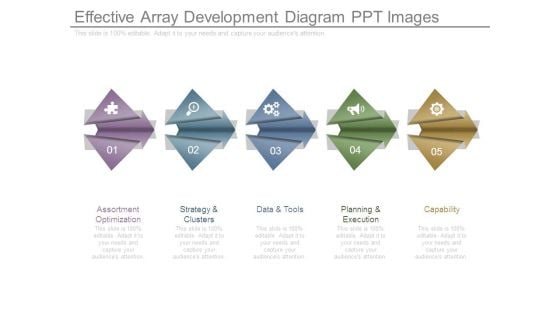
Effective Array Development Diagram Ppt Images
This is a effective array development diagram ppt images. This is a five stage process. The stages in this process are assortment optimization, strategy and clusters, data and tools, planning and execution, capability.

Customized Analytical Support Diagram Powerpoint Presentation Examples
This is a customized analytical support diagram powerpoint presentation examples. This is a four stage process. The stages in this process are scope and define the problem, data gathering and investigation, develop options, recommendation report.
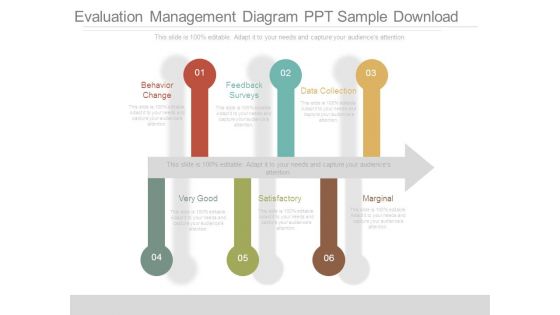
Evaluation Management Diagram Ppt Sample Download
This is a evaluation management diagram ppt sample download. This is a six stage process. The stages in this process are behavior change, feedback surveys, data collection, very good, satisfactory, marginal.
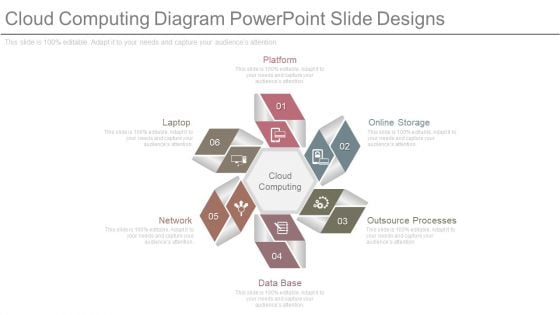
Cloud Computing Diagram Powerpoint Slide Designs
This is a cloud computing diagram powerpoint slide designs. This is a six stage process. The stages in this process are platform, online storage, outsource processes, data base, network, laptop.
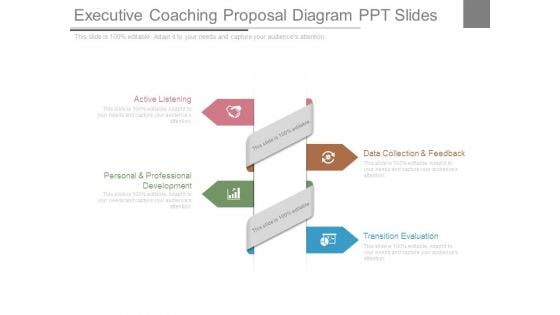
Executive Coaching Proposal Diagram Ppt Slides
This is a executive coaching proposal diagram ppt slides. This is a four stage process. The stages in this process are active listening, personal and professional development, data collection and feedback, transition evaluation.
Sample Of Teleselling Diagram Powerpoint Guide
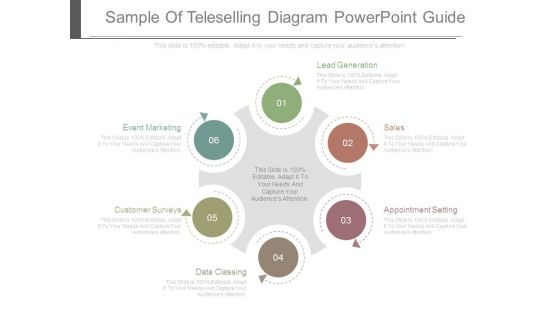
This is a sample of teleselling diagram powerpoint guide. This is a six stage process. The stages in this process are lead generation, sales, appointment setting, data classing, customer surveys, event marketing.
Benefits Of Quality Management Diagram Ppt Presentation
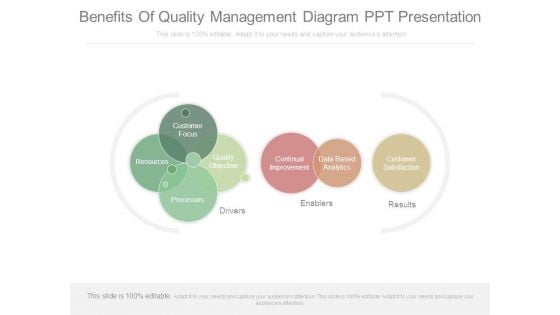
This is a benefits of quality management diagram ppt presentation. This is a three stage process. The stages in this process are customer focus, resources, processes, quality objective, drivers, continual improvement, data based analytics, customer satisfaction, enablers, results.
Business Diagram Blue Book With Clever Infographics Presentation Template
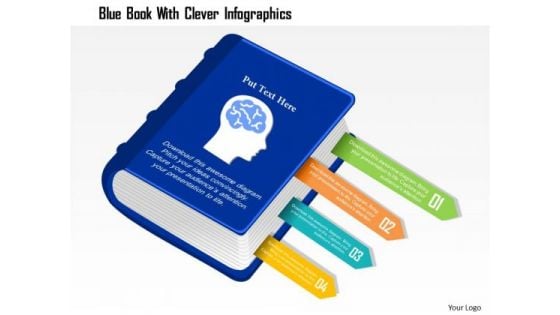
Graphic of blue book with clever info graphics has been used to craft this power point template. This PPT diagram contains the concept of educational data representation. Use this PPT for business and marketing related presentations.
Business Framework Golden Circle PowerPoint Presentation
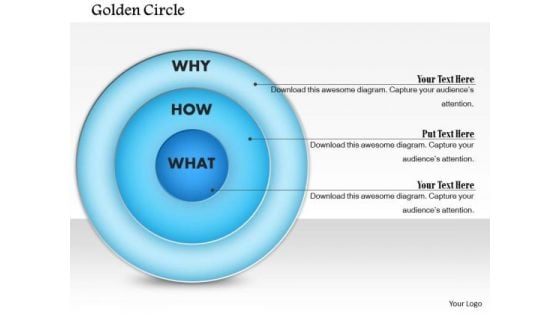
This business diagram has been designed with graphic of blue colored circle. This business slide is suitable to display data analysis in any business presentation. Use this slide to build a unique presentations for your viewers

Road In Yorkshire Dales Vacation PowerPoint Themes And PowerPoint Slides 0411
Microsoft PowerPoint Theme and Slide with road in yorkshire dales Put up the facts and figures on our Road In Yorkshire Dales Vacation PowerPoint Themes And PowerPoint Slides 0411. Display the data for everyone's consumption.

Road Sign On Desert Success PowerPoint Themes And PowerPoint Slides 0811
Microsoft PowerPoint Theme and Slide with road sign success on desert Put up the facts and figures on our Road Sign On Desert Success PowerPoint Themes And PowerPoint Slides 0811. Display the data for everyone's consumption.
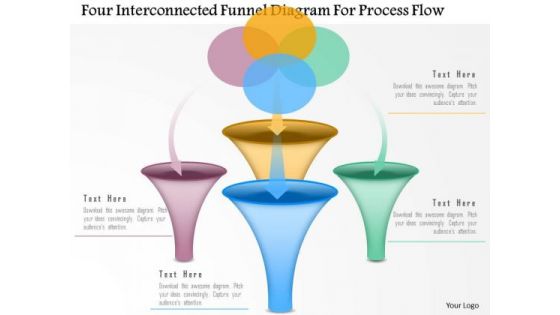
Business Diagram Four Interconnected Funnel Diagram For Process Flow Presentation Template
Graphic of four interconnected funnel diagram has been used to design this power point template diagram. This PPT diagram contains the concept of data and process flow. Use this PPT for marketing and business related presentations.
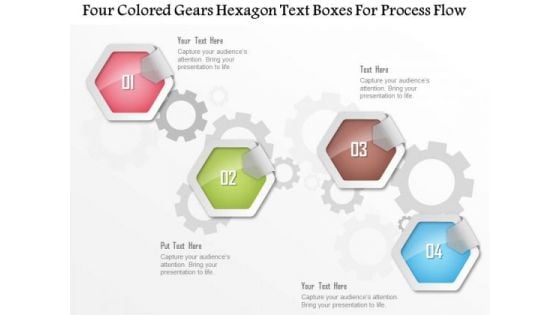
Business Diagram Four Colored Gears Hexagon Text Boxes For Process Flow Presentation Template
Four colored gears hexagon text boxes are used to design this power point template. This diagram contains hexagons for data representation. Use this diagram to display business process workflows in any presentation.
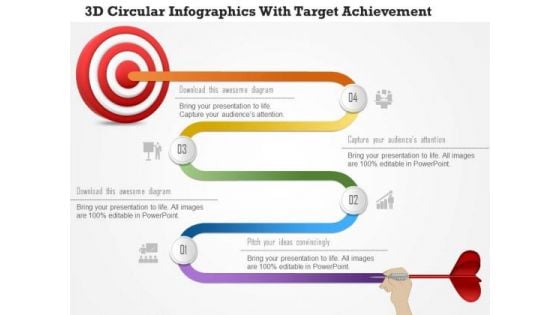
Business Diagram 3d Circular Infographics With Target Achievement PowerPoint Template
This power point template has been crafted with graphic of 3d circular info graphics. This PPT slide contains the concept of data representation and target achievement. This PPT can be used for target and success related presentations.
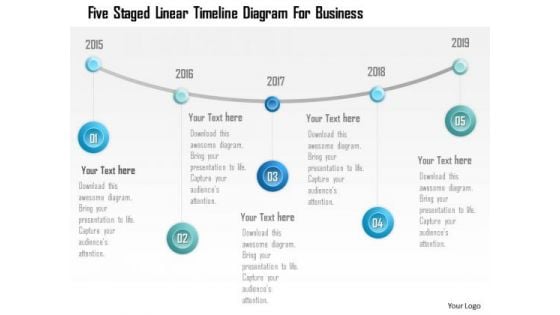
Business Diagram Five Staged Linear Timeline Diagram For Business PowerPoint Template
Five staged linear timeline diagram has been used to design this power point template. This diagram template contains the concept of business data and success strategy representation. Use this PPT for your business and sales related presentations.

Business Diagram Four Staged Stair Diagram With Foot Print PowerPoint Template
Four staged stair diagram with foot print has been used to design this power point template. This diagram template contains the concept of success and data flow. Use this PPT for your business and sales related presentations.
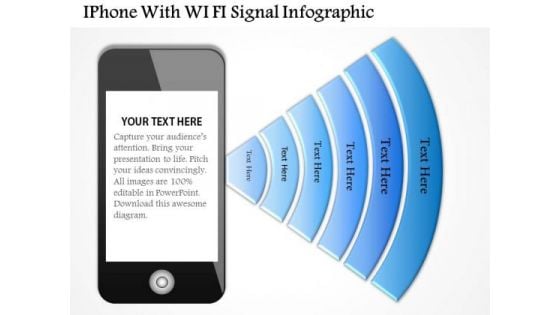
Business Diagram Iphone With Wi Fi Signal Infographic Presentation Template
This business diagram has been designed with graphic of iphone and wi-fi symbol. This diagram template contains the concept of data communication and technology. Use this diagram template for your business and technology related presentations.
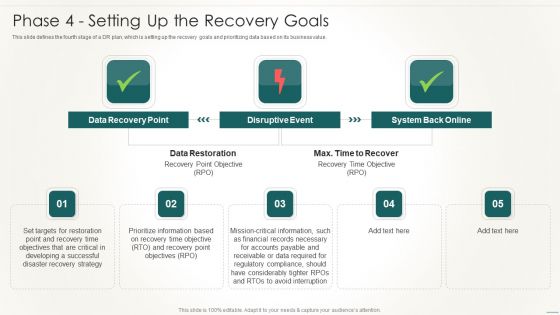
Information Technology Disaster Resilience Plan Phase 4 Setting Up The Recovery Goals Infographics PDF
This slide defines the fourth stage of a DR plan, which is setting up the recovery goals and prioritizing data based on its business value.Deliver and pitch your topic in the best possible manner with this Information Technology Disaster Resilience Plan Phase 4 Setting Up The Recovery Goals Infographics PDF. Use them to share invaluable insights on Data Recovery, Disruptive Event, System Back and impress your audience. This template can be altered and modified as per your expectations. So, grab it now.
Business Diagram Highway Signboard With Road And Text Boxes PowerPoint Template
Graphic of highway signboard with road and text has been used to craft this power point template diagram. This PPT contains the concept of transportation and data representation. Use this PPT for your business and management related presentations.
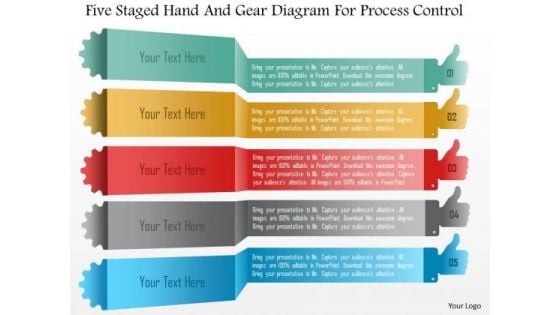
Business Diagram Five Staged Hand And Gear Diagram For Process Control PowerPoint Template
Five staged hand and gear diagram has been used to design this power point template. This PPT contains the concept of data representation and process control. Use this PPT slide for your marketing and business process related presentations.

Business Diagram Four Design For Concept Coding Presentation Template
Four colorful text boxes has been used to craft this power point template. This PPT diagram contains the concept of coding and data representation. Use this PPT for business and technology related presentations.
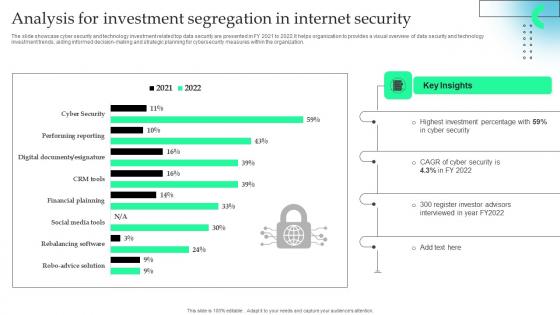
Analysis For Investment Segregation In Internet Security Formats Pdf
The slide showcase cyber security and technology investment related top data security are presented in FY 2021 to 2022.It helps organization to provides a visual overview of data security and technology investment trends, aiding informed decision making and strategic planning for cybersecurity measures within the organization.Pitch your topic with ease and precision using this Analysis For Investment Segregation In Internet Security Formats Pdf This layout presents information on Highest Investment, Register Investor Advisors, Key Insights It is also available for immediate download and adjustment. So, changes can be made in the color, design, graphics or any other component to create a unique layout. The slide showcase cyber security and technology investment related top data security are presented in FY 2021 to 2022.It helps organization to provides a visual overview of data security and technology investment trends, aiding informed decision making and strategic planning for cybersecurity measures within the organization.
Business Diagram Man Silhouette With Mobile And Text Boxes Presentation Template
This power point template slide has been crafted with graphic of businessman and mobile. This PPT contains the concept of data technology and communication. Use this PPT slide for business and internet related presentations.
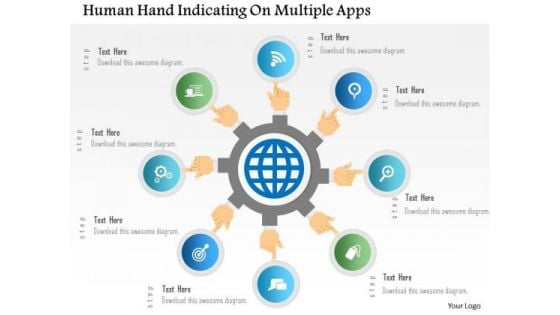
Business Diagram Human Hand Indicating On Multiple Apps PowerPoint Template
Graphic of human hand with multiple apps has been used to craft this PPT. This PPT diagram contains the concept of app usage. Use this PPT for your technology and data related topics in any presentation.

Stand Out Of Crowd Business PowerPoint Themes And PowerPoint Slides 0811
Microsoft PowerPoint Theme and Slide with conceptual image depicting standing out from the crowd Figure out the market with our Stand Out Of Crowd Business PowerPoint Themes And PowerPoint Slides 0811. Analyse the data accurately for the audience.
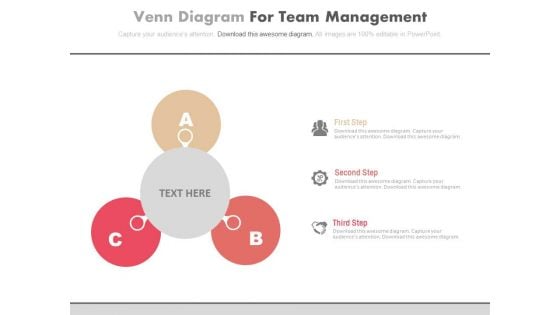
Abc Steps For Corporate Entrepreneurship Powerpoint Template
Our above PPT slide contains graphics of ABC steps chart. This business diagram helps to depict concept of corporate entrepreneurship. Use this diagram to impart more clarity to data and to create more sound impact on viewers.
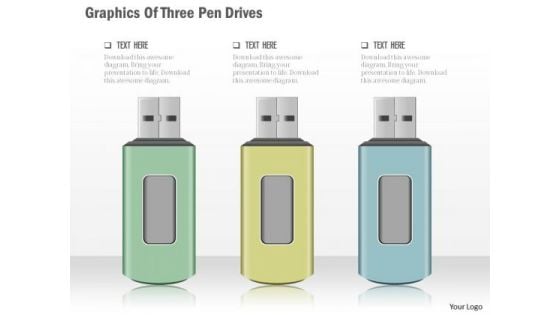
Business Diagram Graphics Of Three Pen Drives Presentation Template
Graphic of three pen drives has been sued to craft this power point template diagram. This PPT contain the concept of data storage and safety. Use this PPT for business and technology related presentations.
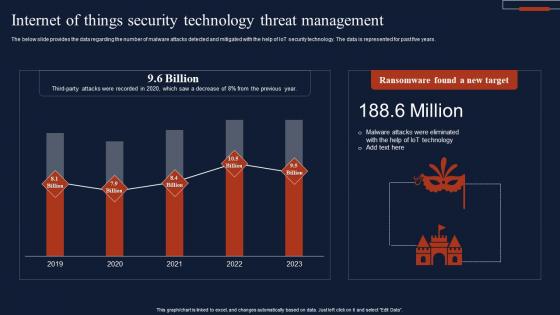
Internet Of Things Security Technology Threat Management Summary Pdf
The below slide provides the data regarding the number of malware attacks detected and mitigated with the help of IoT security technology. The data is represented for past five years. Pitch your topic with ease and precision using this Internet Of Things Security Technology Threat Management Summary Pdf This layout presents information on Ransomware Found, New Target, Threat Management It is also available for immediate download and adjustment. So, changes can be made in the color, design, graphics or any other component to create a unique layout. The below slide provides the data regarding the number of malware attacks detected and mitigated with the help of IoT security technology. The data is represented for past five years.
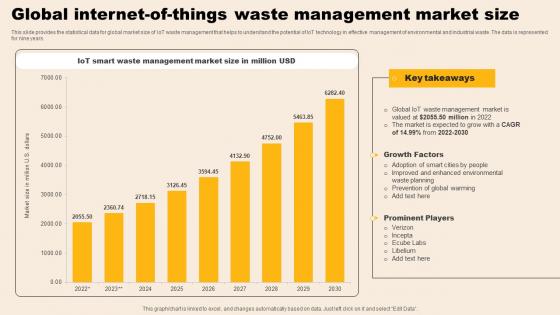
Global Internet Of Things Waste Management Market Size Microsoft Pdf
This slide provides the statistical data for global market size of IoT waste management that helps to understand the potential of IoT technology in effective management of environmental and industrial waste. The data is represented for nine years. Showcasing this set of slides titled Global Internet Of Things Waste Management Market Size Microsoft Pdf. The topics addressed in these templates are Iot Smart, Waste Management, Market Size. All the content presented in this PPT design is completely editable. Download it and make adjustments in color, background, font etc. as per your unique business setting. This slide provides the statistical data for global market size of IoT waste management that helps to understand the potential of IoT technology in effective management of environmental and industrial waste. The data is represented for nine years.
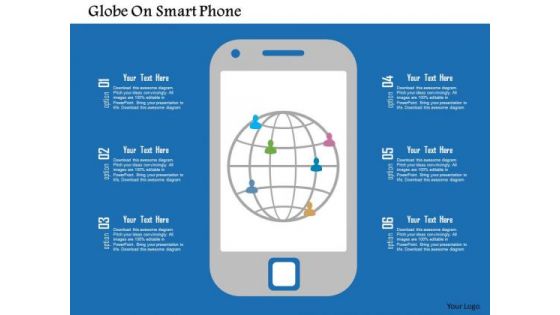
Business Diagram Globe On Smart Phone Presentation Template
Our above slide contains graphics of globe on smart phone. It helps to display GPS service on mobile phones Use this diagram to impart more clarity to data and to create more sound impact on viewers.
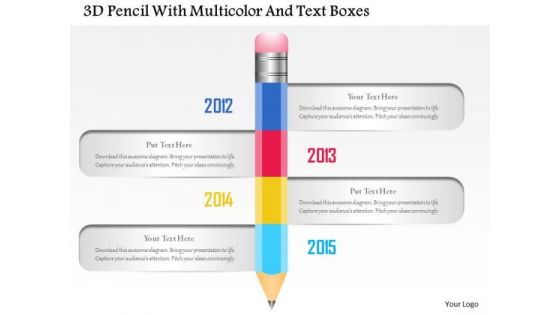
Busines Diagram 3d Pencil With Multicolor And Text Boxes Presentation Template
This business diagram displays four text boxes around a pencil. This professional slide can be used for data display in visual manner. Download this diagram for your school and education related presentations.
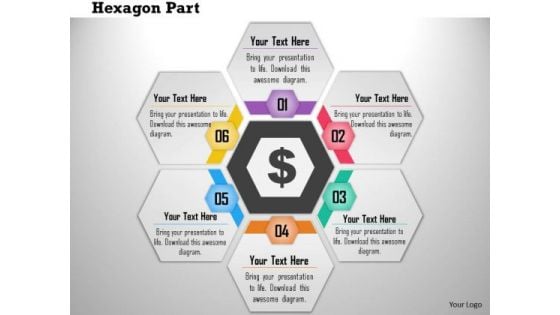
Business Diagram Six Hexagon Text Boxes In Cyclic Order Presentation Template
This PowerPoint template has been designed with graphic of six hexagon text boxes in cyclic order. This diagram can be used to depict data flow. Use this diagram to build exclusive presentation for your viewers.
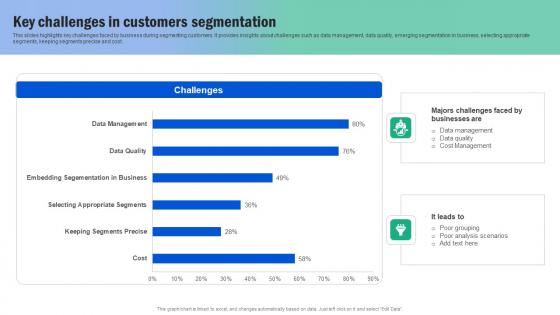
Key Challenges In Customers Segmentation Guide For Segmenting And Formulating Structure Pdf
This slides highlights key challenges faced by business during segmenting customers. It provides insights about challenges such as data management, data quality, emerging segmentation in business, selecting appropriate segments, keeping segments precise and cost. Do you know about Slidesgeeks Key Challenges In Customers Segmentation Guide For Segmenting And Formulating Structure Pdf These are perfect for delivering any kind od presentation. Using it, create PowerPoint presentations that communicate your ideas and engage audiences. Save time and effort by using our pre designed presentation templates that are perfect for a wide range of topic. Our vast selection of designs covers a range of styles, from creative to business, and are all highly customizable and easy to edit. Download as a PowerPoint template or use them as Google Slides themes. This slides highlights key challenges faced by business during segmenting customers. It provides insights about challenges such as data management, data quality, emerging segmentation in business, selecting appropriate segments, keeping segments precise and cost.
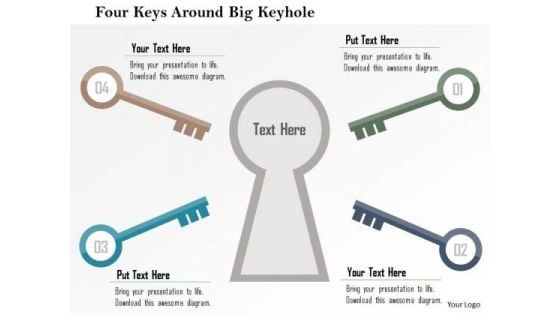
Business Diagram Four Keys Around Big Keyhole Presentation Template
Our above slide contains graphics of keys around big keyhole. It helps to exhibit finding possible solutions. Use this diagram to impart more clarity to data and to create more sound impact on viewers.
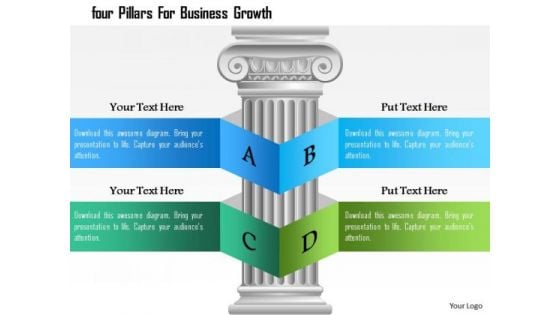
Business Diagram Four Pillars For Business Growth Presentation Template
Concept of text and data representation with business growth has been displayed in this power point template. This PPT contains the graphic of pillar and alphabet ribbons. Use this PPT diagram and get good comments from your viewers.
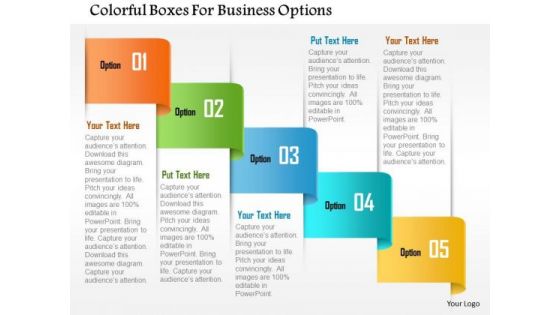
Business Diagram Colorful Boxes For Business Options Presentation Template
Graphics of colorful text boxes have been used to design this power point template. This diagram contains the concept of data representation. Illustrate your ideas and imprint them in the minds of your team with this template.
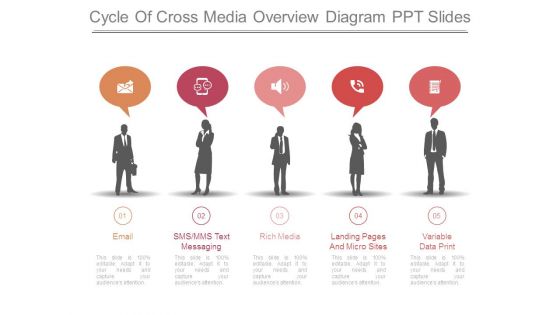
Cycle Of Cross Media Overview Diagram Ppt Slides
This is a cycle of cross media overview diagram ppt slides. This is a five stage process. The stages in this process are email, sms, mms text messaging, rich media, landing pages and micro sites, variable data print.
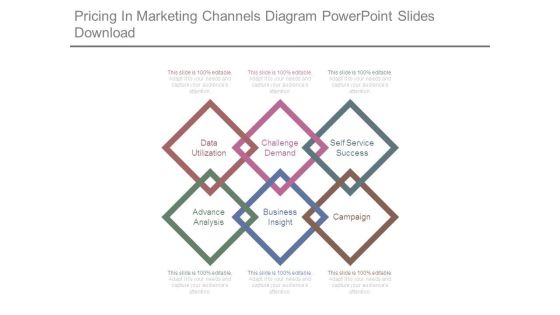
Pricing In Marketing Channels Diagram Powerpoint Slides Download
This is a pricing in marketing channels diagram powerpoint slides download. This is a six stage process. The stages in this process are data utilization, challenge demand, self service success, advance analysis, business insight, campaign.
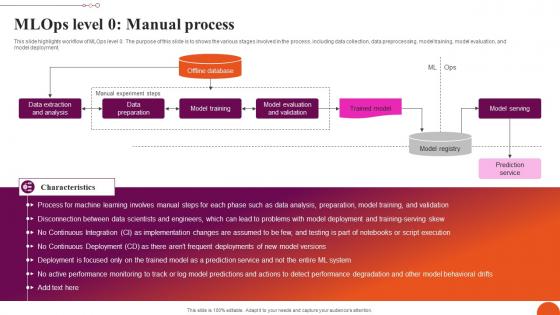
MLOps Level 0 Manual Process Exploring Machine Learning Operations Themes Pdf
This slide highlights workflow of MLOps level 0. The purpose of this slide is to shows the various stages involved in the process, including data collection, data preprocessing, model training, model evaluation, and model deployment. Make sure to capture your audiences attention in your business displays with our gratis customizable MLOps Level 0 Manual Process Exploring Machine Learning Operations Themes Pdf. These are great for business strategies, office conferences, capital raising or task suggestions. If you desire to acquire more customers for your tech business and ensure they stay satisfied, create your own sales presentation with these plain slides. This slide highlights workflow of MLOps level 0. The purpose of this slide is to shows the various stages involved in the process, including data collection, data preprocessing, model training, model evaluation, and model deployment.
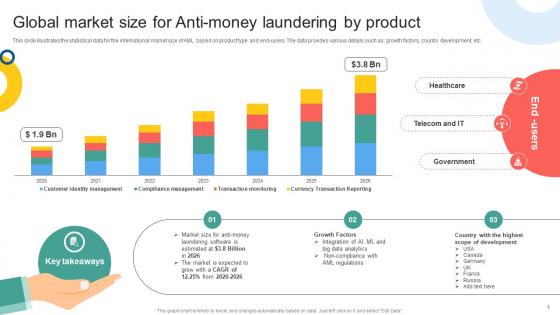
Global Market Size For Anti Money Laundering Mapping Out The Anti Money Fin SS V
This slide illustrates the statistical data for the international market size of AML based on product type and end-users. The data provides various details such as growth factors, country development, etc. Explore a selection of the finest Global Market Size For Anti Money Laundering Mapping Out The Anti Money Fin SS V here. With a plethora of professionally designed and pre-made slide templates, you can quickly and easily find the right one for your upcoming presentation. You can use our Global Market Size For Anti Money Laundering Mapping Out The Anti Money Fin SS V to effectively convey your message to a wider audience. Slidegeeks has done a lot of research before preparing these presentation templates. The content can be personalized and the slides are highly editable. Grab templates today from Slidegeeks. This slide illustrates the statistical data for the international market size of AML based on product type and end-users. The data provides various details such as growth factors, country development, etc.
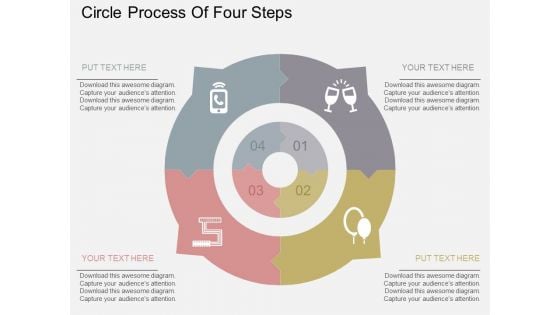
Circle Process Of Four Steps Powerpoint Templates
Our above slide contains graphics of bulb with success graph. It helps to exhibit planning for growth. Use this diagram to impart more clarity to data and to create more sound impact on viewers.
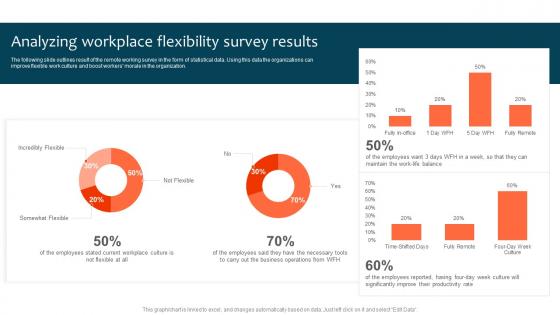
Analyzing Workplace Flexibility Survey Results Optimizing Staff Retention Rate Pictures Pdf
The following slide outlines result of the remote working survey in the form of statistical data. Using this data the organizations can improve flexible work culture and boost workers morale in the organization. The best PPT templates are a great way to save time, energy, and resources. Slidegeeks have 100 percent editable powerpoint slides making them incredibly versatile. With these quality presentation templates, you can create a captivating and memorable presentation by combining visually appealing slides and effectively communicating your message. Download Analyzing Workplace Flexibility Survey Results Optimizing Staff Retention Rate Pictures Pdf from Slidegeeks and deliver a wonderful presentation. The following slide outlines result of the remote working survey in the form of statistical data. Using this data the organizations can improve flexible work culture and boost workers morale in the organization.
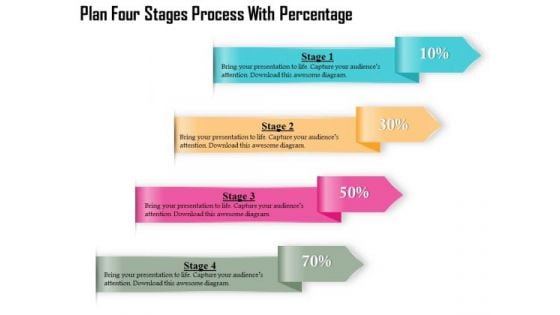
Business Diagram Four Stages Process With Percentage Presentation Template
Four multicolored tags in vertical order has been used to decorate this business diagram. This diagram contains the concept of financial data display with percent values. This diagram can be used for management and finance related presentations.

Business Diagram Three Stages Process Percentage Presentation Template
Three multicolored tags in vertical order has been used to decorate this business diagram. This diagram contains the concept of financial data display with percent values. This diagram can be used for management and finance related presentations.
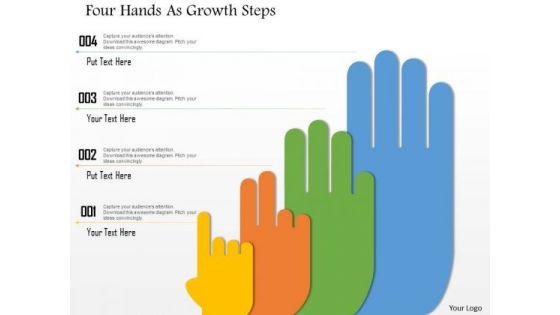
Business Diagram Four Hands As Growth Steps Presentation Template
This business diagram displays four staged hand process diagram. This professional diagram slide helps to display data and process flow. Use this slide for your business and marketing related presentations.
Business Diagram Fishes In Ocean With Four Options Presentation Template
This power point diagram template has been designed with graphic of ocean and fish. This PPT diagram contains the concept of idea generation and data representation. Use this PPT diagram for business and marketing related presentations.
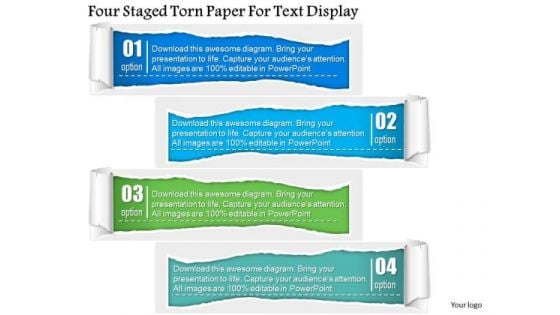
Business Diagram Four Staged Torn Paper For Text Display PowerPoint Template
Four staged torn paper style text boxes has been used to design this power point template. This PPT contains the concept of text representation for business process. Use this PPT and build quality presentation for data and process related topics.
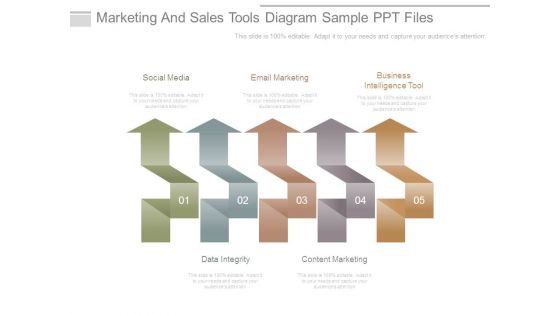
Marketing And Sales Tools Diagram Sample Ppt Files
This is a marketing and sales tools diagram sample ppt files. This is a five stage process. The stages in this process are social media, email marketing, business intelligence tool, data integrity, content marketing.

Business Diagram Six Staged Business Text Boxes In Banner Style Presentation Template
This Power Point template slide contains the concept of business data representation. This PPt slide has been designed with graphic of six staged business text boxes. Use this template slide and build innovative presentation for your viewers.
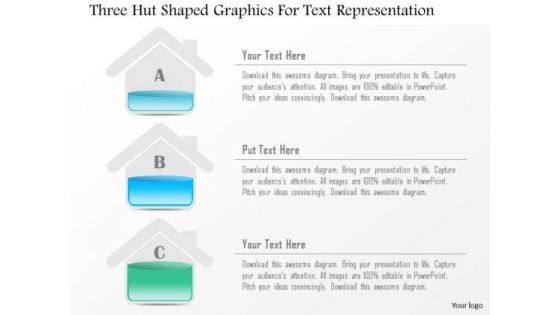
Business Diagram Three Hut Shaped Graphics For Text Representation Presentation Template
Three staged hut shaped graphics has been used to craft this power point template. This PPT contains the concept of text representation. Use this PPT for business and marketing data related presentations.
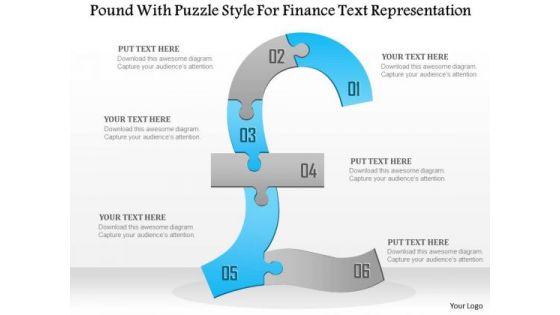
Business Diagram Pound With Puzzle Style For Finance Text Representation Presentation Template
This Power Point template slide has been used to display the concept of financial data representation. This PPT slide contains the graphic of pound in puzzle style. Use this PPT slide and make an exclusive presentation for financial topics.
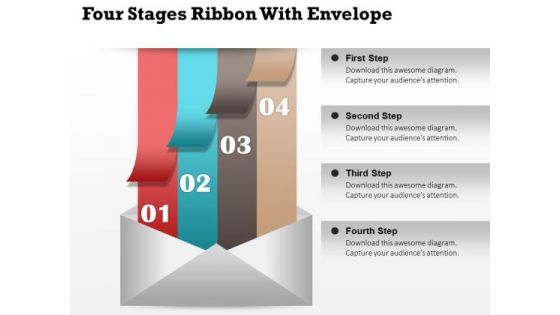
Business Diagram Four Stages Ribbon With Envelope Presentation Template
Concept of data storage and communication has been displayed in this business diagram with graphic of four colored ribbons and envelop. Use this diagram template for business communication related presentations.

 Home
Home