Data Icon
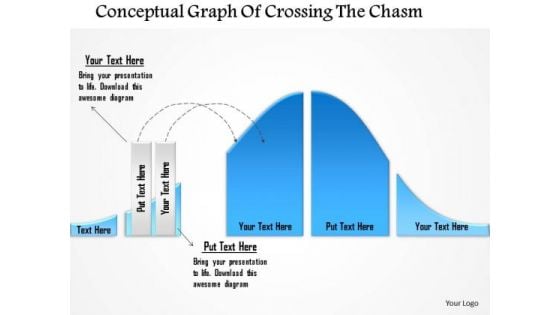
Business Diagram Conceptual Graph Of Crossing The Chasm Presentation Template
This business diagram has been designed with graphic of 3d graph. This slide contains the concept of chasm and data calculation. Use this slide to display chasm crossing condition. This business diagram adds value to your ideas.
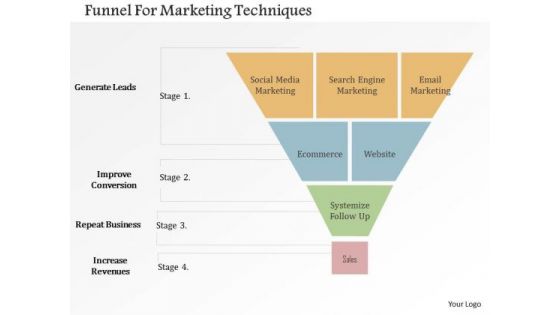
Business Diagram Funnel For Marketing Techniques Presentation Template
Our above slide contains graphics of funnel diagram. It helps to exhibit marketing techniques. Use this diagram to impart more clarity to data and to create more sound impact on viewers.
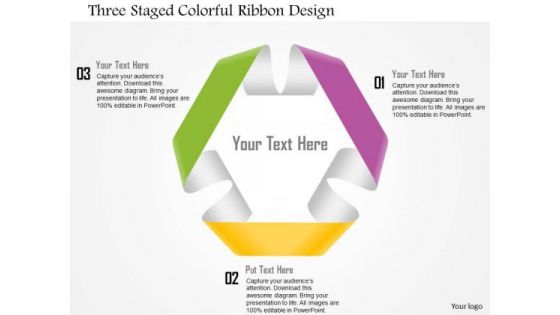
Business Diagram Three Staged Colorful Ribbon Design Presentation Template
This business diagram displays three staged circular ribbon. This Power Point slide can be used for data representation. Use this PPT slide to show flow of activities in circular manner. Get professional with this exclusive business slide.
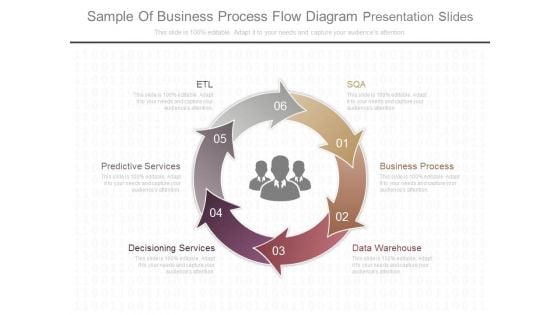
Sample Of Business Process Flow Diagram Presentation Slides
This is a sample of business process flow diagram presentation slides. This is a six stage process. The stages in this process are etl, sqa, business process, data warehouse, decisioning services, predictive services.
Voice Of The Customer Six Sigma Diagram Ppt Images
This is a voice of the customer six sigma diagram ppt images. This is a five stage process. The stages in this process are groups, warranty, metrics, data returns, survey, voice of customer.
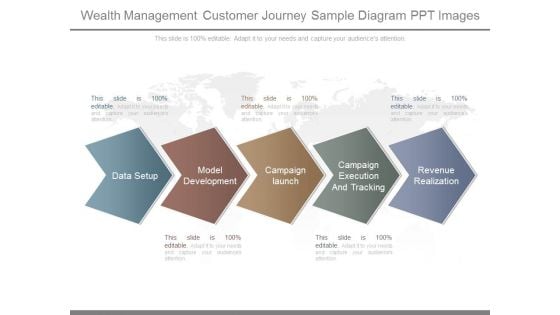
Wealth Management Customer Journey Sample Diagram Ppt Images
This is a wealth management customer journey sample diagram ppt images. This is a five stage process. The stages in this process are data setup, model development, campaign launch, campaign execution and tracking, revenue realization.
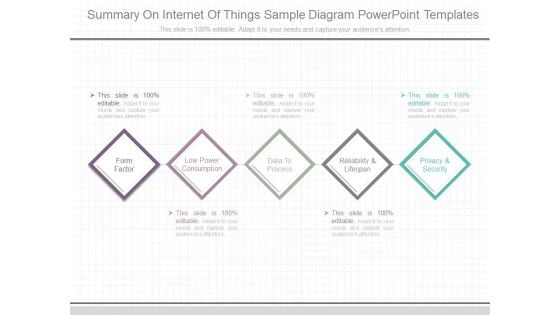
Summary On Internet Of Things Sample Diagram Powerpoint Templates
This is a summary on internet of things sample diagram powerpoint templates. This is a five stage process. The stages in this process are form factor, low power consumption, data to process, reliability and lifespan, privacy and security.
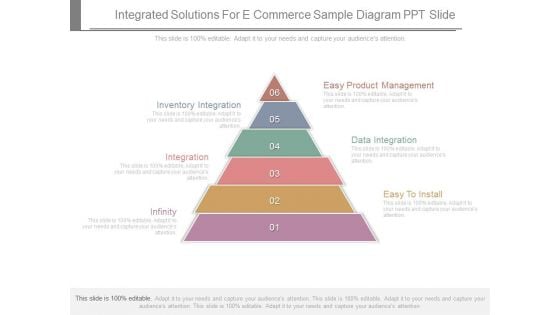
Integrated Solutions For E Commerce Sample Diagram Ppt Slide
This is a integrated solutions for e commerce sample diagram ppt slide. This is a six stage process. The stages in this process are inventory integration, integration, infinity, easy to install, data integration, easy product management.
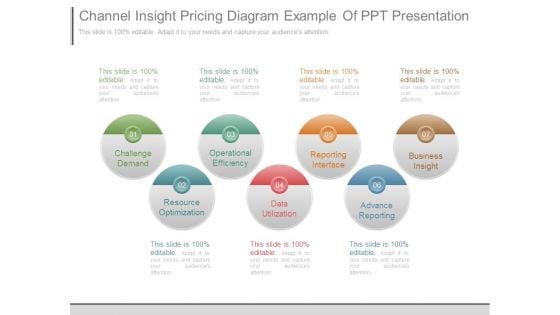
Channel Insight Pricing Diagram Example Of Ppt Presentation
This is a channel insight pricing diagram example of ppt presentation. This is a seven stage process. The stages in this process are challenge demand, operational efficiency, reporting interface, business insight, resource optimization, data utilization, advance reporting.
Process Of Sales Account Management Diagram Powerpoint Templates Download
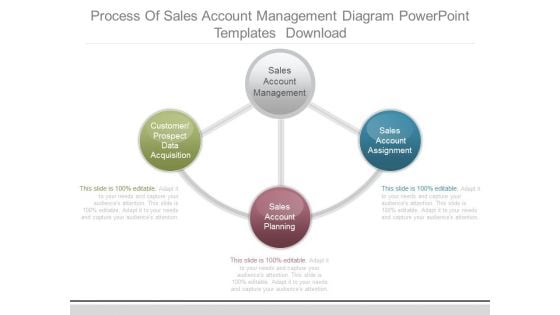
This is a process of sales account management diagram powerpoint templates download. This is a three stage process. The stages in this process are sales account management, customer prospect data acquisition, sales account assignment, sales account planning.
Email Marketing Steps Diagram Powerpoint Slide Presentation Tips
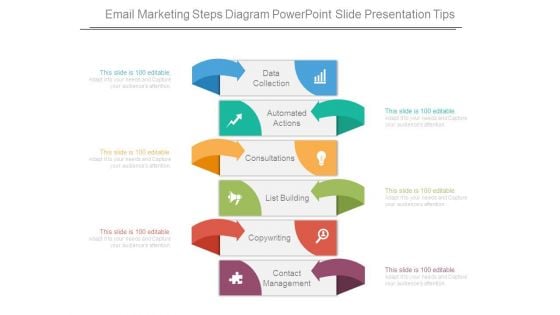
This is a email marketing steps diagram powerpoint slide presentation tips. This is a six stage process. The stages in this process are data collection, automated actions, consultations, list building, copywriting, contact management.
Sop Strategic Plan Ppt Diagram Powerpoint Templates Microsoft
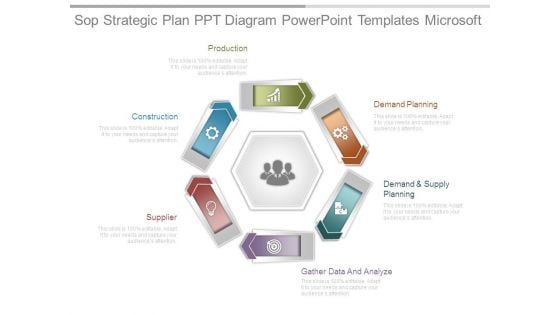
This is a sop strategic plan ppt diagram powerpoint templates microsoft. This is a six stage process. The stages in this process are production, construction, supplier, gather data and analyze, demand and supply, demand planning.
Local Retail Marketing Strategy Diagram Example Of Ppt
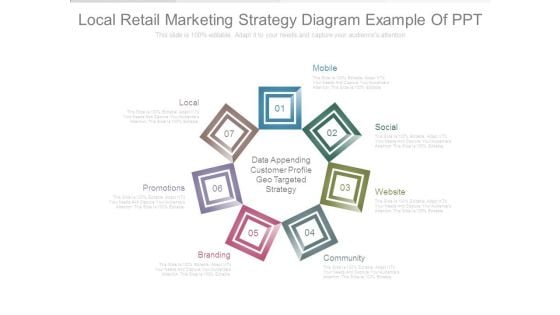
This is a local retail marketing strategy diagram example of ppt. This is a seven stage process. The stages in this process are local, promotions, branding, mobile, social, website, community, data appending customer profile geo targeted strategy.
B2b Integration Design Sample Diagram Example Ppt Presentation
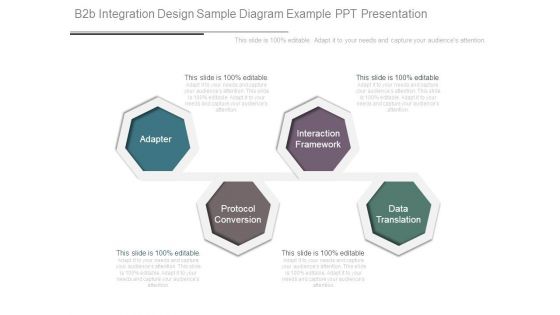
This is a b2b integration design sample diagram example ppt presentation. This is a four stage process. The stages in this process are adapter, protocol conversion, interaction framework, data translation.
Business Development Planning Template Ppt Slide
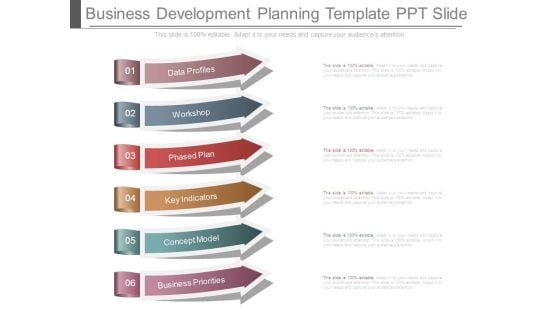
This is a business development planning template ppt slide. This is a six stage process. The stages in this process are data profiles, workshop, phased plan, key indicators, concept model, business priorities.
Mobile Upload Download Sharing Networking Ppt Slides Graphics
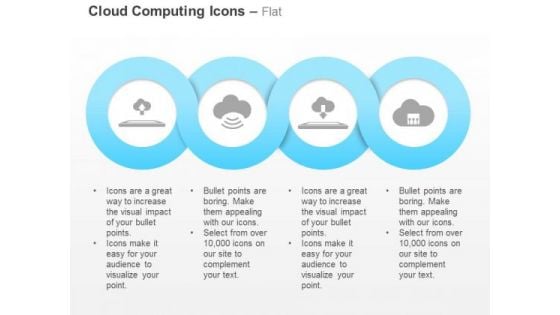
Concept of mobile upload and download with sharing techniques can be described with this icon template. We have used different cloud icons with mobile service. Use this editable template for your mobile technology related topics.
Forecast Demand Using Inventory Administration Techniques For Enhanced Stock Accuracy Template Pdf
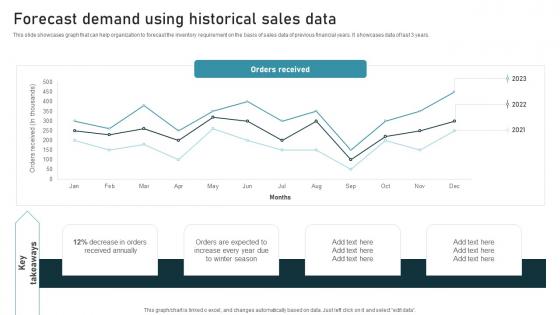
This slide showcases graph that can help organization to forecast the inventory requirement on the basis of sales data of previous financial years. It showcases data of last 3 years. Are you in need of a template that can accommodate all of your creative concepts This one is crafted professionally and can be altered to fit any style. Use it with Google Slides or PowerPoint. Include striking photographs, symbols, depictions, and other visuals. Fill, move around, or remove text boxes as desired. Test out color palettes and font mixtures. Edit and save your work, or work with colleagues. Download Forecast Demand Using Inventory Administration Techniques For Enhanced Stock Accuracy Template Pdf and observe how to make your presentation outstanding. Give an impeccable presentation to your group and make your presentation unforgettable. This slide showcases graph that can help organization to forecast the inventory requirement on the basis of sales data of previous financial years. It showcases data of last 3 years.
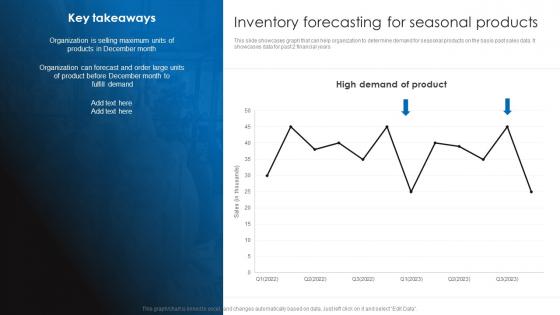
Inventory Forecasting For Seasonal Products Retail Stock Administration Strategies Template Pdf
This slide showcases graph that can help organization to determine demand for seasonal products on the basis past sales data. It showcases data for past 2 financial years.Slidegeeks has constructed Inventory Forecasting For Seasonal Products Retail Stock Administration Strategies Template Pdf after conducting extensive research and examination. These presentation templates are constantly being generated and modified based on user preferences and critiques from editors. Here, you will find the most attractive templates for a range of purposes while taking into account ratings and remarks from users regarding the content. This is an excellent jumping-off point to explore our content and will give new users an insight into our top-notch PowerPoint Templates. This slide showcases graph that can help organization to determine demand for seasonal products on the basis past sales data. It showcases data for past 2 financial years.
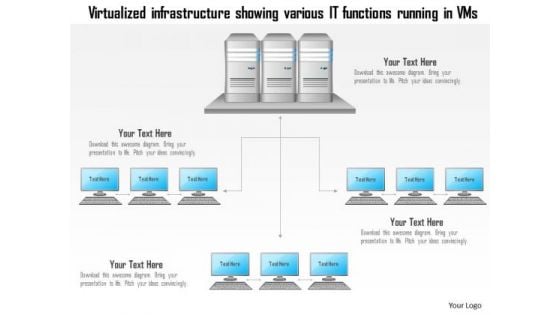
Business Diagram Virtualized Infrastructure Showing Various It Functions Running In Vms Ppt Slide
Graphic of data base server and VMS has been used to design this technology diagram. This slide contains the virtualized infrastructure for various functions. Use this diagram for technology related presentations.
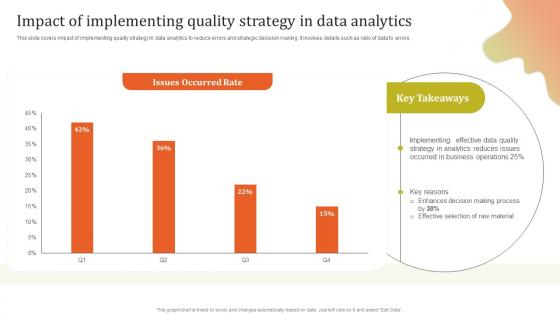
Impact Of Implementing Quality Executing Effective Quality Enhancement Sample Pdf
This slide covers impact of implementing quality strategy in data analytics to reduce errors and strategic decision making. It involves details such as ratio of data to errors. Coming up with a presentation necessitates that the majority of the effort goes into the content and the message you intend to convey. The visuals of a PowerPoint presentation can only be effective if it supplements and supports the story that is being told. Keeping this in mind our experts created Impact Of Implementing Quality Executing Effective Quality Enhancement Sample Pdf to reduce the time that goes into designing the presentation. This way, you can concentrate on the message while our designers take care of providing you with the right template for the situation. This slide covers impact of implementing quality strategy in data analytics to reduce errors and strategic decision making. It involves details such as ratio of data to errors.
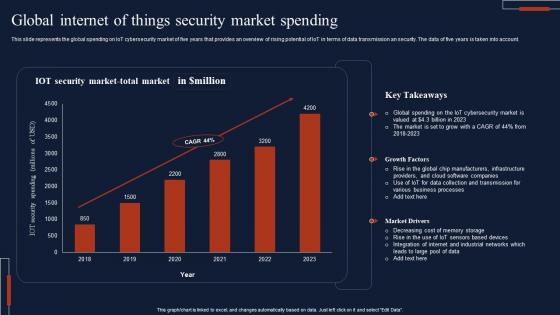
Global Internet Of Things Security Market Spending Download Pdf
This slide represents the global spending on IoT cybersecurity market of five years that provides an overview of rising potential of IoT in terms of data transmission an security. The data of five years is taken into account. Pitch your topic with ease and precision using this Global Internet Of Things Security Market Spending Download Pdf This layout presents information on IOT Security, Market Total, Key Takeaways It is also available for immediate download and adjustment. So, changes can be made in the color, design, graphics or any other component to create a unique layout. This slide represents the global spending on IoT cybersecurity market of five years that provides an overview of rising potential of IoT in terms of data transmission an security. The data of five years is taken into account.
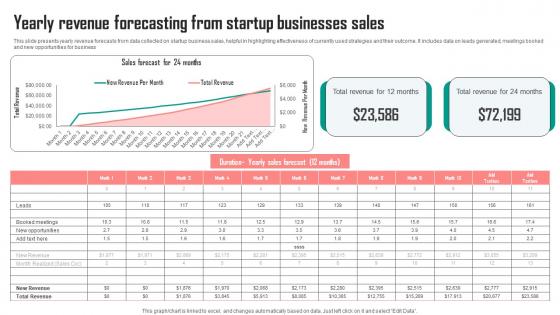
Yearly Revenue Forecasting From Startup Businesses Sales Graphics Pdf
This slide presents yearly revenue forecasts from data collected on startup business sales, helpful in highlighting effectiveness of currently used strategies and their outcome. It includes data on leads generated, meetings booked and new opportunities for business Pitch your topic with ease and precision using this Yearly Revenue Forecasting From Startup Businesses Sales Graphics Pdf. This layout presents information on Sales, Total Revenue, Months. It is also available for immediate download and adjustment. So, changes can be made in the color, design, graphics or any other component to create a unique layout. This slide presents yearly revenue forecasts from data collected on startup business sales, helpful in highlighting effectiveness of currently used strategies and their outcome. It includes data on leads generated, meetings booked and new opportunities for business
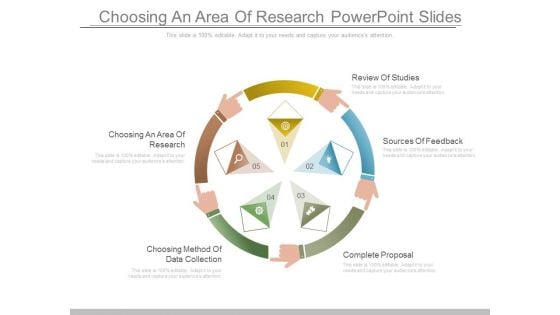
Choosing An Area Of Research Powerpoint Slides
This is a choosing an area of research powerpoint slides. This is a five stage process. The stages in this process are choosing an area of research, choosing method of data collection, review of studies, sources of feedback, complete proposal.
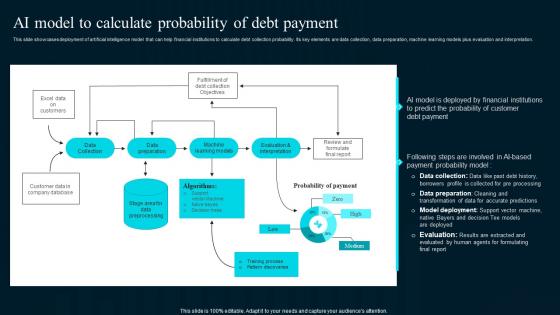
Ai Model To Calculate Probability Of Debt Artificial Intelligence Applications Introduction Pdf
This slide showcases deployment of artificial intelligence model that can help financial institutions to calculate debt collection probability. Its key elements are data collection, data preparation, machine learning models plus evaluation and interpretation.If your project calls for a presentation, then Slidegeeks is your go-to partner because we have professionally designed, easy-to-edit templates that are perfect for any presentation. After downloading, you can easily edit Ai Model To Calculate Probability Of Debt Artificial Intelligence Applications Introduction Pdf and make the changes accordingly. You can rearrange slides or fill them with different images. Check out all the handy templates This slide showcases deployment of artificial intelligence model that can help financial institutions to calculate debt collection probability. Its key elements are data collection, data preparation, machine learning models plus evaluation and interpretation.
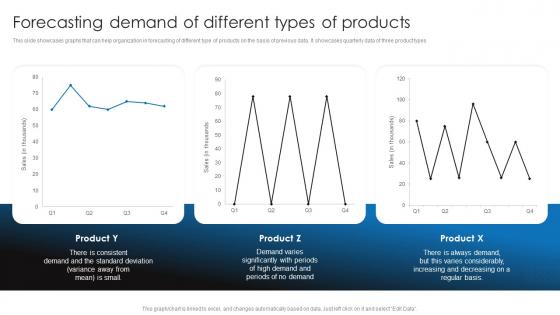
Forecasting Demand Of Different Types Of Retail Stock Administration Strategies Topic Pdf
This slide showcases graphs that can help organization in forecasting of different type of products on the basis of previous data. It showcases quarterly data of three product types.The best PPT templates are a great way to save time, energy, and resources. Slidegeeks have 100Precent editable powerpoint slides making them incredibly versatile. With these quality presentation templates, you can create a captivating and memorable presentation by combining visually appealing slides and effectively communicating your message. Download Forecasting Demand Of Different Types Of Retail Stock Administration Strategies Topic Pdf from Slidegeeks and deliver a wonderful presentation. This slide showcases graphs that can help organization in forecasting of different type of products on the basis of previous data. It showcases quarterly data of three product types
Forecasting Demand Inventory Administration Techniques For Enhanced Stock Accuracy Elements Pdf
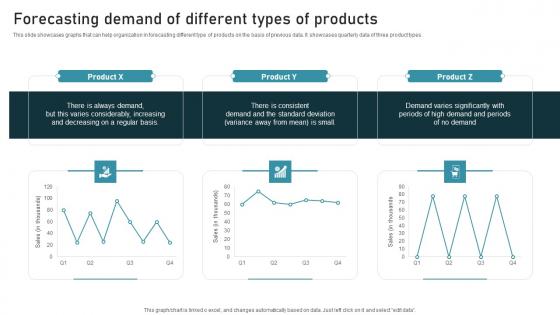
This slide showcases graphs that can help organization in forecasting different type of products on the basis of previous data. It showcases quarterly data of three product types. Crafting an eye catching presentation has never been more straightforward. Let your presentation shine with this tasteful yet straightforward Forecasting Demand Inventory Administration Techniques For Enhanced Stock Accuracy Elements Pdf template. It offers a minimalistic and classy look that is great for making a statement. The colors have been employed intelligently to add a bit of playfulness while still remaining professional. Construct the ideal Forecasting Demand Inventory Administration Techniques For Enhanced Stock Accuracy Elements Pdf that effortlessly grabs the attention of your audience Begin now and be certain to wow your customers This slide showcases graphs that can help organization in forecasting different type of products on the basis of previous data. It showcases quarterly data of three product types.
Inventory Forecasting Inventory Administration Techniques For Enhanced Stock Accuracy Designs Pdf
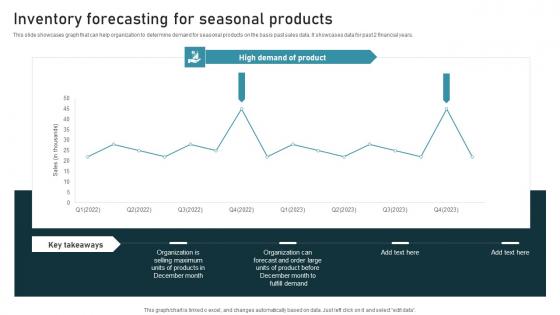
This slide showcases graph that can help organization to determine demand for seasonal products on the basis past sales data. It showcases data for past 2 financial years. This modern and well arranged Inventory Forecasting Inventory Administration Techniques For Enhanced Stock Accuracy Designs Pdf provides lots of creative possibilities. It is very simple to customize and edit with the Powerpoint Software. Just drag and drop your pictures into the shapes. All facets of this template can be edited with Powerpoint, no extra software is necessary. Add your own material, put your images in the places assigned for them, adjust the colors, and then you can show your slides to the world, with an animated slide included. This slide showcases graph that can help organization to determine demand for seasonal products on the basis past sales data. It showcases data for past 2 financial years.
Forecasting Demand Of Different Types Of Products Tactical Guide Stock Administration Microsoft Pdf
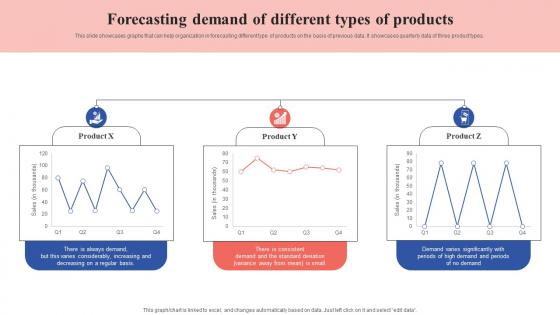
This slide showcases graphs that can help organization in forecasting different type of products on the basis of previous data. It showcases quarterly data of three product types. If your project calls for a presentation, then Slidegeeks is your go-to partner because we have professionally designed, easy-to-edit templates that are perfect for any presentation. After downloading, you can easily edit Forecasting Demand Of Different Types Of Products Tactical Guide Stock Administration Microsoft Pdf and make the changes accordingly. You can rearrange slides or fill them with different images. Check out all the handy templates This slide showcases graphs that can help organization in forecasting different type of products on the basis of previous data. It showcases quarterly data of three product types.
Inventory Forecasting For Seasonal Products Tactical Guide Stock Administration Formats Pdf
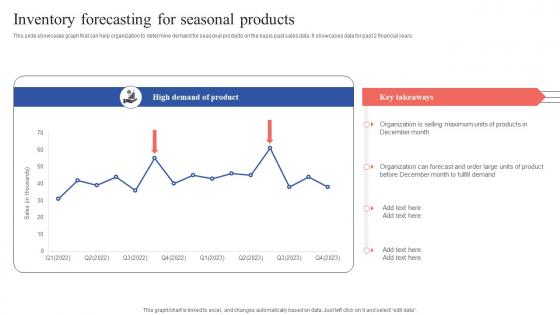
This slide showcases graph that can help organization to determine demand for seasonal products on the basis past sales data. It showcases data for past 2 financial years. Make sure to capture your audiences attention in your business displays with our gratis customizable Inventory Forecasting For Seasonal Products Tactical Guide Stock Administration Formats Pdf. These are great for business strategies, office conferences, capital raising or task suggestions. If you desire to acquire more customers for your tech business and ensure they stay satisfied, create your own sales presentation with these plain slides. This slide showcases graph that can help organization to determine demand for seasonal products on the basis past sales data. It showcases data for past 2 financial years.
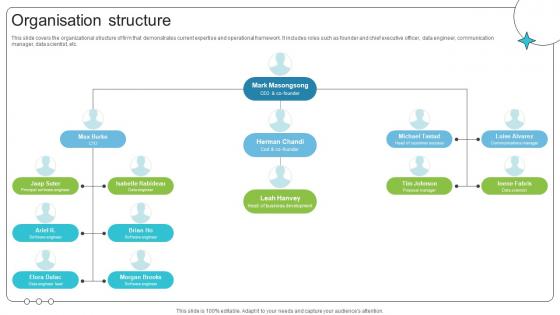
Organisation Structure Investor Oriented Urbanlogiq Fundraising Deck
This slide covers the organizational structure of firm that demonstrates current expertise and operational framework. It includes roles such as founder and chief executive officer, data engineer, communication manager, data scientist, etc. Crafting an eye-catching presentation has never been more straightforward. Let your presentation shine with this tasteful yet straightforward Organisation Structure Investor Oriented Urbanlogiq Fundraising Deck template. It offers a minimalistic and classy look that is great for making a statement. The colors have been employed intelligently to add a bit of playfulness while still remaining professional. Construct the ideal Organisation Structure Investor Oriented Urbanlogiq Fundraising Deck that effortlessly grabs the attention of your audience Begin now and be certain to wow your customers This slide covers the organizational structure of firm that demonstrates current expertise and operational framework. It includes roles such as founder and chief executive officer, data engineer, communication manager, data scientist, etc.

Business Diagram Blue Cloud With Database Server And Laptop PowerPoint Template
Graphic of blue cloud and server has been used to craft this power point template. This PPT contains the concept of database management. Use this PPT diagram for your data and database related topics in any technical presentations.
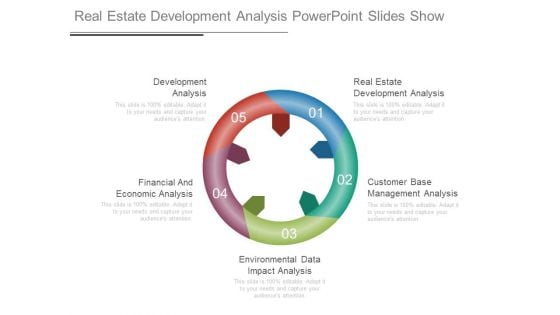
Real Estate Development Analysis Powerpoint Slides Show
This is a real estate development analysis powerpoint slides show. This is a five stage process. The stages in this process are development analysis, financial and economic analysis, environmental data impact analysis, customer base management analysis, real estate development analysis.
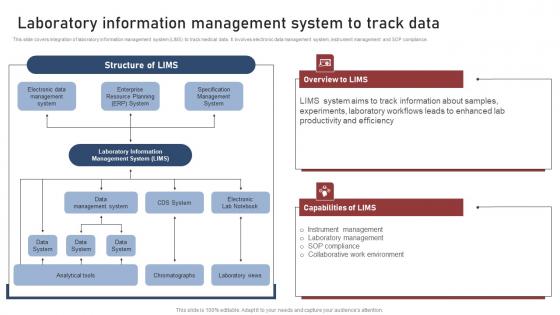
Laboratory Information Transforming Medical Workflows Via His Integration Mockup Pdf
This slide covers integration of laboratory information management system LIMS to track medical data. It involves electronic data management system, instrument management and SOP compliance. Retrieve professionally designed Laboratory Information Transforming Medical Workflows Via His Integration Mockup Pdf to effectively convey your message and captivate your listeners. Save time by selecting pre made slideshows that are appropriate for various topics, from business to educational purposes. These themes come in many different styles, from creative to corporate, and all of them are easily adjustable and can be edited quickly. Access them as PowerPoint templates or as Google Slides themes. You do not have to go on a hunt for the perfect presentation because Slidegeeks got you covered from everywhere. This slide covers integration of laboratory information management system LIMS to track medical data. It involves electronic data management system, instrument management and SOP compliance.

Business Diagram Four Staged Arrows With Different Graphics Of Communication Concept Presentation Te
Four staged arrow with different graphics has been used to craft this power point template. This PPT diagram contains the concept of data communication. Use this PPT for business and technology related presentations.
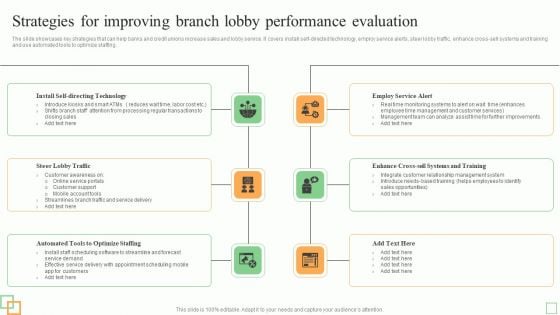
Strategies For Improving Branch Lobby Performance Evaluation Graphics PDF
Showcasing this set of slides titled Icon For Branch Performance Evaluation Measurement And Analysis Slides PDF. The topics addressed in these templates are Icon Branch, Performance Evaluation, Measurement Analysis. All the content presented in this PPT d
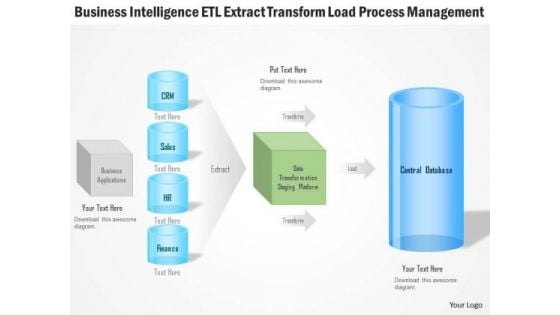
Business Diagram Business Intelligence Etl Extract Transform Load Process Management Ppt Slide
Explain the load process management and ETL extract transform with this unique PPT. This PPT contains the graphic of computer server and data base with connectivity. This PPT can be used for business intelligence related topics in any presentation.
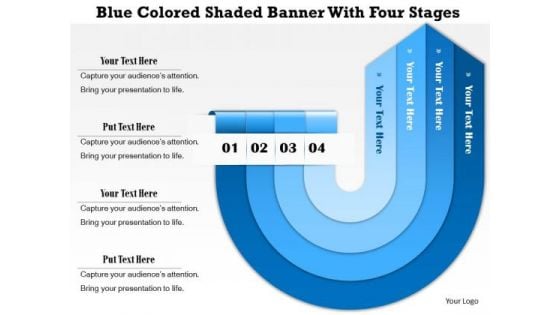
Business Diagram Blue Colored Shaded Banner With Four Stages Presentation Template
Blue colored twisted arrows are used to design this business diagram. These arrows are in banner style with four stages. Use this amazing slide for your data representation in effective manner. Build a unique presentation for your viewers
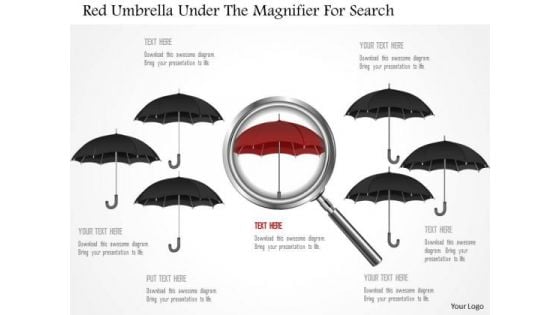
Business Diagram Red Umbrella Under The Magnifier For Search Presentation Template
Graphic of red umbrella and magnifier has been used to craft this PPT diagram. This PPT contains the concept of search. Use this PPT for data and business related presentations.

Sample Of Three Types Of Internet Of Things Diagram Ppt Slides
This is a sample of three types of internet of things diagram ppt slides. This is a three stage process. The stages in this process are things with networked sensors, analytic engines, data storage.
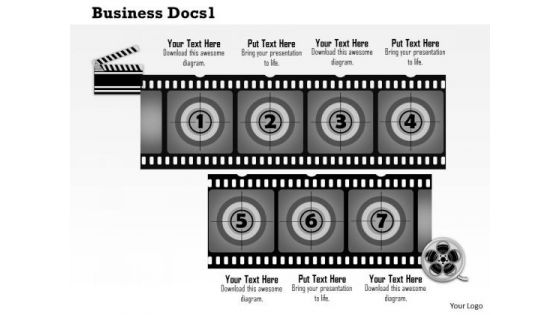
Business Framework Business Docs1 PowerPoint Presentation
Four text boxes with traffic lights are used to decorate this Power Point template slide. This PPT slide contains the concept of data representation. This PPT can be used for business and marketing presentations.
Four Horizontal Text Banners Powerpoint Template
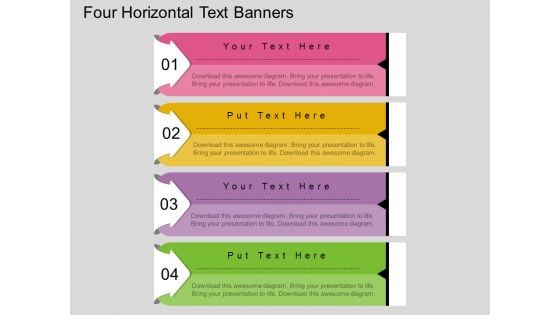
This PowerPoint template has been designed with four horizontal text banners. This diagram is excellent visual tools for business presentations. Download this PPT slide to explain complex data immediately and clearly.
Working Of Predictive Analytics Models Predictive Analytics For Empowering Graphics Pdf
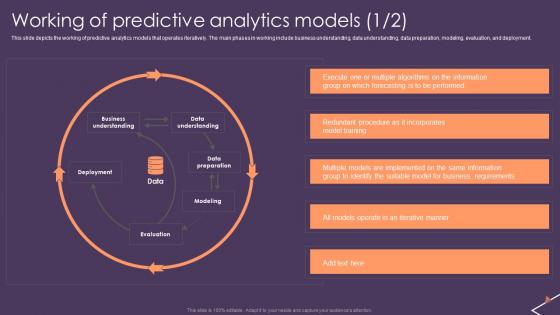
This slide depicts the working of predictive analytics models that operates iteratively. The main phases in working include business understanding, data understanding, data preparation, modeling, evaluation, and deployment. This Working Of Predictive Analytics Models Predictive Analytics For Empowering Graphics Pdf from Slidegeeks makes it easy to present information on your topic with precision. It provides customization options, so you can make changes to the colors, design, graphics, or any other component to create a unique layout. It is also available for immediate download, so you can begin using it right away. Slidegeeks has done good research to ensure that you have everything you need to make your presentation stand out. Make a name out there for a brilliant performance. This slide depicts the working of predictive analytics models that operates iteratively. The main phases in working include business understanding, data understanding, data preparation, modeling, evaluation, and deployment.
Parts Of Marketing Plan Ppt Presentation
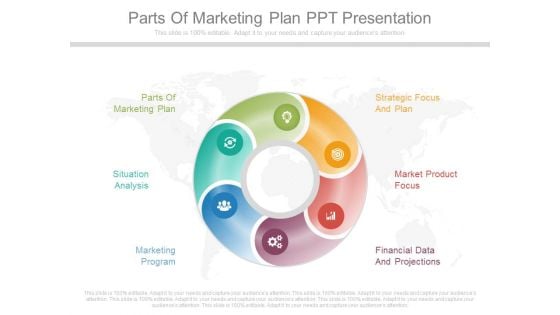
This is a parts of marketing plan ppt presentation. This is a six stage process. The stages in this process are parts of marketing plan, strategic focus and plan, situation analysis, market product focus, marketing program, financial data and projections.
Clustered Column Professional PDF
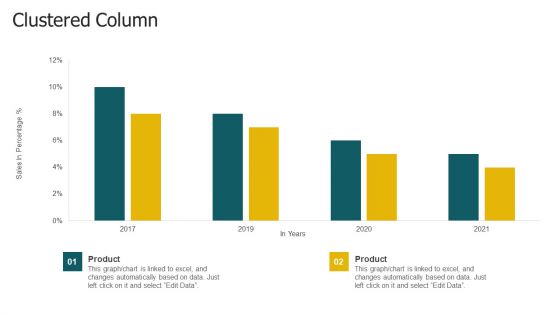
Deliver an awe inspiring pitch with this creative clustered column professional pdf bundle. Topics like product, data can be discussed with this completely editable template. It is available for immediate download depending on the needs and requirements of the user.
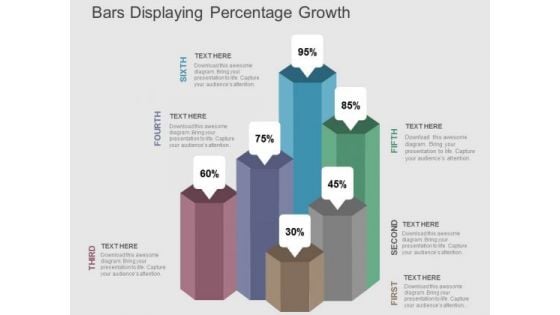
Bars Displaying Percentage Growth PowerPoint Templates
Our above PPT slide contains bar graph displaying percentage growth. This diagram of bar graph helps to depict statistical information. Use this diagram to impart more clarity to data and to create more sound impact on viewers.
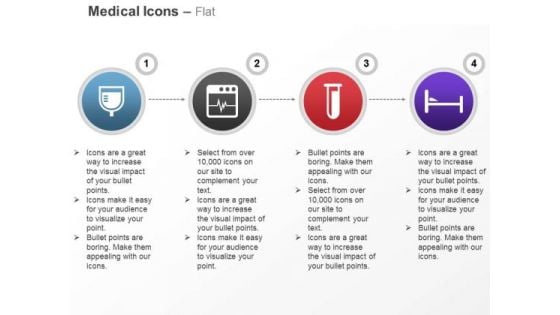
Glucose Ecg Monitor Testtube Bed Ppt Slides Graphics
This medical icon slide has been designed with graphic of glucose, ECG and monitor with test-tube icons. This PPT diagram helps to portray concept of medical care. Download this slide for medical and health related presentations.
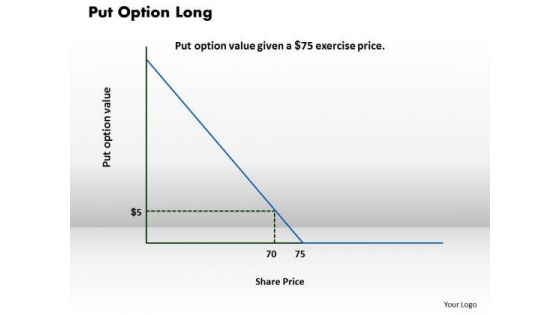
Business Framework Put Option Long PowerPoint Presentation
Our above diagram helps to represent data graphically. Use this put option long diagram for stock market related topics. This diagram has area for your own text to assist you get your point across.
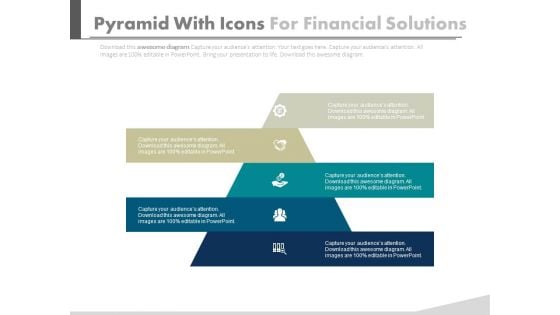
Pyramid For Financial Accounting Information Powerpoint Slides
This PowerPoint template has been designed with graphics of pyramid chart. This PPT slide can be used to prepare presentations for profit growth report and also for financial data analysis. You can download finance PowerPoint template to prepare awesome presentations.
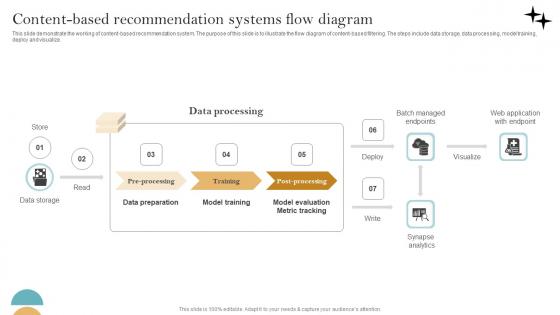
Recommender System Implementation Content Based Recommendation Systems Elements Pdf
This slide demonstrate the working of content-based recommendation system. The purpose of this slide is to illustrate the flow diagram of content-based filtering. The steps include data storage, data processing, model training, deploy and visualize. This modern and well-arranged Recommender System Implementation Content Based Recommendation Systems Elements Pdf provides lots of creative possibilities. It is very simple to customize and edit with the Powerpoint Software. Just drag and drop your pictures into the shapes. All facets of this template can be edited with Powerpoint no extra software is necessary. Add your own material, put your images in the places assigned for them, adjust the colors, and then you can show your slides to the world, with an animated slide included. This slide demonstrate the working of content-based recommendation system. The purpose of this slide is to illustrate the flow diagram of content-based filtering. The steps include data storage, data processing, model training, deploy and visualize.
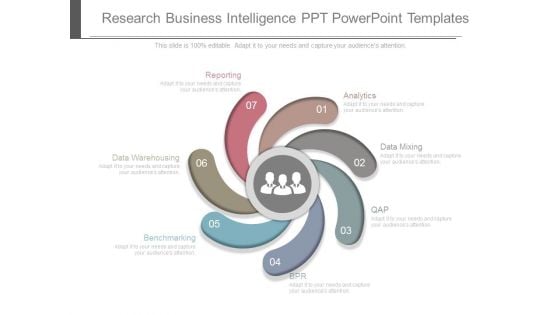
Research Business Intelligence Ppt Powerpoint Templates
This is a research business intelligence ppt powerpoint templates. This is a seven stage process. The stages in this process are data warehousing, reporting, analytics, datamining, qap, epr, benchmarking.
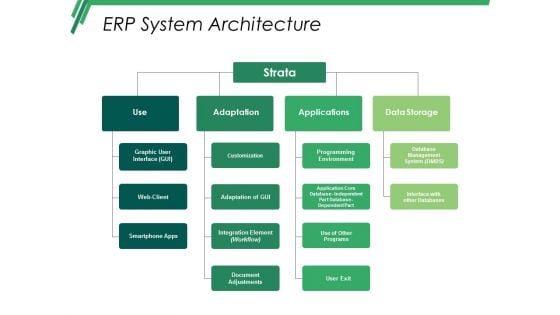
Erp System Architecture Ppt PowerPoint Presentation Pictures Master Slide
This is a erp system architecture ppt powerpoint presentation pictures master slide. This is a four stage process. The stages in this process are use, strata, adaptation, applications, data storage.
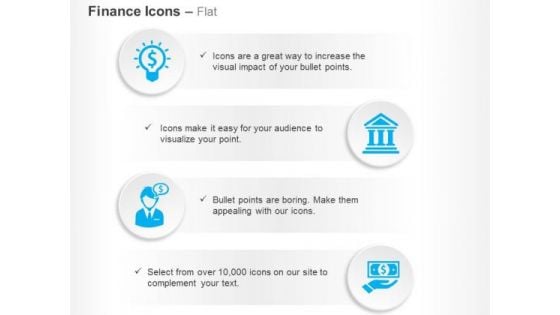
Financial Idea Generation Banking Solutions Ppt Slides Graphics
This template contains unique icons of idea generation and banking solution. You may use this template for finance and banking related topics. Use this icon template to build an exclusive presentation.
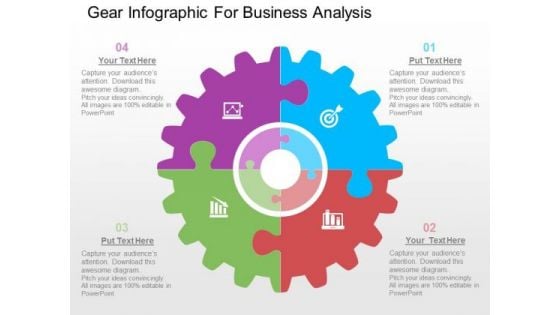
Gear Infographic For Business Analysis PowerPoint Templates
Our above slide contains diagram of gear infographic. This gear infographic slide helps to exhibit business analysis. Use this diagram to impart more clarity to data and to create more sound impact on viewers.
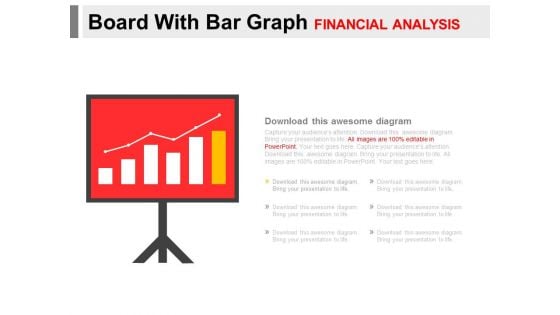
Board With Bar Graph For Financial Analysis Powerpoint Slides
You can download this PowerPoint template to display statistical data and analysis. This PPT slide contains display board with bar graph. Draw an innovative business idea using this professional diagram.
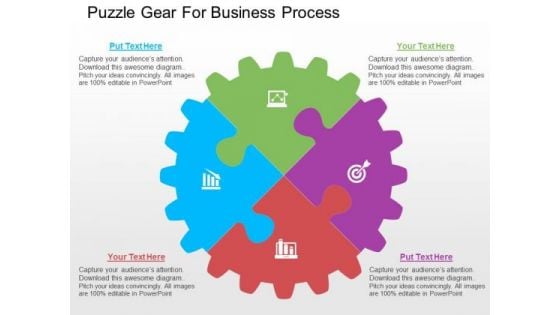
Puzzle Gear For Business Process PowerPoint Templates
Our above PPT slide contains circular gear puzzle diagram. This puzzle gear circular diagram helps to exhibit process planning and solutions. Use this diagram to impart more clarity to data and to create more sound impact on viewers.
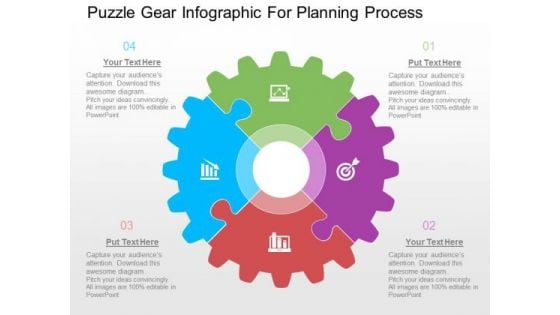
Puzzle Gear Infographic For Planning Process PowerPoint Templates
Our above PPT slide contains circular gear puzzle diagram. This puzzle gear circular diagram helps to exhibit process planning and solutions. Use this diagram to impart more clarity to data and to create more sound impact on viewers.

Investment Crowdfunding Ppt PowerPoint Presentation Complete Deck With Slides

Overview Of Key Insights From Cyber Threat Statistics Themes PDF
This slide covers statistics based on cyber crime trends. It includes stats on data thefts, mobile securities, security skills, data breach cost, etc. Showcasing this set of slides titled Overview Of Key Insights From Cyber Threat Statistics Themes PDF. The topics addressed in these templates are Overview Of Key Insights, Cyber Threat Statistics . All the content presented in this PPT design is completely editable. Download it and make adjustments in color, background, font etc. as per your unique business setting.
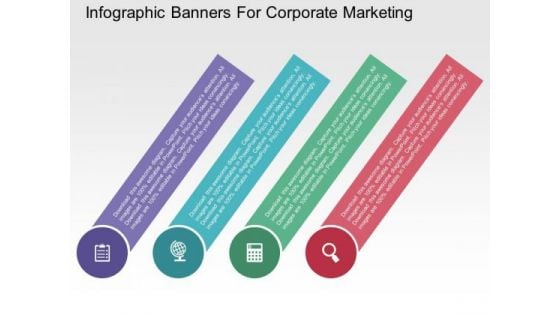
Infographic Banners For Corporate Marketing PowerPoint Templates
Our above PPT slide contains diagram of infographic banners. It helps to display steps of corporate marketing. Use this diagram to impart more clarity to data and to create more sound impact on viewers.
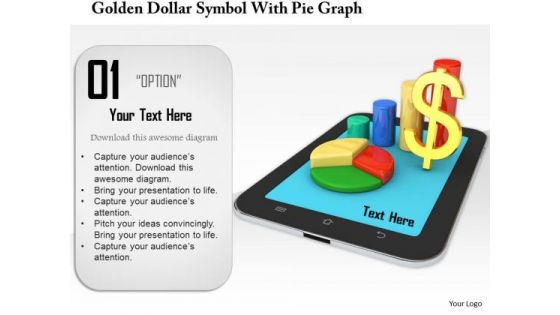
Stock Photo Golden Dollar Symbol With Pie Graph PowerPoint Slide
This Power Point template has been crafted with graphic of golden dollar symbol and pie chart on a tablet. Display the concept of financial data analysis with this image. Use this image to present financial reports in business presentations.

Business Men On Gears Towards Success Trophy Powerpoint Templates
Our above slide contains diagram of business men on gears towards success trophy. It helps to exhibit strategy process and competition. Use this diagram to impart more clarity to data and to create more sound impact on viewers.
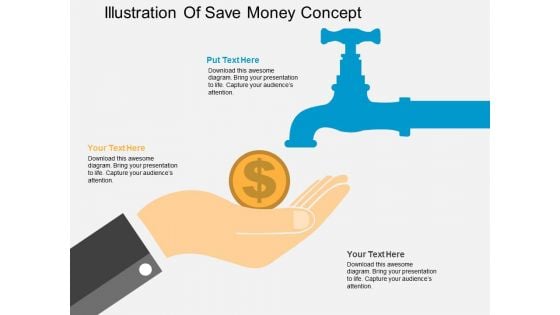
Illustration Of Save Money Concept Powerpoint Templates
This business slide has been designed with infographic square. These text boxes can be used for data representation. Use this diagram for your business presentations. Build a quality presentation for your viewers with this unique diagram.
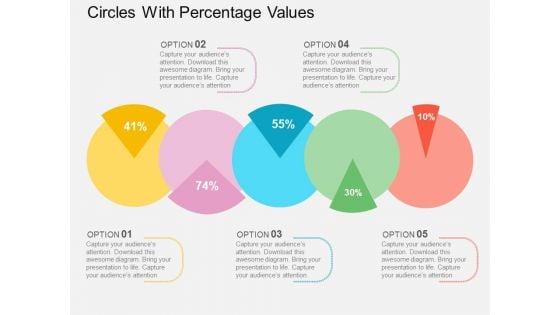
Circles With Percentage Values Powerpoint Templates
This PowerPoint template displays circles with percentage values. This business diagram is suitable for financial data analysis. Use this business diagram slide to highlight the key issues of your presentation.
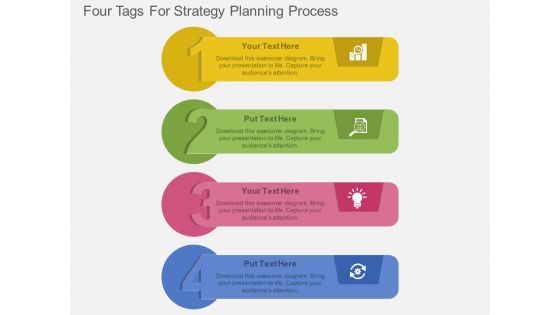
Four Tags For Strategy Planning Process Powerpoint Template
Steps for strategy planning can be explained with this diagram. This PowerPoint template contains diagram of four infographic tags. You can also use this design for data analysis in business presentations
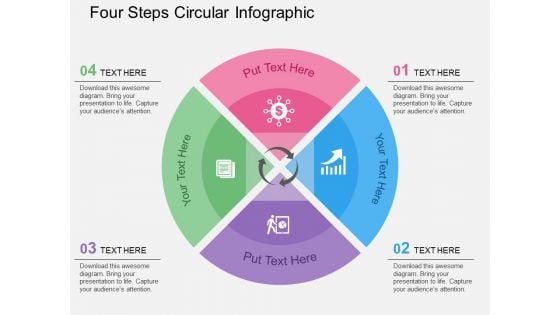
Four Steps Circular Infographic Powerpoint Templates
Our above slide contains diagram of three stage circular infographic. It helps to display global business analysis. Use this diagram to impart more clarity to data and to create more sound impact on viewers.
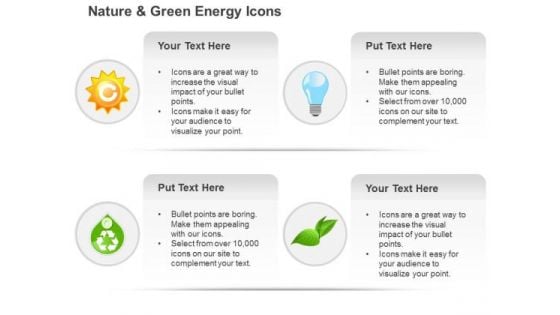
Ecology Gear Bulb Globe And Green Leaf And Recycle Symbols Ppt Slides Graphics
This ppt slide displays icons of golden gear, bulb and globe with green leaf. This PPT slide may be used to portray concept of environmental technology. Use this icon template to bullet-point your views and thoughts.
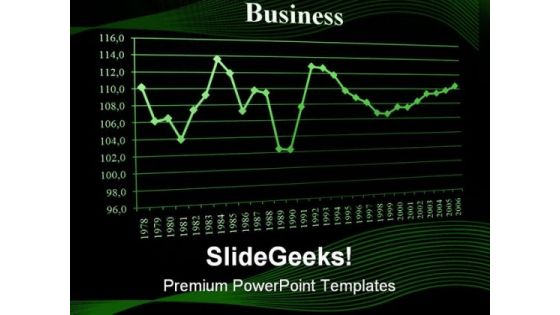
Graph03 Business PowerPoint Templates And PowerPoint Backgrounds 0411
Microsoft PowerPoint Template and Background with business chart and data from stock market showing success Manage expectations with our Graph03 Business PowerPoint Templates And PowerPoint Backgrounds 0411. You will be at the top of your game.
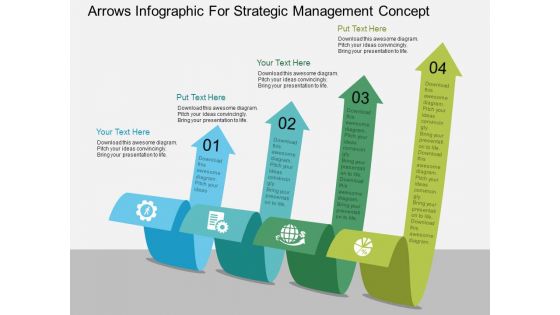
Arrows Infographic For Strategic Management Concept Powerpoint Template
Our above PPT slide contains four curved arrows infographic design. This business diagram helps to depict business information for strategic management. Use this diagram to impart more clarity to data and to create more sound impact on viewers.
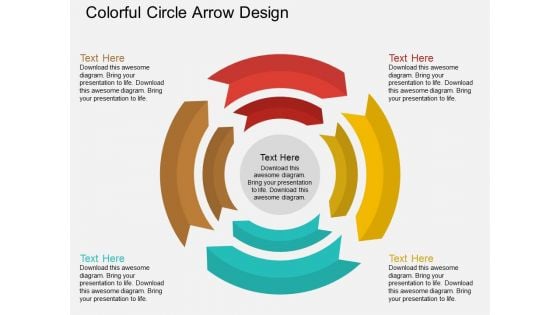
Colorful Circle Arrow Design Powerpoint Template
Our above PPT slide contains circular arrow design. This business diagram helps to exhibit process flow. Use this diagram to impart more clarity to data and to create more sound impact on viewers.
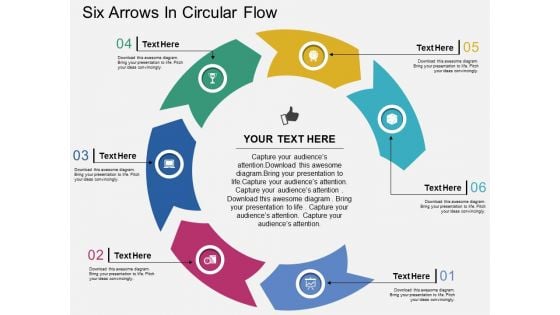
Six Arrows In Circular Flow Powerpoint Templates
Our above PPT slide contains graphics of circular diagram. This business diagram helps to display outline of business plan. Use this template to impart more clarity to data and to create more sound impact on viewers.
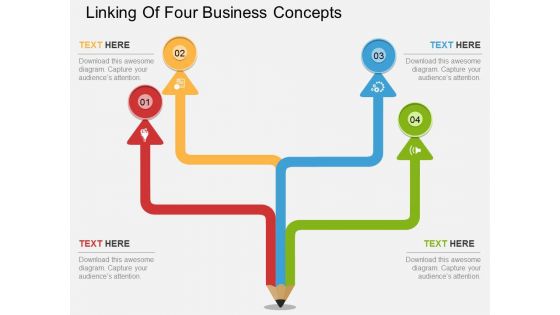
Linking Of Four Business Concepts Powerpoint Template
This PowerPoint template has been designed with four steps pencil diagram. This diagram is excellent visual tools to present link of steps. Download this PPT slide to explain complex data immediately and clearly.

Four Stage Puzzle Infographic Powerpoint Templates
Our above slide contains diagram of puzzles infographic. It helps to exhibit business management and strategies. Use this diagram to impart more clarity to data and to create more sound impact on viewers.
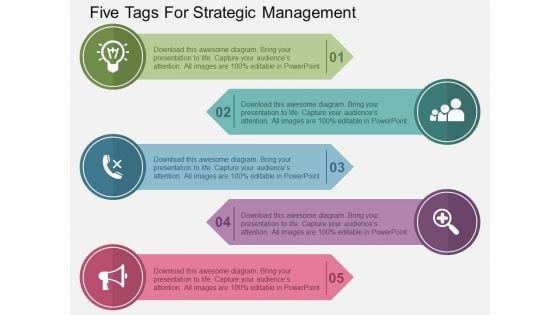
Five Tags For Strategic Management Powerpoint Templates
Our above slide contains diagram of circular infographic. It helps to exhibit six steps of goal planning. Use this diagram to impart more clarity to data and to create more sound impact on viewers.
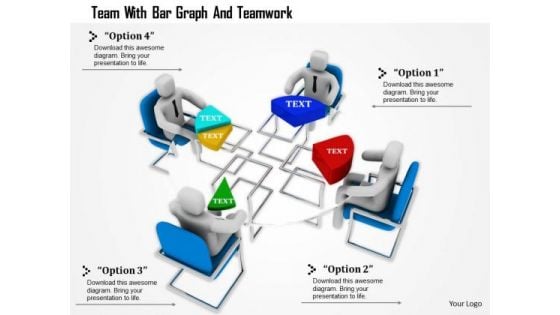
Team With Bar Graph And Teamwork
This Power Point template has been designed with graphic of 3d team forming a pie chart. In this slide team is displaying data analysis and comparison. Use this editable slide to build innovative presentation for your viewers.
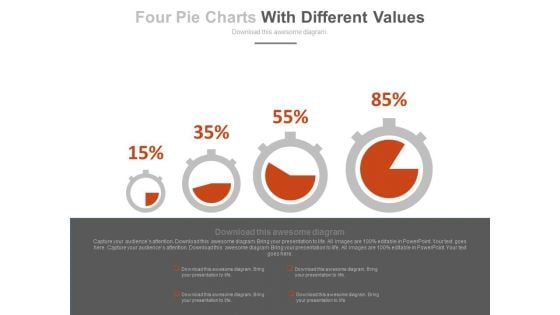
Dashboard With Increasing Values Powerpoint Slides
This innovative, stunningly beautiful dashboard has been designed for data visualization. It contains pie charts with increasing percentage values. This PowerPoint template helps to display your information in a useful, simple and uncluttered way.
Business Man Post It Notes Magnifier Tie Ppt Slides Graphics
This PPT slide displays icons of business man, post it notes and magnifier. This PPT helps to depict search and analysis of business information. This icon slide is innovatively designed to highlight your worthy views
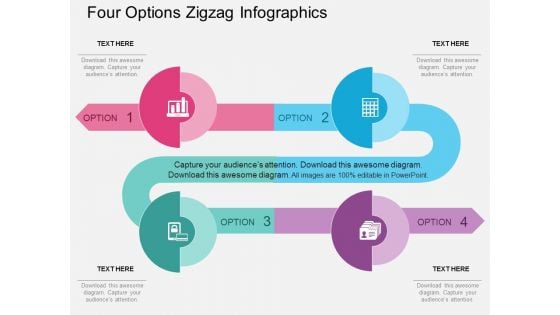
Four Options Zigzag Infographics Powerpoint Template
Emphatically define your message with our above template which contains four options zigzag infographic. This business diagram may be used to plot data series. Deliver amazing presentations to mesmerize your audience.
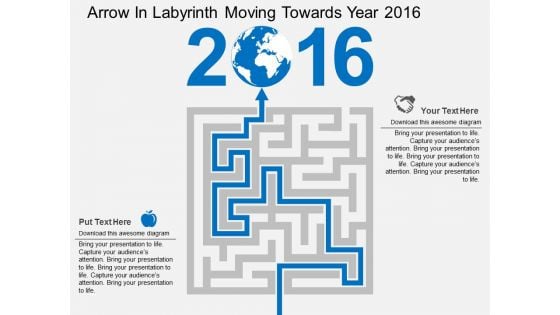
Arrow In Labyrinth Moving Towards Year 2016 Powerpoint Templates
Our above slide contains graphics of labyrinth with arrow on 2016 and globe. It helps to display concept of global business strategy. Use this diagram to impart more clarity to data and to create more sound impact on viewers.
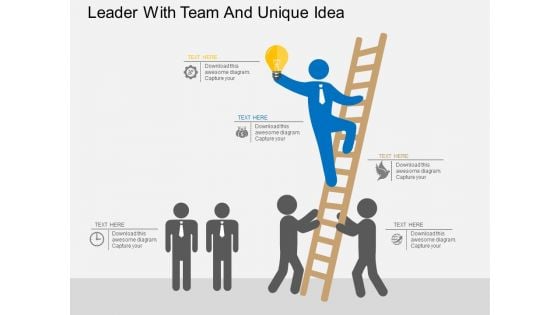
Leader With Team And Unique Idea Powerpoint Template
Our above slide contains graphics of leader with team holding idea bulb. This PowerPoint template helps to display teamwork and unique idea. Use this diagram to impart more clarity to data and to create more sound impact on viewers.
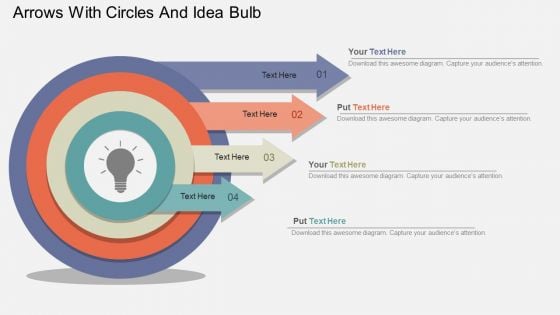
Arrows With Circles And Idea Bulb Powerpoint Template
Our above slide contains graphics of arrows with circles and idea bulb. It helps to display innovative ideas. Use this diagram to impart more clarity to data and to create more sound impact on viewers.
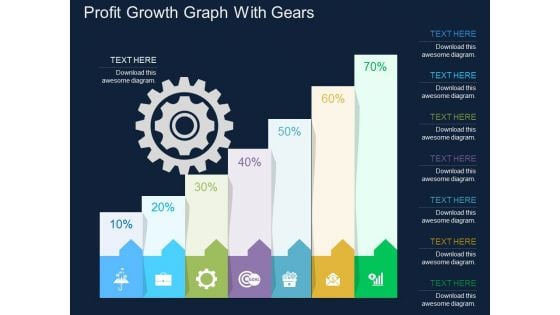
Profit Growth Graph With Gears Powerpoint Template
This business slide contains profit growth graph with gears. This PowerPoint template helps to display outline of business plan. Use this diagram to impart more clarity to data and to create more sound impact on viewers.
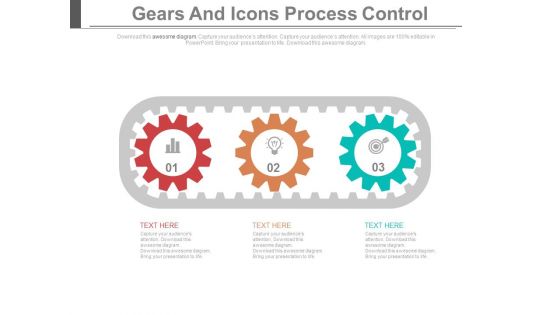
Three Gears Steps For Innovative Process Powerpoint Template
This PowerPoint slide contains graphics of three gears steps. It helps to exhibit innovative process steps. Use this diagram to impart more clarity to data and to create more sound impact on viewers.
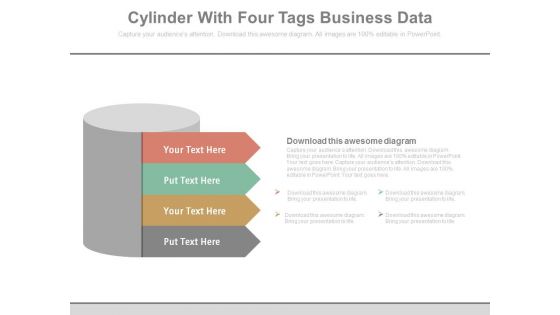
Cylinder With Four Corporate Marketing Steps Powerpoint Template
Our above slide contains graphics of cylinder with four text tags. It may be used to display marketing steps. Use this diagram to impart more clarity to data and to create more sound impact on viewers.
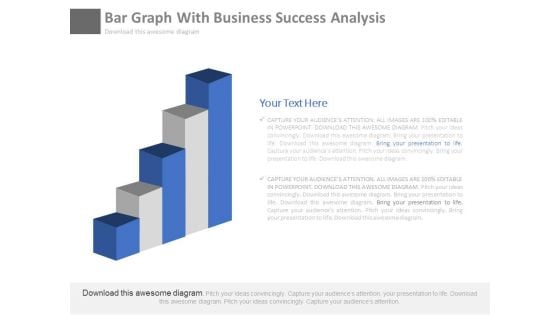
Bar Graph For Marketing Research Process Powerpoint Slides
This PowerPoint template has been designed with diagram of bar graph. This PPT slide can be used to prepare presentations for profit growth report and also for financial data analysis. You can download finance PowerPoint template to prepare awesome presentations.

Team Pictures With Names And Profile Powerpoint Slides
This PowerPoint template has been designed with team pictures and profile information. This diagram is excellent visual tools to present team profile. Download this PPT slide to explain complex data immediately and clearly.
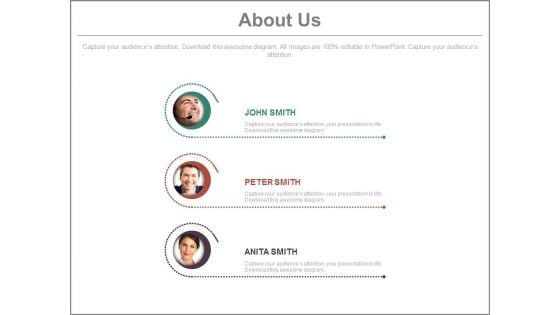
Team Profiles For About Us Slide Powerpoint Slides
This PowerPoint template has been designed with team pictures and profile information. This diagram is excellent visual tools to present team profile. Download this PPT slide to explain complex data immediately and clearly.

Business People Profile For Social Media Powerpoint Slides
This PowerPoint template has been designed with business people profile information. This diagram is excellent visual tools to present team profile with social media. Download this PPT slide to explain complex data immediately and clearly.
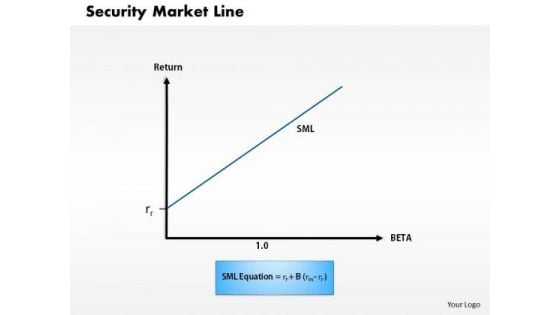
Business Framework Security Market Line 1 PowerPoint Presentation
This diagram displays graph of security market line. You can use line graph to plot changes in data over time, such as monthly revenue and earnings changes or daily changes in stock market prices.
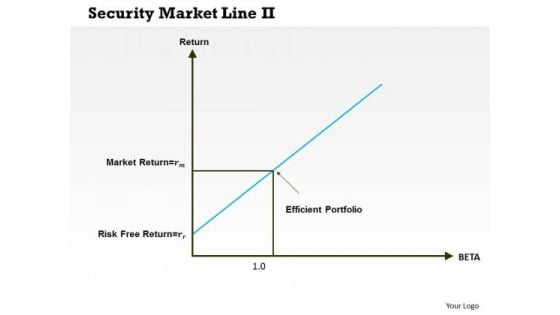
Business Framework Security Market Line 11 PowerPoint Presentation
This diagram displays graph of security market line. You can use line graph to plot changes in data over time, such as monthly revenue and earnings changes or daily changes in stock market prices.
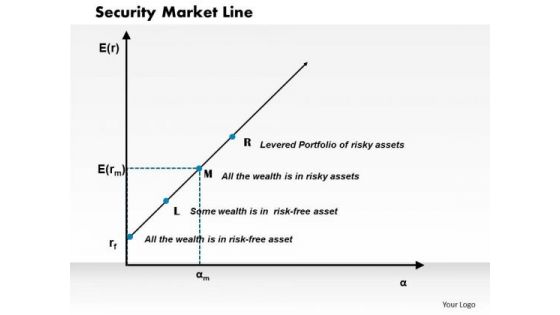
Business Framework Security Market Line PowerPoint Presentation
This diagram displays graph of security market line. You can use line graph to plot changes in data over time, such as monthly revenue and earnings changes or daily changes in stock market prices.
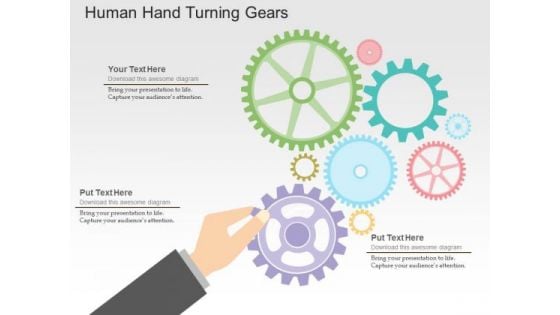
Human Hand Turning Gears PowerPoint Templates
Our above slide contains graphics of human hand turning gears. It helps to display concepts of process control and management. Use this diagram to impart more clarity to data and to create more sound impact on viewers.

Man Climbing On Books With Ladder PowerPoint Templates
Our above slide contains graphics of man climbing on books with help of ladder. It helps to display concept of education and success. Use this diagram to impart more clarity to data and to create more sound impact on viewers.
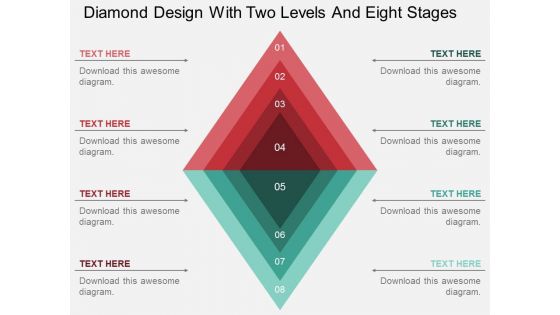
Diamond Design With Two Levels And Eight Stages Powerpoint Template
Our above slide contains graphics of diamond design with two levels and eight stages. It helps to display concepts in visual manner. Use this diagram to impart more clarity to data and to create more sound impact on viewers.
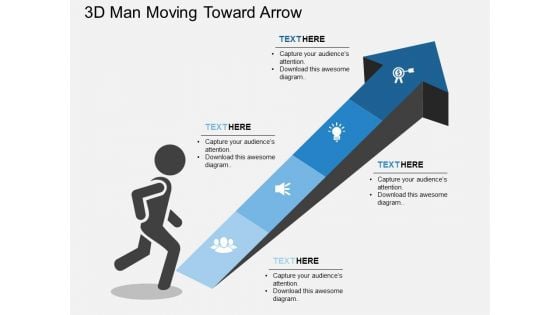
3D Man Moving Toward Arrow Powerpoint Template
Our above PPT slide contains graphics of 3d man moving towards arrow. This PowerPoint template helps to exhibit finding possible solutions. Use this diagram to impart more clarity to data and to create more sound impact on viewers.
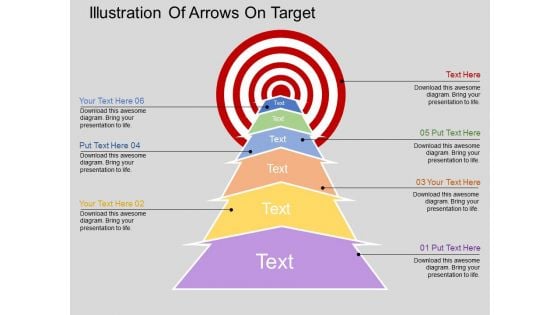
Illustration Of Arrows On Target Powerpoint Templates
Our above slide illustrates arrow steps towards target. This PowerPoint template may be used to exhibit target planning. Use this diagram to impart more clarity to data and to create more sound impact on viewers.
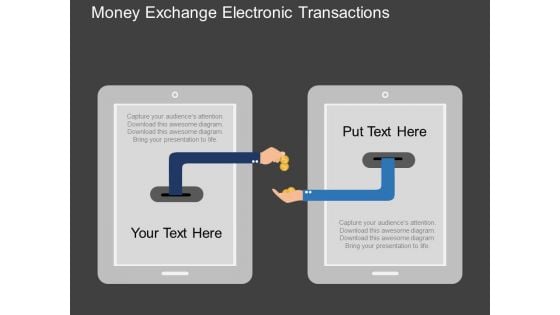
Money Exchange Electronic Transactions Powerpoint Templates
Our above slide contains illustration of money exchange. It helps to display electronic transactions. Use this diagram to impart more clarity to data and to create more sound impact on viewers.

Business Man On Road With Question Mark Powerpoint Template
Our above PPT slide contains road graphics with business man and question mark. It helps to exhibit finding possible solutions. Use this diagram to impart more clarity to data and to create more sound impact on viewers.

Donating Money To Charity Powerpoint Template
Our above slide contains ten staged colorful infographic. It helps to exhibit concepts of charity and donation. Use this diagram to impart more clarity to data and to create more sound impact on viewers.
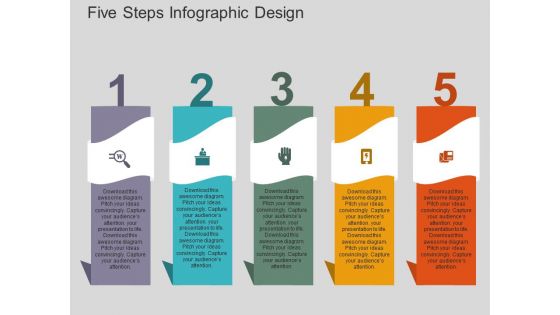
Five Steps Infographic Design Powerpoint Templates
Our above slide contains graphics of six hands around bulb. It helps to display steps of idea planning. Use this diagram to impart more clarity to data and to create more sound impact on viewers.
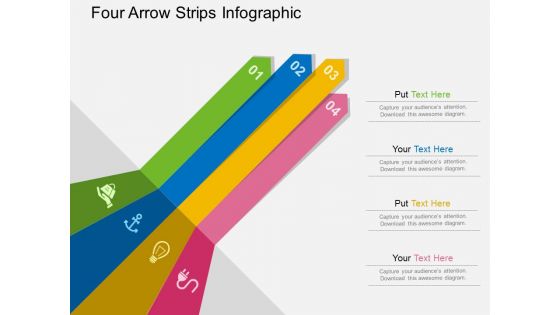
Four Arrow Strips Infographic Powerpoint Templates
Our above slide contains graphics of bulb with success graph. It helps to exhibit planning for growth. Use this diagram to impart more clarity to data and to create more sound impact on viewers.
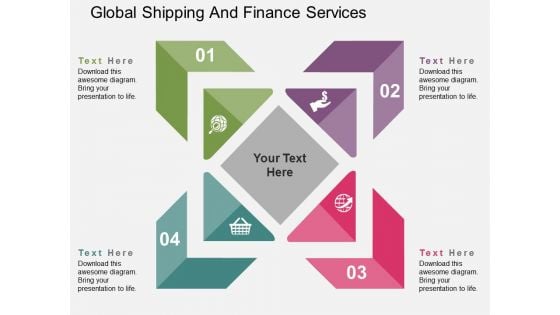
Global Shipping And Finance Services Powerpoint Templates
Our above PPT slide contains triangles infographic. It helps to display outline of business plan. Use this diagram to impart more clarity to data and to create more sound impact on viewers.
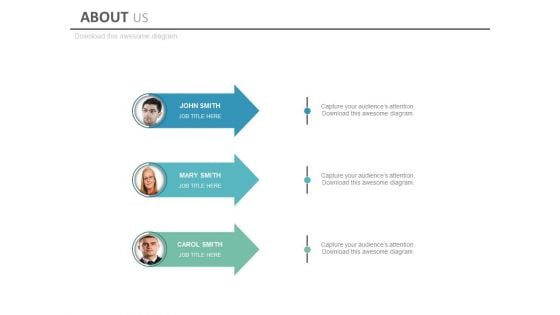
Three Arrow For Team Members Profile Powerpoint Slides
This PowerPoint template has been designed with three arrows and team pictures. This diagram is excellent visual tools for business presentations. Download this PPT slide to explain complex data immediately and clearly.
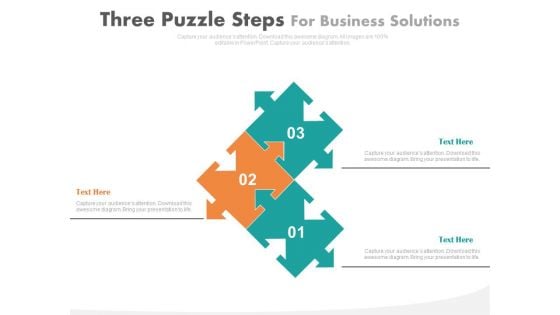
Three Puzzle Steps For Business Solutions Powerpoint Slides
Our above slide contains graphics of three puzzle steps. This slide is suitable to present business management and strategy. Use this diagram to impart more clarity to data and to create more sound impact on viewers.
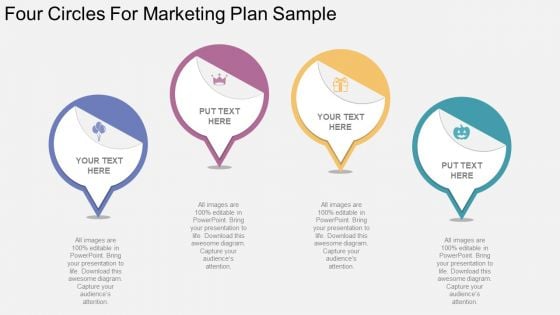
Four Circles For Marketing Plan Sample Powerpoint Template
Our above slide contains infographic diagram of four circles. This PPT slide helps to exhibit sample of marketing plan. Use this PowerPoint template to impart more clarity to data and to create more sound impact on viewers.
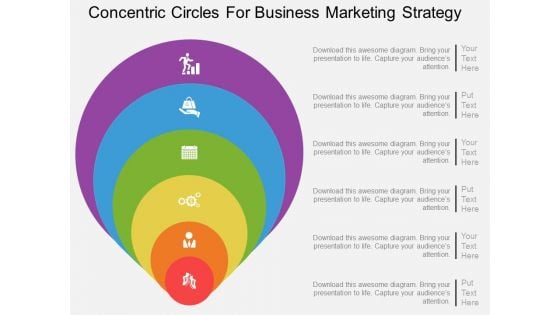
Six Staged Concentric Circles For Business Marketing Strategy Powerpoint Template
Our above PPT slide contains graphics of concentric circles. This PowerPoint template may be used to depict business marketing strategy. Use this diagram to impart more clarity to data and to create more sound impact on viewers.
Four Arrows For Different Process Representation Powerpoint Template
This PowerPoint template has been designed with graphics of four arrows This diagram is excellent visual tools for business presentations. Download this PPT slide to explain complex data immediately and clearly.
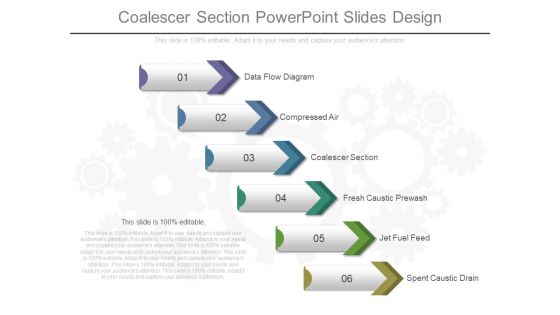
Coalescer Section Powerpoint Slides Design
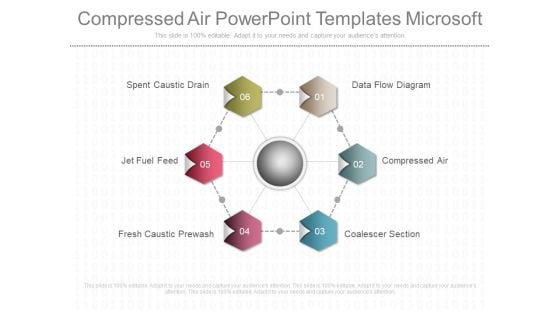
Compressed Air Powerpoint Templates Microsoft
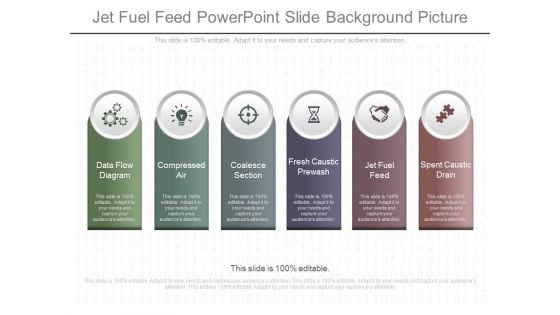
Jet Fuel Feed Powerpoint Slide Background Picture
This is a jet fuel feed powerpoint slide background picture. This is a six stage process. The stages in this process are data flow diagram, compressed air, coalesce section, fresh caustic prewash, jet fuel feed, spent caustic drain.
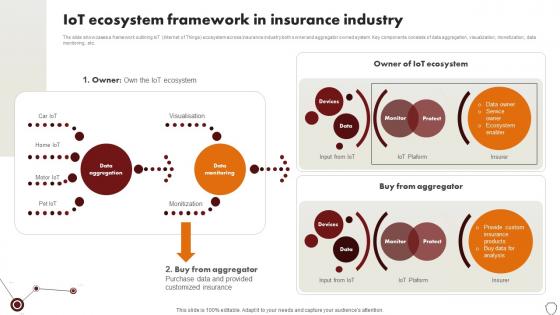
Technology Trends In Online Insurance IoT Ecosystem Framework In Insurance Industry
The slide showcases a framework outlining IoT Internet of Things ecosystem across insurance industry both owner and aggregator owned system. Key components consists of data aggregation, visualization, monetization, data monitoring, etc. Do you know about Slidesgeeks Technology Trends In Online Insurance IoT Ecosystem Framework In Insurance Industry These are perfect for delivering any kind od presentation. Using it, create PowerPoint presentations that communicate your ideas and engage audiences. Save time and effort by using our pre-designed presentation templates that are perfect for a wide range of topic. Our vast selection of designs covers a range of styles, from creative to business, and are all highly customizable and easy to edit. Download as a PowerPoint template or use them as Google Slides themes. The slide showcases a framework outlining IoT Internet of Things ecosystem across insurance industry both owner and aggregator owned system. Key components consists of data aggregation, visualization, monetization, data monitoring, etc.
Medical Symbol Stethoscope Pill Dna Design Ppt Slides Graphics
Icons of medical symbol, stethoscope and pill with DNA have been displayed in this power point template. This icon slide relates to the concept of medical analysis and treatment. This slide is suitable for medical students and doctors.
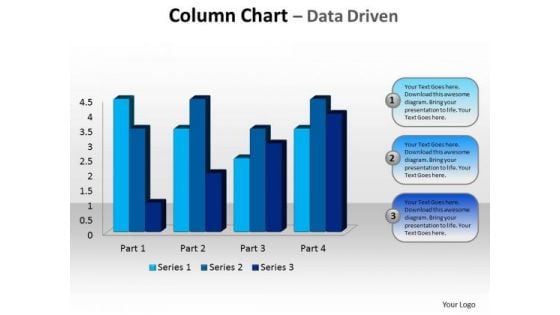
Business Editable PowerPoint Templates Business Beveled Column Chart Ppt Slides
Business Editable PowerPoint Templates Business beveled column chart PPT Slides-This PowerPoint slide is a data driven Columns Chart. The number of columns depend on the data.-Business Editable PowerPoint Templates Business beveled column chart PPT Slides-This ppt can be used for concepts relating to-chart,, graph, growth, investment, , market, percentage, , presentation report, results, statistics, stock, success and business. Experience exponential.growth with our Business Editable PowerPoint Templates Business Beveled Column Chart Ppt Slides. Your earnings will acquire a big boost.

The Digital Project Managers Deployment Of Cloud Project Management Model
This slide showcases deployment of cloud project management model. It provides information about public, private, hybrid, setup, data security, data control, privacy, scalability, integration, etc. If you are looking for a format to display your unique thoughts, then the professionally designed The Digital Project Managers Deployment Of Cloud Project Management Model is the one for you. You can use it as a Google Slides template or a PowerPoint template. Incorporate impressive visuals, symbols, images, and other charts. Modify or reorganize the text boxes as you desire. Experiment with shade schemes and font pairings. Alter, share or cooperate with other people on your work. Download The Digital Project Managers Deployment Of Cloud Project Management Model and find out how to give a successful presentation. Present a perfect display to your team and make your presentation unforgettable. This slide showcases deployment of cloud project management model. It provides information about public, private, hybrid, setup, data security, data control, privacy, scalability, integration, etc.
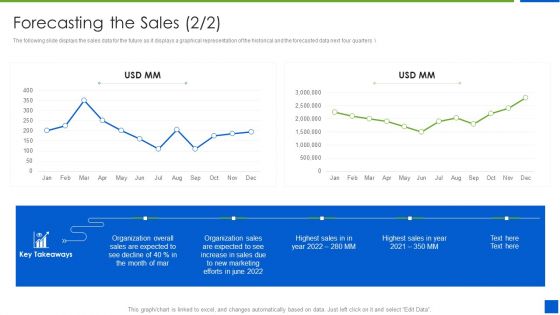
Improving Brand Recognition With Message And Differentiation Strategy Forecasting The Sales Decline Diagrams PDF
The following slide displays the sales data for the future as it displays a graphical representation of the historical and the forecasted data next four quarters Deliver and pitch your topic in the best possible manner with this improving brand recognition with message and differentiation strategy forecasting the sales decline diagrams pdf. Use them to share invaluable insights on forecasting the sales and impress your audience. This template can be altered and modified as per your expectations. So, grab it now.
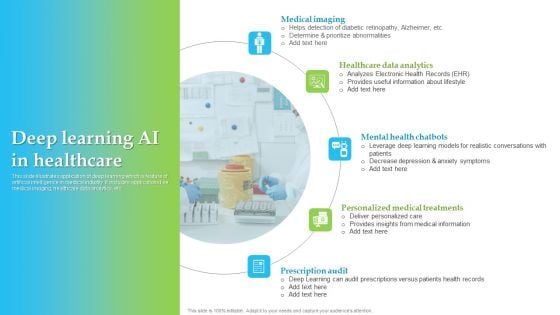
Deep Learning AI In Healthcare Themes PDF
This slide illustrates application of deep learning which is feature of artificial intelligence in medical industry. It includes applications like medical imaging, healthcare data analytics, etc. Pitch your topic with ease and precision using this Deep Learning AI In Healthcare Themes PDF. This layout presents information on Medical Imaging, Healthcare Data Analytics, Mental Health Chatbots. It is also available for immediate download and adjustment. So, changes can be made in the color, design, graphics or any other component to create a unique layout.

Optimization Of IoT Remote Monitoring IoT Based Environmental Monitoring Components IoT SS V
This slide provides an overview of the essential components that provides important insights for decision-making. Major components covered are monitoring environment, measuring data, cataloging data and providing actionable insights. Do you know about Slidesgeeks Optimization Of IoT Remote Monitoring IoT Based Environmental Monitoring Components IoT SS V These are perfect for delivering any kind od presentation. Using it, create PowerPoint presentations that communicate your ideas and engage audiences. Save time and effort by using our pre-designed presentation templates that are perfect for a wide range of topic. Our vast selection of designs covers a range of styles, from creative to business, and are all highly customizable and easy to edit. Download as a PowerPoint template or use them as Google Slides themes. This slide provides an overview of the essential components that provides important insights for decision-making. Major components covered are monitoring environment, measuring data, cataloging data and providing actionable insights.

MLOPs Level 0 Manual Process Introduction To MLOPs IT
This slide highlights workflow of MLOps level 0. The purpose of this slide is to shows the various stages involved in the process, including data collection, data preprocessing, model training, model evaluation, and model deployment. Do you know about Slidesgeeks MLOPs Level 0 Manual Process Introduction To MLOPs IT These are perfect for delivering any kind od presentation. Using it, create PowerPoint presentations that communicate your ideas and engage audiences. Save time and effort by using our pre-designed presentation templates that are perfect for a wide range of topic. Our vast selection of designs covers a range of styles, from creative to business, and are all highly customizable and easy to edit. Download as a PowerPoint template or use them as Google Slides themes. This slide highlights workflow of MLOps level 0. The purpose of this slide is to shows the various stages involved in the process, including data collection, data preprocessing, model training, model evaluation, and model deployment.
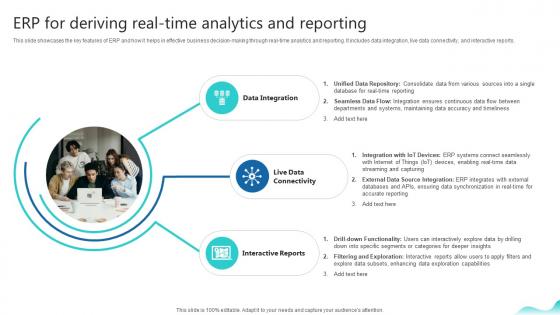
Erp For Deriving Real Time Analytics And Reporting Erp And Digital Transformation For Maximizing DT SS V
This slide showcases the key features of ERP and how it helps in effective business decision-making through real-time analytics and reporting. It includes data integration, live data connectivity, and interactive reports.Retrieve professionally designed Erp For Deriving Real Time Analytics And Reporting Erp And Digital Transformation For Maximizing DT SS V to effectively convey your message and captivate your listeners. Save time by selecting pre-made slideshows that are appropriate for various topics, from business to educational purposes. These themes come in many different styles, from creative to corporate, and all of them are easily adjustable and can be edited quickly. Access them as PowerPoint templates or as Google Slides themes. You do not have to go on a hunt for the perfect presentation because Slidegeeks got you covered from everywhere. This slide showcases the key features of ERP and how it helps in effective business decision-making through real-time analytics and reporting. It includes data integration, live data connectivity, and interactive reports.
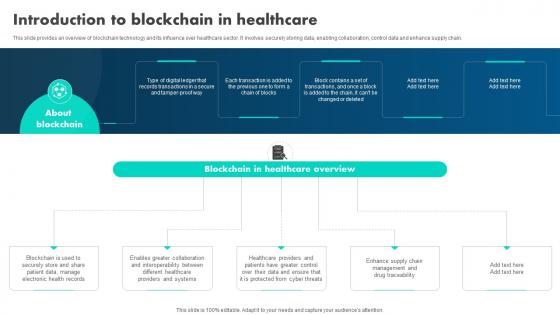
How Blockchain Is Reshaping Introduction To Blockchain In Healthcare BCT SS V
This slide provides an overview of blockchain technology and its influence over healthcare sector. It involves securely storing data, enabling collaboration, control data and enhance supply chain. Do you know about Slidesgeeks How Blockchain Is Reshaping Introduction To Blockchain In Healthcare BCT SS V These are perfect for delivering any kind od presentation. Using it, create PowerPoint presentations that communicate your ideas and engage audiences. Save time and effort by using our pre-designed presentation templates that are perfect for a wide range of topic. Our vast selection of designs covers a range of styles, from creative to business, and are all highly customizable and easy to edit. Download as a PowerPoint template or use them as Google Slides themes. This slide provides an overview of blockchain technology and its influence over healthcare sector. It involves securely storing data, enabling collaboration, control data and enhance supply chain.
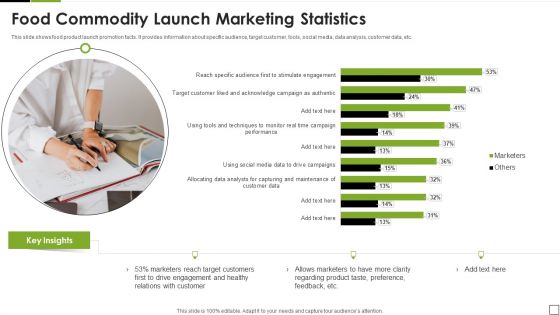
Food Commodity Launch Marketing Statistics Clipart PDF
This slide shows food product launch promotion facts. It provides information about specific audience, target customer, tools, social media, data analysis, customer data, etc. Showcasing this set of slides titled Food Commodity Launch Marketing Statistics Clipart PDF. The topics addressed in these templates are Target, Customers, Marketers. All the content presented in this PPT design is completely editable. Download it and make adjustments in color, background, font etc. as per your unique business setting.

 Home
Home