Data Icon
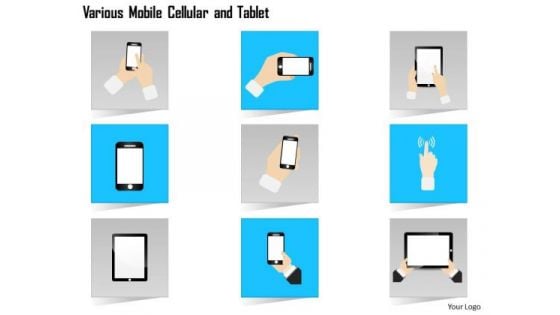
1 Various Mobile Cellular And Tablet Ipad Figure Gestures And Finger Motions Ppt Slide
This image slide displays icons with tablet and smartphone. This image slide has been designed with graphic of hands on smartphone and tablet icons. You may change color, size and orientation of any icon to your liking. Use this image slide, in your presentations to express views on communication, wireless networking, mobile devices usage and technology. This image slide will enhance the quality of your presentations.
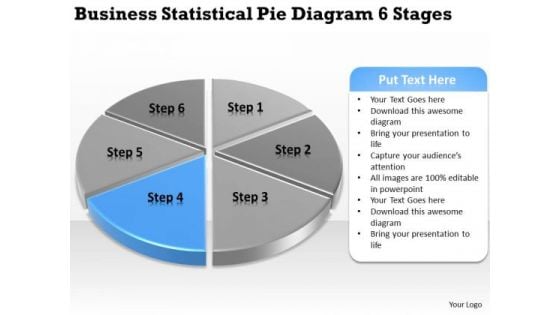
Statistical Pie Diagram 6 Stages Simple Business Plan Templates PowerPoint Slides
We present our statistical pie diagram 6 stages simple business plan templates PowerPoint Slides.Use our Circle Charts PowerPoint Templates because Our PowerPoint Templates and Slides has conjured up a web of all you need with the help of our great team. Use them to string together your glistening ideas. Download our Process and Flows PowerPoint Templates because Our PowerPoint Templates and Slides will bullet point your ideas. See them fall into place one by one. Use our Business PowerPoint Templates because It can be used to Set your controls for the heart of the sun. Our PowerPoint Templates and Slides will be the propellant to get you there. Download and present our Shapes PowerPoint Templates because Our PowerPoint Templates and Slides will provide weight to your words. They will bring out the depth of your thought process. Use our Marketing PowerPoint Templates because Our PowerPoint Templates and Slides have the Brilliant backdrops. Guaranteed to illuminate the minds of your audience.Use these PowerPoint slides for presentations relating to Pie, chart, business, market, presentation, symbol, element, bank, marketing, illustration, organization, movement,sheet, background, financial, isolated, slice, display, perspective, corporate, six, concept, diagram, circle, graphic, finance, data, report, abstract,management, graph, modern, icon, company, control, information, environment, banking. The prominent colors used in the PowerPoint template are Blue, Gray, White. Be a creative problem-solver with our Statistical Pie Diagram 6 Stages Simple Business Plan Templates PowerPoint Slides. They will make you look good.
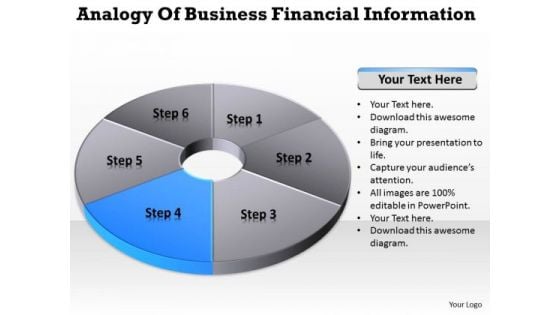
Financial Information Pie Donut Diagram 6 Stages How To Business Plan PowerPoint Slides
We present our financial information pie donut diagram 6 stages how to business plan PowerPoint Slides.Download and present our Competition PowerPoint Templates because Our PowerPoint Templates and Slides will definately Enhance the stature of your presentation. Adorn the beauty of your thoughts with their colourful backgrounds. Present our Marketing PowerPoint Templates because Our PowerPoint Templates and Slides are conceived by a dedicated team. Use them and give form to your wondrous ideas. Download our Process and Flows PowerPoint Templates because Our PowerPoint Templates and Slides will effectively help you save your valuable time. They are readymade to fit into any presentation structure. Present our Circle Charts PowerPoint Templates because Our PowerPoint Templates and Slides will let you meet your Deadlines. Present our Business PowerPoint Templates because They will bring a lot to the table. Their alluring flavours will make your audience salivate.Use these PowerPoint slides for presentations relating to chart, graph, pie, 3d, diagram, graphic, icon, control, business, data, profit, market, sales, display, corporate, concept, render, success, presentation, finance, report, marketing, accounting, management, piece, strategy, money, growth, company, competition, progress, account, sheet, part, information, investment, improvement, banking, index, financial, reflect, results, performance, exchange. The prominent colors used in the PowerPoint template are Blue, Black, Gray. Feuds can happen at the workplace. Settle them amicably with our Financial Information Pie Donut Diagram 6 Stages How To Business Plan PowerPoint Slides.
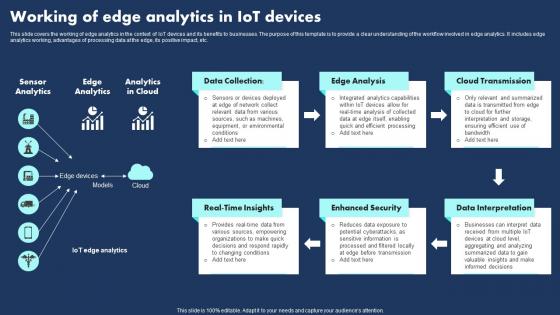
Working Of Edge Analytics In Iot Devices Themes Pdf
This slide covers the working of edge analytics in the context of IoT devices and its benefits to businesses. The purpose of this template is to provide a clear understanding of the workflow involved in edge analytics. It includes edge analytics working, advantages of processing data at the edge, its positive impact, etc.Showcasing this set of slides titled Working Of Edge Analytics In Iot Devices Themes Pdf The topics addressed in these templates are Enhanced Security, Data Interpretation, Cloud Transmission All the content presented in this PPT design is completely editable. Download it and make adjustments in color, background, font etc. as per your unique business setting. This slide covers the working of edge analytics in the context of IoT devices and its benefits to businesses. The purpose of this template is to provide a clear understanding of the workflow involved in edge analytics. It includes edge analytics working, advantages of processing data at the edge, its positive impact, etc.
2 Stages Overlapping Circles Logical Relations Business Plan Worksheet PowerPoint Slides
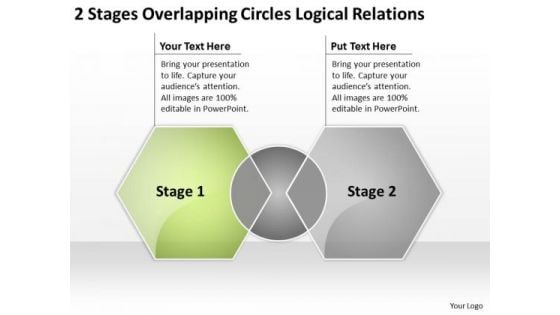
We present our 2 stages overlapping circles logical relations business plan worksheet PowerPoint Slides.Use our Business PowerPoint Templates because You can Raise a toast with our PowerPoint Templates and Slides. Spread good cheer amongst your audience. Present our Marketing PowerPoint Templates because Our PowerPoint Templates and Slides are the chords of your song. String them along and provide the lilt to your views. Present our Shapes PowerPoint Templates because Our PowerPoint Templates and Slides will definately Enhance the stature of your presentation. Adorn the beauty of your thoughts with their colourful backgrounds. Use our Spheres PowerPoint Templates because Our PowerPoint Templates and Slides will provide you a launch platform. Give a lift off to your ideas and send them into orbit. Download our Success PowerPoint Templates because You can Hit a home run with our PowerPoint Templates and Slides. See your ideas sail into the minds of your audience.Use these PowerPoint slides for presentations relating to Chart, vector, diagram, market, business, concept, sign, success, presentation, symbol, template, finance, data, report, marketing, management, illustration, icon, strategy, research, web, design, growth, text, infographic, banner, profit, information, background, financial . The prominent colors used in the PowerPoint template are Green, Gray, White. Navigate difficult territory with our 2 Stages Overlapping Circles Logical Relations Business Plan Worksheet PowerPoint Slides. Download without worries with our money back guaranteee.
2 Stages Overlapping Circles Logical Relations Ppt Your Business Plan PowerPoint Templates
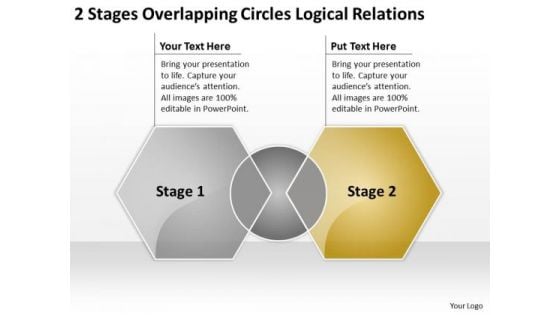
We present our 2 stages overlapping circles logical relations ppt your business plan PowerPoint templates.Download our Business PowerPoint Templates because Our PowerPoint Templates and Slides will let your team Walk through your plans. See their energy levels rise as you show them the way. Use our Marketing PowerPoint Templates because It will get your audience in sync. Download our Shapes PowerPoint Templates because Our PowerPoint Templates and Slides offer you the widest possible range of options. Download and present our Spheres PowerPoint Templates because Our PowerPoint Templates and Slides are designed to help you succeed. They have all the ingredients you need. Present our Success PowerPoint Templates because Our PowerPoint Templates and Slides will let you Illuminate the road ahead to Pinpoint the important landmarks along the way.Use these PowerPoint slides for presentations relating to Chart, vector, diagram, market, business, concept, sign, success, presentation, symbol, template, finance, data, report, marketing, management, illustration, icon, strategy, research, web, design, growth, text, infographic, banner, profit, information, background, financial . The prominent colors used in the PowerPoint template are Yellow, Gray, White. Dispatch your thoughts on our 2 Stages Overlapping Circles Logical Relations Ppt Your Business Plan PowerPoint Templates. They will take them the farthest possible.
2 Stages Overlapping Circles Logical Relations Sample Business Plan PowerPoint Slides
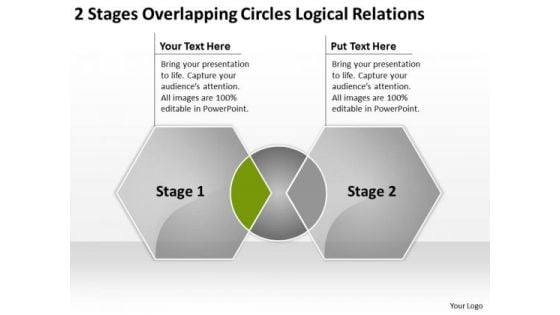
We present our 2 stages overlapping circles logical relations sample business plan PowerPoint Slides.Present our Business PowerPoint Templates because It can be used to Set your controls for the heart of the sun. Our PowerPoint Templates and Slides will be the propellant to get you there. Use our Marketing PowerPoint Templates because You can Stir your ideas in the cauldron of our PowerPoint Templates and Slides. Cast a magic spell on your audience. Download our Shapes PowerPoint Templates because You are an avid believer in ethical practices. Highlight the benefits that accrue with our PowerPoint Templates and Slides. Download our Spheres PowerPoint Templates because Your success is our commitment. Our PowerPoint Templates and Slides will ensure you reach your goal. Use our Success PowerPoint Templates because These PowerPoint Templates and Slides will give the updraft to your ideas. See them soar to great heights with ease.Use these PowerPoint slides for presentations relating to Chart, vector, diagram, market, business, concept, sign, success, presentation, symbol, template, finance, data, report, marketing, management, illustration, icon, strategy, research, web, design, growth, text, infographic, banner, profit, information, background, financial . The prominent colors used in the PowerPoint template are Green, Gray, White. Dont follow, lead the crowd with our 2 Stages Overlapping Circles Logical Relations Sample Business Plan PowerPoint Slides. Try us out and see what a difference our templates make.
Satellite Technology Applications For Telecom Industry Graphics PDF
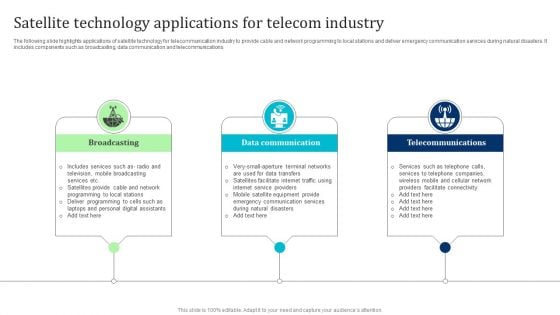
The following slide highlights applications of satellite technology for telecommunication industry to provide cable and network programming to local stations and deliver emergency communication services during natural disasters. It includes components such as broadcasting, data communication and telecommunications. Presenting Satellite Technology Applications For Telecom Industry Graphics PDF to dispense important information. This template comprises three stages. It also presents valuable insights into the topics including Broadcasting, Data Communication, Telecommunications. This is a completely customizable PowerPoint theme that can be put to use immediately. So, download it and address the topic impactfully.
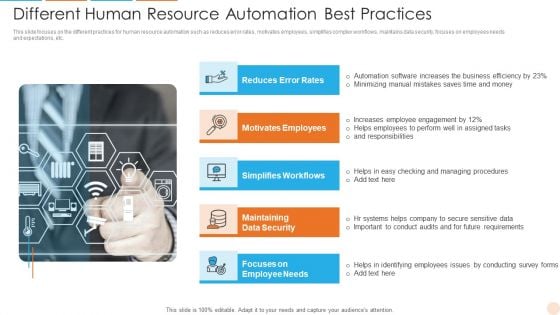
Different Human Resource Automation Best Practices Themes PDF
This slide focuses on the different practices for human resource automation such as reduces error rates, motivates employees, simplifies complex workflows, maintains data security, focuses on employees needs and expectations, etc. Persuade your audience using this Different Human Resource Automation Best Practices Themes PDF. This PPT design covers four stages, thus making it a great tool to use. It also caters to a variety of topics including Reduces Error Rates, Motivates Employees, Maintaining Data Security. Download this PPT design now to present a convincing pitch that not only emphasizes the topic but also showcases your presentation skills.

Ppt Linear Flow Movement Writing Process PowerPoint Presentation Templates
PPT linear flow movement writing process powerpoint presentation Templates-This image has been professionally designed to emphasize the paths through which the data moves, and the processes that produce, use, and transform data. Deliver amazing presentations to mesmerize your audience.-PPT linear flow movement writing process powerpoint presentation Templates-3d, Advertisement, Advertising, Arrow, Border, Business, Circles, Collection, Customer, Design, Element, Icon, Idea, Illustration, Info, Information, Isolated, Label, Light, Location, Needle, New, Notification, Notify, Point, Pointer, Promotion, Role, Rounded Analyse the event in all its colours. Expose the facts to your audience on our Ppt Linear Flow Movement Writing Process PowerPoint Presentation Templates.
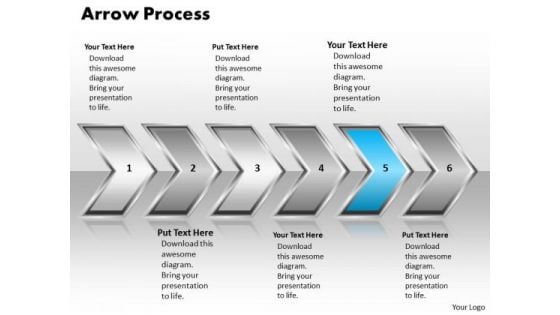
Ppt Pointing Arrow Process 6 Create PowerPoint Macro Templates
PPT pointing arrow process 6 create powerpoint macro Templates-Use this diagram as a method of graphically representing the flow of data as an information processing system. Use this PPT to represent data that is easy to comprehend and analyze. This PowerPoint diagram can be used in strategy, consulting and marketing presentations.-PPT pointing arrow process 6 create powerpoint macro Templates-Aim, Arrow, Arrowheads, Badge, Border, Click, Connection, Curve, Design, Direction, Download, Element, Fuchsia, Icon, Illustration, Indicator, Internet, Magenta, Mark, Object, Orientation, Pointer, Shadow, Shape, Sign There is one thing our Ppt Pointing Arrow Process 6 Create PowerPoint Macro Templates cannot do. They cannot be drab and dreary.
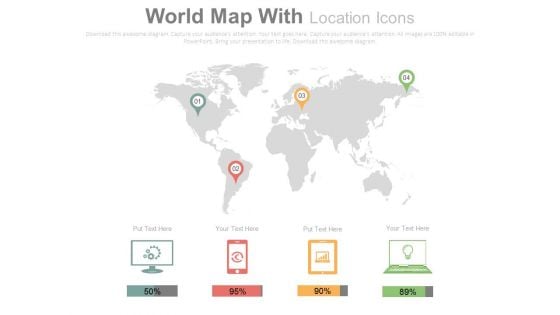
Electronic Devices Global Market Reports PowerPoint Slides
The fight between various gadget manufacturers, internet service providers and operating systems is no longer limited to any specific country. It has gone global and this slide can help present relevant data in a very modern and easy to understand and remember manner. This template has been created by our experienced designers keeping in mind the regular reporting and the data that is to be maintained regarding the number of users and their patterns by various technology companies. The slide has icons of a desktop, a smartphone, a tablet and a laptop accompanied with percentage bars. These can be effectively used to mark the percentage of users on each device, users accessing a website or an app on each device or the sales figures. The location pins can be used to mark the location with maximum number of users or the maximum sales from a location.
Usa Ppt Background Linear Process 2 Phase Diagram Business Plan PowerPoint Graphic
USA PPT Background linear process 2 phase diagram business plan powerpoint Graphic-Visually support your ideas and define your message with our above template. This image identifies the concept of two options. Audience also understands the concepts of the presenter very easily and they get to know the clear picture of the topic\n-USA PPT Background linear process 2 phase diagram business plan powerpoint Graphic-Abstract, Achievement, Adding, Analyzing, Arrow, Art, Background, Blank, Blue, Business, Chart, Color, Colorful, Cycle, Data, Design, Diagram, Element, Flow, Graph, Graphic, Gray, Green, Icon, Linear, Management, Market, Numbers, Percent, Process, Project, Round, Stock, Success Launch products with our Usa Ppt Background Linear Process 2 Phase Diagram Business Plan PowerPoint Graphic. Download without worries with our money back guaranteee.
Usa Ppt Linear Process 7 Phase Diagram Project Management PowerPoint 3 Graphic
USA PPT linear process 7 phase diagram project management powerpoint 3 Graphic-This slide is an excellent backdrop for you to enlighten your audience on the process you have gone through and the vision you have for the future. Narrow them down and prove their viability to help your organization -USA PPT linear process 7 phase diagram project management powerpoint 3 Graphic-Abstract, Achievement, Adding, Analyzing, Arrow, Art, Background, Blank, Blue, Business, Chart, Color, Colorful, Cycle, Data, Design, Diagram, Element, Flow, Graph, Graphic, Gray, Green, Icon, Linear, Management, Market, Numbers, Percent, Process, Project, Round, Stock, Success Hop over obstacles with our Usa Ppt Linear Process 7 Phase Diagram Project Management PowerPoint 3 Graphic. Make sure your presentation gets the attention it deserves.
Usa Ppt Linear Process 7 Phase Diagram Project Management PowerPoint 4 Graphic
USA PPT linear process 7 phase diagram project management powerpoint 4 Graphic-Outline the path you have in mind in order to boost sales and stay ahead of the competition enhancing your corporate reputation as you go along the road to success. Now use this slide to transmit this clarity of purpose onto the eager minds of your team.-USA PPT linear process 7 phase diagram project management powerpoint 4 Graphic-Abstract, Achievement, Adding, Analyzing, Arrow, Art, Background, Blank, Blue, Business, Chart, Color, Colorful, Cycle, Data, Design, Diagram, Element, Flow, Graph, Graphic, Gray, Green, Icon, Linear, Management, Market, Numbers, Percent, Process, Project, Round, Stock, Success Making plans with our Usa Ppt Linear Process 7 Phase Diagram Project Management PowerPoint 4 Graphic entails success. They ensure automatic returns.
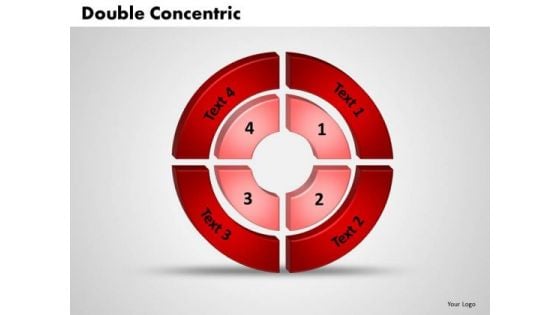
Business Process PowerPoint Templates Business 3d Double Concentric Rings Pieces Ppt Slides
Business Process PowerPoint Templates Business 3d double concentric rings pieces PPT Slides-Use this diagram to explain the contribution of each of the elements and how they provide impetus to the next phase. Highlight any anticipated problems, shortfalls or weak areas-Business Process PowerPoint Templates Business 3d double concentric rings pieces PPT Slides-This ppt can be used for concepts relating to-3d, Abstract, Account, Achievement, Analyst, Annual, Background, Blue, Business, Capital, Chart, Circular, Conceptual, Data, Design, Diagram, Document, Earnings, Economic, Finance, Financial, Forecast, Icon, Illustration etc. Do not go purely by the face value of our Business Process PowerPoint Templates Business 3d Double Concentric Rings Pieces Ppt Slides. Dwell on them and you will discover lot's more.
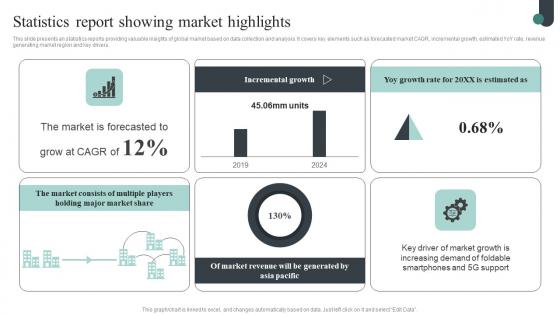
Competitive Intelligence Guide To Determine Market Statistics Report Showing Introduction Pdf
This slide presents an statistics reports providing valuable insights of global market based on data collection and analysis. It covers key elements such as forecasted market CAGR, incremental growth, estimated YoY rate, revenue generating market region and key drivers. The Competitive Intelligence Guide To Determine Market Statistics Report Showing Introduction Pdf is a compilation of the most recent design trends as a series of slides. It is suitable for any subject or industry presentation, containing attractive visuals and photo spots for businesses to clearly express their messages. This template contains a variety of slides for the user to input data, such as structures to contrast two elements, bullet points, and slides for written information. Slidegeeks is prepared to create an impression. This slide presents an statistics reports providing valuable insights of global market based on data collection and analysis. It covers key elements such as forecasted market CAGR, incremental growth, estimated YoY rate, revenue generating market region and key drivers.
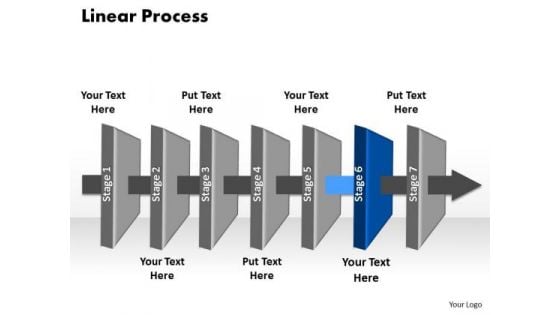
Ppt Ozone Layer PowerPoint Presentation 6 Social Linear Process Templates
PPT ozone layer PowerPoint presentation 6 social linear process Templates-Use this 3D PowerPoint Diagram to represent the Seven stages of Sequential Process. It portrays beeline, continuous, even, horizontal, in bee line, in straight line, linear , nonstop, not crooked, point-blank, right, shortest, straight, straightaway, though, true, unbroken etc.-PPT ozone layer PowerPoint presentation 6 social linear process Templates-abstract, achievement, adding, analyzing, arrow, art, background, blank, blue, business, chart, color, colorful, cycle, data, design, diagram, element, flow, graph, graphic, gray, green, icon, linear, management, market, numbers, percent, process, project, round, stock, success, up, value Experience the striking graphics of our Ppt Ozone Layer PowerPoint Presentation 6 Social Linear Process Templates. They bring good quality to the table.
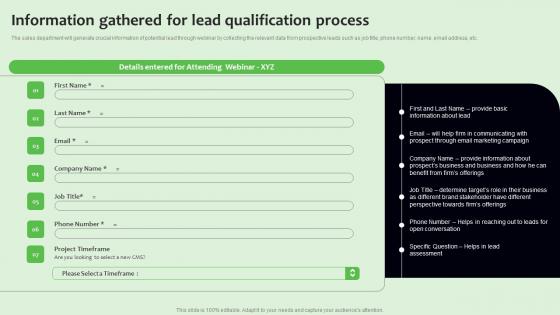
Information Gathered For Lead Qualification Strategies To Manage Sales Funnel Diagrams Pdf
The sales department will generate crucial information of potential lead through webinar by collecting the relevant data from prospective leads such as job title, phone number, name, email address, etc. The Information Gathered For Lead Qualification Strategies To Manage Sales Funnel Diagrams Pdf is a compilation of the most recent design trends as a series of slides. It is suitable for any subject or industry presentation, containing attractive visuals and photo spots for businesses to clearly express their messages. This template contains a variety of slides for the user to input data, such as structures to contrast two elements, bullet points, and slides for written information. Slidegeeks is prepared to create an impression. The sales department will generate crucial information of potential lead through webinar by collecting the relevant data from prospective leads such as job title, phone number, name, email address, etc.
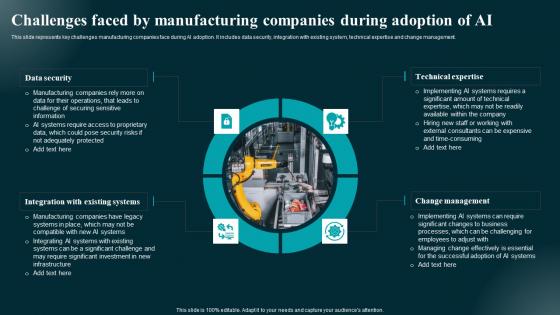
Challenges Faced By Manufacturing Companies Applications And Impact Themes Pdf
This slide represents key challenges manufacturing companies face during AI adoption. It includes data security, integration with existing system, technical expertise and change management. The Challenges Faced By Manufacturing Companies Applications And Impact Themes Pdf is a compilation of the most recent design trends as a series of slides. It is suitable for any subject or industry presentation, containing attractive visuals and photo spots for businesses to clearly express their messages. This template contains a variety of slides for the user to input data, such as structures to contrast two elements, bullet points, and slides for written information. Slidegeeks is prepared to create an impression. This slide represents key challenges manufacturing companies face during AI adoption. It includes data security, integration with existing system, technical expertise and change management.
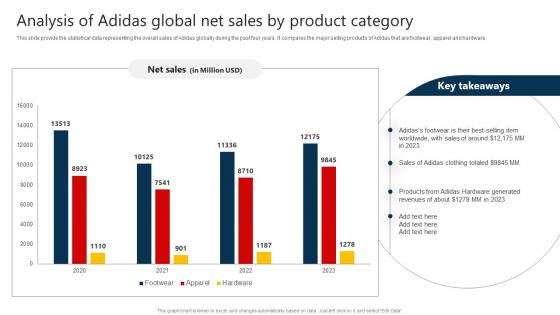
The Marketing Mix Of Analysis Of Adidas Global Net Sales By Product Category Strategy SS V
This slide provide the statistical data representing the overall sales of Adidas globally during the past four years. It compares the major selling products of Adidas that are footwear, apparel and hardware. The The Marketing Mix Of Analysis Of Adidas Global Net Sales By Product Category Strategy SS V is a compilation of the most recent design trends as a series of slides. It is suitable for any subject or industry presentation, containing attractive visuals and photo spots for businesses to clearly express their messages. This template contains a variety of slides for the user to input data, such as structures to contrast two elements, bullet points, and slides for written information. Slidegeeks is prepared to create an impression. This slide provide the statistical data representing the overall sales of Adidas globally during the past four years. It compares the major selling products of Adidas that are footwear, apparel and hardware.
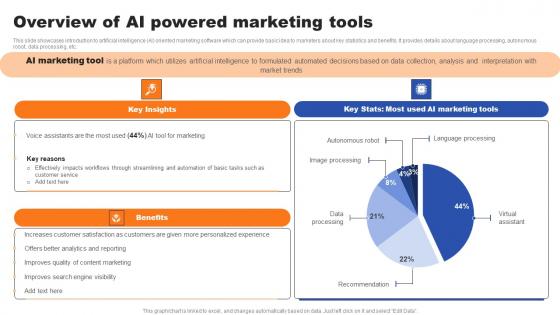
Overview Of AI Powered Marketing Tools Ppt Infographics Designs Download Pdf
This slide showcases introduction to artificial intelligence AI oriented marketing software which can provide basic idea to marketers about key statistics and benefits. It provides details about language processing, autonomous robot, data processing, etc. The Overview Of AI Powered Marketing Tools Ppt Infographics Designs Download Pdf is a compilation of the most recent design trends as a series of slides. It is suitable for any subject or industry presentation, containing attractive visuals and photo spots for businesses to clearly express their messages. This template contains a variety of slides for the user to input data, such as structures to contrast two elements, bullet points, and slides for written information. Slidegeeks is prepared to create an impression. This slide showcases introduction to artificial intelligence AI oriented marketing software which can provide basic idea to marketers about key statistics and benefits. It provides details about language processing, autonomous robot, data processing, etc.
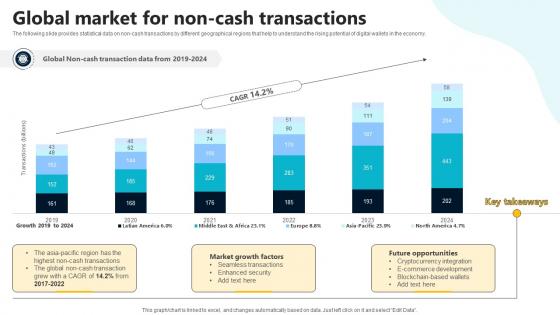
Global Market For Non Cash Transactions In Depth Guide To Digital Wallets Fin SS V
The following slide provides statistical data on non-cash transactions by different geographical regions that help to understand the rising potential of digital wallets in the economy. The Global Market For Non Cash Transactions In Depth Guide To Digital Wallets Fin SS V is a compilation of the most recent design trends as a series of slides. It is suitable for any subject or industry presentation, containing attractive visuals and photo spots for businesses to clearly express their messages. This template contains a variety of slides for the user to input data, such as structures to contrast two elements, bullet points, and slides for written information. Slidegeeks is prepared to create an impression. The following slide provides statistical data on non-cash transactions by different geographical regions that help to understand the rising potential of digital wallets in the economy.
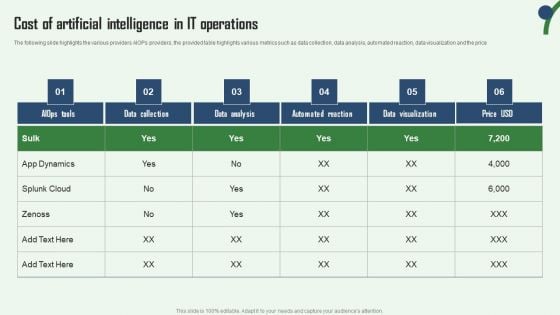
Cost Of Artificial Intelligence In IT Operations Aiops Integration Summary Report Themes PDF
The following slide highlights the various providers AIOPs providers, the provided table highlights various metrics such as data collection, data analysis, automated reaction, data visualization and the price. Formulating a presentation can take up a lot of effort and time, so the content and message should always be the primary focus. The visuals of the PowerPoint can enhance the presenters message, so our Cost Of Artificial Intelligence In IT Operations Aiops Integration Summary Report Themes PDF was created to help save time. Instead of worrying about the design, the presenter can concentrate on the message while our designers work on creating the ideal templates for whatever situation is needed. Slidegeeks has experts for everything from amazing designs to valuable content, we have put everything into Cost Of Artificial Intelligence In IT Operations Aiops Integration Summary Report Themes PDF.

Incorporating HIS To Enhance Healthcare Services Best Practices For Health Information System Management Diagrams PDF
This slide covers best practices for health information system to enhance healthcare services efficiency. It involves approaches such as identify data and integrate tools, analyze data storage growth and understand data access requirements. Want to ace your presentation in front of a live audience Our Incorporating HIS To Enhance Healthcare Services Best Practices For Health Information System Management Diagrams PDF can help you do that by engaging all the users towards you. Slidegeeks experts have put their efforts and expertise into creating these impeccable powerpoint presentations so that you can communicate your ideas clearly. Moreover, all the templates are customizable, and easy to edit and downloadable. Use these for both personal and commercial use.
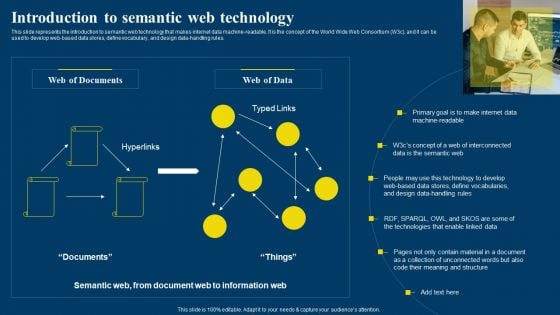
Semantic Web Business Framework Advantages IT Introduction To Semantic Web Technology Diagrams PDF
This slide represents the introduction to semantic web technology that makes internet data machine-readable. It is the concept of the World Wide Web Consortium W3c, and it can be used to develop web-based data stores, define vocabulary, and design data-handling rules. This Semantic Web Business Framework Advantages IT Introduction To Semantic Web Technology Diagrams PDF from Slidegeeks makes it easy to present information on your topic with precision. It provides customization options, so you can make changes to the colors, design, graphics, or any other component to create a unique layout. It is also available for immediate download, so you can begin using it right away. Slidegeeks has done good research to ensure that you have everything you need to make your presentation stand out. Make a name out there for a brilliant performance.
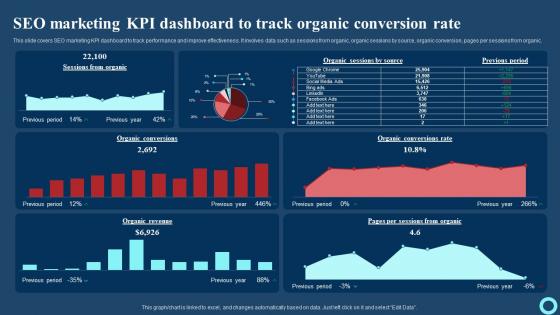
Seo Marketing KPI Dashboard To Track Organic Conversion Rate Effective Strategies To Enhance Download Pdf
This slide covers SEO marketing KPI dashboard to track performance and improve effectiveness. It involves data such as sessions from organic, organic sessions by source, organic conversion, pages per sessions from organic. The Seo Marketing KPI Dashboard To Track Organic Conversion Rate Effective Strategies To Enhance Download Pdf is a compilation of the most recent design trends as a series of slides. It is suitable for any subject or industry presentation, containing attractive visuals and photo spots for businesses to clearly express their messages. This template contains a variety of slides for the user to input data, such as structures to contrast two elements, bullet points, and slides for written information. Slidegeeks is prepared to create an impression. This slide covers SEO marketing KPI dashboard to track performance and improve effectiveness. It involves data such as sessions from organic, organic sessions by source, organic conversion, pages per sessions from organic.
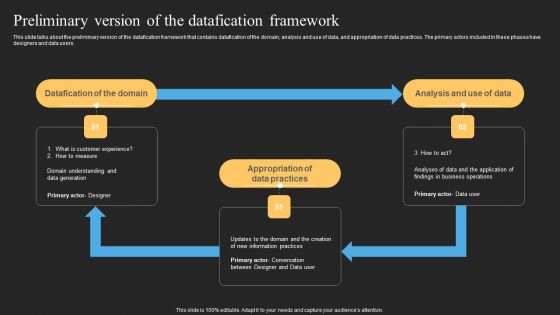
Datafy Preliminary Version Of The Datafication Framework Portrait PDF
This slide talks about the preliminary version of the datafication framework that contains datafication of the domain, analysis and use of data, and appropriation of data practices. The primary actors included in these phases have designers and data users. Are you searching for a Datafy Preliminary Version Of The Datafication Framework Portrait PDF that is uncluttered, straightforward, and original. Its easy to edit, and you can change the colors to suit your personal or business branding. For a presentation that expresses how much effort youve put in, this template is ideal With all of its features, including tables, diagrams, statistics, and lists, its perfect for a business plan presentation. Make your ideas more appealing with these professional slides. Download Datafy Preliminary Version Of The Datafication Framework Portrait PDF from Slidegeeks today.
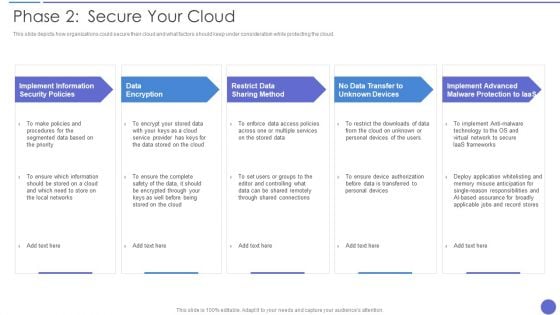
Phase 2 Secure Your Cloud Clipart PDF
This slide depicts how organizations could secure their cloud and what factors should keep under consideration while protecting the cloud. Presenting Phase 2 Secure Your Cloud Clipart PDF to provide visual cues and insights. Share and navigate important information on five stages that need your due attention. This template can be used to pitch topics like Data Encryption, Restrict Data Sharing Method, Implement Information. In addtion, this PPT design contains high resolution images, graphics, etc, that are easily editable and available for immediate download.
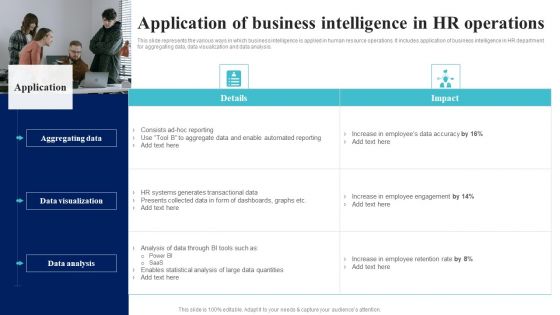
BI Implementation To Enhance Hiring Process Application Of Business Intelligence In HR Operations Diagrams PDF
This slide represents the various ways in which business intelligence is applied in human resource operations. It includes application of business intelligence in HR department for aggregating data, data visualization and data analysis.Slidegeeks is one of the best resources for PowerPoint templates. You can download easily and regulate BI Implementation To Enhance Hiring Process Application Of Business Intelligence In HR Operations Diagrams PDF for your personal presentations from our wonderful collection. A few clicks is all it takes to discover and get the most relevant and appropriate templates. Use our Templates to add a unique zing and appeal to your presentation and meetings. All the slides are easy to edit and you can use them even for advertisement purposes.
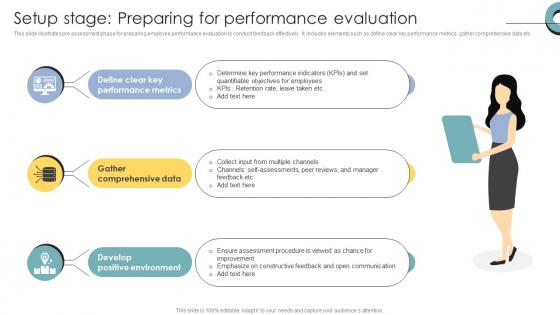
Skill Enhancement Performance Setup Stage Preparing For Performance Evaluation
This slide illustrates pre assessment phase for preparing employee performance evaluation to conduct feedback effectively. It includes elements such as define clear key performance metrics, gather comprehensive data etc. The Skill Enhancement Performance Reasons To Conduct Performance Evaluation Using Online Survey is a compilation of the most recent design trends as a series of slides. It is suitable for any subject or industry presentation, containing attractive visuals and photo spots for businesses to clearly express their messages. This template contains a variety of slides for the user to input data, such as structures to contrast two elements, bullet points, and slides for written information. Slidegeeks is prepared to create an impression. This slide illustrates pre assessment phase for preparing employee performance evaluation to conduct feedback effectively. It includes elements such as define clear key performance metrics, gather comprehensive data etc.
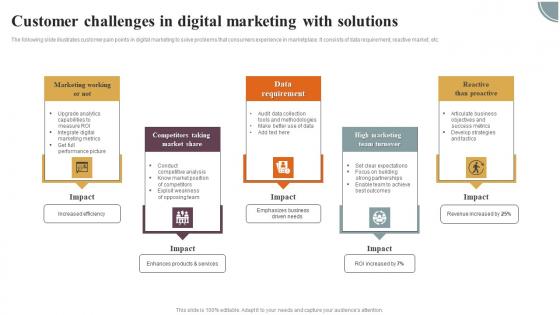
Customer Challenges In Digital Marketing With Solutions Diagrams Pdf
The following slide illustrates customer pain points in digital marketing to solve problems that consumers experience in marketplace. It consists of data requirement, reactive market, etc. Pitch your topic with ease and precision using this Customer Challenges In Digital Marketing With Solutions Diagrams Pdf This layout presents information on Marketing Working, Competitors Taking, Market Share It is also available for immediate download and adjustment. So, changes can be made in the color, design, graphics or any other component to create a unique layout. The following slide illustrates customer pain points in digital marketing to solve problems that consumers experience in marketplace. It consists of data requirement, reactive market, etc.
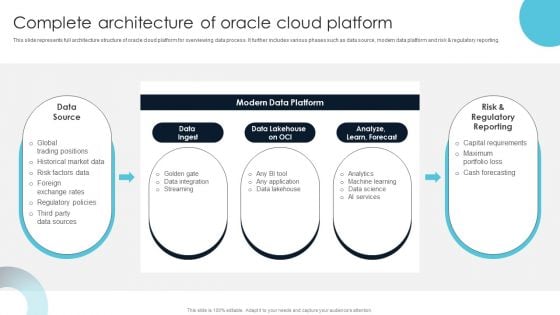
Complete Architecture Of Oracle Cloud Platform Information PDF
This slide represents full architecture structure of oracle cloud platform for overviewing data process. It further includes various phases such as data source, modern data platform and risk and regulatory reporting. Slidegeeks is here to make your presentations a breeze with Complete Architecture Of Oracle Cloud Platform Information PDF With our easy-to-use and customizable templates, you can focus on delivering your ideas rather than worrying about formatting. With a variety of designs to choose from, you are sure to find one that suits your needs. And with animations and unique photos, illustrations, and fonts, you can make your presentation pop. So whether you are giving a sales pitch or presenting to the board, make sure to check out Slidegeeks first
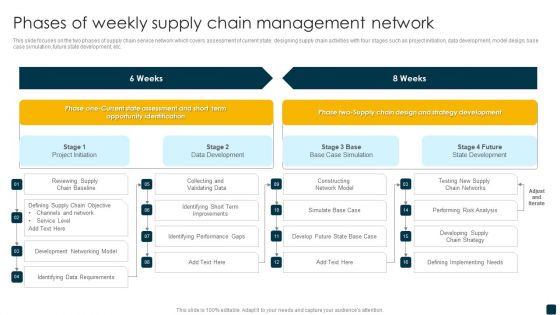
Phases Of Weekly Supply Chain Management Network Template PDF
This slide focuses on the two phases of supply chain service network which covers assessment of current state, designing supply chain activities with four stages such as project initiation, data development, model design, base case simulation, future state development, etc. Pitch your topic with ease and precision using this Phases Of Weekly Supply Chain Management Network Template PDF. This layout presents information on Supply Chain, Development Networking Model, Collecting And Validating Data. It is also available for immediate download and adjustment. So, changes can be made in the color, design, graphics or any other component to create a unique layout.

Datafy Framework Of Datafication Technology Infographics PDF
This slide represents the framework of datafication technology, and it includes two cycles such as design data and data use. The design data further contains four elements, including domain, domain model, implementation and appropriation, and design. Whether you have daily or monthly meetings, a brilliant presentation is necessary. Datafy Framework Of Datafication Technology Infographics PDF can be your best option for delivering a presentation. Represent everything in detail using Datafy Framework Of Datafication Technology Infographics PDF and make yourself stand out in meetings. The template is versatile and follows a structure that will cater to your requirements. All the templates prepared by Slidegeeks are easy to download and edit. Our research experts have taken care of the corporate themes as well. So, give it a try and see the results.
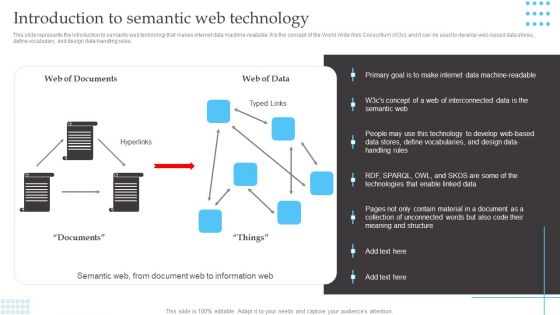
Semantic Web Fundamentals Introduction To Semantic Web Technology Inspiration PDF
This slide represents the introduction to semantic web technology that makes internet data machine-readable. It is the concept of the World Wide Web Consortium W3c, and it can be used to develop web based data stores, define vocabulary, and design data handling rules. Do you know about Slidesgeeks Semantic Web Fundamentals Introduction To Semantic Web Technology Inspiration PDF These are perfect for delivering any kind od presentation. Using it, create PowerPoint presentations that communicate your ideas and engage audiences. Save time and effort by using our pre designed presentation templates that are perfect for a wide range of topic. Our vast selection of designs covers a range of styles, from creative to business, and are all highly customizable and easy to edit. Download as a PowerPoint template or use them as Google Slides themes.
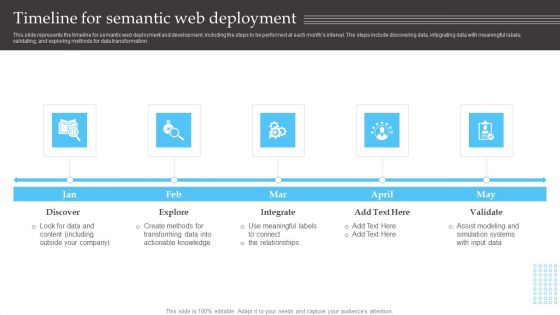
Semantic Web Fundamentals Timeline For Semantic Web Deployment Topics PDF
This slide represents the timeline for semantic web deployment and development, including the steps to be performed at each months interval. The steps include discovering data, integrating data with meaningful labels, validating, and exploring methods for data transformation. Are you searching for a Semantic Web Fundamentals Timeline For Semantic Web Deployment Topics PDF that is uncluttered, straightforward, and original Its easy to edit, and you can change the colors to suit your personal or business branding. For a presentation that expresses how much effort you have put in, this template is ideal With all of its features, including tables, diagrams, statistics, and lists, its perfect for a business plan presentation. Make your ideas more appealing with these professional slides. Download Semantic Web Fundamentals Timeline For Semantic Web Deployment Topics PDF from Slidegeeks today.
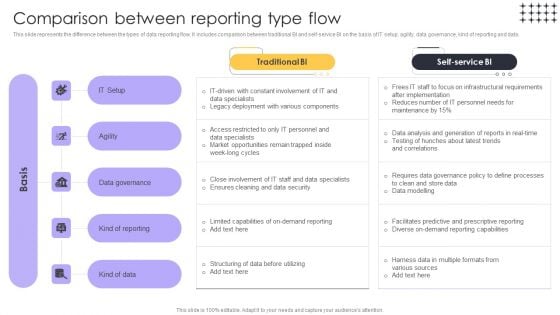
Tools For HR Business Analytics Comparison Between Reporting Type Flow Inspiration PDF
This slide represents the difference between the types of data reporting flow. It includes comparison between traditional BI and self-service BI on the basis of IT setup, agility, data governance, kind of reporting and data. If you are looking for a format to display your unique thoughts, then the professionally designed Tools For HR Business Analytics Comparison Between Reporting Type Flow Inspiration PDF is the one for you. You can use it as a Google Slides template or a PowerPoint template. Incorporate impressive visuals, symbols, images, and other charts. Modify or reorganize the text boxes as you desire. Experiment with shade schemes and font pairings. Alter, share or cooperate with other people on your work. Download Tools For HR Business Analytics Comparison Between Reporting Type Flow Inspiration PDF and find out how to give a successful presentation. Present a perfect display to your team and make your presentation unforgettable.
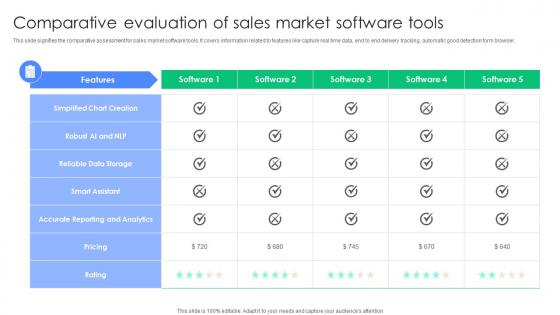
Comparative Evaluation Of Sales Market Software Tools Graphics Pdf
This slide signifies the comparative assessment for sales market software tools. It covers information related to features like capture real time data, end to end delivery tracking, automatic good detection form browser. Pitch your topic with ease and precision using this Comparative Evaluation Of Sales Market Software Tools Graphics Pdf. This layout presents information on Simplified Chart Creation, Robust AI NLP, Reliable Data Storage. It is also available for immediate download and adjustment. So, changes can be made in the color, design, graphics or any other component to create a unique layout. This slide signifies the comparative assessment for sales market software tools. It covers information related to features like capture real time data, end to end delivery tracking, automatic good detection form browser.
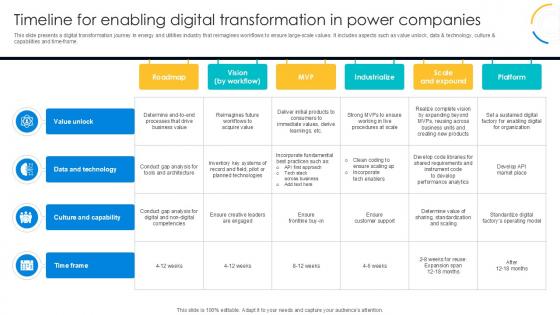
Timeline For Enabling Digital Transformation In Power Companies PPT Slide DT SS V
This slide presents a digital transformation journey in energy and utilities industry that reimagines workflows to ensure large-scale values. It includes aspects such as value unlock, data and technology, culture and capabilities and time-frame. Do you know about Slidesgeeks Data And Technology, Culture And Capability, Time Frame These are perfect for delivering any kind od presentation. Using it, create PowerPoint presentations that communicate your ideas and engage audiences. Save time and effort by using our pre-designed presentation templates that are perfect for a wide range of topic. Our vast selection of designs covers a range of styles, from creative to business, and are all highly customizable and easy to edit. Download as a PowerPoint template or use them as Google Slides themes. This slide presents a digital transformation journey in energy and utilities industry that reimagines workflows to ensure large-scale values. It includes aspects such as value unlock, data and technology, culture and capabilities and time-frame.
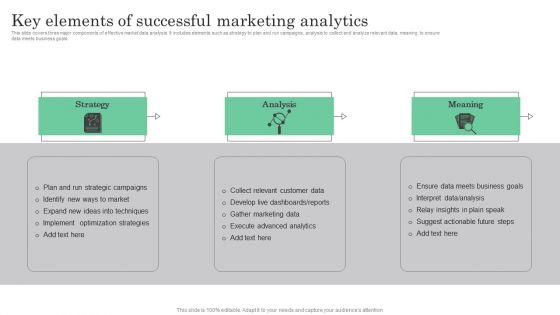
Online Marketing Analytics To Enhance Business Growth Key Elements Of Successful Marketing Analytics Demonstration PDF
This slide covers three major components of effective market data analysis. It includes elements such as strategy to plan and run campaigns, analysis to collect and analyze relevant data, meaning to ensure data meets business goals. Whether you have daily or monthly meetings, a brilliant presentation is necessary. Online Marketing Analytics To Enhance Business Growth Key Elements Of Successful Marketing Analytics Demonstration PDF can be your best option for delivering a presentation. Represent everything in detail using Online Marketing Analytics To Enhance Business Growth Key Elements Of Successful Marketing Analytics Demonstration PDF and make yourself stand out in meetings. The template is versatile and follows a structure that will cater to your requirements. All the templates prepared by Slidegeeks are easy to download and edit. Our research experts have taken care of the corporate themes as well. So, give it a try and see the results.
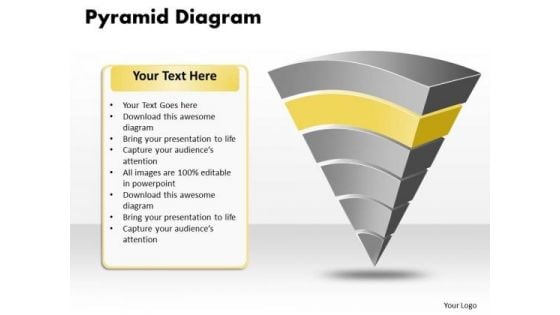
Ppt Pyramid Diagram Pattern Certificate Templates PowerPoint
PPT pyramid diagram pattern certificate templates powerpoint-A Pyramid Diagram may be defined as representation of data in the form of a triangle separated by horizontal lines. The widest section may contain the general topic while the narrowest section may contain a much more specific topic.This diagarm highlights the depth of your thought process.-PPT pyramid diagram pattern certificate templates powerpoint-Business, Chart, Color, Data Pyramid, Diagram, Graph, Group, Growth, Hierarchy, Illustration, Layer, Layered, Layered Pyramid, Level, Multicolor, Object, Performance, Presentation, Progress, Pyramid, Rank, Seam, Segment, Set, Shape, Stage, Structure, Symbol, System, Top Do not fall for any popular fallacy. Ascertain the facts with our Ppt Pyramid Diagram Pattern Certificate Templates PowerPoint.
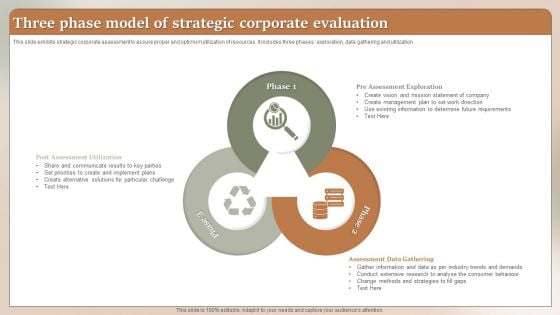
Three Phase Model Of Strategic Corporate Evaluation Ppt Ideas Designs Download PDF
This slide exhibits strategic corporate assessment to assure proper and optimum utilization of resources. It includes three phases exploration, data gathering and utilization. Presenting Three Phase Model Of Strategic Corporate Evaluation Ppt Ideas Designs Download PDF to dispense important information. This template comprises three stages. It also presents valuable insights into the topics including Post Assessment Utilization, Pre Assessment Exploration, Assessment Data Gathering. This is a completely customizable PowerPoint theme that can be put to use immediately. So, download it and address the topic impactfully.
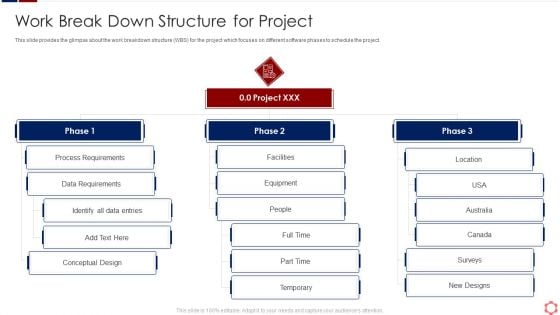
Business Operation Modeling Approaches Work Break Down Structure For Project Themes PDF
This slide provides the glimpse about the work breakdown structure WBS for the project which focuses on different software phases to schedule the project.Presenting business operation modeling approaches work break down structure for project themes pdf to provide visual cues and insights. Share and navigate important information on three stages that need your due attention. This template can be used to pitch topics like process requirements, data requirements, identify all data entries In addtion, this PPT design contains high resolution images, graphics, etc, that are easily editable and available for immediate download.
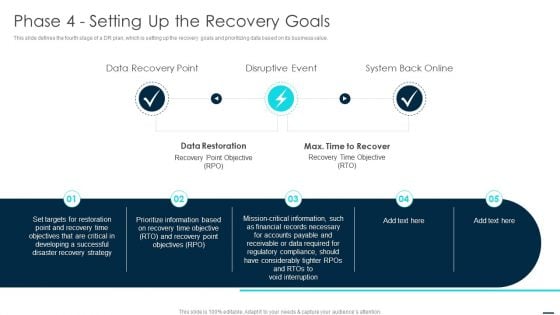
Technology Disaster Recovery Plan Phase 4 Setting Up The Recovery Goals Clipart PDF
This slide defines the fourth stage of a DR plan, which is setting up the recovery goals and prioritizing data based on its business value. Presenting Technology Disaster Recovery Plan Phase 4 Setting Up The Recovery Goals Clipart PDF to provide visual cues and insights. Share and navigate important information on five stages that need your due attention. This template can be used to pitch topics like Disaster Recovery Strategy, Data Required, Information. In addtion, this PPT design contains high resolution images, graphics, etc, that are easily editable and available for immediate download.
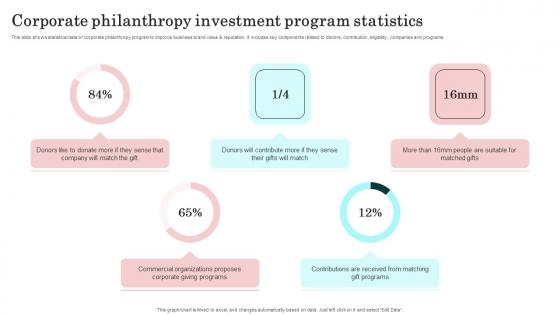
Corporate Philanthropy Investment Program Statistics Topics Pdf
This slide shows statistical data of corporate philanthropy program to improve business brand value and reputation. It includes key components related to donors, contribution, eligibility, companies and programs. Showcasing this set of slides titled Corporate Philanthropy Investment Program Statistics Topics Pdf. The topics addressed in these templates are Commercial Organizations Proposes, Contributions Received, Matching Gift Programs. All the content presented in this PPT design is completely editable. Download it and make adjustments in color, background, font etc. as per your unique business setting. This slide shows statistical data of corporate philanthropy program to improve business brand value and reputation. It includes key components related to donors, contribution, eligibility, companies and programs.
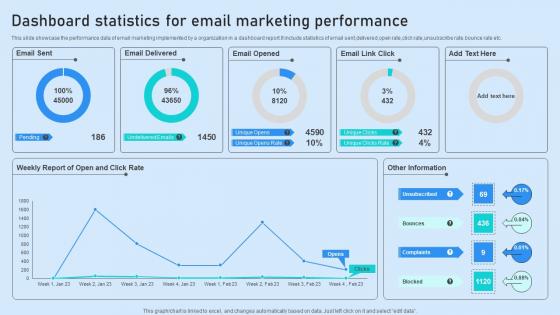
Dashboard Statistics For Email Marketing Performance Guidelines Pdf
This slide showcase the performance data of email marketing implemented by a organization in a dashboard report.It include statistics of email sent,delivered,open rate,click rate,unsubscribe rate,bounce rate etc. Showcasing this set of slides titled Dashboard Statistics For Email Marketing Performance Guidelines Pdf. The topics addressed in these templates are Email Delivered, Email Opened, Performance. All the content presented in this PPT design is completely editable. Download it and make adjustments in color, background, font etc. as per your unique business setting. This slide showcase the performance data of email marketing implemented by a organization in a dashboard report.It include statistics of email sent,delivered,open rate,click rate,unsubscribe rate,bounce rate etc.
PowerPoint Designs Process Chart Strategy Ppt Slide
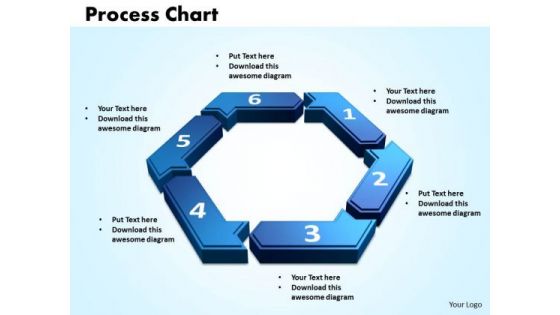
PowerPoint Designs process Chart Strategy PPT Slide-This Process Chart can be used as data flow diagram to show the flow of the data as it moves from beginning process to end result.-3d, arrow, art, business, chart, circle, concept, connection, cycle, development, diagram, direction, element, environment, finance, financial, flow, graphic, group, investment, isolated, market,, movement, organization, passive income, perspective, presentation, process chart, recycle, report, sign, step, success, symbol, teamwork-PowerPoint Designs process Chart Strategy PPT Slide Our PowerPoint Designs Process Chart Strategy Ppt Slide have a glossy look. Your thoughts will also acquire a sheen.
Account Methodology Management Revenue Streams Statistics Professional Pdf
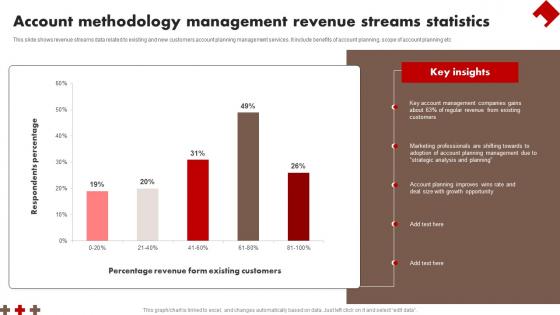
This slide shows revenue streams data related to existing and new customers account planning management services. It include benefits of account planning, scope of account planning etc Pitch your topic with ease and precision using this Account Methodology Management Revenue Streams Statistics Professional Pdf This layout presents information on Account Methodology, Management Revenue, Streams Statistics It is also available for immediate download and adjustment. So, changes can be made in the color, design, graphics or any other component to create a unique layout. This slide shows revenue streams data related to existing and new customers account planning management services. It include benefits of account planning, scope of account planning etc
Summary Finance Transformation Project Plan Current Scope And Future Phase Professional PDF
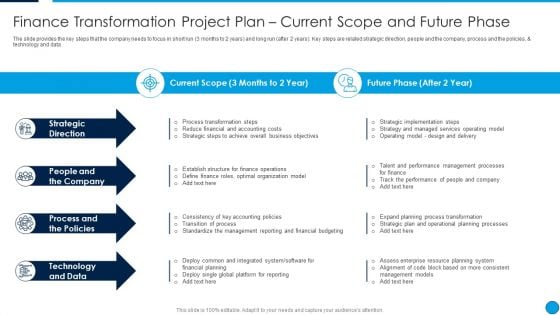
The slide provides the key steps that the company needs to focus in short run 3 months to 2 years and long run after 2 years. Key steps are related strategic direction, people and the company, process and the policies, and technology and data. Deliver and pitch your topic in the best possible manner with this Summary Finance Transformation Project Plan Current Scope And Future Phase Professional PDF. Use them to share invaluable insights on Strategic Direction, People And The Company, Process And The Policies, Technology And Data and impress your audience. This template can be altered and modified as per your expectations. So, grab it now.
Software Interoperability Examination IT Check Phase Of PDCA Cycle Professional PDF
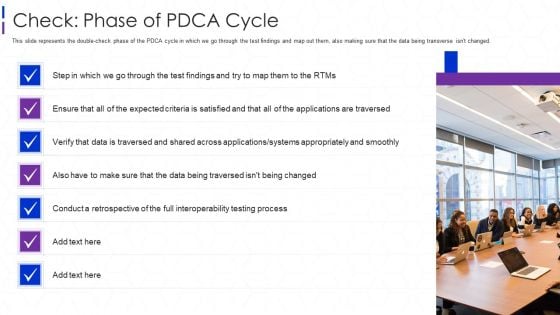
This slide represents the double check phase of the PDCA cycle in which we go through the test findings and map out them, also making sure that the data being transverse isnt changed. Presenting software interoperability examination it check phase of pdca cycle professional pdf to provide visual cues and insights. Share and navigate important information on seven stages that need your due attention. This template can be used to pitch topics like applications, systems, data, process. In addtion, this PPT design contains high resolution images, graphics, etc, that are easily editable and available for immediate download.
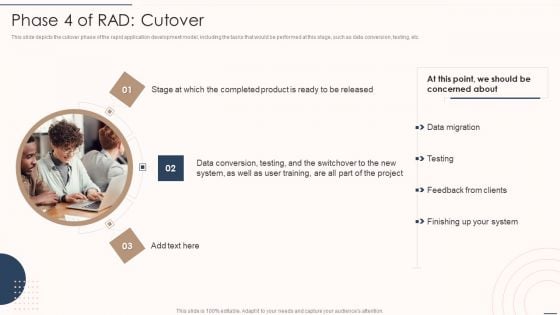
Rapid Application Building Framework Phase 4 Of RAD Cutover Download PDF
This slide depicts the cutover phase of the rapid application development model, including the tasks that would be performed at this stage, such as data conversion, testing, etc.Presenting Rapid Application Building Framework Phase 4 Of RAD Cutover Download PDF to provide visual cues and insights. Share and navigate important information on three stages that need your due attention. This template can be used to pitch topics like Completed Product, Data Migration, Concerned About. In addtion, this PPT design contains high resolution images, graphics, etc, that are easily editable and available for immediate download.
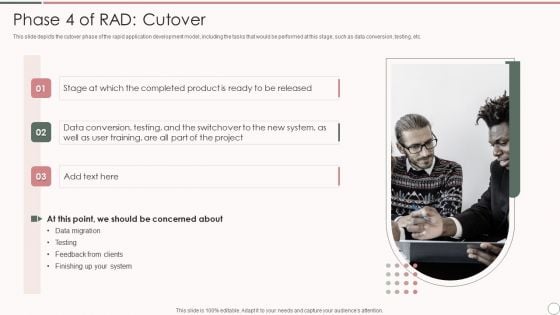
Rapid Application Development Architecture Phase 4 Of Rad Cutover Designs PDF
This slide depicts the cutover phase of the rapid application development model, including the tasks that would be performed at this stage, such as data conversion, testing, etc.Presenting Rapid Application Development Architecture Phase 4 Of Rad Cutover Designs PDF to provide visual cues and insights. Share and navigate important information on three stages that need your due attention. This template can be used to pitch topics like Completed Product, Concerned About, Data Conversion. In addtion, this PPT design contains high resolution images, graphics, etc, that are easily editable and available for immediate download.
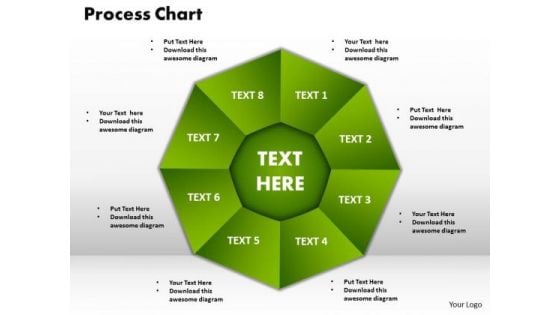
PowerPoint Slide Designs Process Chart Company Ppt Slides
PowerPoint Slide Designs process chart Company PPT Slides-This Process Chart can be used as data flow diagram to show the flow of the data as it moves from beginning process to end result.-3d, art, business, chart, circle, concept, connection, cycle, development, diagram, direction, element, environment, finance, financial, flow, graphic, group, investment, isolated, market,, movement, organization, passive income, perspective, presentation, process chart, recycle, report, sign, step, success, symbol, teamwork-PowerPoint Slide Designs process chart Company PPT Slides Excite emotions with our PowerPoint Slide Designs Process Chart Company Ppt Slides. Give them a real feel for your thoughts.
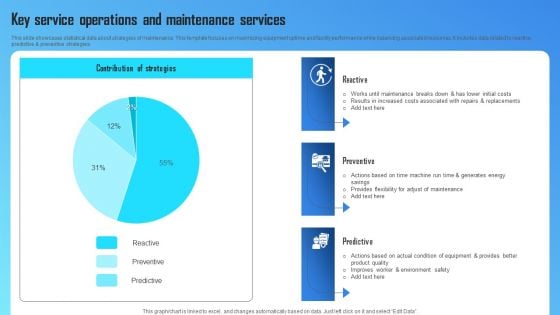
Key Service Operations And Maintenance Services Diagrams PDF
This slide showcases statistical data about strategies of maintenance. This template focuses on maximizing equipment uptime and facility performance while balancing associated resources. It includes data related to reactive, predictive and preventive strategies. Pitch your topic with ease and precision using this Key Service Operations And Maintenance Services Diagrams PDF. This layout presents information on Costs Associated, Environment Safety, Condition Of Equipment. It is also available for immediate download and adjustment. So, changes can be made in the color, design, graphics or any other component to create a unique layout.
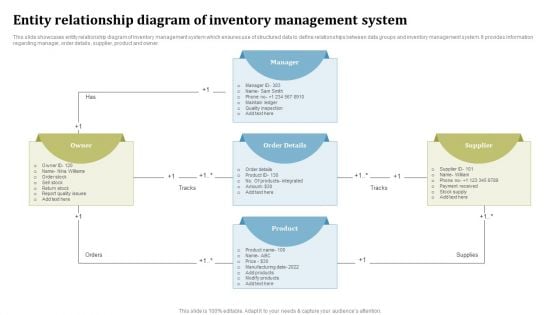
Entity Relationship Diagram Of Inventory Management System Ppt Pictures Background Image PDF
This slide showcases entity relationship diagram of inventory management system which ensures use of structured data to define relationships between data groups and inventory management system. It provides information regarding manager, order details, supplier, product and owner. Presenting Entity Relationship Diagram Of Inventory Management System Ppt Pictures Background Image PDF to dispense important information. This template comprises one stages. It also presents valuable insights into the topics including Manager, Supplier, Order Details, Product, Owner. This is a completely customizable PowerPoint theme that can be put to use immediately. So, download it and address the topic impactfully.
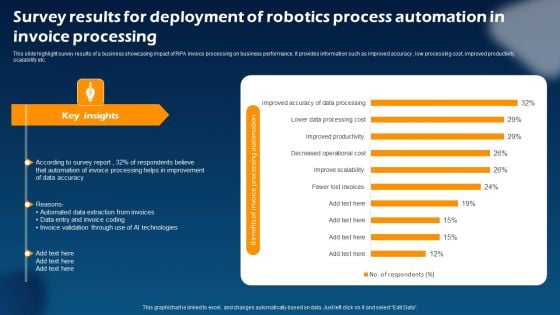
Survey Results For Deployment Of Robotics Process Automation In Invoice Processing Themes PDF
This slide highlight survey results of a business showcasing impact of RPA invoice processing on business performance. It provides information such as improved accuracy , low processing cost, improved productivity, scalability etc. Showcasing this set of slides titled Survey Results For Deployment Of Robotics Process Automation In Invoice Processing Themes PDF. The topics addressed in these templates are According Survey Report, Automated Data Extraction, Data Entry Invoice. All the content presented in this PPT design is completely editable. Download it and make adjustments in color, background, font etc. as per your unique business setting.
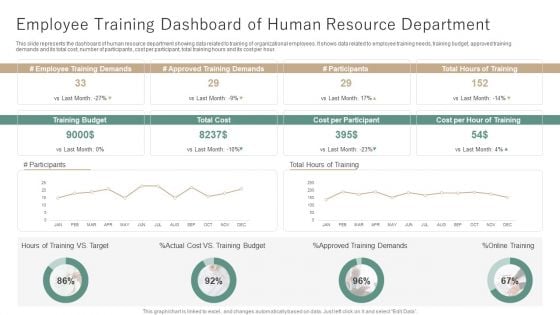
Employee Training Dashboard Of Human Resource Department Ppt Outline Themes PDF
This slide represents the dashboard of human resource department showing data related to training of organizational employees. It shows data related to employee training needs, training budget, approved training demands and its total cost, number of participants, cost per participant, total training hours and its cost per hour. Showcasing this set of slides titled Employee Training Dashboard Of Human Resource Department Ppt Outline Themes PDF. The topics addressed in these templates are Employee Training Demands, Approved Training Demands, Cost per Participant. All the content presented in this PPT design is completely editable. Download it and make adjustments in color, background, font etc. as per your unique business setting.
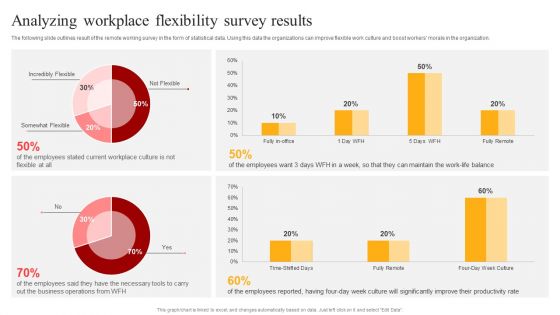
Flexible Working Policies And Guidelines Analyzing Workplace Flexibility Survey Results Diagrams PDF
The following slide outlines result of the remote working survey in the form of statistical data. Using this data the organizations can improve flexible work culture and boost workers morale in the organization. Boost your pitch with our creative Flexible Working Policies And Guidelines Analyzing Workplace Flexibility Survey Results Diagrams PDF. Deliver an awe-inspiring pitch that will mesmerize everyone. Using these presentation templates you will surely catch everyones attention. You can browse the ppts collection on our website. We have researchers who are experts at creating the right content for the templates. So you do not have to invest time in any additional work. Just grab the template now and use them.
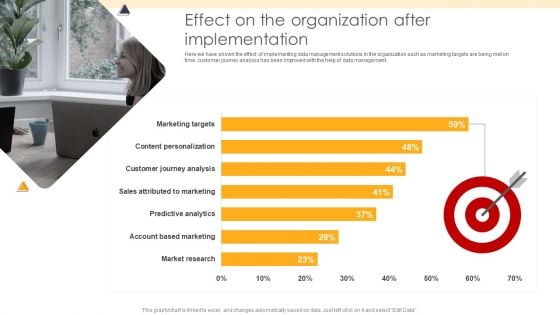
ETL Repository Effect On The Organization After Implementation Ppt PowerPoint Presentation Portfolio Diagrams PDF
Here we have shown the effect of implementing data management solutions in the organization such as marketing targets are being met on time, customer journey analysis has been improved with the help of data management. Deliver an awe inspiring pitch with this creative ETL Repository Effect On The Organization After Implementation Ppt PowerPoint Presentation Portfolio Diagrams PDF bundle. Topics like Market Research, Account Based, Sales Attributed can be discussed with this completely editable template. It is available for immediate download depending on the needs and requirements of the user.

 Home
Home