Data Icon
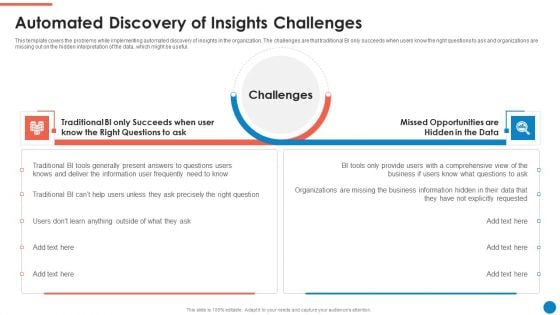
Data And Analytics Playbook Automated Discovery Of Insights Challenges Download PDF
This template covers the problems while implementing automated discovery of insights in the organization. The challenges are that traditional BI only succeeds when users know the right questions to ask and organizations are missing out on the hidden interpretation of the data, which might be useful. This is a Data And Analytics Playbook Automated Discovery Of Insights Challenges Download PDF template with various stages. Focus and dispense information on two stages using this creative set, that comes with editable features. It contains large content boxes to add your information on topics like Challenges, Missed Opportunities, Deliver Information. You can also showcase facts, figures, and other relevant content using this PPT layout. Grab it now.
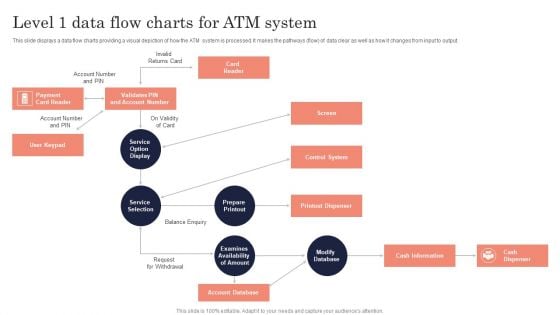
Level 1 Data Flow Charts For ATM System Ppt PowerPoint Presentation Gallery Visual Aids PDF
Presenting Level 1 Data Flow Charts For ATM System Ppt PowerPoint Presentation Gallery Visual Aids PDF to dispense important information. This template comprises two stages. It also presents valuable insights into the topics including Payment Card Reader, User Keypad, Control System, Printout Dispenser. This is a completely customizable PowerPoint theme that can be put to use immediately. So, download it and address the topic impactfully.
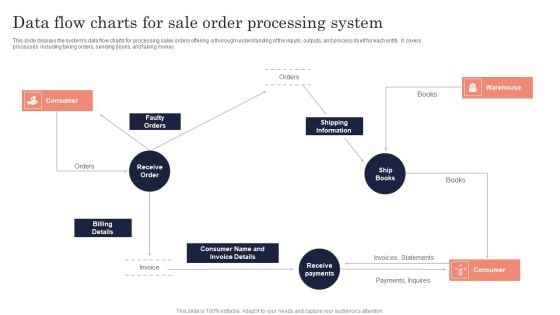
Data Flow Charts For Sale Order Processing System Ppt PowerPoint Presentation File Introduction PDF
Persuade your audience using this Data Flow Charts For Sale Order Processing System Ppt PowerPoint Presentation File Introduction PDF. This PPT design covers three stages, thus making it a great tool to use. It also caters to a variety of topics including Consumer, Faulty Orders, Billing Details. Download this PPT design now to present a convincing pitch that not only emphasizes the topic but also showcases your presentation skills.
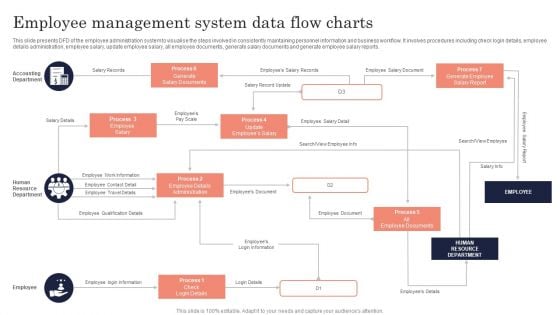
Employee Management System Data Flow Charts Ppt PowerPoint Presentation File Clipart Images PDF
Persuade your audience using this Employee Management System Data Flow Charts Ppt PowerPoint Presentation File Clipart Images PDF. This PPT design covers three stages, thus making it a great tool to use. It also caters to a variety of topics including Accounting Department, Human Resource Department, Employee. Download this PPT design now to present a convincing pitch that not only emphasizes the topic but also showcases your presentation skills.
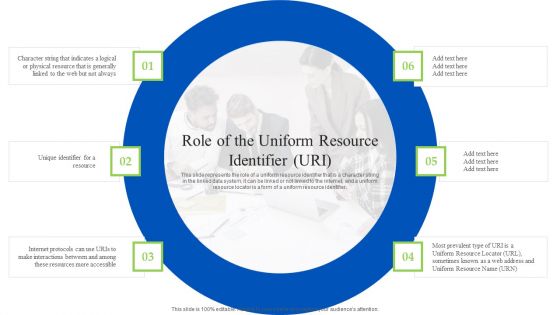
Linked Data Visualization Role Of The Uniform Resource Identifier URI Slides PDF
This slide represents the role of a uniform resource identifier that is a character string in the linked data system, it can be linked or not linked to the internet, and a uniform resource locator is a form of a uniform resource identifier. Are you in need of a template that can accommodate all of your creative concepts This one is crafted professionally and can be altered to fit any style. Use it with Google Slides or PowerPoint. Include striking photographs, symbols, depictions, and other visuals. Fill, move around, or remove text boxes as desired. Test out color palettes and font mixtures. Edit and save your work, or work with colleagues. Download Linked Data Visualization Role Of The Uniform Resource Identifier URI Slides PDF and observe how to make your presentation outstanding. Give an impeccable presentation to your group and make your presentation unforgettable.
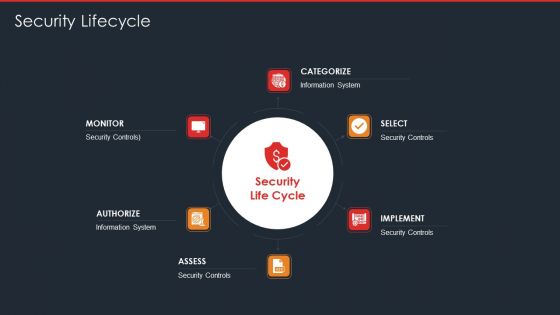
Data Safety Initiatives For Effective IT Security Threats Administration Security Lifecycle Template PDF
This is a data safety initiatives for effective it security threats administration security lifecycle template pdf template with various stages. Focus and dispense information on six stages using this creative set, that comes with editable features. It contains large content boxes to add your information on topics like information system, security controls, monitor, assess, implement, authorize. You can also showcase facts, figures, and other relevant content using this PPT layout. Grab it now.
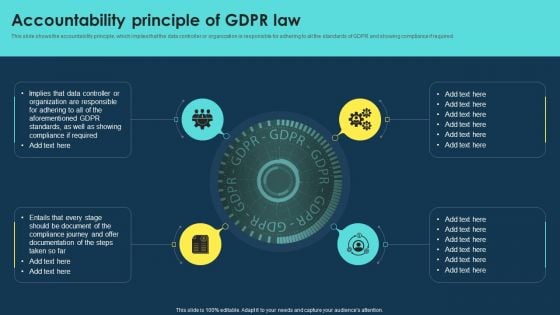
Integrating Data Privacy System Accountability Principle Of GDPR Law Ppt Gallery Files PDF
This slide shows the accountability principle, which implies that the data controller or organization is responsible for adhering to all the standards of GDPR and showing compliance if required. Slidegeeks is one of the best resources for PowerPoint templates. You can download easily and regulate Integrating Data Privacy System Accountability Principle Of GDPR Law Ppt Gallery Files PDF for your personal presentations from our wonderful collection. A few clicks is all it takes to discover and get the most relevant and appropriate templates. Use our Templates to add a unique zing and appeal to your presentation and meetings. All the slides are easy to edit and you can use them even for advertisement purposes.
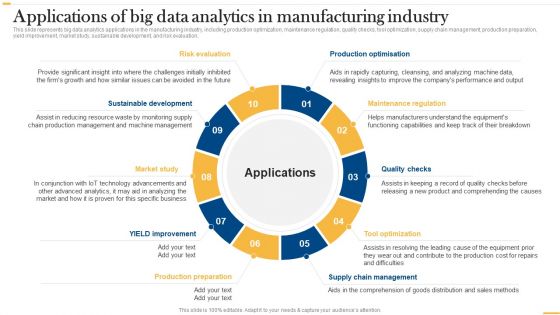
Deploying AI To Enhance Applications Of Big Data Analytics In Manufacturing Graphics PDF
This slide represents big data analytics applications in the manufacturing industry, including production optimization, maintenance regulation, quality checks, tool optimization, supply chain management, production preparation, yield improvement, market study, sustainable development, and risk evaluation. Slidegeeks is one of the best resources for PowerPoint templates. You can download easily and regulate Deploying AI To Enhance Applications Of Big Data Analytics In Manufacturing Graphics PDF for your personal presentations from our wonderful collection. A few clicks is all it takes to discover and get the most relevant and appropriate templates. Use our Templates to add a unique zing and appeal to your presentation and meetings. All the slides are easy to edit and you can use them even for advertisement purposes.
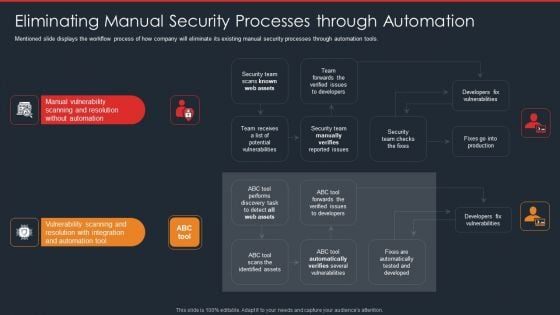
Data Safety Initiatives Eliminating Manual Security Processes Through Automation Topics PDF
Mentioned slide displays the workflow process of how company will eliminate its existing manual security processes through automation tools. This is a data safety initiatives eliminating manual security processes through automation topics pdf template with various stages. Focus and dispense information on four stages using this creative set, that comes with editable features. It contains large content boxes to add your information on topics like manual vulnerability, scanning and resolution, vulnerability scanning, team. You can also showcase facts, figures, and other relevant content using this PPT layout. Grab it now.
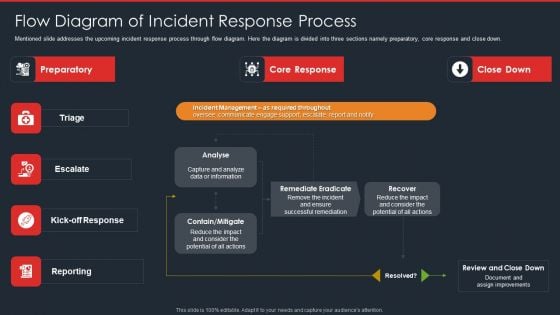
Data Safety Initiatives Flow Diagram Of Incident Response Process Designs PDF
Mentioned slide addresses the upcoming incident response process through flow diagram. Here the diagram is divided into three sections namely preparatory, core response and close down. Presenting data safety initiatives flow diagram of incident response process designs pdf to provide visual cues and insights. Share and navigate important information on seven stages that need your due attention. This template can be used to pitch topics like preparatory, core response, close down, escalate, kick off response, analyse. In addtion, this PPT design contains high resolution images, graphics, etc, that are easily editable and available for immediate download.
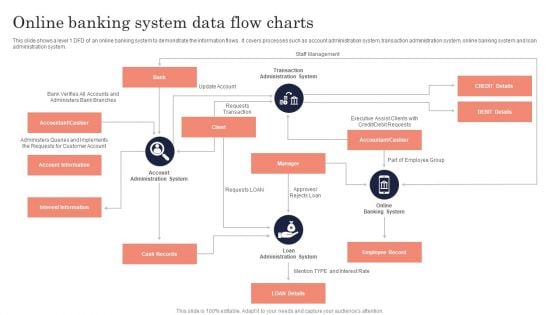
Online Banking System Data Flow Charts Ppt PowerPoint Presentation File Layout Ideas PDF
this slide shows a level 1 dfd of an online banking system to demonstrate the information flows. it covers processes such as account administration system, transaction administration system, online banking system and loan administration system. Persuade your audience using this Online Banking System Data Flow Charts Ppt PowerPoint Presentation File Layout Ideas PDF. This PPT design covers four stages, thus making it a great tool to use. It also caters to a variety of topics including Transaction Administration System, Accountant, Cashier, Employee Record. Download this PPT design now to present a convincing pitch that not only emphasizes the topic but also showcases your presentation skills.
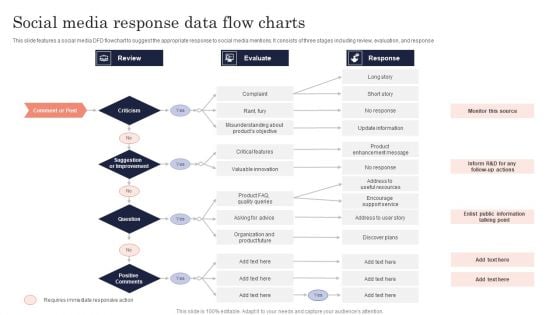
Social Media Response Data Flow Charts Ppt PowerPoint Presentation Gallery Background Designs PDF
This slide features a social media dfd flowchart to suggest the appropriate response to social media mentions. it consists of three stages including review, evaluation, and response. Persuade your audience using this Social Media Response Data Flow Charts Ppt PowerPoint Presentation Gallery Background Designs PDF. This PPT design covers three stages, thus making it a great tool to use. It also caters to a variety of topics including Review, Evaluate, Response, Comment Or Post. Download this PPT design now to present a convincing pitch that not only emphasizes the topic but also showcases your presentation skills.
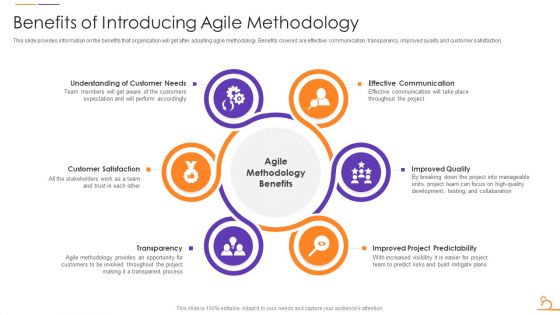
Agile Techniques For Data Migration Benefits Of Introducing Agile Methodology Infographics PDF
This slide provides information on the benefits that organization will get after adopting agile methodology. Benefits covered are effective communication, transparency, improved quality and customer satisfaction. This is a Agile Techniques For Data Migration Benefits Of Introducing Agile Methodology Infographics PDF template with various stages. Focus and dispense information on six stages using this creative set, that comes with editable features. It contains large content boxes to add your information on topics like Understanding Customer Needs, Customer Satisfaction, Transparency, Improved Project Predictability, Improved Quality, Effective Communication. You can also showcase facts, figures, and other relevant content using this PPT layout. Grab it now.
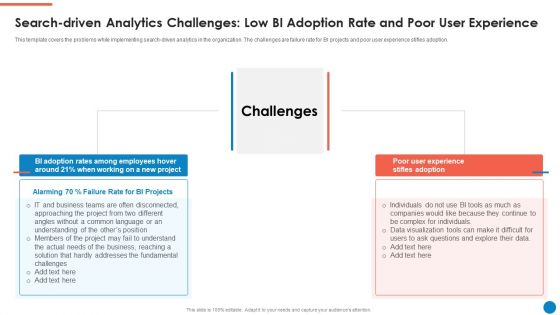
Data And Analytics Playbook Search Driven Analytics Challenges Low Bi Adoption Rate Brochure PDF
This template covers the problems while implementing search-driven analytics in the organization. The challenges are failure rate for BI projects and poor user experience stifles adoption. This is a Data And Analytics Playbook Search Driven Analytics Challenges Low Bi Adoption Rate Brochure PDF template with various stages. Focus and dispense information on two stages using this creative set, that comes with editable features. It contains large content boxes to add your information on topics like Challenges, Poor User Experience, Stifles Adoption, Employees, Project. You can also showcase facts, figures, and other relevant content using this PPT layout. Grab it now.
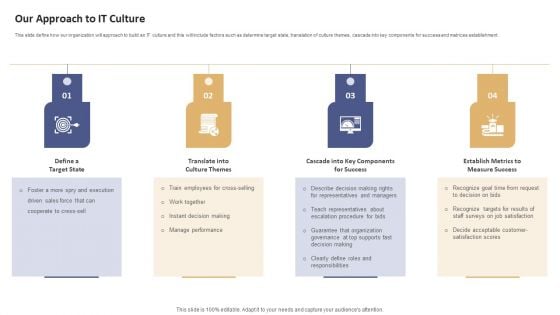
Data Processing Services Delivery Our Approach To IT Culture Ppt Infographic Template Professional PDF
This slide define how our organization will approach to build an IT culture and this will include factors such as determine target state, translation of culture themes, cascade into key components for success and matrices establishment. Presenting Data Processing Services Delivery Our Approach To IT Culture Ppt Infographic Template Professional PDF to provide visual cues and insights. Share and navigate important information on four stages that need your due attention. This template can be used to pitch topics like Define Target State, Translate Culture Themes, Cascade Key Components. In addtion, this PPT design contains high resolution images, graphics, etc, that are easily editable and available for immediate download.
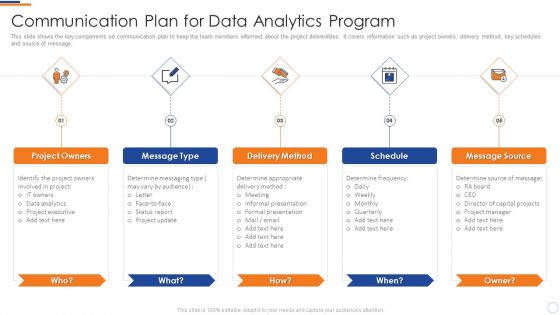
Communication Plan For Program Business Intelligence And Big Data Analytics Slides PDF
This slide shows the key components od communication plan to keep the team members informed about the project deliverables. It covers information such as project owners, delivery method, key schedules and source of message.Presenting communication plan for program business intelligence and big data analytics slides pdf to provide visual cues and insights. Share and navigate important information on five stages that need your due attention. This template can be used to pitch topics like project owners, message type, delivery method, schedule, message source. In addtion, this PPT design contains high resolution images, graphics, etc, that are easily editable and available for immediate download.
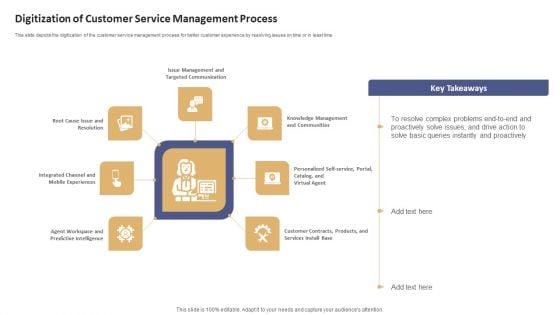
Data Processing Services Delivery Digitization Of Customer Service Management Process Microsoft PDF
This slide depicts the digitization of the customer service management process for better customer experience by resolving issues on time or in least time. Presenting Data Processing Services Delivery Digitization Of Customer Service Management Process Microsoft PDF to provide visual cues and insights. Share and navigate important information on seven stages that need your due attention. This template can be used to pitch topics like Knowledge Management, Virtual Agent, Products, And Services. In addtion, this PPT design contains high resolution images, graphics, etc, that are easily editable and available for immediate download.
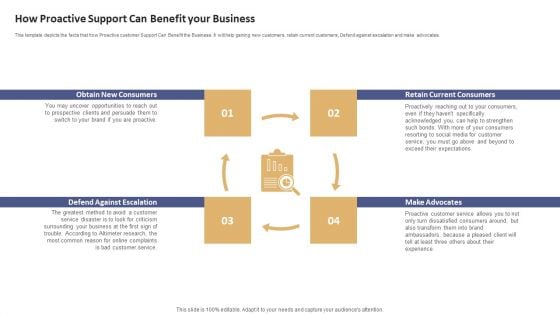
Data Processing Services Delivery How Proactive Support Can Benefit Your Business Download PDF
This template depicts the facts that how Proactive customer Support Can Benefit the Business. It will help gaining new customers, retain current customers, Defend against escalation and make advocates. Presenting Data Processing Services Delivery How Proactive Support Can Benefit Your Business Download PDF to provide visual cues and insights. Share and navigate important information on four stages that need your due attention. This template can be used to pitch topics like Obtain New Consumers, Defend Against Escalation, Make Advocates, Retain Current Consumers. In addtion, this PPT design contains high resolution images, graphics, etc, that are easily editable and available for immediate download.
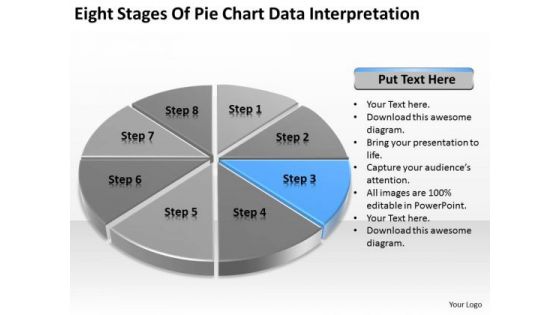
Eight Stages Of Pie Chart Data Interpretation Business Plan PowerPoint Slides
We present our eight stages of pie chart data interpretation business plan PowerPoint Slides.Use our Competition PowerPoint Templates because Our PowerPoint Templates and Slides will let you Clearly mark the path for others to follow. Download and present our Marketing PowerPoint Templates because Our PowerPoint Templates and Slides will weave a web of your great ideas. They are gauranteed to attract even the most critical of your colleagues. Present our Arrows PowerPoint Templates because Our PowerPoint Templates and Slides will let you Hit the target. Go the full distance with ease and elan. Use our Circle Charts PowerPoint Templates because You have gained great respect for your brilliant ideas. Use our PowerPoint Templates and Slides to strengthen and enhance your reputation. Download our Business PowerPoint Templates because You are an avid believer in ethical practices. Highlight the benefits that accrue with our PowerPoint Templates and Slides.Use these PowerPoint slides for presentations relating to chart, graph, pie, 3d, diagram, graphic, icon, control, business, data, profit, market, sales, display, corporate, concept, render, success, presentation, finance, report, marketing, accounting, management, piece, strategy, money, growth, company, competition, progress, account, sheet, part, information, investment, improvement, banking, index, financial, reflect, results, performance, exchange. The prominent colors used in the PowerPoint template are Blue, Black, Gray. Great presentations happen with our Eight Stages Of Pie Chart Data Interpretation Business Plan PowerPoint Slides. Try us out and see what a difference our templates make.
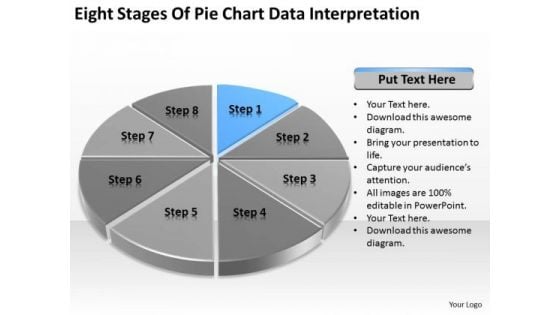
Eight Stages Of Pie Chart Data Interpretation Business Plan PowerPoint Templates
We present our eight stages of pie chart data interpretation business plan PowerPoint templates.Download and present our Competition PowerPoint Templates because Our PowerPoint Templates and Slides will embellish your thoughts. See them provide the desired motivation to your team. Download and present our Marketing PowerPoint Templates because You should Press the right buttons with our PowerPoint Templates and Slides. They will take your ideas down the perfect channel. Download our Arrows PowerPoint Templates because Your ideas provide food for thought. Our PowerPoint Templates and Slides will help you create a dish to tickle the most discerning palate. Use our Circle Charts PowerPoint Templates because You can Raise a toast with our PowerPoint Templates and Slides. Spread good cheer amongst your audience. Download and present our Business PowerPoint Templates because Our PowerPoint Templates and Slides will let your ideas bloom. Create a bed of roses for your audience.Use these PowerPoint slides for presentations relating to chart, graph, pie, 3d, diagram, graphic, icon, control, business, data, profit, market, sales, display, corporate, concept, render, success, presentation, finance, report, marketing, accounting, management, piece, strategy, money, growth, company, competition, progress, account, sheet, part, information, investment, improvement, banking, index, financial, reflect, results, performance, exchange. The prominent colors used in the PowerPoint template are Blue, Black, Gray. Our Eight Stages Of Pie Chart Data Interpretation Business Plan PowerPoint Templates capture the attention of your audience. With our money back guarantee you have nothing to lose.
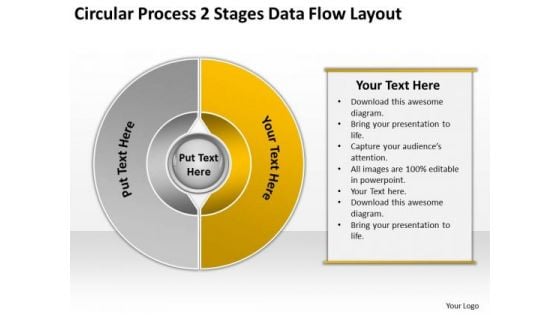
Process 2 Stages Data Flow Layout Professional Business Plan PowerPoint Slides
We present our process 2 stages data flow layout professional business plan PowerPoint Slides.Use our Business PowerPoint Templates because It can Leverage your style with our PowerPoint Templates and Slides. Charm your audience with your ability. Present our Circle Charts PowerPoint Templates because Our PowerPoint Templates and Slides will help you be quick off the draw. Just enter your specific text and see your points hit home. Download our Flow Charts PowerPoint Templates because Our PowerPoint Templates and Slides team portray an attitude of elegance. Personify this quality by using them regularly. Present our Process and Flows PowerPoint Templates because Our PowerPoint Templates and Slides will generate and maintain the level of interest you desire. They will create the impression you want to imprint on your audience. Present our Shapes PowerPoint Templates because Our PowerPoint Templates and Slides are Clear and concise. Use them and dispel any doubts your team may have.Use these PowerPoint slides for presentations relating to Vector, decoration, form, three-dimensional, glossy, symbol, curve, elements, diagram, circle, graphic, finance, data, shape, colored, abstract, illustration, icon, geometric, shiny, design, symmetrical, clip-art, art, space, image . The prominent colors used in the PowerPoint template are Orange, Gray, White. Disarm your audience with our Process 2 Stages Data Flow Layout Professional Business Plan PowerPoint Slides. You will come out on top.
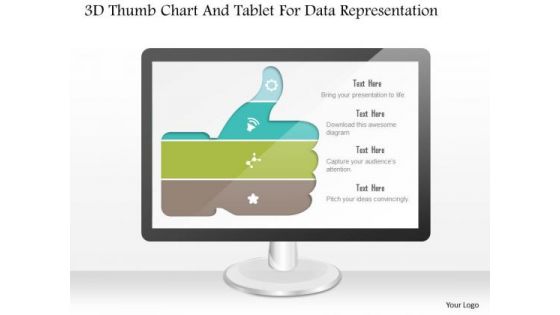
Business Diagram 3d Thumb Chart And Tablet For Data Representation PowerPoint Slide
This business diagram displays graphic of 3d thumb up chart with icons on computer screen. This business slide contains the concept of business data representation. Use this diagram to build professional presentations for your viewers.
Database System PowerPoint Icon Cc
Microsoft PowerPoint Template and Background with database system for reports and data analysis Underline your erudition with our Database System PowerPoint Icon Cc. They will project your considerable expertise.
Database System PowerPoint Icon S
Microsoft PowerPoint Template and Background with database system for reports and data analysis Never fail to impress with our Database System PowerPoint Icon S. You will be at the top of your game.

1 Computer Behind A Firewall With Outgoing Data And Network Switch Ppt Slides
This image slide displays computer behind a firewall with outgoing data and network switch. This image slide has been crafted with graphic of computer, cloud, server and firewall icon. This image slide depicts cloud computing security. You may change size, color and orientation of any icon to your liking. Use this PowerPoint template, in your presentations to explain concepts like cloud computing, technology, networking and security. This image slide will enhance the quality of your presentations.
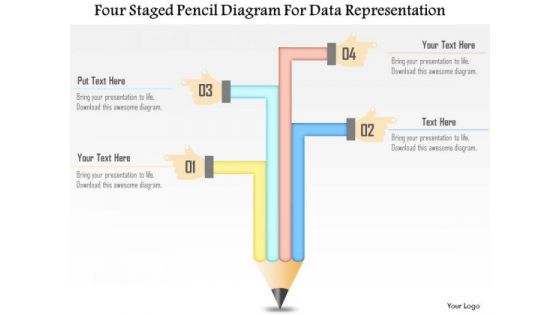
Business Diagram Four Staged Pencil Diagram For Data Representation Presentation Template
This business diagram has been designed with four staged pencil chart. This slide suitable for data representation. You can also use this slide to present four steps of any business process. Use this diagram to present your views in a wonderful manner.
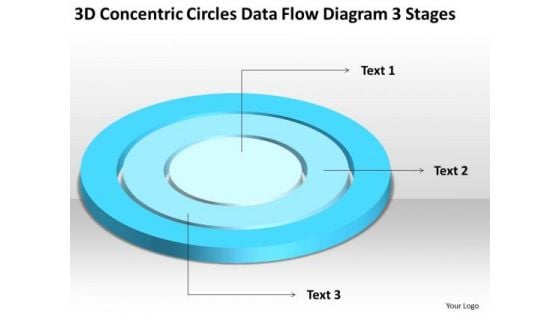
Concentric Circles Data Flow Diagram 3 Stages Business Plan For Non Profit PowerPoint Slides
We present our concentric circles data flow diagram 3 stages business plan for non profit PowerPoint Slides.Present our Circle Charts PowerPoint Templates because Our PowerPoint Templates and Slides team portray an attitude of elegance. Personify this quality by using them regularly. Download our Shapes PowerPoint Templates because You will get more than you ever bargained for. Download our Signs PowerPoint Templates because Timeline crunches are a fact of life. Meet all deadlines using our PowerPoint Templates and Slides. Use our Maketing PowerPoint Templates because you can Add colour to your speech with our PowerPoint Templates and Slides. Your presentation will leave your audience speechless. Use our Metaphors-Visual Concepts PowerPoint Templates because Our PowerPoint Templates and Slides are like the strings of a tennis racquet. Well strung to help you serve aces.Use these PowerPoint slides for presentations relating to diagram, circular, market, bar, advertise, interface, business, concept, vector, sign, success, presentation, symbol, template, circle, brochure, finance, data, description, report, marketing, title, label, abstract, management, graph, four, illustration, icon, pie, chart, strategy, catalog, research, web, design, growth, text, professional, banner, account, profit, information, background, info-graphic, analyze, financial, button, goals. The prominent colors used in the PowerPoint template are Blue, Blue light, White. Our Concentric Circles Data Flow Diagram 3 Stages Business Plan For Non Profit PowerPoint Slides are evidently advantageous. The balance will tilt in your favour.
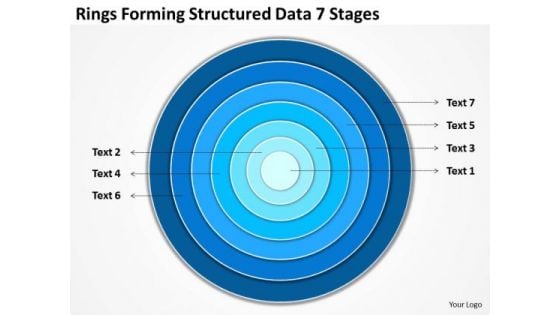
Rings Forming Structured Data 7 Stages Step By Business Plan Template PowerPoint Slides
We present our rings forming structured data 7 stages step by business plan template PowerPoint Slides.Use our Circle Charts PowerPoint Templates because They will Put your wonderful verbal artistry on display. Our PowerPoint Templates and Slides will provide you the necessary glam and glitter. Present our Shapes PowerPoint Templates because It will Give impetus to the hopes of your colleagues. Our PowerPoint Templates and Slides will aid you in winning their trust. Download and present our Signs PowerPoint Templates because Our PowerPoint Templates and Slides will let you Clearly mark the path for others to follow. Download and present our Maketing PowerPoint Templates because It will mark the footprints of your journey. Illustrate how they will lead you to your desired destination. Use our Metaphors-Visual Concepts PowerPoint Templates because Our PowerPoint Templates and Slides has conjured up a web of all you need with the help of our great team. Use them to string together your glistening ideas.Use these PowerPoint slides for presentations relating to diagram, circular, market, bar, advertise, interface, business, concept, vector, sign, success, presentation, symbol, template, circle, brochure, finance, data, description, report, marketing, title, label, abstract, management, graph, four, illustration, icon, pie, chart, strategy, catalog, research, web, design, growth, text, professional, banner, account, profit, information, background, info-graphic, analyze, financial, button, goals. The prominent colors used in the PowerPoint template are Blue, Blue light, White. Face your audience with our Rings Forming Structured Data 7 Stages Step By Business Plan Template PowerPoint Slides. You will come out on top.

Business Diagram 3d Pie Chart With Arrows For Data Representation PowerPoint Slide
This business slide displays pie chart with timeline graphics. This diagram has been designed with graphic of with four arrows representing yearly data. Use this diagram, in your presentations to display process steps, stages, for business management.
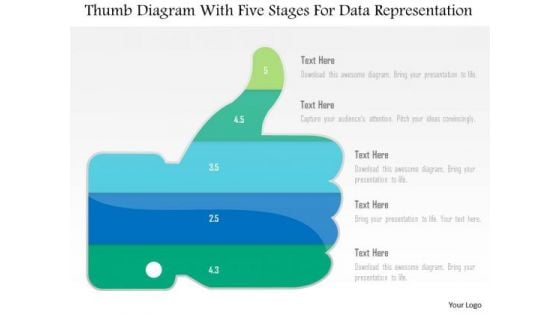
Business Diagram Thumb Diagram With Five Stages For Data Representation PowerPoint Slide
This business diagram displays thumb up with five stages. This diagram contains text boxes for data representation. Use this diagram to display business process workflows in any presentations.
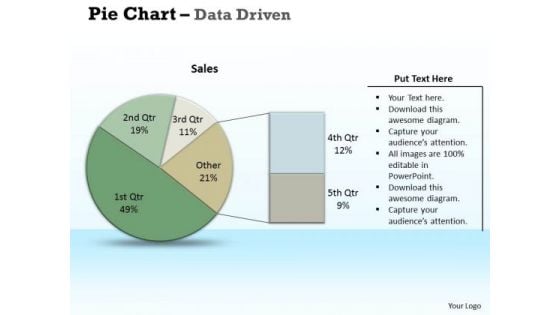
Examples Of Data Analysis Market Driven Pie Chart Research PowerPoint Slides Templates
Chalk It Up With Our examples of data analysis market driven pie chart research powerpoint slides Templates . Add To The Credits Of Your Ideas.

Business Diagram Data Driven Pie Chart Inside The Magnifier PowerPoint Slide
This business slide displays 3d colorful pie graph with magnifier. This diagram is a data visualization tool that gives you a simple way to present statistical information. This slide helps your audience examine and interpret the data you present.
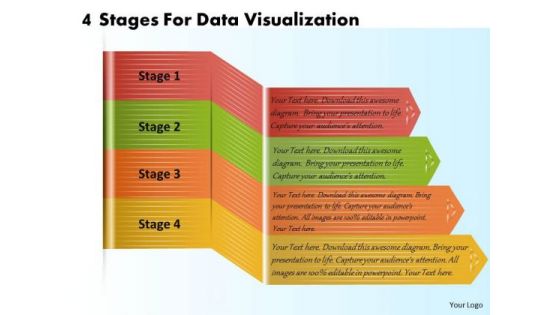
Business Plan And Strategy 4 Stages For Data Visualization Strategic Planning Template Ppt Slide
Your Listeners Will Never Doodle. Our business plan and strategy 4 stages for data visualization strategic planning template ppt slide Powerpoint Templates Will Hold Their Concentration. Do The One Thing With Your Thoughts. Uphold Custom With Our Process and Flows Powerpoint Templates.
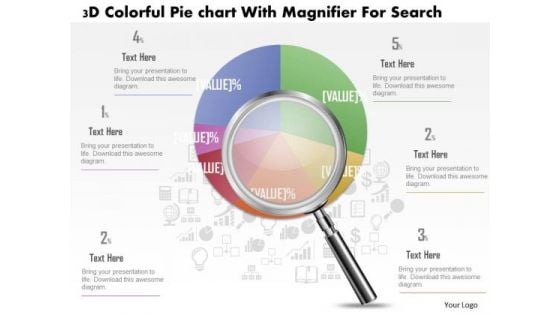
Business Diagram 3d Colorful Pie Graph With Magnifier Data Search PowerPoint Slide
This business slide displays 3d colorful pie graph with magnifier. This diagram is a data visualization tool that gives you a simple way to present statistical information. This slide helps your audience examine and interpret the data you present.
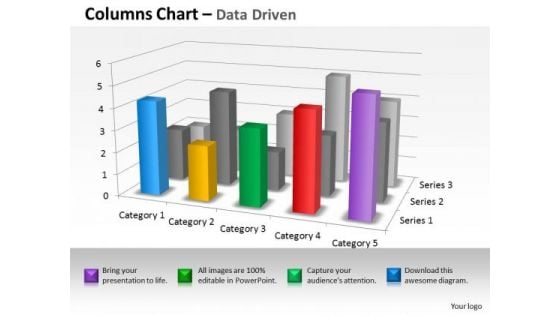
Quantitative Data Analysis 3d Interpretation Of Statistical Quality Control PowerPoint Templates
Land The Idea With Our quantitative data analysis 3d interpretation of statistical quality control Powerpoint Templates . Help It Grow With Your Thoughts.
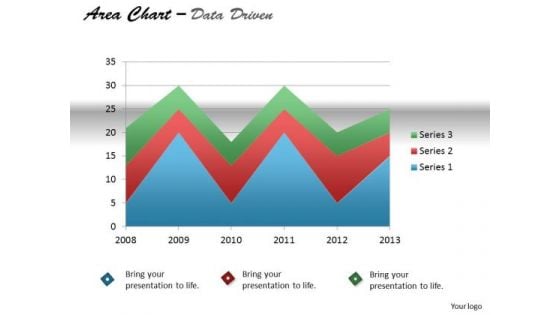
Quantitative Data Analysis Driven Display Series With Area Chart PowerPoint Slides Templates
Our quantitative data analysis driven display series with area chart powerpoint slides Templates Enjoy Drama. They Provide Entertaining Backdrops.
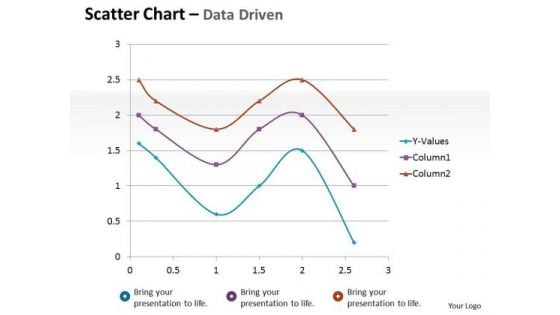
Financial Data Analysis Driven Scatter Chart Mathematical Diagram PowerPoint Slides Templates
Dominate Proceedings With Your Ideas. Our financial data analysis driven scatter chart mathematical diagram powerpoint slides Templates Will Empower Your Thoughts.
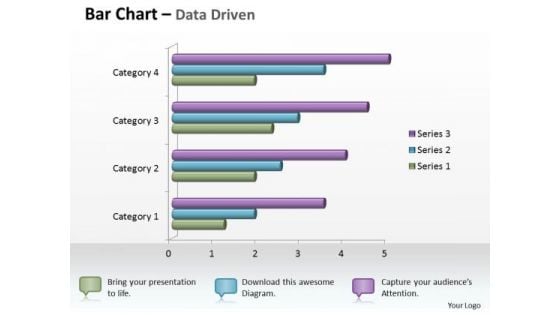
Data Analysis In Excel 3d Bar Chart For Business Statistics PowerPoint Templates
Knock On The Door To Success With Our data analysis in excel 3d bar chart for business statistics Powerpoint Templates . Be Assured Of Gaining Entry.
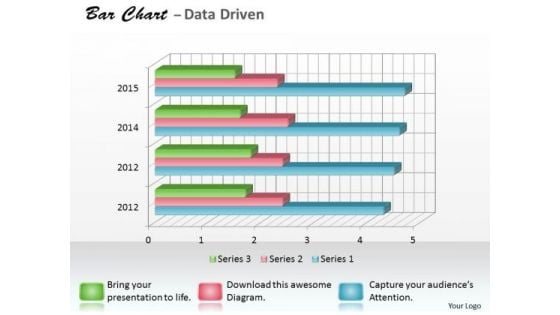
Data Analysis Programs 3d Bar Chart For Research In Statistics PowerPoint Templates
Draw It Out On Our data analysis programs 3d bar chart for research in statistics Powerpoint Templates . Provide Inspiration To Your Colleagues.
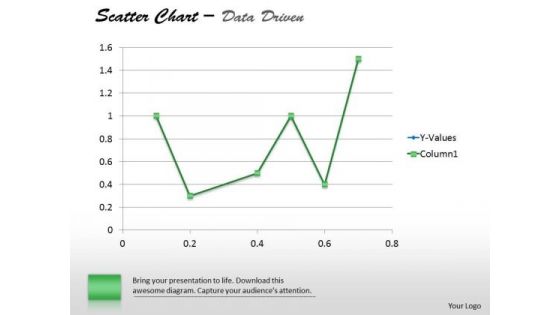
Financial Data Analysis Driven Demonstrate Statistics With Scatter Chart PowerPoint Slides Templates
Establish The Dominance Of Your Ideas. Our financial data analysis driven demonstrate statistics with scatter chart powerpoint slides Templates Will Put Them On Top.
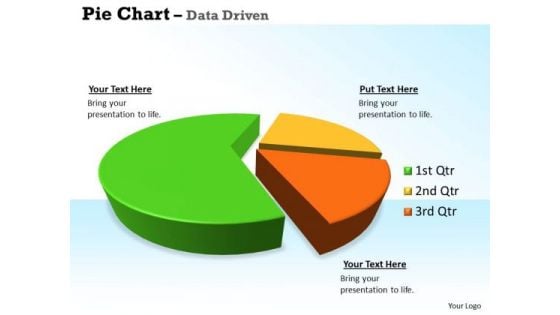
Quantitative Data Analysis 3d Pie Chart For Business Statistics PowerPoint Templates
Our quantitative data analysis 3d pie chart for business statistics Powerpoint Templates Allow You To Do It With Ease. Just Like Picking The Low Hanging Fruit.
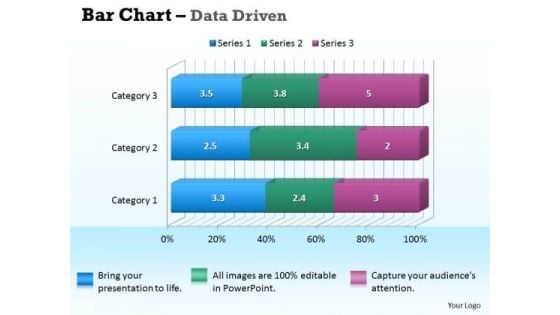
Data Analysis In Excel 3d Bar Chart For Business Information PowerPoint Templates
Our data analysis in excel 3d bar chart for business information Powerpoint Templates Deliver At Your Doorstep. Let Them In For A Wonderful Experience.
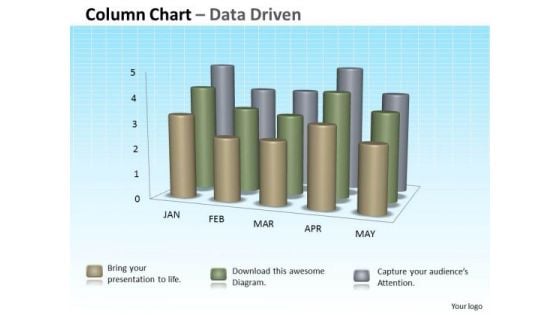
Data Analysis In Excel 3d Column Chart For Sets Of Information PowerPoint Templates
Double The Impact With Our data analysis in excel 3d column chart for sets of information Powerpoint Templates . Your Thoughts Will Have An Imposing Effect.
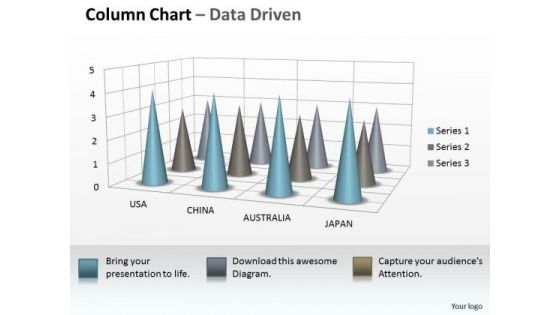
Data Analysis On Excel 3d Chart To Incorporate Business Information PowerPoint Templates
Our data analysis on excel 3d chart to incorporate business information Powerpoint Templates Allow You To Do It With Ease. Just Like Picking The Low Hanging Fruit.
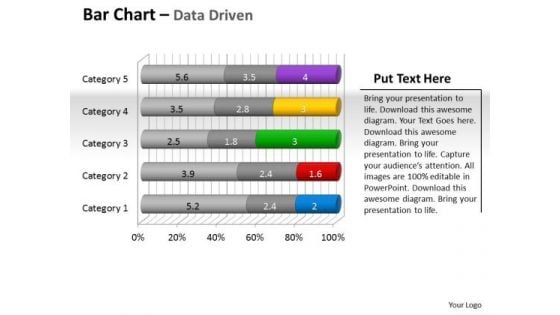
Data Analysis Programs 3d Bar Chart To Put Information PowerPoint Templates
Draw Up Your Agenda On Our data analysis programs 3d bar chart to put information Powerpoint Templates . Coax Your Audience Into Acceptance.
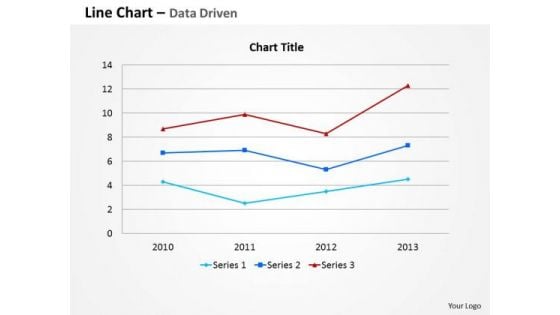
Data Analysis Template Driven Line Chart For Business Information PowerPoint Slides Templates
Your Thoughts Are Dripping With Wisdom. Lace It With Our data analysis template driven line chart for business information powerpoint slides Templates .
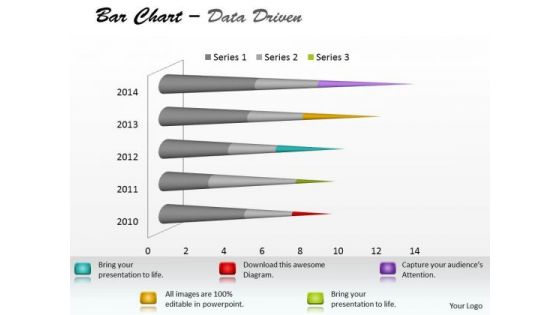
Microsoft Excel Data Analysis Bar Chart To Communicate Information PowerPoint Templates
With Our microsoft excel data analysis bar chart to communicate information Powerpoint Templates You Will Be Doubly Sure. They Possess That Stamp Of Authority.

Data Analysis Excel 3d Pie Chart For Marketing Process PowerPoint Templates
Our data analysis excel 3d pie chart for marketing process Powerpoint Templates Team Are A Dogged Lot. They Keep At It Till They Get It Right.
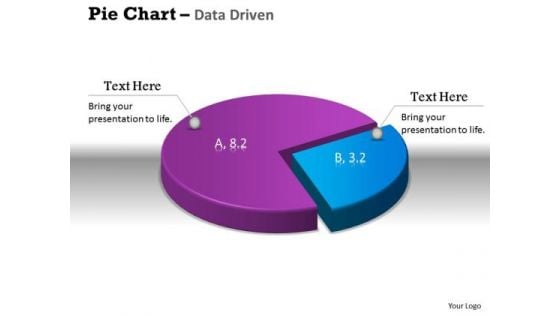
Data Analysis Excel 3d Pie Chart Shows Relative Size Of PowerPoint Templates
Get The Doers Into Action. Activate Them With Our data analysis excel 3d pie chart shows relative size of Powerpoint Templates.
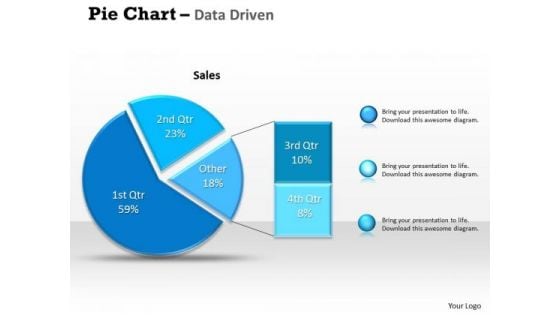
Data Analysis Excel Driven Percentage Breakdown Pie Chart PowerPoint Slides Templates
Be A Donor Of Great Ideas. Display Your Charity On Our data analysis excel driven percentage breakdown pie chart powerpoint slides Templates.
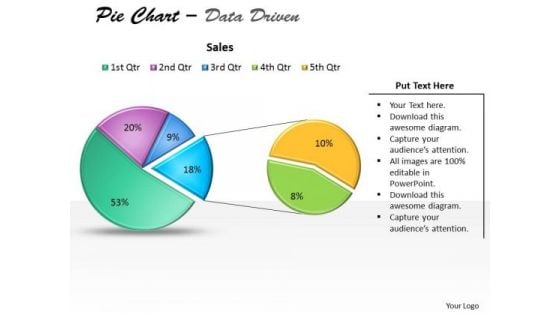
Data Analysis Excel Driven Pie Chart For Business Stratregy PowerPoint Slides Templates
Open Up Doors That Lead To Success. Our data analysis excel driven pie chart for business stratregy powerpoint slides Templates Provide The Handles.

Data Analysis Excel Driven Pie Chart For Easy Comparison PowerPoint Slides Templates
Our data analysis excel driven pie chart for easy comparison powerpoint slides Templates Abhor Doodling. They Never Let The Interest Flag.
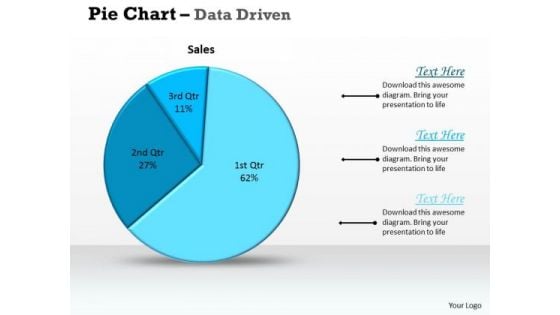
Data Analysis Excel Driven Pie Chart For Sales Process PowerPoint Slides Templates
Deliver The Right Dose With Our data analysis excel driven pie chart for sales process powerpoint slides Templates . Your Ideas Will Get The Correct Illumination.
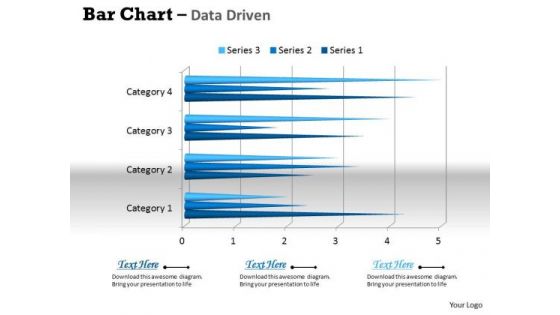
Data Analysis In Excel 3d Bar Chart For Business Trends PowerPoint Templates
Connect The Dots With Our data analysis in excel 3d bar chart for business trends Powerpoint Templates . Watch The Whole Picture Clearly Emerge.
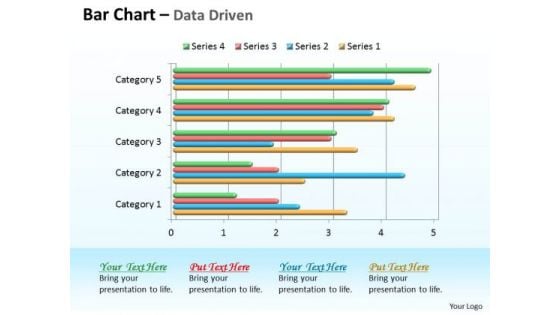
Data Analysis In Excel 3d Bar Chart For Comparison Of Time Series PowerPoint Templates
Double Your Chances With Our data analysis in excel 3d bar chart for comparison of time series Powerpoint Templates . The Value Of Your Thoughts Will Increase Two-Fold.
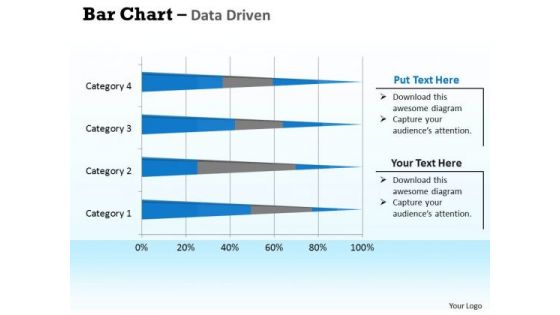
Data Analysis In Excel 3d Bar Chart For Interpretation PowerPoint Templates
Double Up Our data analysis in excel 3d bar chart for interpretation Powerpoint Templates With Your Thoughts. They Will Make An Awesome Pair.
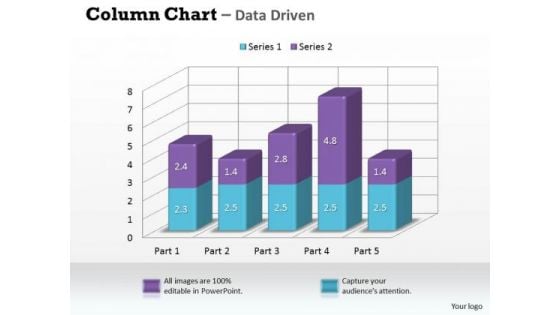
Data Analysis In Excel 3d Column Chart For Market Surveys PowerPoint Templates
Our data analysis in excel 3d column chart for market surveys Powerpoint Templates Leave No One In Doubt. Provide A Certainty To Your Views.
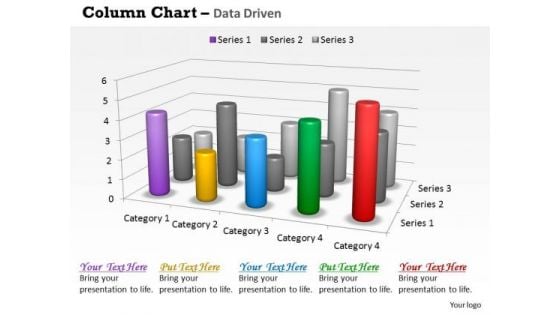
Data Analysis In Excel 3d Survey For Sales Chart PowerPoint Templates
Good Camaraderie Is A Key To Teamwork. Our data analysis in excel 3d survey for sales chart Powerpoint Templates Can Be A Cementing Force.
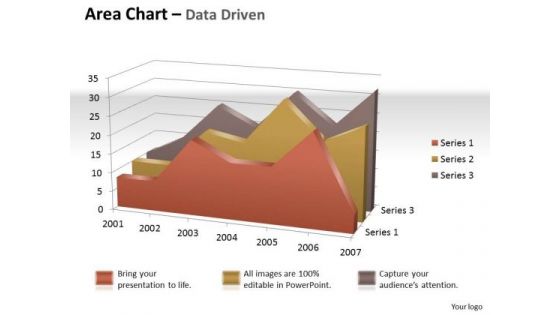
Data Analysis In Excel 3d Visual Display Of Area Chart PowerPoint Templates
Brace Yourself, Arm Your Thoughts. Prepare For The Hustle With Our data analysis in excel 3d visual display of area chart Powerpoint Templates .
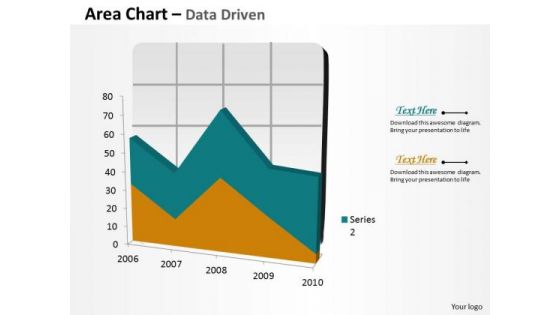
Data Analysis In Excel Area Chart For Business Process PowerPoint Templates
Your Grasp Of Economics Is Well Known. Help Your Audience Comprehend Issues With Our data analysis in excel area chart for business process Powerpoint Templates .
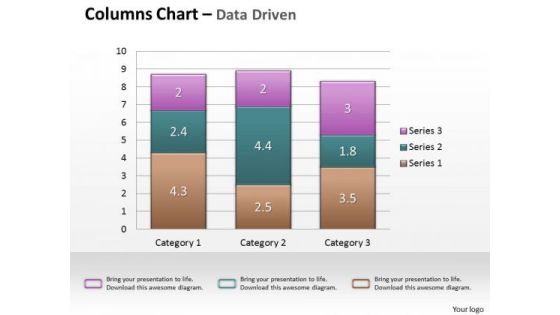
Data Analysis In Excel Column Chart For Business Analytics PowerPoint Templates
Our data analysis in excel column chart for business analytics Powerpoint Templates Heighten Concentration. Your Audience Will Be On The Edge.
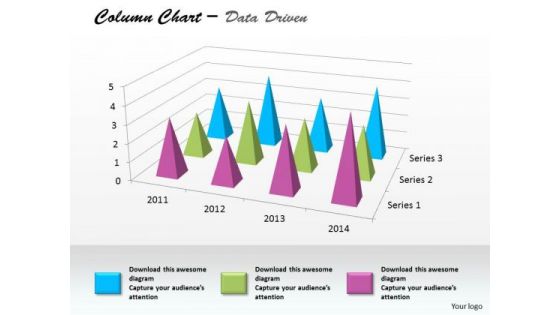
Data Analysis In Excel Column Chart For Business Project PowerPoint Templates
Edit Your Work With Our data analysis in excel column chart for business project Powerpoint Templates . They Will Help You Give The Final Form.
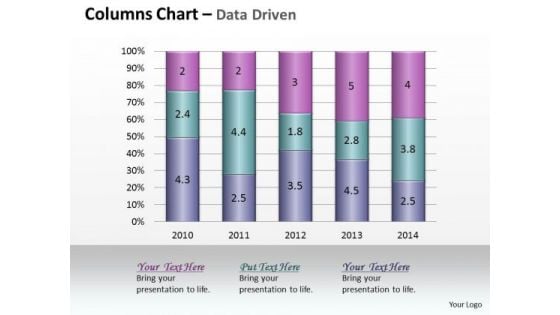
Data Analysis In Excel Column Chart Of Various Fields PowerPoint Templates
Land The Idea With Our data analysis in excel column chart of various fields Powerpoint Templates . Help It Grow With Your Thoughts.
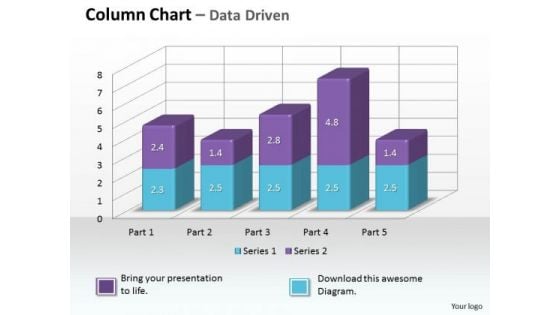
Data Analysis On Excel 3d Chart To Monitor Business Process PowerPoint Templates
Make Some Dough With Our data analysis on excel 3d chart to monitor business process Powerpoint Templates . Your Assets Will Rise Significantly.
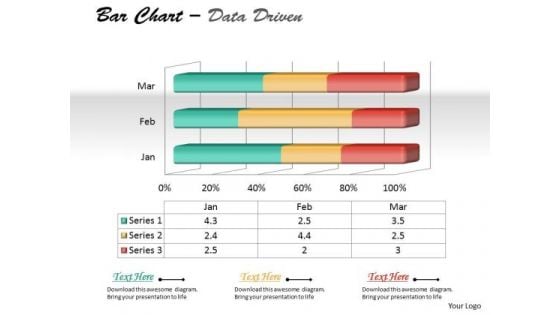
Data Analysis On Excel 3d Chart To Represent Quantitative Differences PowerPoint Templates
Draft It Out On Our data analysis on excel 3d chart to represent quantitative differences Powerpoint Templates . Give The Final Touches With Your Ideas.
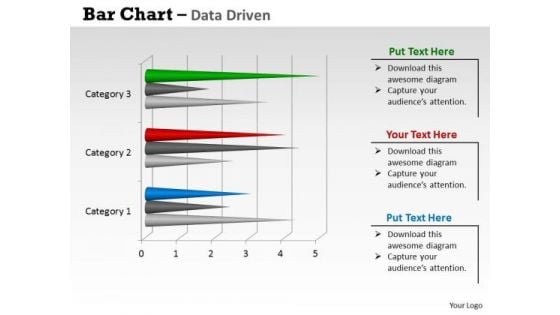
Data Analysis On Excel 3d Chart With Sets Of PowerPoint Templates
Reduce The Drag With Our data analysis on excel 3d chart with sets of Powerpoint Templates . Give More Lift To Your Thoughts.
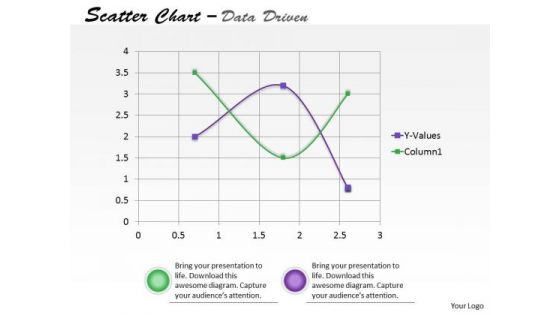
Data Analysis On Excel Driven Scatter Chart To Predict Future Movements PowerPoint Slides Templates
Our data analysis on excel driven scatter chart to predict future movements powerpoint slides Templates Enjoy Drama. They Provide Entertaining Backdrops.
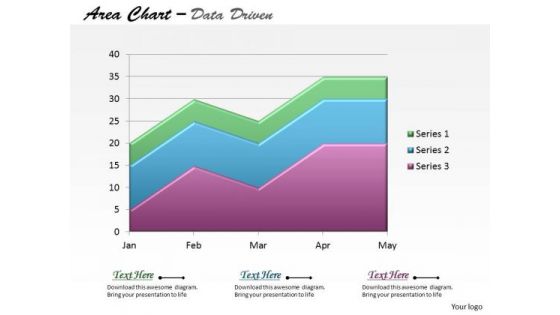
Data Analysis On Excel Driven Stacked Area Chart PowerPoint Slides Templates
Be The Dramatist With Our data analysis on excel driven stacked area chart powerpoint slides Templates . Script Out The Play Of Words.
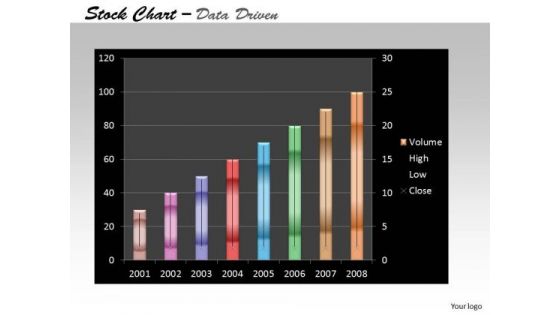
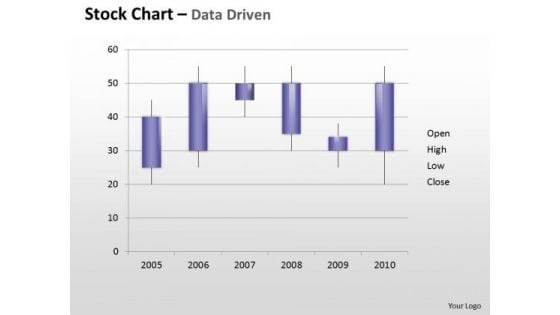
Data Analysis On Excel Driven Stock Chart For Business Growth PowerPoint Slides Templates
Add Some Dramatization To Your Thoughts. Our data analysis on excel driven stock chart for business growth powerpoint slides Templates Make Useful Props.
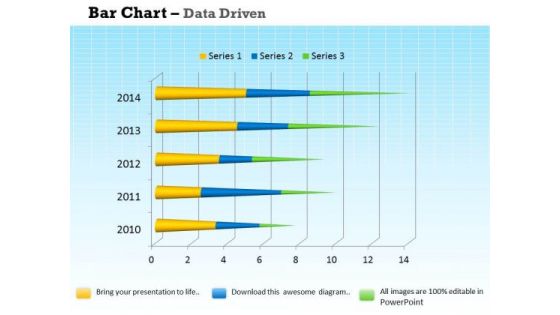
Data Analysis Programs 3d Bar Chart For Market Surveys PowerPoint Templates
Draw On The Experience Of Our data analysis programs 3d bar chart for market surveys Powerpoint Templates . They Imbibe From Past Masters.
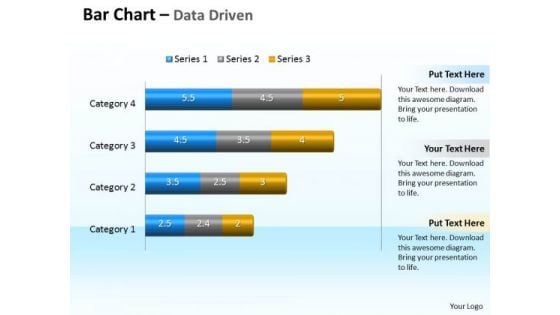
Data Analysis Programs 3d Bar Chart To Compare Categories PowerPoint Templates
Discover Decisive Moments With Our data analysis programs 3d bar chart to compare categories Powerpoint Templates . They Help Make That Crucial Difference.
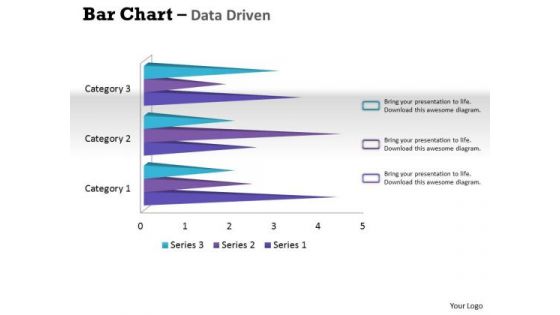
Data Analysis Techniques 3d Bar Chart For Financial Solutions PowerPoint Templates
Make Your Dreams A Reality With Our data analysis techniques 3d bar chart for financial solutions Powerpoint Templates . Your Ideas Will Begin To Take Shape.

Data Analysis Template Driven Express Business Facts Pie Chart PowerPoint Slides Templates
Display Your Drive On Our data analysis template driven express business facts pie chart powerpoint slides Templates . Invigorate The Audience With Your Fervor.
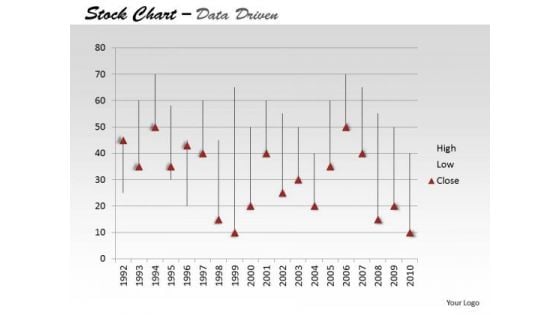
Data Analysis Template Driven Ineract With Stock Chart PowerPoint Slides Templates
Drive Your Passion With Our data analysis template driven ineract with stock chart powerpoint slides Templates . Steer Yourself To Achieve Your Aims.
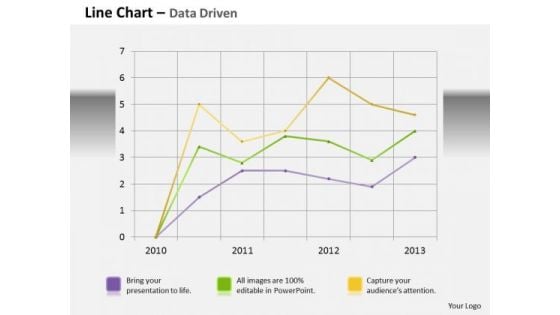
Data Analysis Template Driven Line Chart Business Graph PowerPoint Slides Templates
Bottle Your Thoughts In Our data analysis template driven line chart business graph powerpoint slides Templates . Pass It Around For Your Audience To Sip.
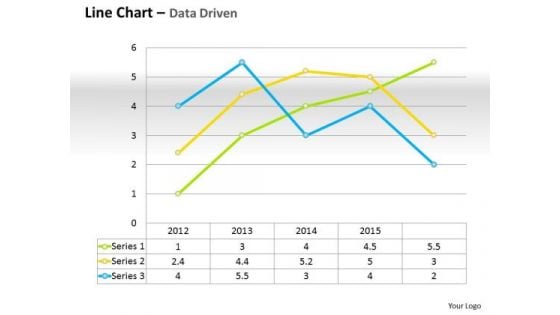
Data Analysis Template Driven Line Chart For Business Performance PowerPoint Slides Templates
Do Not Allow Things To Drift. Ring In Changes With Our data analysis template driven line chart for business performance powerpoint slides Templates .
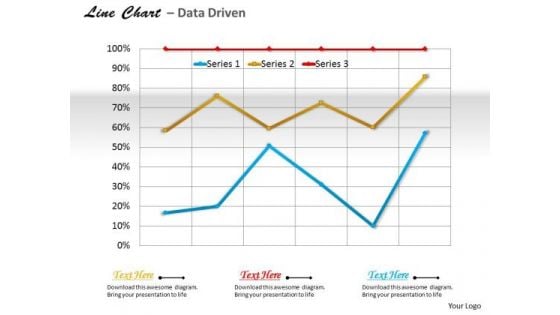
Data Analysis Template Driven Line Chart For Business Trends PowerPoint Slides Templates
Use Our data analysis template driven line chart for business trends powerpoint slides Templates As The Bit. Drill Your Thoughts Into Their Minds.
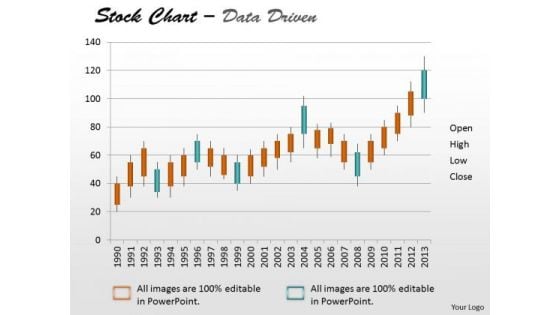
Data Analysis Template Driven Stock Chart For Market Trends PowerPoint Slides Templates
Drive Your Team Along The Road To Success. Take The Wheel With Our data analysis template driven stock chart for market trends powerpoint slides Templates .
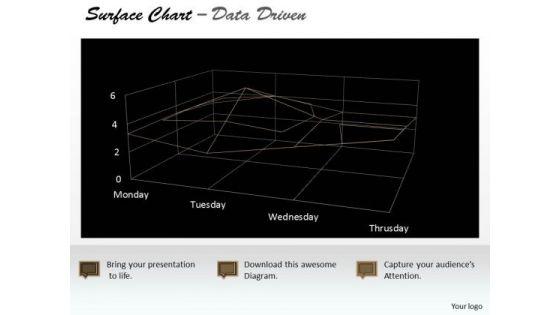
Data Analysis Template Driven Surface Chart Indicating Areas PowerPoint Slides Templates
Highlight Your Drive With Our data analysis template driven surface chart indicating areas powerpoint slides Templates . Prove The Fact That You Have Control.
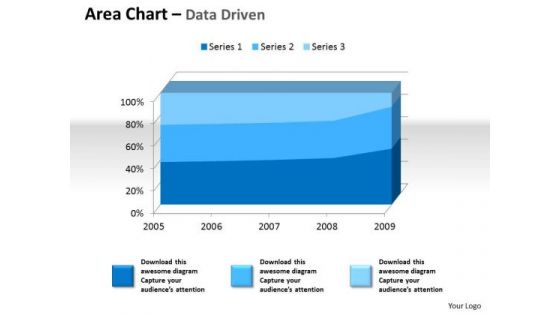
Examples Of Data Analysis Market 3d Area Chart For Quantiative PowerPoint Templates
Drum It Up With Our examples of data analysis market 3d area chart for quantiative Powerpoint Templates . Your Thoughts Will Raise The Tempo.
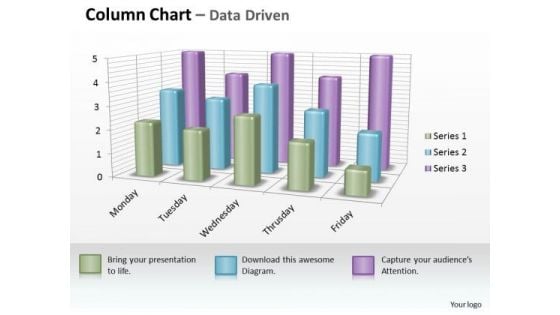
Examples Of Data Analysis Market 3d Business Inspection Procedure Chart PowerPoint Templates
However Dry Your Topic Maybe. Make It Catchy With Our examples of data analysis market 3d business inspection procedure chart Powerpoint Templates .
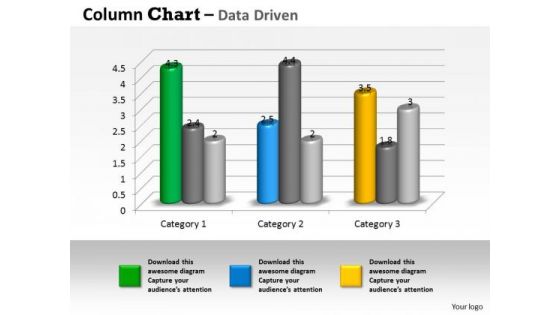
Examples Of Data Analysis Market 3d Business Trend Series Chart PowerPoint Templates
Duct It Through With Our examples of data analysis market 3d business trend series chart Powerpoint Templates . Your Ideas Will Reach Into Their Minds Intact.
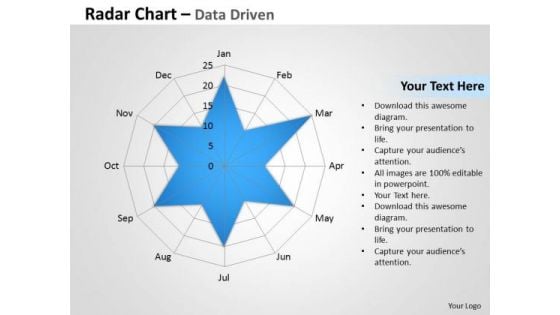
Examples Of Data Analysis Market Driven Radar Chart To Compare PowerPoint Slides Templates
Rely On Our examples of data analysis market driven radar chart to compare powerpoint slides Templates In Any Duel. They Will Drive Home Your Point.
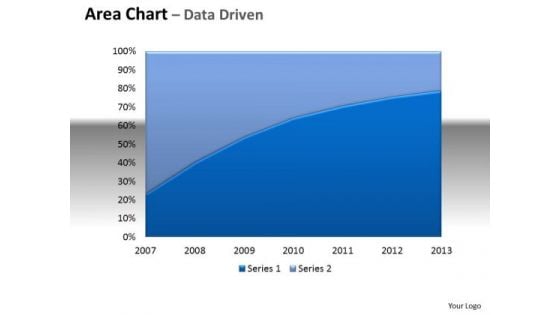
Financial Data Analysis Area Chart With Plotted Line Center PowerPoint Templates
Be The Doer With Our financial data analysis area chart with plotted line center Powerpoint Templates . Put Your Thoughts Into Practice.
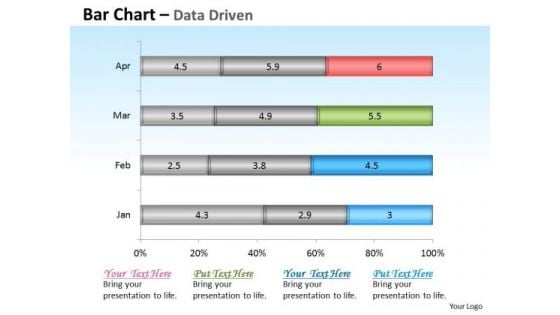
Financial Data Analysis Driven Base Bar Chart Design PowerPoint Slides Templates
Get The Domestics Right With Our financial data analysis driven base bar chart design powerpoint slides Templates . Create The Base For Thoughts To Grow.
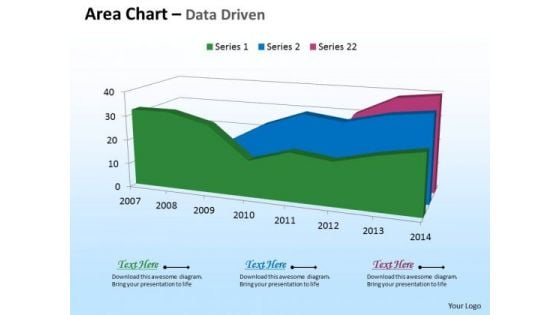
Microsoft Excel Data Analysis 3d Area Chart For Time Based PowerPoint Templates
Deliver The Right Dose With Our microsoft excel data analysis 3d area chart for time based Powerpoint Templates . Your Ideas Will Get The Correct Illumination.
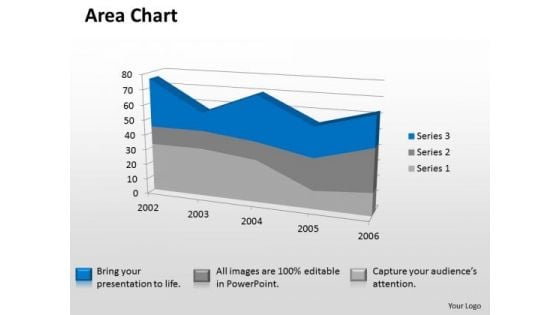
Microsoft Excel Data Analysis 3d Area Chart Showimg Change In Values PowerPoint Templates
Our microsoft excel data analysis 3d area chart showimg change in values Powerpoint Templates Deliver At Your Doorstep. Let Them In For A Wonderful Experience.
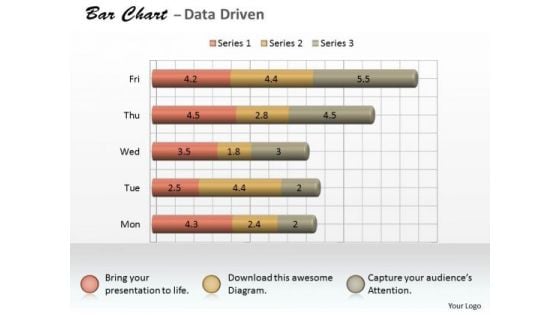
Microsoft Excel Data Analysis 3d Bar Chart As Research Tool PowerPoint Templates
Knock On The Door To Success With Our microsoft excel data analysis 3d bar chart as research tool Powerpoint Templates . Be Assured Of Gaining Entry.
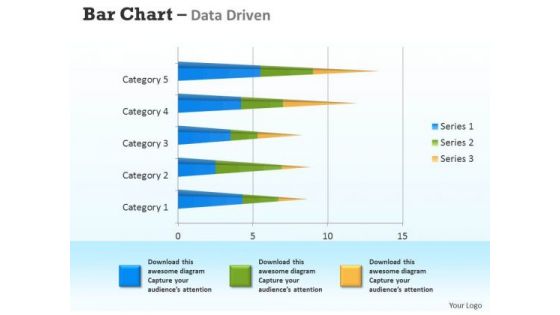
Microsoft Excel Data Analysis 3d Bar Chart For Analyzing Survey PowerPoint Templates
Connect The Dots With Our microsoft excel data analysis 3d bar chart for analyzing survey Powerpoint Templates . Watch The Whole Picture Clearly Emerge.
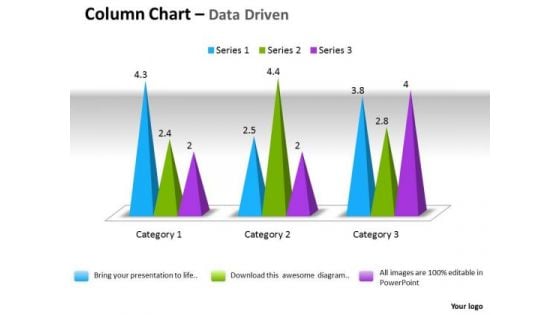
Microsoft Excel Data Analysis 3d Change In Business Process Chart PowerPoint Templates
Double Your Chances With Our microsoft excel data analysis 3d change in business process chart Powerpoint Templates . The Value Of Your Thoughts Will Increase Two-Fold.
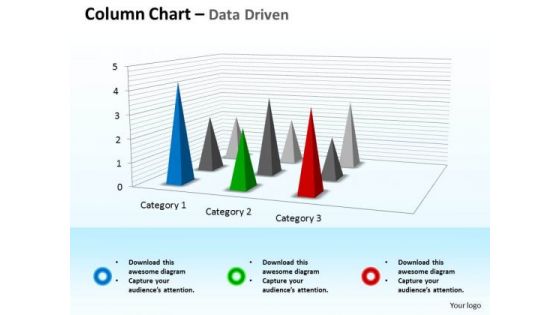
Microsoft Excel Data Analysis 3d Chart For Business Observation PowerPoint Templates
Double Up Our microsoft excel data analysis 3d chart for business observation Powerpoint Templates With Your Thoughts. They Will Make An Awesome Pair.
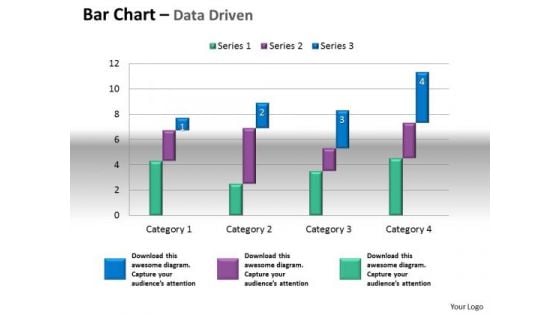
Microsoft Excel Data Analysis Bar Chart To Compare Quantities PowerPoint Templates
Our microsoft excel data analysis bar chart to compare quantities Powerpoint Templates Leave No One In Doubt. Provide A Certainty To Your Views.
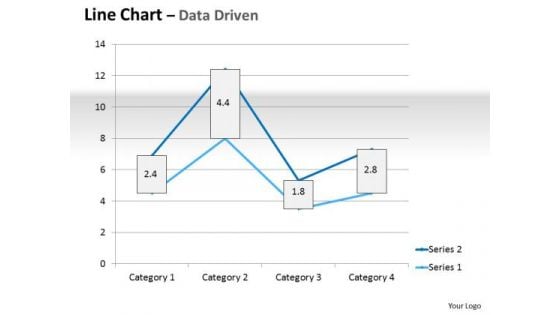
Multivariate Data Analysis Driven Line Chart Market Graph PowerPoint Slides Templates
Plan For All Contingencies With Our multivariate data analysis driven line chart market graph powerpoint slides Templates . Douse The Fire Before It Catches.
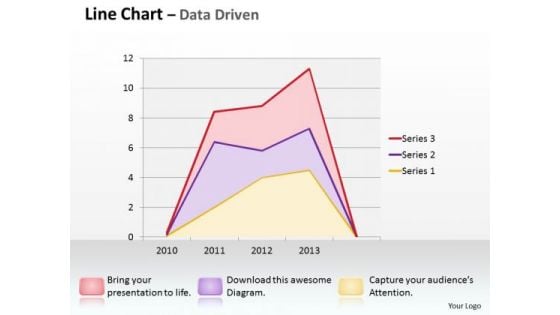
Multivariate Data Analysis Driven Line Chart Shows Revenue Trends PowerPoint Slides Templates
Good Camaraderie Is A Key To Teamwork. Our multivariate data analysis driven line chart shows revenue trends powerpoint slides Templates Can Be A Cementing Force.
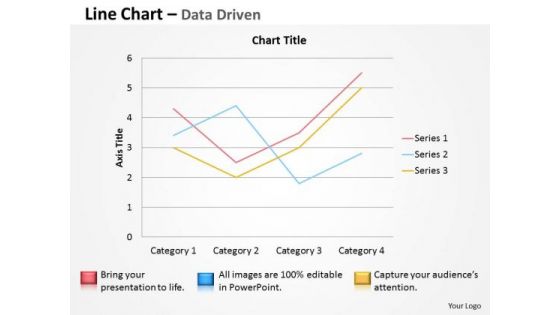
Multivariate Data Analysis Driven Line Chart To Demonstrate PowerPoint Slides Templates
Brace Yourself, Arm Your Thoughts. Prepare For The Hustle With Our multivariate data analysis driven line chart to demonstrate powerpoint slides Templates .
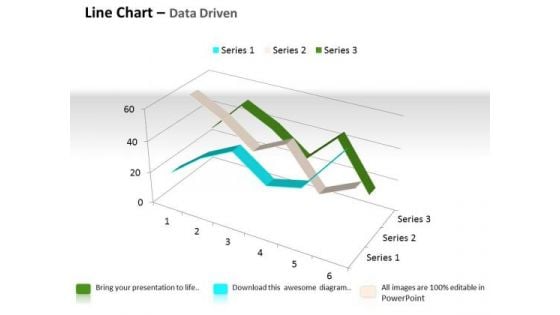
Quantitative Data Analysis 3d Line Chart For Comparison Of PowerPoint Templates
Touch Base With Our quantitative data analysis 3d line chart for comparison of Powerpoint Templates . Review Your Growth With Your Audience.

Quantitative Data Analysis 3d Pie Chart For Business Process PowerPoint Templates
Put Them On The Same Page With Our quantitative data analysis 3d pie chart for business process Powerpoint Templates . Your Team Will Sing From The Same Sheet.
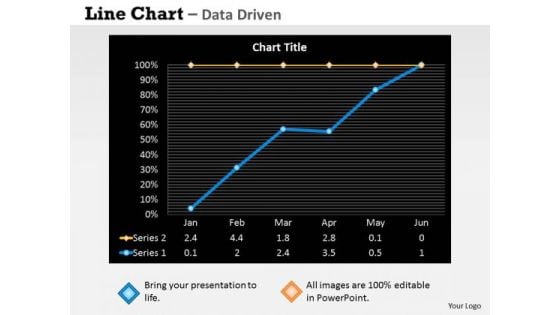
Quantitative Data Analysis Driven Economic Status Line Chart PowerPoint Slides Templates
Be The Dramatist With Our quantitative data analysis driven economic status line chart powerpoint slides Templates . Script Out The Play Of Words.
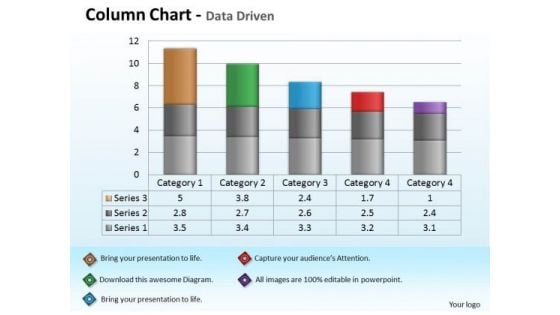
Quantitative Data Analysis Driven Economic With Column Chart PowerPoint Slides Templates
Add Some Dramatization To Your Thoughts. Our quantitative data analysis driven economic with column chart powerpoint slides Templates Make Useful Props.

Data Analysis On Excel Driven Sets Of Business Information PowerPoint Slides Templates
Break The Deadlock With Our data analysis on excel driven sets of business information powerpoint slides Templates . Let The Words Start To Flow.
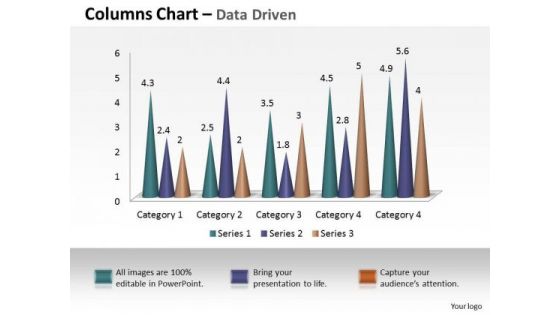
Examples Of Data Analysis Market 3d Business Intelligence And PowerPoint Templates
Our examples of data analysis market 3d business intelligence and Powerpoint Templates Are Dual Purpose. They Help Instruct And Inform At The Same Time.
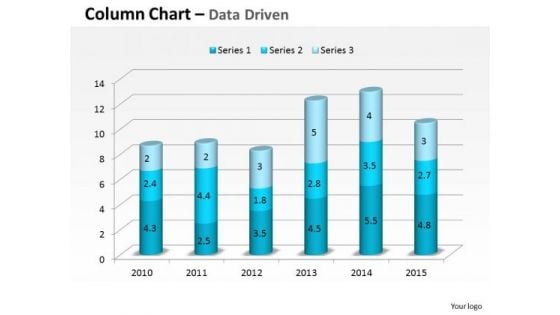
Data Analysis In Excel 3d Compare Yearly Business Performance PowerPoint Templates
Plan For All Contingencies With Our data analysis in excel 3d compare yearly business performance Powerpoint Templates . Douse The Fire Before It Catches.
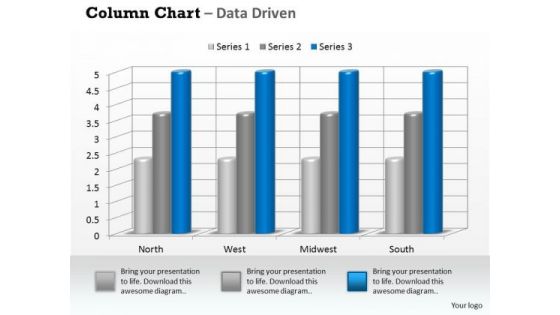
Examples Of Data Analysis Market 3d Business On Regular Intervals PowerPoint Templates
Drum It Out Loud And Clear On Our examples of data analysis market 3d business on regular intervals Powerpoint Templates . Your Words Will Ring In Their Ears.
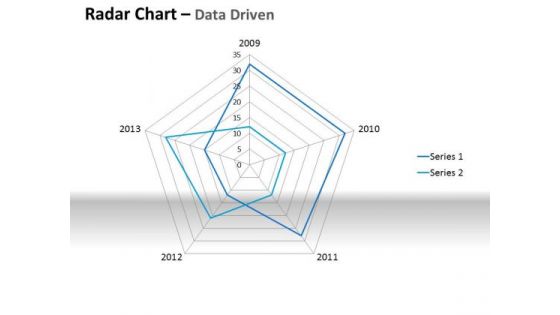
Examples Of Data Analysis Market Driven Plotting The Business Values PowerPoint Slides Templates
Ring The Duck With Our examples of data analysis market driven plotting the business values powerpoint slides Templates . Acquire The Points With Your Ideas.
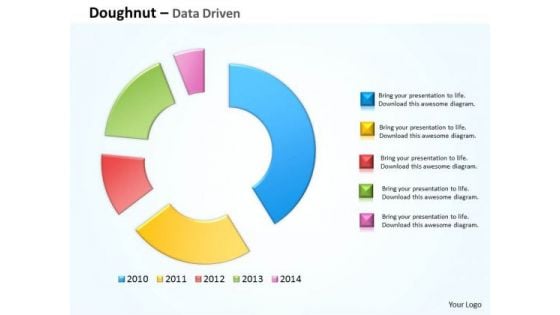
Financial Data Analysis Driven Compare Market Share Of Brand PowerPoint Templates
Doll Up Your Thoughts With Our financial data analysis driven compare market share of brand Powerpoint Templates . They Will Make A Pretty Picture.
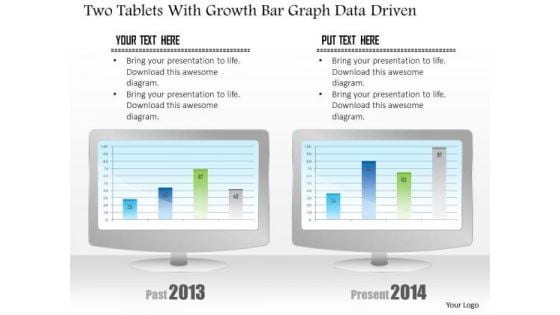
Business Diagram Two Tablets With Growth Bar Graph Data Driven PowerPoint Slide
This business diagram has been designed with comparative charts on tablets. This slide suitable for data representation. You can also use this slide to present business reports and information. Use this diagram to present your views in a wonderful manner.
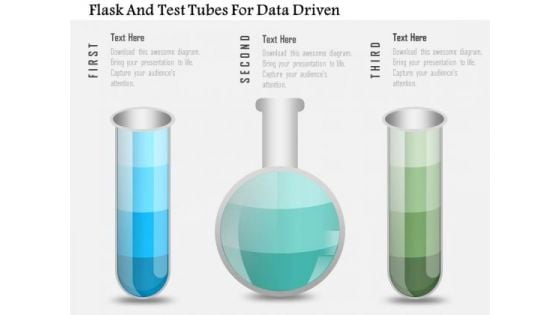
Business Diagram Flask And Test Tubes For Data Driven PowerPoint Slide
This data driven diagram has been designed with flask and test tubes. Download this diagram to give your presentations more effective look. It helps in clearly conveying your message to clients and audience.
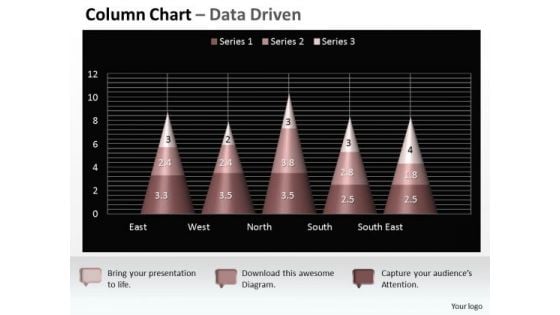
Data Analysis On Excel 3d Chart Shows Interrelated Sets Of PowerPoint Templates
Put Them On The Same Page With Our data analysis on excel 3d chart shows interrelated sets of Powerpoint Templates . Your Team Will Sing From The Same Sheet.
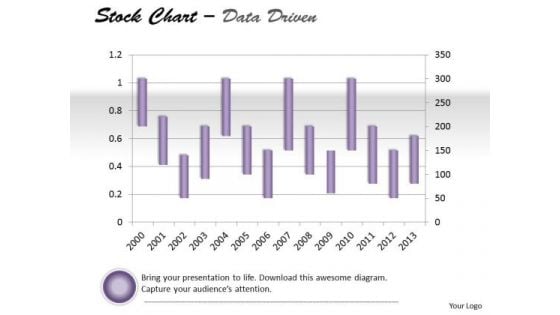
Data Analysis On Excel Driven Stock Chart For Market History PowerPoint Slides Templates
Draw Out The Best In You With Our data analysis on excel driven stock chart for market history powerpoint slides Templates . Let Your Inner Brilliance Come To The Surface.
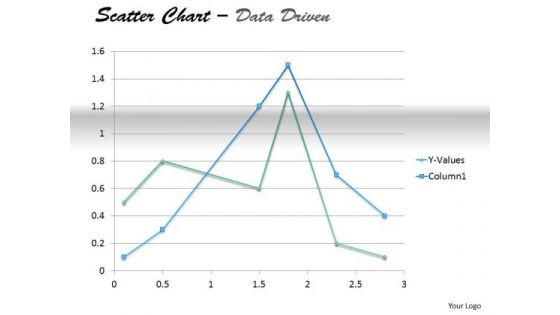
Examples Of Data Analysis Market Driven Present In Scatter Chart PowerPoint Slides Templates
Your Thoughts Will Take To Our examples of data analysis market driven present in scatter chart powerpoint slides Templates Like A Duck To Water. They Develop A Binding Affinity.
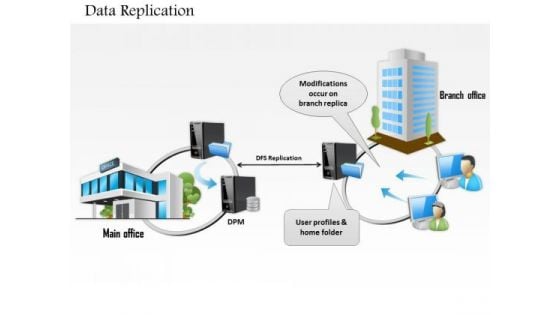
1 Data Replication Between Main Office And Branch Over Network Wan Lan Ppt Slides
This image slide displays data replication. This image slide has been designed with graphic of main office and branch data replication over network. This image slide depicts process of data replication. Database replication can be used on many database management systems, usually with a master slave relationship between the original and the copies. The master logs the updates, which then pass through to the slaves. You may change size, color and orientation of any icon to your liking. Use this PowerPoint template, in your presentations to explain concept of data replication. This image slide will enhance the quality of your presentations.

Various Stages Data Extraction Process Flow Chart Ppt PowerPoint Presentation Pictures Show PDF
Persuade your audience using this various stages data extraction process flow chart ppt powerpoint presentation pictures show pdf. This PPT design covers five stages, thus making it a great tool to use. It also caters to a variety of topics including interpretation evaluation, data mining, transformation, preprocessing, selection, target data, preprocessed data, transformed data, patterns, knowledge. Download this PPT design now to present a convincing pitch that not only emphasizes the topic but also showcases your presentation skills.
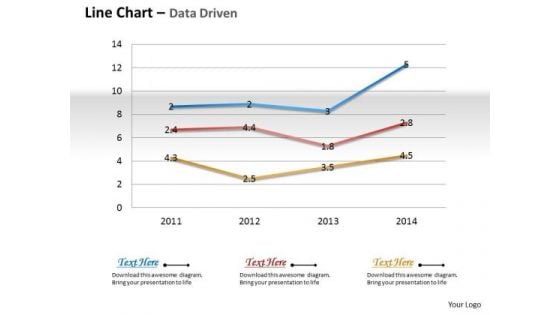
Business Data Analysis Chart Shows Changes Over The Time PowerPoint Templates
Document The Process On Our business data analysis chart shows changes over the time Powerpoint Templates. Make A Record Of Every Detail.
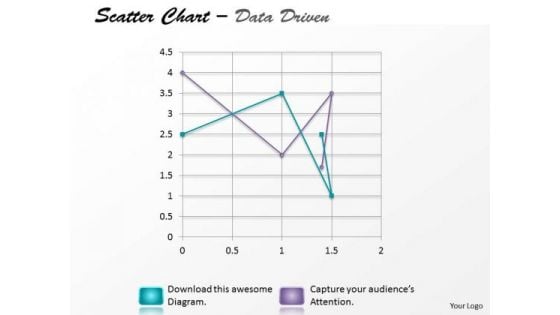
Data Analysis Excel Driven Multiple Series Scatter Chart PowerPoint Slides Templates
Your Listeners Will Never Doodle. Our data analysis excel driven multiple series scatter chart powerpoint slides Templates Will Hold Their Concentration.
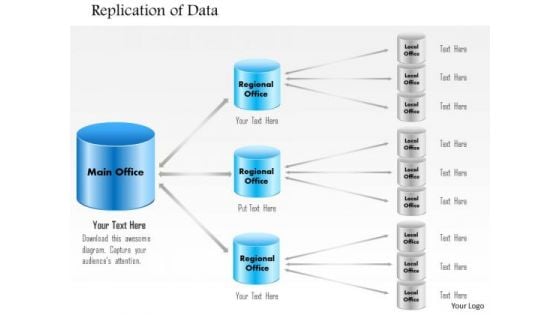
1 Replication Of Data From Main Office To Regional Office To Branch Offices Ppt Slide
This image slide explains the concept database replication in an organization. This image slide has been designed with graphic of database system transfers in main, regional and local office branches. You may change color, size and orientation of any icon to your liking. Use this image slide, in your presentations to express views on backup, storage, networking, communication and technology. Create wonderful presentations using this image slide.
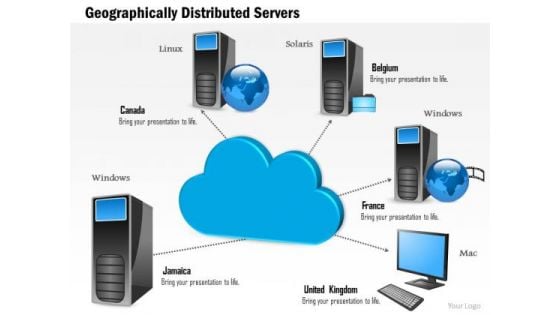
1 Geographically Distributed Servers Across Data Centers Connected To A Centralized Cloud Ppt Slides
This image slide displays geographically distributed server. This image slide has been designed with graphic of could, servers and globe. This image depicts cloud computing. You may change size, color and orientation of any icon to your liking. Use this PowerPoint template, in your presentations to explain concept of cloud computing both at local and global scale. This image slide will help you make professional presentations.
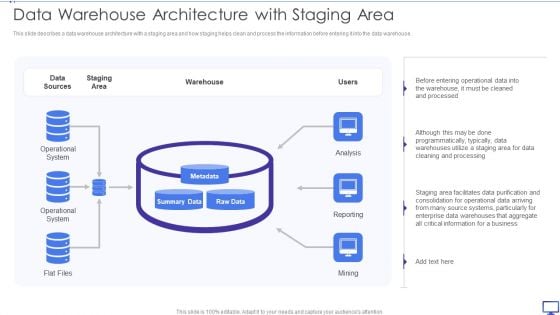
Decision Support System Data Warehouse Architecture With Staging Area Diagrams PDF
This slide describes a data warehouse architecture with a staging area and how staging helps clean and process the information before entering it into the data warehouse. This is a Decision Support System Data Warehouse Architecture With Staging Area Diagrams PDF template with various stages. Focus and dispense information on one stages using this creative set, that comes with editable features. It contains large content boxes to add your information on topics like Data Sources, Staging Area, Operational System. You can also showcase facts, figures, and other relevant content using this PPT layout. Grab it now.

Stock Photo 3d Globe With Social Web For Data Protection Concept PowerPoint Slide
Graphic of 3d globe and web has been used to craft this power point image template. This PPT contains the concept of data protection and social network. Use this PPT and build quality presentation for your viewers.

Data Server Room With Computer Mainframe With Neon Lights Ppt PowerPoint Presentation Inspiration Grid PDF
Presenting data server room with computer mainframe with neon lights ppt powerpoint presentation inspiration grid pdf to dispense important information. This template comprises three stages. It also presents valuable insights into the topics including data server room with computer mainframe. This is a completely customizable PowerPoint theme that can be put to use immediately. So, download it and address the topic impactfully.

Business Diagram Four Pie Chart For Data Driven Result Analysis Of Business PowerPoint Slide
This business diagram displays graphic of pie charts in shape of flasks. This business slide is suitable to present and compare business data. Use this diagram to build professional presentations for your viewers.
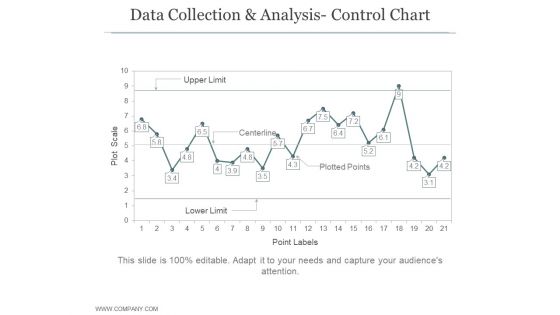
Data Collection And Analysis Control Chart Ppt PowerPoint Presentation Example File
This is a data collection and analysis control chart ppt powerpoint presentation example file. This is a four stage process. The stages in this process are business, strategy, marketing, bar graph, growth strategy.

Business Diagram Three Heads With Pie For Data Driven Technology PowerPoint Slide
This business diagram displays three human faces with pie charts. This Power Point template has been designed to compare and present business data. You may use this diagram to impart professional appearance to your presentations.
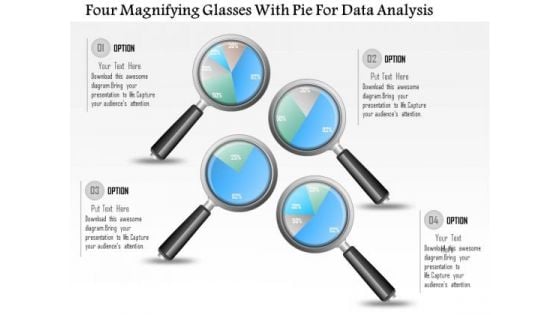
Business Diagram Four Magnifying Glasses With Pie For Data Analysis PowerPoint Slide
This business diagram displays graphic of pie charts in shape of magnifying glasses This business slide is suitable to present and compare business data. Use this diagram to build professional presentations for your viewers.

Business Diagram Data Driven Bar Graph And Pie Chart For Analysis PowerPoint Slide
This PowerPoint template displays technology gadgets with various business charts. Use this diagram slide, in your presentations to make business reports for statistical analysis. You may use this diagram to impart professional appearance to your presentations.
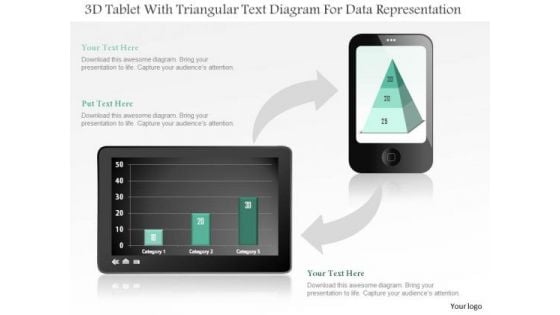
Business Diagram 3d Tablet With Triangular Text Diagram For Data Representation PowerPoint Slide
This business diagram displays bar graph on tablet and pyramid chart on mobile phone. Use this diagram, to make reports for interactive business presentations. Create professional presentations using this diagram.
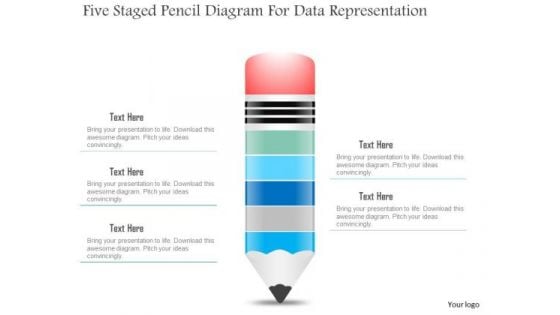
Business Diagram Five Staged Pencil Diagram For Data Representation PowerPoint Slide
This business slide displays five staged pencil diagram. It contains pencil graphic divided into five parts. This diagram slide depicts processes, stages, steps, points, options and education information display. Use this diagram, in your presentations to express your views innovatively.
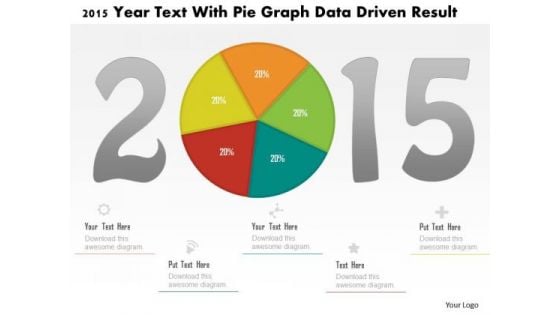
Business Diagram 2015 Year Text With Pie Graph Data Driven Result PowerPoint Slide
This business diagram displays 2015 year numbers with pie chart. This diagram is suitable to display business strategy for year 2015. Download this professional slide to present information in an attractive manner
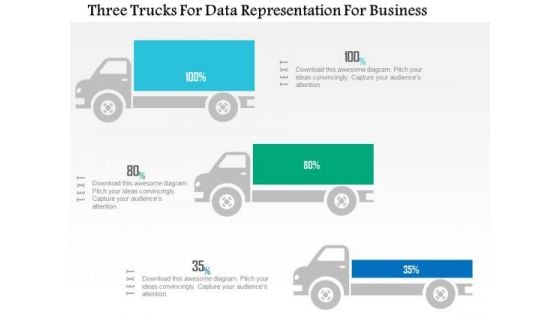
Business Diagram Three Trucks For Data Representation For Business PowerPoint Slide
This business diagram displays three trucks graphic. This diagram contains trucks for percentage value growth. Use this diagram to display business growth over a period of time.
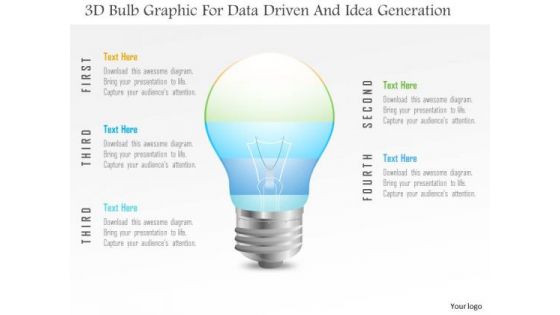
Business Diagram 3d Bulb Graphic For Data Driven And Idea Generation PowerPoint Slide
This Power Point template has been designed with 3d bulb graphic. Use this slide to represent technology idea and strategy concepts. Download this diagram for your business presentations and get exclusive comments on your efforts.
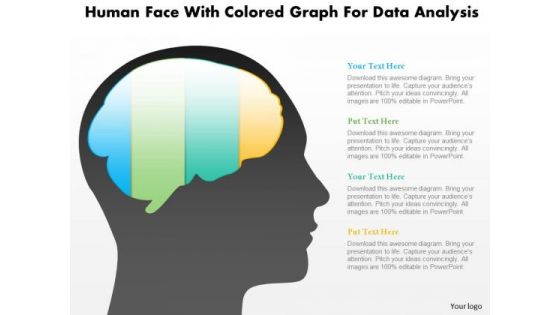
Business Diagram Human Face With Colored Graph For Data Analysis PowerPoint Slide
This diagram displays human face graphic with colored graph. This diagram can be used to represent strategy, planning, thinking of business plan. Display business options in your presentations by using this creative diagram.
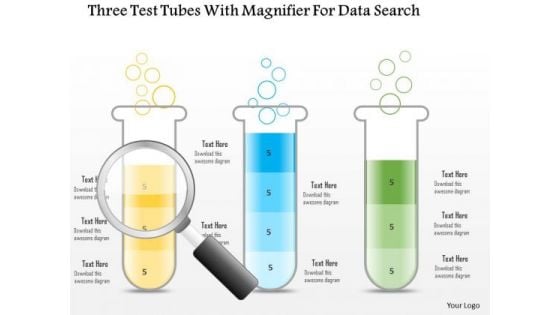
Business Diagram Three Test Tubes With Magnifier For Data Search PowerPoint Slide
This business diagram displays three test tubes with magnifying glass. This diagram is suitable to depict flow of business activities or steps. Download this professional slide to present information in an attractive manner.

Data Analysis In Excel 3d Column Chart To Represent Information PowerPoint Templates
Rake In The Dough With
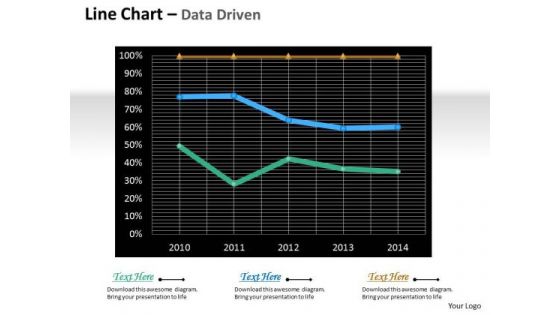
Multivariate Data Analysis Driven Line Chart For Market Survey PowerPoint Slides Templates
Rake In The Dough With
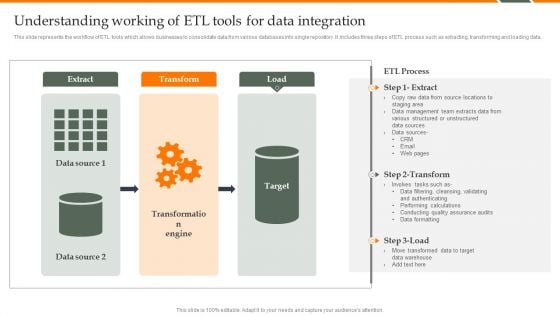
Human Resource Analytics Understanding Working Of ETL Tools For Data Integration Microsoft PDF
This slide represents the workflow of ETL tools which allows businesses to consolidate data from various databases into single repository. It includes three steps of ETL process such as extracting, transforming and loading data. Do you know about Slidesgeeks Human Resource Analytics Understanding Working Of ETL Tools For Data Integration Microsoft PDF These are perfect for delivering any kind od presentation. Using it, create PowerPoint presentations that communicate your ideas and engage audiences. Save time and effort by using our pre-designed presentation templates that are perfect for a wide range of topic. Our vast selection of designs covers a range of styles, from creative to business, and are all highly customizable and easy to edit. Download as a PowerPoint template or use them as Google Slides themes.
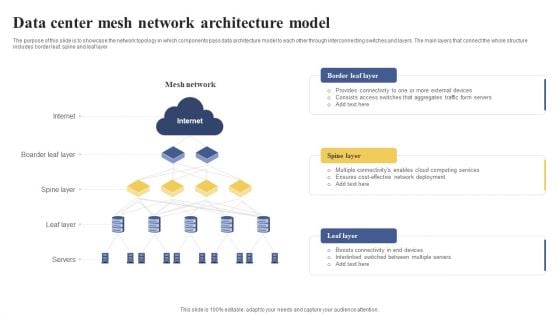
Data Center Mesh Network Architecture Model Ppt Portfolio Background Image PDF
The purpose of this slide is to showcase the network topology in which components pass data architecture model to each other through interconnecting switches and layers. the main layers that connect the whole structure includes border leaf, spine and leaf layer. Presenting Data Center Mesh Network Architecture Model Ppt Portfolio Background Image PDF to dispense important information. This template comprises one stages. It also presents valuable insights into the topics including Border Leaf Layer, Spine Layer, Leaf Layer. This is a completely customizable PowerPoint theme that can be put to use immediately. So, download it and address the topic impactfully.
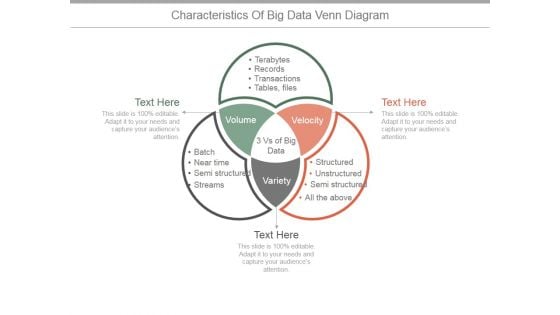
Characteristics Of Big Data Venn Diagram Ppt PowerPoint Presentation Example 2015
This is a characteristics of big data venn diagram ppt powerpoint presentation example 2015. This is a three stage process. The stages in this process are volume, velocity, variety, tables, files, transactions, records, terabytes.
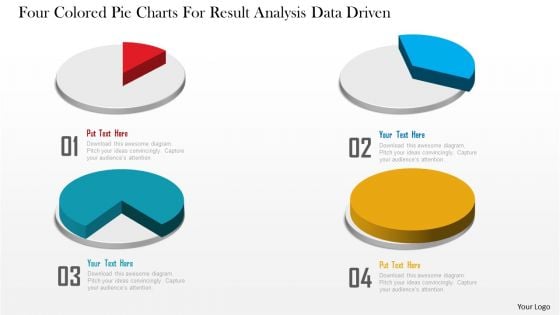
Business Diagram Four Colored Pie Charts For Result Analysis Data Driven PowerPoint Slide
This business diagram displays graphic of pie charts. This business slide is suitable to present and compare business data. Use this diagram to build professional presentations for your viewers.
Magnifying Ppt PowerPoint Presentation Icon Layout Ideas
This is a magnifying ppt powerpoint presentation icon layout ideas. This is a five stage process. The stages in this process are magnifying, business, marketing, icons, process.
Magnifying Glass Ppt PowerPoint Presentation Icon Topics
This is a magnifying glass ppt powerpoint presentation icon topics. This is a three stage process. The stages in this process are magnifying glass, technology, business, marketing, icons.
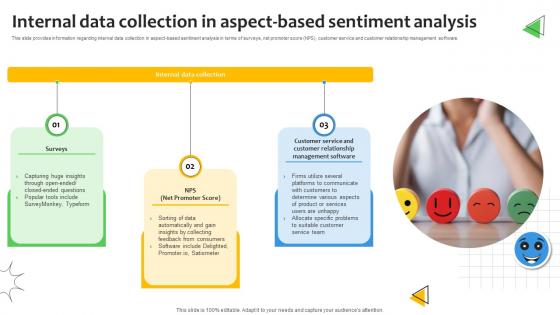
Internal Data Collection In Aspect Based Sentiment Analysis Demystified Understanding AI SS V
This slide provides information regarding internal data collection in aspect-based sentiment analysis in terms of surveys, net promoter score NPS, customer service and customer relationship management software. Presenting this PowerPoint presentation, titled Icons Slide Sentiment Analysis Demystified Understanding Textual Emotions And Opinions AI SS V, with topics curated by our researchers after extensive research. This editable presentation is available for immediate download and provides attractive features when used. Download now and captivate your audience. Presenting this Icons Slide Sentiment Analysis Demystified Understanding Textual Emotions And Opinions AI SS V. Our researchers have carefully researched and created these slides with all aspects taken into consideration. This is a completely customizable Icons Slide Sentiment Analysis Demystified Understanding Textual Emotions And Opinions AI SS V that is available for immediate downloading. Download now and make an impact on your audience. Highlight the attractive features available with our PPTs. This slide provides information regarding internal data collection in aspect-based sentiment analysis in terms of surveys, net promoter score NPS, customer service and customer relationship management software.
Magnifying Glass Ppt PowerPoint Presentation Icon Inspiration
This is a magnifying glass ppt powerpoint presentation icon inspiration. This is a six stage process. The stages in this process are magnifying glass, technology, business, marketing, process.
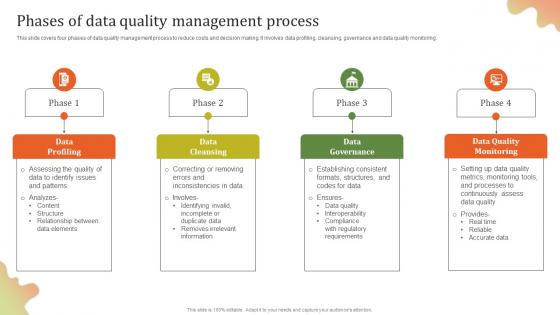
Phases Of Data Quality Management Executing Effective Quality Enhancement Clipart Pdf
This slide covers four phases of data quality management process to reduce costs and decision making. It involves data profiling, cleansing, governance and data quality monitoring. Boost your pitch with our creative Phases Of Data Quality Management Executing Effective Quality Enhancement Clipart Pdf. Deliver an awe inspiring pitch that will mesmerize everyone. Using these presentation templates you will surely catch everyones attention. You can browse the ppts collection on our website. We have researchers who are experts at creating the right content for the templates. So you do not have to invest time in any additional work. Just grab the template now and use them. This slide covers four phases of data quality management process to reduce costs and decision making. It involves data profiling, cleansing, governance and data quality monitoring.

Data Breach Prevention Recognition Ppt PowerPoint Presentation Complete Deck With Slides
This complete deck acts as a great communication tool. It helps you in conveying your business message with personalized sets of graphics, icons etc. Comprising a set of fifty slides, this complete deck can help you persuade your audience. It also induces strategic thinking as it has been thoroughly researched and put together by our experts. Not only is it easily downloadable but also editable. The color, graphics, theme any component can be altered to fit your individual needs. So grab it now.
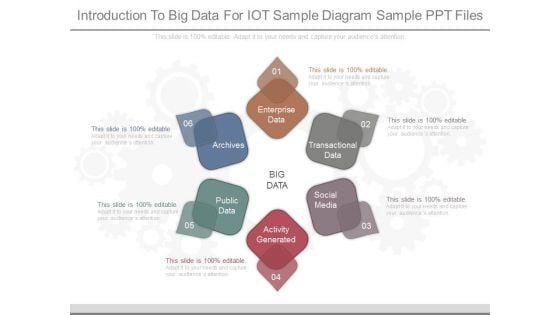
Introduction To Big Data For Iot Sample Diagram Sample Ppt Files
This is a introduction to big data for iot sample diagram sample ppt files. This is a six stage process. The stages in this process are enterprise data, transactional data, social media, activity generated, public data, archives, big data.
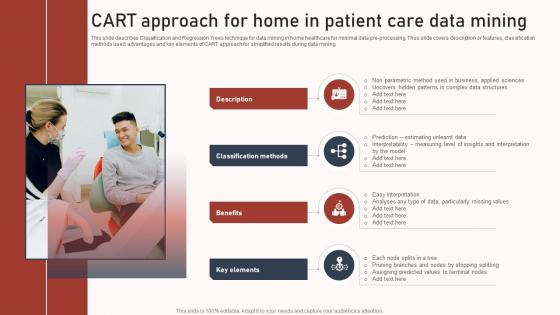
CART Approach For Home In Patient Care Data Mining Diagrams Pdf
This slide describes Classification and Regression Trees technique for data mining in home healthcare for minimal data pre processing. Thus slide covers description or features, classification methods used, advantages and key elements of CART approach for simplified results during data mining. Showcasing this set of slides titled CART Approach For Home In Patient Care Data Mining Diagrams Pdf. The topics addressed in these templates are Description, Classification Methods, Benefits . All the content presented in this PPT design is completely editable. Download it and make adjustments in color, background, font etc. as per your unique business setting. This slide describes Classification and Regression Trees technique for data mining in home healthcare for minimal data pre processing. Thus slide covers description or features, classification methods used, advantages and key elements of CART approach for simplified results during data mining.
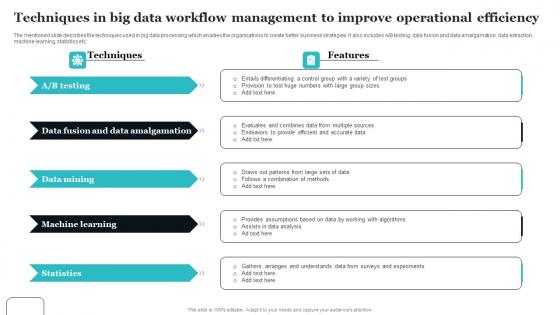
Techniques In Big Data Workflow Management To Improve Operational Efficiency Diagrams Pdf
The mentioned slide describes the techniques used in big data processing which enables the organizations to create better business strategies. It also includes A or B testing, data fusion and data amalgamation, data extraction, machine learning, statistics etc. Pitch your topic with ease and precision using this Techniques In Big Data Workflow Management To Improve Operational Efficiency Diagrams Pdf This layout presents information on Data Fusion, Data Amalgamation, Machine Learning It is also available for immediate download and adjustment. So, changes can be made in the color, design, graphics or any other component to create a unique layout. The mentioned slide describes the techniques used in big data processing which enables the organizations to create better business strategies. It also includes A or B testing, data fusion and data amalgamation, data extraction, machine learning, statistics etc.
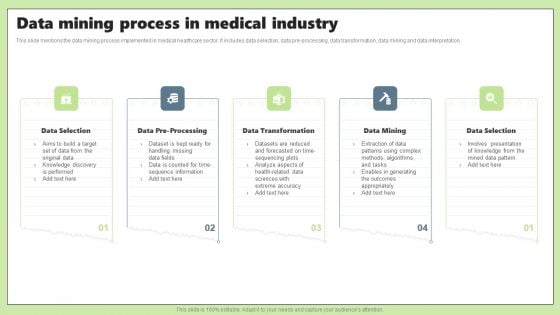
Data Mining Process In Medical Industry Ppt PowerPoint Presentation Portfolio Guide PDF
This slide mentions the data mining process implemented in medical healthcare sector. It includes data selection, data pre-processing, data transformation, data mining and data interpretation.Presenting Data Mining Process In Medical Industry Ppt PowerPoint Presentation Portfolio Guide PDF to dispense important information. This template comprises five stages. It also presents valuable insights into the topics including Data Selection, Data Transformation, Data Mining. This is a completely customizable PowerPoint theme that can be put to use immediately. So, download it and address the topic impactfully.
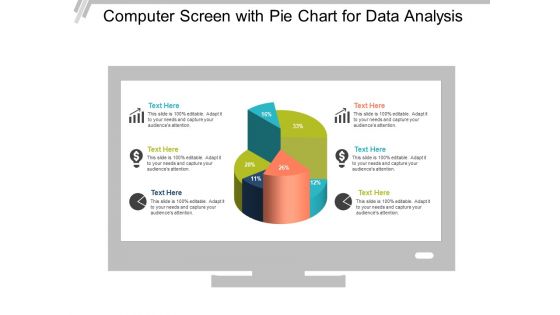
Computer Screen With Pie Chart For Data Analysis Ppt PowerPoint Presentation Show Picture
This is a computer screen with pie chart for data analysis ppt powerpoint presentation show picture. This is a six stage process. The stages in this process are computer icon, desktop icon, laptop screen icon.
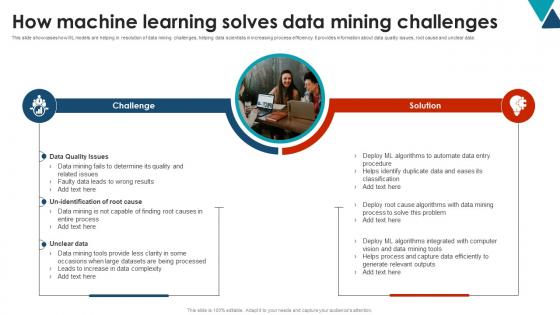
How Machine Learning Solves Using Data Mining Tools To Optimize Processes AI SS V
This slide showcases how ML models are helping in resolution of data mining challenges, helping data scientists in increasing process efficiency. It provides information about data quality issues, root cause and unclear data. Do you know about Slidesgeeks How Machine Learning Solves Using Data Mining Tools To Optimize Processes AI SS V These are perfect for delivering any kind od presentation. Using it, create PowerPoint presentations that communicate your ideas and engage audiences. Save time and effort by using our pre-designed presentation templates that are perfect for a wide range of topic. Our vast selection of designs covers a range of styles, from creative to business, and are all highly customizable and easy to edit. Download as a PowerPoint template or use them as Google Slides themes. This slide showcases how ML models are helping in resolution of data mining challenges, helping data scientists in increasing process efficiency. It provides information about data quality issues, root cause and unclear data.
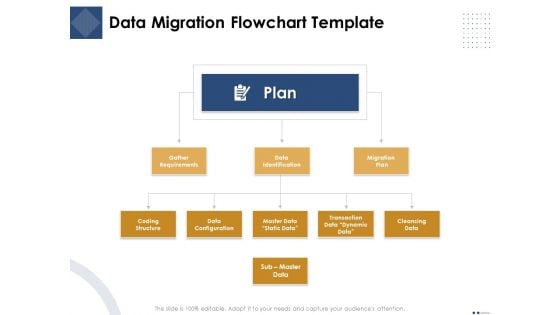
Introducing And Implementing Approaches Within The Business Data Migration Flowchart Template Graphics PDF
Presenting this set of slides with name introducing and implementing approaches within the business data migration flowchart template graphics pdf. This is a three stage process. The stages in this process are plan, gather requirements, data identification, migration, plan, coding structure, data configuration, master data static data, transaction data dynamic data, cleansing data, sub master data. This is a completely editable PowerPoint presentation and is available for immediate download. Download now and impress your audience.
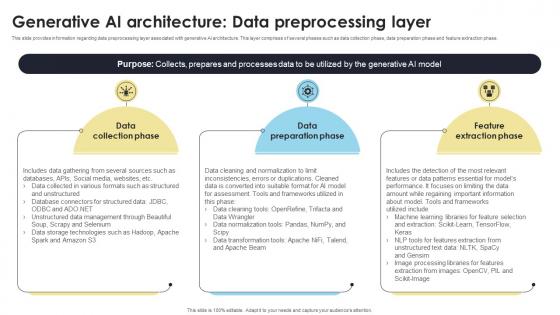
Generative AI Architecture Data Preprocessing Layer How Generative AI Tools Work AI SS V
This slide provides information regarding data preprocessing layer associated with generative AI architecture. This layer comprises of several phases such as data collection phase, data preparation phase and feature extraction phase. This Generative AI Architecture Data Preprocessing Layer How Generative AI Tools Work AI SS V is perfect for any presentation, be it in front of clients or colleagues. It is a versatile and stylish solution for organizing your meetings. The Generative AI Architecture Data Preprocessing Layer How Generative AI Tools Work AI SS V features a modern design for your presentation meetings. The adjustable and customizable slides provide unlimited possibilities for acing up your presentation. Slidegeeks has done all the homework before launching the product for you. So, do not wait, grab the presentation templates today This slide provides information regarding data preprocessing layer associated with generative AI architecture. This layer comprises of several phases such as data collection phase, data preparation phase and feature extraction phase.
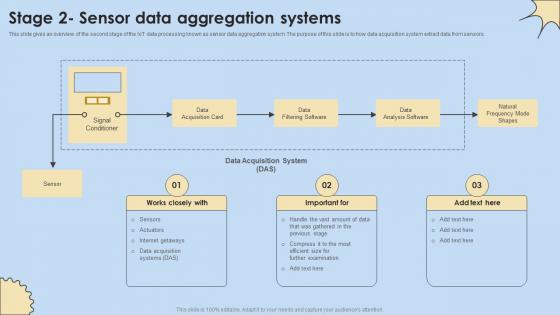
Stage 2 Sensor Data Aggregation Systems Internet Of Things Analysis Introduction Pdf
This slide gives an overview of the second stage of the IoT data processing known as sensor data aggregation system. The purpose of this slide is to how data acquisition system extract data from sensors. Do you know about Slidesgeeks Stage 2 Sensor Data Aggregation Systems Internet Of Things Analysis Introduction Pdf These are perfect for delivering any kind od presentation. Using it, create PowerPoint presentations that communicate your ideas and engage audiences. Save time and effort by using our pre-designed presentation templates that are perfect for a wide range of topic. Our vast selection of designs covers a range of styles, from creative to business, and are all highly customizable and easy to edit. Download as a PowerPoint template or use them as Google Slides themes. This slide gives an overview of the second stage of the IoT data processing known as sensor data aggregation system. The purpose of this slide is to how data acquisition system extract data from sensors.
Data Interpretation And Analysis Playbook Ppt PowerPoint Presentation Complete Deck With Slides
This complete deck acts as a great communication tool. It helps you in conveying your business message with personalized sets of graphics, icons etc. Comprising a set of thirty nine slides, this complete deck can help you persuade your audience. It also induces strategic thinking as it has been thoroughly researched and put together by our experts. Not only is it easily downloadable but also editable. The color, graphics, theme any component can be altered to fit your individual needs. So grab it now.

Developing Organization Primary Data Storage Action Plan Ppt PowerPoint Presentation Complete Deck With Slides
This complete deck acts as a great communication tool. It helps you in conveying your business message with personalized sets of graphics, icons etc. Comprising a set of fifty nine slides, this complete deck can help you persuade your audience. It also induces strategic thinking as it has been thoroughly researched and put together by our experts. Not only is it easily downloadable but also editable. The color, graphics, theme any component can be altered to fit your individual needs. So grab it now.

Business Intelligence And Big Data Analytics Transformation Toolkit Ppt PowerPoint Presentation Complete Deck With Slides
This complete deck acts as a great communication tool. It helps you in conveying your business message with personalized sets of graphics, icons etc. Comprising a set of ninety five slides, this complete deck can help you persuade your audience. It also induces strategic thinking as it has been thoroughly researched and put together by our experts. Not only is it easily downloadable but also editable. The color, graphics, theme any component can be altered to fit your individual needs. So grab it now.

Data Wiper Spyware Attack Ppt PowerPoint Presentation Complete Deck With Slides
This complete deck acts as a great communication tool. It helps you in conveying your business message with personalized sets of graphics, icons etc. Comprising a set of sixty two slides, this complete deck can help you persuade your audience. It also induces strategic thinking as it has been thoroughly researched and put together by our experts. Not only is it easily downloadable but also editable. The color, graphics, theme any component can be altered to fit your individual needs. So grab it now.

Companys Data Safety Recognition Ppt PowerPoint Presentation Complete Deck With Slides
This complete deck acts as a great communication tool. It helps you in conveying your business message with personalized sets of graphics, icons etc. Comprising a set of fifty one slides, this complete deck can help you persuade your audience. It also induces strategic thinking as it has been thoroughly researched and put together by our experts. Not only is it easily downloadable but also editable. The color, graphics, theme any component can be altered to fit your individual needs. So grab it now.

Executing Advance Data Analytics At Workspace Ppt PowerPoint Presentation Complete Deck With Slides
This complete deck acts as a great communication tool. It helps you in conveying your business message with personalized sets of graphics, icons etc. Comprising a set of seventy three slides, this complete deck can help you persuade your audience. It also induces strategic thinking as it has been thoroughly researched and put together by our experts. Not only is it easily downloadable but also editable. The color, graphics, theme any component can be altered to fit your individual needs. So grab it now.

Healthcare Data Balanced Scorecard Ppt PowerPoint Presentation Complete Deck With Slides
This complete deck acts as a great communication tool. It helps you in conveying your business message with personalized sets of graphics, icons etc. Comprising a set of twenty seven slides, this complete deck can help you persuade your audience. It also induces strategic thinking as it has been thoroughly researched and put together by our experts. Not only is it easily downloadable but also editable. The color, graphics, theme any component can be altered to fit your individual needs. So grab it now.
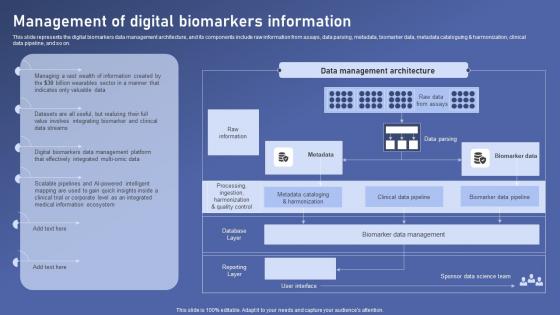
Management Digital Biomarkers Biomedical Data Science And Health Informatics Themes Pdf
This slide represents the digital biomarkers data management architecture, and its components include raw information from assays, data parsing, metadata, biomarker data, metadata cataloguing and harmonization, clinical data pipeline, and so on. Do you know about Slidesgeeks Management Digital Biomarkers Biomedical Data Science And Health Informatics Themes Pdf These are perfect for delivering any kind od presentation. Using it, create PowerPoint presentations that communicate your ideas and engage audiences. Save time and effort by using our pre designed presentation templates that are perfect for a wide range of topic. Our vast selection of designs covers a range of styles, from creative to business, and are all highly customizable and easy to edit. Download as a PowerPoint template or use them as Google Slides themes. This slide represents the digital biomarkers data management architecture, and its components include raw information from assays, data parsing, metadata, biomarker data, metadata cataloguing and harmonization, clinical data pipeline, and so on.
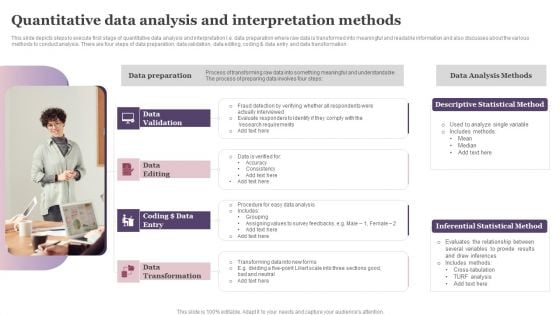
Quantitative Data Analysis And Interpretation Methods Ppt Ideas Graphics Tutorials PDF
This slide depicts steps to execute first stage of quantitative data analysis and interpretation I.e. data preparation where raw data is transformed into meaningful and readable information and also discusses about the various methods to conduct analysis. There are four steps of data preparation data validation, data editing, coding and data entry and data transformation. Presenting Quantitative Data Analysis And Interpretation Methods Ppt Ideas Graphics Tutorials PDF to dispense important information. This template comprises four stages. It also presents valuable insights into the topics including Data Validation, Data Editing, Data Preparation. This is a completely customizable PowerPoint theme that can be put to use immediately. So, download it and address the topic impactfully.
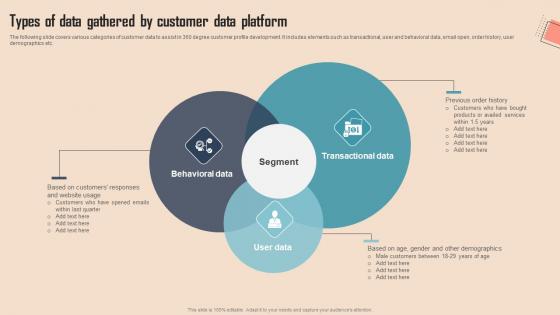
Types Of Data Gathered By Customer Comprehensive CDP Guide For Promoters Demonstration Pdf
The following slide covers various categories of customer data to assist in 360 degree customer profile development. It includes elements such as transactional, user and behavioral data, email open, order history, user demographics etc.Find a pre-designed and impeccable Types Of Data Gathered By Customer Comprehensive CDP Guide For Promoters Demonstration Pdf. The templates can ace your presentation without additional effort. You can download these easy-to-edit presentation templates to make your presentation stand out from others. So, what are you waiting for Download the template from Slidegeeks today and give a unique touch to your presentation. The following slide covers various categories of customer data to assist in 360 degree customer profile development. It includes elements such as transactional, user and behavioral data, email open, order history, user demographics etc.

Data Governance Steps Review Tools Setup Ppt PowerPoint Presentation Visual Aids Diagrams
This is a data governance steps review tools setup ppt powerpoint presentation visual aids diagrams. This is a five stage process. The stages in this process are data analysis, data review, data evaluation.
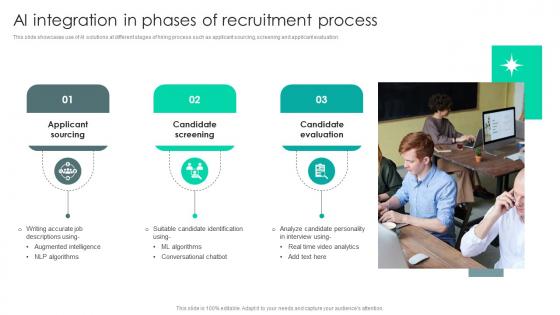
Strategic Staffing Using Data AI Integration In Phases Of Recruitment Process CRP DK SS V
This slide showcases use of AI solutions at different stages of hiring process such as applicant sourcing, screening and applicant evaluation. Do you have to make sure that everyone on your team knows about any specific topic I yes, then you should give Strategic Staffing Using Data AI Integration In Phases Of Recruitment Process CRP DK SS V a try. Our experts have put a lot of knowledge and effort into creating this impeccable Strategic Staffing Using Data AI Integration In Phases Of Recruitment Process CRP DK SS V. You can use this template for your upcoming presentations, as the slides are perfect to represent even the tiniest detail. You can download these templates from the Slidegeeks website and these are easy to edit. So grab these today This slide showcases use of AI solutions at different stages of hiring process such as applicant sourcing, screening and applicant evaluation.
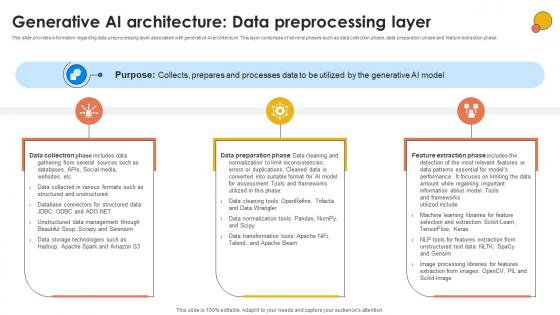
Generative AI Architecture Data Generative AI For Better Productivity AI SS V
This slide provides information regarding data preprocessing layer associated with generative AI architecture. This layer comprises of several phases such as data collection phase, data preparation phase and feature extraction phase. Crafting an eye-catching presentation has never been more straightforward. Let your presentation shine with this tasteful yet straightforward Generative AI Architecture Data Generative AI For Better Productivity AI SS V template. It offers a minimalistic and classy look that is great for making a statement. The colors have been employed intelligently to add a bit of playfulness while still remaining professional. Construct the ideal Generative AI Architecture Data Generative AI For Better Productivity AI SS V that effortlessly grabs the attention of your audience Begin now and be certain to wow your customers This slide provides information regarding data preprocessing layer associated with generative AI architecture. This layer comprises of several phases such as data collection phase, data preparation phase and feature extraction phase.
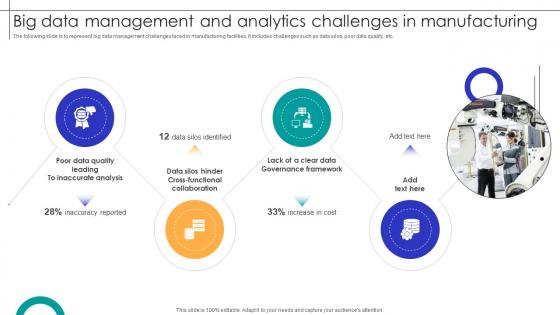
Big Data Management And Analytics Challenges In Manufacturing Streamlining Production Ppt Example
The following slide is to represent big data management challenges faced in manufacturing facilities. It includes challenges such as data silos, poor data quality, etc. Whether you have daily or monthly meetings, a brilliant presentation is necessary. Big Data Management And Analytics Challenges In Manufacturing Streamlining Production Ppt Example can be your best option for delivering a presentation. Represent everything in detail using Big Data Management And Analytics Challenges In Manufacturing Streamlining Production Ppt Example and make yourself stand out in meetings. The template is versatile and follows a structure that will cater to your requirements. All the templates prepared by Slidegeeks are easy to download and edit. Our research experts have taken care of the corporate themes as well. So, give it a try and see the results. The following slide is to represent big data management challenges faced in manufacturing facilities. It includes challenges such as data silos, poor data quality, etc.
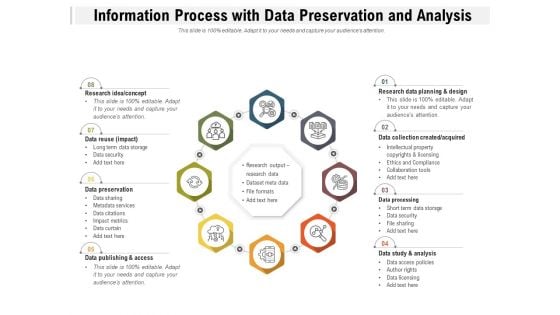
Information Process With Data Preservation And Analysis Ppt PowerPoint Presentation Styles Graphics Tutorials PDF
Presenting information process with data preservation and analysis ppt powerpoint presentation styles graphics tutorials pdf to dispense important information. This template comprises eight stages. It also presents valuable insights into the topics including research idea, concept, data reuse, data preservation, data publishing and access, research data planning and design, data collection created, acquired, data processing, data study and analysis. This is a completely customizable PowerPoint theme that can be put to use immediately. So, download it and address the topic impactfully.
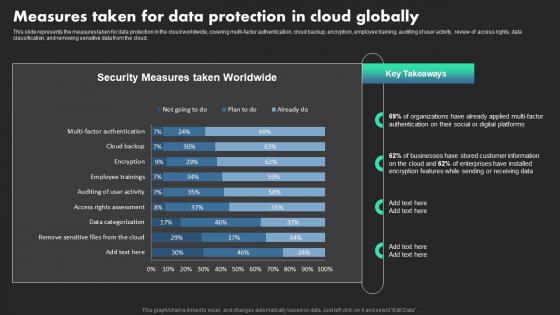
Measures Taken For Data Protection In Cloud Globally Ethical Dimensions Of Datafication Clipart Pdf
This slide represents the measures taken for data protection in the cloud worldwide, covering multi-factor authentication, cloud backup, encryption, employee training, auditing of user activity, review of access rights, data classification, and removing sensitive data from the cloud. Take your projects to the next level with our ultimate collection of Measures Taken For Data Protection In Cloud Globally Ethical Dimensions Of Datafication Clipart Pdf Slidegeeks has designed a range of layouts that are perfect for representing task or activity duration, keeping track of all your deadlines at a glance. Tailor these designs to your exact needs and give them a truly corporate look with your own brand colors they well make your projects stand out from the rest. This slide represents the measures taken for data protection in the cloud worldwide, covering multi-factor authentication, cloud backup, encryption, employee training, auditing of user activity, review of access rights, data classification, and removing sensitive data from the cloud.
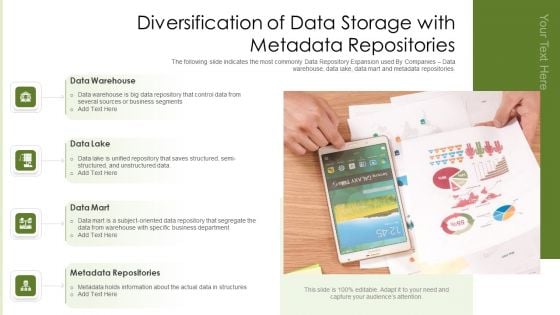
Diversification Of Data Storage With Metadata Repositories Ppt Professional Samples PDF
The following slide indicates the most commonly Data Repository Expansion used By Companies Data warehouse, data lake, data mart and metadata repositories. Presenting diversification of data storage with metadata repositories ppt professional samples pdf to dispense important information. This template comprises four stages. It also presents valuable insights into the topics including data warehouse, data lake, data mart, metadata repositories. This is a completely customizable PowerPoint theme that can be put to use immediately. So, download it and address the topic impactfully.
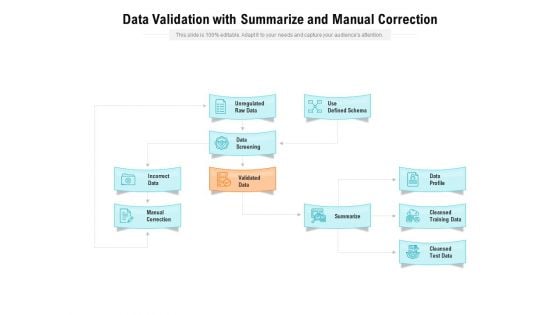
Data Validation With Summarize And Manual Correction Ppt PowerPoint Presentation Summary Graphics Design PDF
Presenting data validation with summarize and manual correction ppt powerpoint presentation summary graphics design pdf to dispense important information. This template comprises ten stages. It also presents valuable insights into the topics including unregulated raw data, use defined schema, data screening, validated data, summarize, data profile, cleansed training data, cleansed test data, incorrect data, manual correction. This is a completely customizable PowerPoint theme that can be put to use immediately. So, download it and address the topic impactfully.
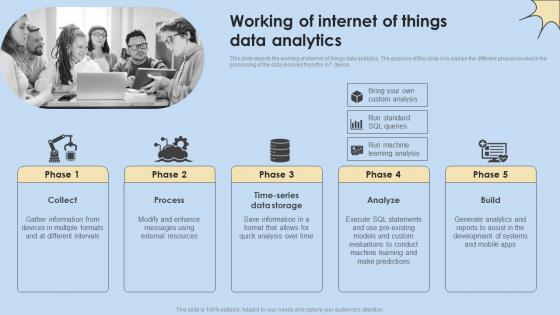
Working Of Internet Of Things Data Analytics Internet Of Things Analysis Professional Pdf
This slide depicts the working of internet of things data analytics. The purpose of this slide is to explain the different phases involve in the processing of the data received from the IoT device. Get a simple yet stunning designed Working Of Internet Of Things Data Analytics Internet Of Things Analysis Professional Pdf. It is the best one to establish the tone in your meetings. It is an excellent way to make your presentations highly effective. So, download this PPT today from Slidegeeks and see the positive impacts. Our easy-to-edit Working Of Internet Of Things Data Analytics Internet Of Things Analysis Professional Pdf can be your go-to option for all upcoming conferences and meetings. So, what are you waiting for Grab this template today. This slide depicts the working of internet of things data analytics. The purpose of this slide is to explain the different phases involve in the processing of the data received from the IoT device.

Forecast Demand Using Historical Sales Data Tactical Guide Stock Administration Themes Pdf
This slide showcases graph that can help organization to forecast the inventory requirement on the basis of sales data of previous financial years. It showcases data of last 3 years. Find highly impressive Forecast Demand Using Historical Sales Data Tactical Guide Stock Administration Themes Pdf on Slidegeeks to deliver a meaningful presentation. You can save an ample amount of time using these presentation templates. No need to worry to prepare everything from scratch because Slidegeeks experts have already done a huge research and work for you. You need to download Forecast Demand Using Historical Sales Data Tactical Guide Stock Administration Themes Pdf for your upcoming presentation. All the presentation templates are 100 percent editable and you can change the color and personalize the content accordingly. Download now This slide showcases graph that can help organization to forecast the inventory requirement on the basis of sales data of previous financial years. It showcases data of last 3 years.

Deck Presentation Solutions for Enhanced Data Reach and Visibility PPT Sample
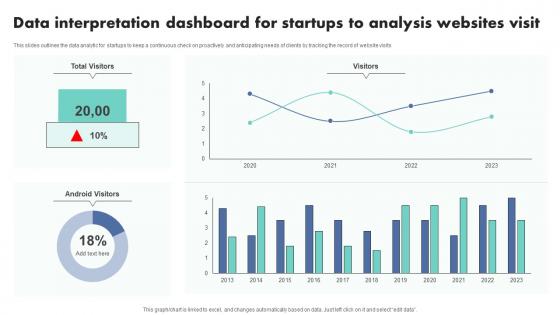
Data Interpretation Dashboard For Startups To Analysis Websites Visit Themes Pdf
This slides outlines the data analytic for startups to keep a continuous check on proactively and anticipating needs of clients by tracking the record of website visits.Showcasing this set of slides titled Data Interpretation Dashboard For Startups To Analysis Websites Visit Themes Pdf The topics addressed in these templates are Data Interpretation, Dashboard Startups, Analysis Websites Visit All the content presented in this PPT design is completely editable. Download it and make adjustments in color, background, font etc. as per your unique business setting. This slides outlines the data analytic for startups to keep a continuous check on proactively and anticipating needs of clients by tracking the record of website visits.

Business Data Validation Workflow Chart With Initiate And Identify Ppt PowerPoint Presentation Portfolio Graphics Download PDF
Presenting business data validation workflow chart with initiate and identify ppt powerpoint presentation portfolio graphics download pdf to dispense important information. This template comprises eight stages. It also presents valuable insights into the topics including initiate, data, cleansing requirement, identify data, field for cleansing, accelerate process of data cleaning, change data, cleansing status, the abnormal data list, data trend validation. This is a completely customizable PowerPoint theme that can be put to use immediately. So, download it and address the topic impactfully.
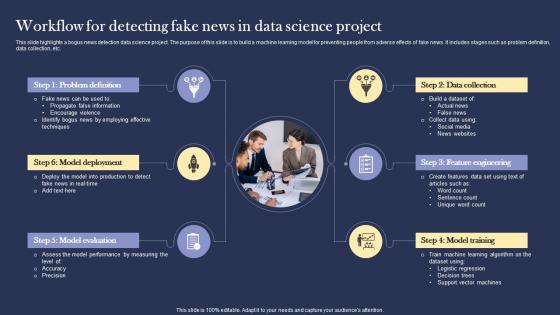
Workflow For Detecting Fake News In Data Science Project Diagrams pdf
This slide highlights a bogus news detection data science project. The purpose of this slide is to build a machine learning model for preventing people from adverse effects of fake news. It includes stages such as problem definition, data collection, etc. Pitch your topic with ease and precision using this Workflow For Detecting Fake News In Data Science Project Diagrams pdf. This layout presents information on Problem Definition, Model Deployment, Model Evaluation. It is also available for immediate download and adjustment. So, changes can be made in the color, design, graphics or any other component to create a unique layout. This slide highlights a bogus news detection data science project. The purpose of this slide is to build a machine learning model for preventing people from adverse effects of fake news. It includes stages such as problem definition, data collection, etc.
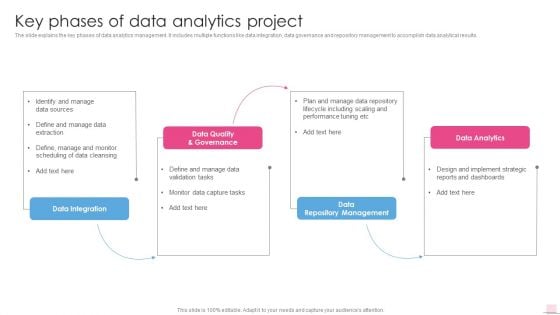
Key Phases Of Data Analytics Project Business Analysis Modification Toolkit Diagrams PDF
The slide explains the key phases of data analytics management. It includes multiple functions like data integration, data governance and repository management to accomplish data analytical results.Deliver and pitch your topic in the best possible manner with this Key Phases Of Data Analytics Project Business Analysis Modification Toolkit Diagrams PDF. Use them to share invaluable insights on Data Quality Governance, Performance Tuning, Including Scaling and impress your audience. This template can be altered and modified as per your expectations. So, grab it now.
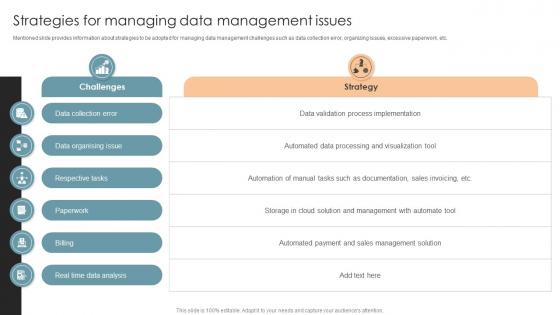
Strategies For Managing Data Management Issues Office Process Optimization To Increase Cost Efficiency
Mentioned slide provides information about strategies to be adopted for managing data management challenges such as data collection error, organizing issues, excessive paperwork, etc.Are you searching for a Strategies For Managing Data Management Issues Office Process Optimization To Increase Cost Efficiency that is uncluttered, straightforward, and original Its easy to edit, and you can change the colors to suit your personal or business branding. For a presentation that expresses how much effort you have put in, this template is ideal With all of its features, including tables, diagrams, statistics, and lists, its perfect for a business plan presentation. Make your ideas more appealing with these professional slides. Download Strategies For Managing Data Management Issues Office Process Optimization To Increase Cost Efficiency from Slidegeeks today. Mentioned slide provides information about strategies to be adopted for managing data management challenges such as data collection error, organizing issues, excessive paperwork, etc.

 Home
Home