Data Icon
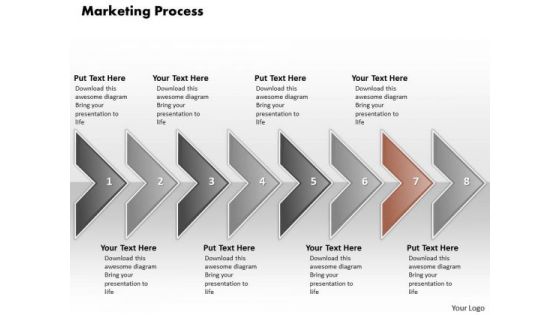
Ppt Illustration Of Marketing Process Using 8 State Diagram PowerPoint Templates
PPT illustration of marketing process using 8 state diagram PowerPoint Templates-This Diagram is used to illustrate how information will move between interrelated systems in the accomplishment of a given function, task or process. The visual description of this information flow with each given level showing how data is fed into a given process step and subsequently passed along at the completion of that step.-PPT illustration of marketing process using 8 state diagram PowerPoint Templates-Aim, Arrow, Badge, Border, Color, Connection, Curve, Design, Direction, Download, Icon, Illustration, Indicator, Internet, Label, Link, Magenta, Mark, Next, Object, Orientation, Paper, Peeling, Pointer, Rounded, Set, Shadow, Shape, Sign Have an exhilirating event with our Ppt Illustration Of Marketing Process Using 8 State Diagram PowerPoint Templates. Feel a surge of excitement in you.
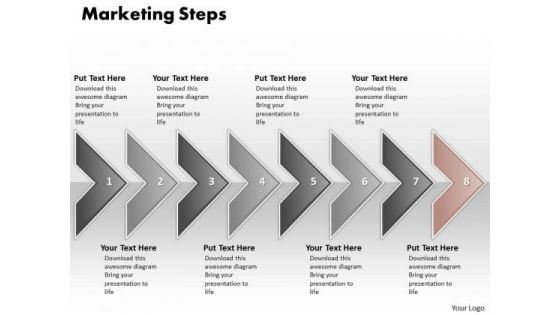
Ppt PowerPoint Slide Numbers Of Marketing Process Using 8 State Diagram Templates
PPT powerpoint slide numbers of marketing process using 8 state diagram Templates-Our compelling template consists of a design of arrow in straight line. This Diagram is used to illustrate how information will move between interrelated systems in the accomplishment of a given function, task or process. The visual description of this information flow with each given level showing how data is fed into a given process step and subsequently passed along at the completion of that step.-PPT powerpoint slide numbers of marketing process using 8 state diagram Templates-Aim, Arrow, Badge, Border, Color, Connection, Curve, Design, Direction, Download, Icon, Illustration, Indicator, Internet, Label, Link, Magenta, Mark, Next, Object, Orientation, Paper, Peeling, Pointer, Rounded, Set, Shadow, Shape, Sign Put in our Ppt PowerPoint Slide Numbers Of Marketing Process Using 8 State Diagram Templates as the catalyst. Churn out new equations with your ideas.
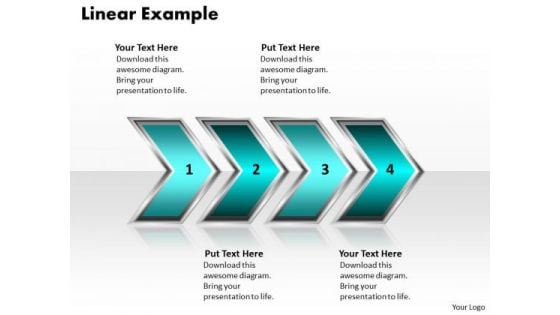
Ppt Linear Example Of Process Using 4 Stages PowerPoint Templates
PPT linear example of process using 4 stages PowerPoint Templates-This PowerPoint Diagram shows you the 3d Sequential Demonstration to explain Internet Marketing. It consists of Seven Layers explaining fourth here. Use this diagram as a method of graphically representing the flow of data as an information processing system. This is a good resource also for Marketing PowerPoint Diagrams or Business Backgrounds for PowerPoint or business presentation PowerPoint Diagram to master your strategic thinking.-PPT linear example of process using 4 stages PowerPoint Templates-Aim, Arrow, Arrowheads, Badge, Border, Click, Connection, Curve, Design, Direction, Download, Element, Fuchsia, Icon, Illustration, Indicator, Internet, Magenta, Mark, Object, Orientation, Pointer, Shadow, Shape, Sign List your strategy succinctly with our Ppt Linear Example Of Process Using 4 Stages PowerPoint Templates. You will be at the top of your game.
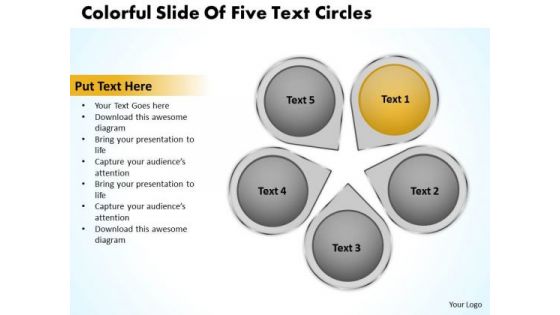
How To Draw Business Process Diagram Circles PowerPoint Templates Backgrounds For Slides
We present our how to draw business process diagram circles PowerPoint templates backgrounds for slides.Present our Circle Charts PowerPoint Templates because You are an avid believer in ethical practices. Highlight the benefits that accrue with our PowerPoint Templates and Slides. Download and present our Ring Charts PowerPoint Templates because Our PowerPoint Templates and Slides will generate and maintain the level of interest you desire. They will create the impression you want to imprint on your audience. Present our Marketing PowerPoint Templates because It is Aesthetically crafted by artistic young minds. Our PowerPoint Templates and Slides are designed to display your dexterity. Use our Business PowerPoint Templates because Our PowerPoint Templates and Slides are aesthetically designed to attract attention. We gaurantee that they will grab all the eyeballs you need. Download and present our Flow Charts PowerPoint Templates because Our PowerPoint Templates and Slides will let you Illuminate the road ahead to Pinpoint the important landmarks along the way.Use these PowerPoint slides for presentations relating to Boxes, business, button, catalog, chart, circle, company, cross, data, design, diagram, direction, document, financial, four, glossy, goals, graph, junction, management, market, marketing, model, multicolored, multiple, navigation, network, options, plan, presentation, process, purple, results, shiny, sphere, statistics. The prominent colors used in the PowerPoint template are Yellow, Gray, White. Professionals tell us our how to draw business process diagram circles PowerPoint templates backgrounds for slides are specially created by a professional team with vast experience. They diligently strive to come up with the right vehicle for your brilliant Ideas. Presenters tell us our data PowerPoint templates and PPT Slides are specially created by a professional team with vast experience. They diligently strive to come up with the right vehicle for your brilliant Ideas. The feedback we get is that our how to draw business process diagram circles PowerPoint templates backgrounds for slides provide you with a vast range of viable options. Select the appropriate ones and just fill in your text. Use our cross PowerPoint templates and PPT Slides are the best it can get when it comes to presenting. You can be sure our how to draw business process diagram circles PowerPoint templates backgrounds for slides will generate and maintain the level of interest you desire. They will create the impression you want to imprint on your audience. Customers tell us our data PowerPoint templates and PPT Slides are second to none. Our How To Draw Business Process Diagram Circles PowerPoint Templates Backgrounds For Slides don't fiddle about. They get into action right away.
Ppt Correlated Arrows PowerPoint Templates Even Line 7 Stages
PPT correlated arrows powerpoint templates even line 7 stages-This Diagram is used to illustrate how information will move between interrelated systems in the accomplishment of a given function, task or process. The visual description of this information flow with each given level showing how data is fed into a given process step and subsequently passed along at the completion of that step.-PPT correlated arrows powerpoint templates even line 7 stages-Aim, Arrow, Badge, Border, Color, Connection, Curve, Design, Direction, Download, Icon, Illustration, Indicator, Internet, Label, Link, Magenta, Mark, Next, Object, Orientation, Paper, Peeling, Pointer, Rounded, Set, Shadow, Shape, Sign Let your ideas grow in their minds. Our Ppt Correlated Arrows PowerPoint Templates Even Line 7 Stages will act like a fertilizer.
Ppt Correlated Circular Arrows PowerPoint 2010 Horizontal Line 7 Stages Templates
PPT correlated circular arrows powerpoint 2010 horizontal line 7 stages Templates-This Diagram is used to illustrate how information will move between interrelated systems in the accomplishment of a given function, task or process. The visual description of this information flow with each given level showing how data is fed into a given process step and subsequently passed along at the completion of that step.-PPT correlated circular arrows powerpoint 2010 horizontal line 7 stages Templates-Aim, Arrow, Badge, Border, Color, Connection, Curve, Design, Direction, Download, Icon, Illustration, Indicator, Internet, Label, Link, Magenta, Mark, Next, Object, Orientation, Paper, Peeling, Pointer, Rounded, Set, Shadow, Shape, Sign Pioneer changes with our Ppt Correlated Circular Arrows PowerPoint 2010 Horizontal Line 7 Stages Templates. Download without worries with our money back guaranteee.
Ppt Correlated Curved Arrows PowerPoint 2010 Regular Line 7 Stages Templates
PPT correlated curved arrows powerpoint 2010 regular line 7 stages Templates-This Diagram is used to illustrate how information will move between interrelated systems in the accomplishment of a given function, task or process. The visual description of this information flow with each given level showing how data is fed into a given process step and subsequently passed along at the completion of that step.-PPT correlated curved arrows powerpoint 2010 regular line 7 stages Templates-Aim, Arrow, Badge, Border, Color, Connection, Curve, Design, Direction, Download, Icon, Illustration, Indicator, Internet, Label, Link, Magenta, Mark, Next, Object, Orientation, Paper, Peeling, Pointer, Rounded, Set, Shadow, Shape, Sign Examine every deatail with our Ppt Correlated Curved Arrows PowerPoint 2010 Regular Line 7 Stages Templates. Put each element to the test.
Ppt Correlated PowerPoint Graphics Arrows Parallel Line 7 Stage Templates
PPT correlated powerpoint graphics arrows parallel line 7 stage Templates-This Diagram is used to illustrate how information will move between interrelated systems in the accomplishment of a given function, task or process. The visual description of this information flow with each given level showing how data is fed into a given process step and subsequently passed along at the completion of that step.-PPT correlated powerpoint graphics arrows parallel line 7 stage Templates-Aim, Arrow, Badge, Border, Color, Connection, Curve, Design, Direction, Download, Icon, Illustration, Indicator, Internet, Label, Link, Magenta, Mark, Next, Object, Orientation, Paper, Peeling, Pointer, Rounded, Set, Shadow, Shape, Sign Analyse the effect of different factors. Our Ppt Correlated PowerPoint Graphics Arrows Parallel Line 7 Stage Templates will give them equal attention.
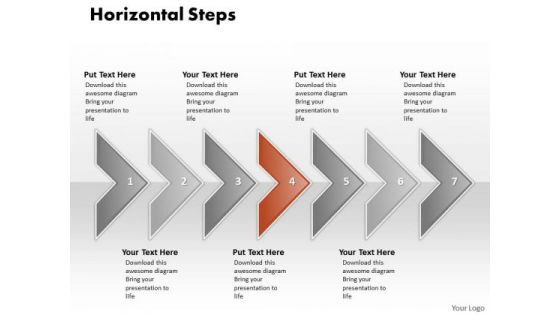
Ppt Correlated Shapes Arrows PowerPoint Horizontal Stages Templates
PPT correlated shapes arrows powerpoint horizontal stages Templates-This Diagram is used to illustrate how information will move between interrelated systems in the accomplishment of a given function, task or process. The visual description of this information flow with each given level showing how data is fed into a given process step and subsequently passed along at the completion of that step.-PPT correlated shapes arrows powerpoint horizontal stages Templates-Aim, Arrow, Badge, Border, Color, Connection, Curve, Design, Direction, Download, Icon, Illustration, Indicator, Internet, Label, Link, Magenta, Mark, Next, Object, Orientation, Paper, Peeling, Pointer, Rounded, Set, Shadow, Shape, Sign Enlist teams with our Ppt Correlated Shapes Arrows PowerPoint Horizontal Stages Templates. Download without worries with our money back guaranteee.
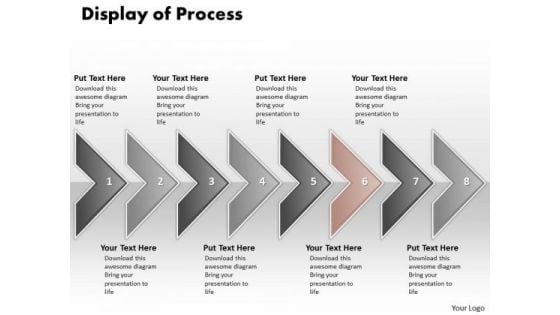
Ppt Display Of Marketing Process Using 8 Power Point Stage PowerPoint Templates
PPT display of marketing process using 8 power point stage PowerPoint Templates-This Diagram is used to illustrate how information will move between interrelated systems in the accomplishment of a given function, task or process. The visual description of this information flow with each given level showing how data is fed into a given process step and subsequently passed along at the completion of that step.-PPT display of marketing process using 8 power point stage PowerPoint Templates-Aim, Arrow, Badge, Border, Color, Connection, Curve, Design, Direction, Download, Icon, Illustration, Indicator, Internet, Label, Link, Magenta, Mark, Next, Object, Orientation, Paper, Peeling, Pointer, Rounded, Set, Shadow, Shape, Sign Solve problems with our Ppt Display Of Marketing Process Using 8 Power Point Stage PowerPoint Templates. Download without worries with our money back guaranteee.
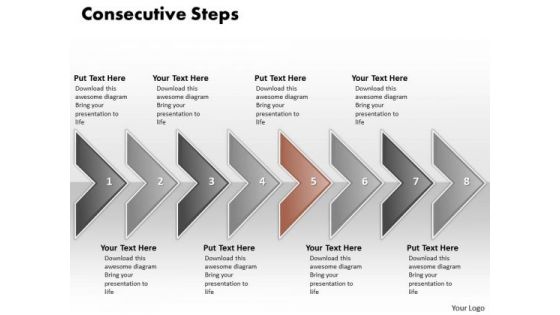
Ppt Eight Consecutive Practice The PowerPoint Macro Steps Of Marketing Process Templates
PPT eight consecutive practice the powerpoint macro steps of marketing process Templates-This Diagram is used to illustrate how information will move between interrelated systems in the accomplishment of a given function, task or process. The visual description of this information flow with each given level showing how data is fed into a given process step and subsequently passed along at the completion of that step.-PPT eight consecutive practice the powerpoint macro steps of marketing process Templates-Aim, Arrow, Badge, Border, Color, Connection, Curve, Design, Direction, Download, Icon, Illustration, Indicator, Internet, Label, Link, Magenta, Mark, Next, Object, Orientation, Paper, Peeling, Pointer, Rounded, Set, Shadow, Shape, Sign Let our Ppt Eight Consecutive Practice The PowerPoint Macro Steps Of Marketing Process Templates escort your thoughts. They will take them safely to their destination.
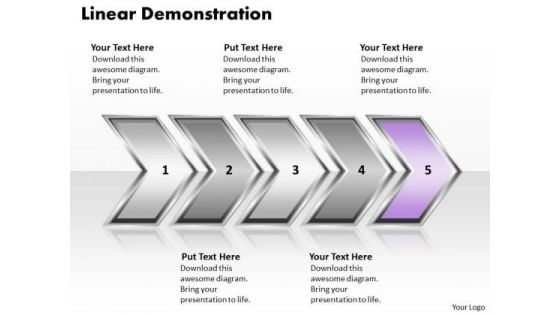
Ppt Linear Demonstration Of Process Using PowerPoint Graphics Arrows Templates
PPT linear demonstration of process using powerpoint graphics arrows Templates-This Diagram makes information accessible throughout the organization with a collective, visible view of critical data from different perspectives and providing the tools to upcoming business scenarios and plan for change. This image has been professionally designed to emphasize the concept of sequential process using curved arrows. It represents the Fifth arrow using purple color.-PPT linear demonstration of process using powerpoint graphics arrows Templates-Aim, Arrow, Arrowheads, Badge, Border, Click, Connection, Curve, Design, Direction, Download, Element, Fuchsia, Icon, Illustration, Indicator, Internet, Magenta, Mark, Object, Orientation, Pointer, Shadow, Shape, Sign Court the audience with our Ppt Linear Demonstration Of Process Using PowerPoint Graphics Arrows Templates. They will certainly be bowled over by you.
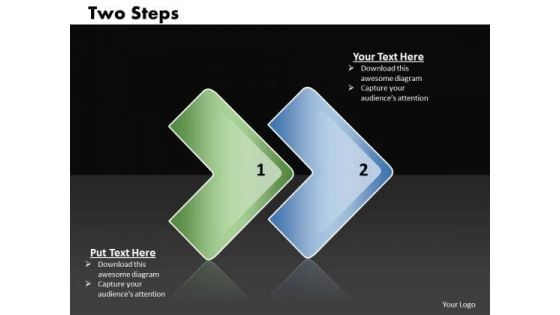
Ppt Linear Way To Represent 2 Practice The PowerPoint Macro Steps Templates
PPT linear way to represent 2 practice the powerpoint macro steps Templates-This Diagram makes information accessible throughout the organization with a collective, visible view of critical data from different perspectives and providing the tools to upcoming business scenarios and plan for change. This image has been professionally designed to emphasize the concept of sequential process using vertical arrows.-PPT linear way to represent 2 practice the powerpoint macro steps Templates-Aim, Arrow, Arrowheads, Badge, Border, Click, Connection, Curve, Design, Direction, Download, Element, Fuchsia, Icon, Illustration, Indicator, Internet, Magenta, Mark, Object, Orientation, Pointer, Shadow, Shape, Sign Our Ppt Linear Way To Represent 2 Practice The PowerPoint Macro Steps Templates are exceptionally customer-centric. They put clients before everything else.
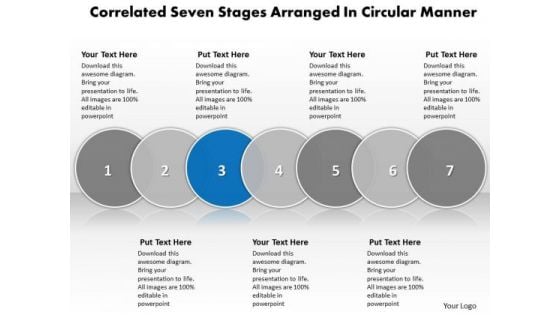
Ppt Correlated Seven Phase Diagram Business PowerPoint Templates
PPT correlated seven phase diagram Business PowerPoint Templates-This PowerPoint Diagram shows you the 3d Sequential Demonstration to explain Internet Marketing. It consists of Seven Layers explaining third here. Use this diagram as a method of graphically representing the flow of data as an information processing system. This is a good resource also for Marketing PowerPoint Diagrams or Business Backgrounds for PowerPoint or business presentation PowerPoint Diagram to master your strategic thinking.-PPT correlated seven phase diagram Business PowerPoint Templates-3, Advice, Analysis, Analyze, Answer, Area, Career, Chart, Choice, Circles, Concept, Determination, Diagram, Graph, Idea, Illustration, Intersect, Measurement, Opportunities, Options, Overlap, Overlapped, Overlapping, Passion, Passionate, Prioritize, Priority, Profession Falsify claims with our Ppt Correlated Seven Phase Diagram Business PowerPoint Templates. Just download, type and present.
Input Process Output Diagram Sample Of Ppt Presentation
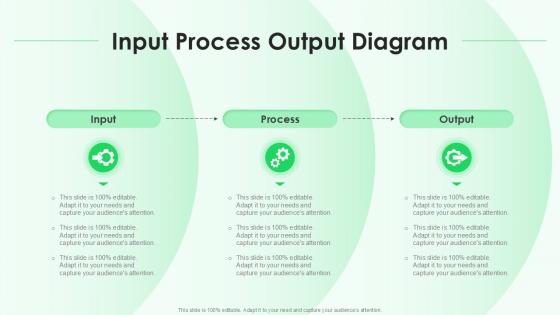
This Input Process Output Diagram Sample Of Ppt Presentation is perfect for any presentation, be it in front of clients or colleagues. It is a versatile and stylish solution for organizing your meetings. The XXXXXXXXXXXXXXXXXXXXXXXXXXXX features a modern design for your presentation meetings. The adjustable and customizable slides provide unlimited possibilities for acing up your presentation. Slidegeeks has done all the homework before launching the product for you. So, do not wait, grab the presentation templates today The Input Process Output Diagram sample PowerPoint presentation offers a clear and concise way to represent workflows, processes, and systems. This diagram effectively breaks down complex operations into three stages input, which represents resources or data process, which details how tasks or transformations occur and output, which highlights results or outcomes. Ideal for a variety of professional contexts, this visual tool helps audiences easily understand and follow the flow of information, making it a valuable addition to any impactful presentation.

Business Diagrams 3d Man With Com PowerPoint Templates
We present our business diagrams 3d man with com PowerPoint templates.Download and present our Technology PowerPoint Templates because Our PowerPoint Templates and Slides will provide weight to your words. They will bring out the depth of your thought process. Use our Business PowerPoint Templates because Our PowerPoint Templates and Slides are innately eco-friendly. Their high recall value negate the need for paper handouts. Present our Shapes PowerPoint Templates because Our PowerPoint Templates and Slides will let your team Walk through your plans. See their energy levels rise as you show them the way. Present our Process and Flows PowerPoint Templates because Our PowerPoint Templates and Slides will let you meet your Deadlines. Use our Leadership PowerPoint Templates because Our PowerPoint Templates and Slides are innately eco-friendly. Their high recall value negate the need for paper handouts.Use these PowerPoint slides for presentations relating to 3d, Com, Communication, Computer, Concepts, Connecting, Continent, Data, Discussion, Earth, Figure, Friendship, Global, Globe, Guy, Human, Icon, Idea, Information, Internet, Leadership, Male, Manager, Map, Medium, Men, Message, Network, Page, People, Person, Puppet, Render, Shape, Sign, Standing, Symbol, Text, Three-Dimensional, Web, White, World, Www. The prominent colors used in the PowerPoint template are Blue, Gray, White. Professionals tell us our business diagrams 3d man with com PowerPoint templates will generate and maintain the level of interest you desire. They will create the impression you want to imprint on your audience. The feedback we get is that our Computer PowerPoint templates and PPT Slides will make the presenter look like a pro even if they are not computer savvy. Professionals tell us our business diagrams 3d man with com PowerPoint templates will impress their bosses and teams. People tell us our Concepts PowerPoint templates and PPT Slides provide great value for your money. Be assured of finding the best projection to highlight your words. PowerPoint presentation experts tell us our business diagrams 3d man with com PowerPoint templates are incredible easy to use. You can be sure our Continent PowerPoint templates and PPT Slides will help you be quick off the draw. Just enter your specific text and see your points hit home. Construct organizations with our Business Diagrams 3d Man With Com PowerPoint Templates. Download without worries with our money back guaranteee.
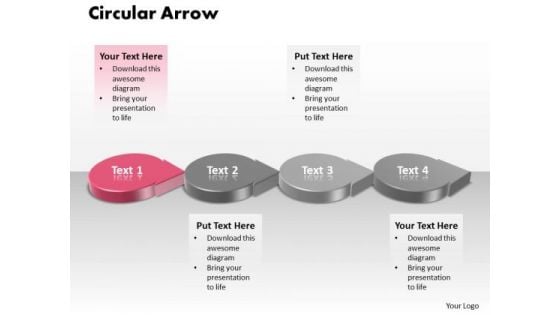
Ppt 3d Pink Circle PowerPoint Presentation Shaped Text Arrow Templates
PPT 3d pink circle powerpoint presentation shaped text arrow Templates-This PowerPoint Diagram shows the Round Description of steps which are involved in development Process. It includes four Steps. You can change color, size and orientation of any icon to your liking.-PPT 3d pink circle powerpoint presentation shaped text arrow Templates-3d, advertisement, advertising, air, arrow, blank, bus, car, collection, content, design, element, flyer, gas, icon, illustration, information, isolated, label, light, location, locator, map, mark, marker, marketing, needle, new, place, plane, point, pointer, promotion, promotional, rounded, set, shadow, sign, station, symbol, tag, text, tip, traffic, train, transport, urgent, vector Our Ppt 3d Pink Circle PowerPoint Presentation Shaped Text Arrow Templates help figure it out. Address the core aspects and dig up answers.
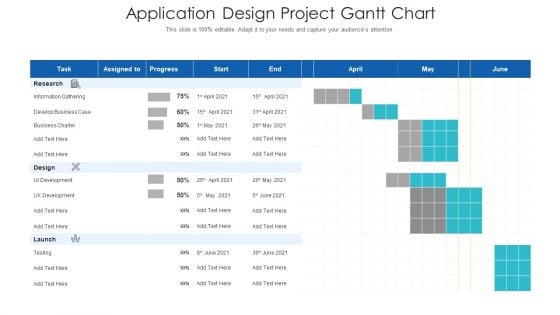
Application Design Project Gantt Chart Diagrams PDF
Your complex projects can be managed and organized simultaneously using this detailed application design project gantt chart diagrams pdf template. Track the milestones, tasks, phases, activities, and subtasks to get an updated visual of your project. Share your planning horizon and release plan with this well crafted presentation template. This exemplary template can be used to plot various dependencies to distinguish the tasks in the pipeline and their impact on the schedules and deadlines of the project. Apart from this, you can also share this visual presentation with your team members and stakeholders. It a resourceful tool that can be incorporated into your business structure. Therefore, download and edit it conveniently to add the data and statistics as per your requirement.
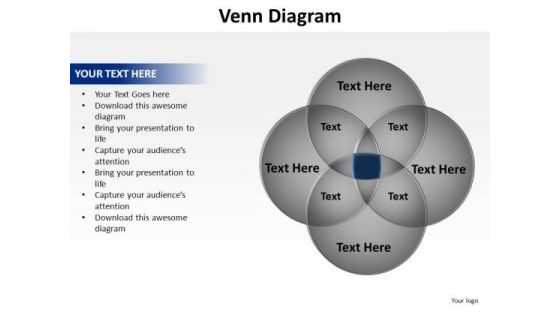
PowerPoint Layout Graphic Venn Diagram Ppt Template
PowerPoint Layout Graphic Venn Diagram PPT Template Business Power Points-The Venn graphic comprising interlinking circles geometrically demonstrate how various functions operating independently, to a large extent, are essentially interdependent. Amplify on this basic corporate concept and forefront the benefits of overlapping processes to arrive at common goals.-These amazing PowerPoint pre-designed slides and PowerPoint templates have been carefully created by our team of experts to help you impress your audience. Our stunning collection of Powerpoint slides are 100% editable and can easily fit in any PowerPoint presentations. By using these animations and graphics in PowerPoint and you can easily make professional presentations. Any text can be entered at any point in the PowerPoint template or slide. Just DOWNLOAD our awesome PowerPoint templates and you are ready to go. Put up the facts and figures on our PowerPoint Layout Graphic Venn Diagram Ppt Template. Display the data for everyone's consumption.
Ppt An Illustration Of Angry Emoticon Business Plan PowerPoint Business Templates
PPT an illustration of angry emoticon business plan powerpoint business Templates-This PowerPoint Diagram Illustrates all the Angry Emoticons which will help you to express exasperation, irritability, antagonism etc. .You can change color, size and orientation of any icon to your liking. -PPT an illustration of angry emoticon business plan powerpoint business Templates Our Ppt An Illustration Of Angry Emoticon Business Plan PowerPoint Business Templates provide an attractive backdrop. Your thoughts will be the main feature.
Ppt An Illustration Of Angry Emoticon Communication Skills PowerPoint Business Templates
PPT an illustration of angry emoticon communication skills powerpoint business Templates-This PowerPoint Diagram Illustrates all the Angry Emoticons which will help you to express exasperation, irritability, antagonism etc. .You can change color, size and orientation of any icon to your liking. -PPT an illustration of angry emoticon communication skills powerpoint business Templates Expand your organization with our Ppt An Illustration Of Angry Emoticon Communication Skills PowerPoint Business Templates. You will come out on top.
Ppt An Illustration Of Angry Emoticon Communication Skills PowerPoint Templates
PPT an illustration of angry emoticon communication skills powerpoint Templates-This PowerPoint Diagram Illustrates all the Angry Emoticons which will help you to express exasperation, irritability, antagonism etc. .You can change color, size and orientation of any icon to your liking. -PPT an illustration of angry emoticon communication skills powerpoint Templates Create an alliance that will endure for ages. Our Ppt An Illustration Of Angry Emoticon Communication Skills PowerPoint Templates will abide with you.
Ppt Naughty Emoticon Showing His Tongue Business Management PowerPoint Business Templates
PPT naughty emoticon showing his tongue business management powerpoint business Templates-Use this Naughty Emoticon PowerPoint Diagram to express beam, friendliness, tenderness, grin, laugh, amusement, delightful nature, happiness, pleasing nature, simper, and smirk. You can change color, size and orientation of any icon to your liking. -PPT naughty emoticon showing his tongue business management powerpoint business Templates Build on your charisma with our Ppt Naughty Emoticon Showing His Tongue Business Management PowerPoint Business Templates. Create a definite aura around you.
Ppt Naughty Emoticon Showing His Tongue Business Management PowerPoint Templates
PPT naughty emoticon showing his tongue business management powerpoint Templates-Use this Naughty Emoticon PowerPoint Diagram to express beam, friendliness, tenderness, grin, laugh, amusement, delightful nature, happiness, pleasing nature, simper, and smirk. You can change color, size and orientation of any icon to your liking. -PPT naughty emoticon showing his tongue business management powerpoint Templates Get the nod for your plans with our Ppt Naughty Emoticon Showing His Tongue Business Management PowerPoint Templates. You will be at the top of your game.
Ppt Naughty Emoticon Showing His Tongue Time Management PowerPoint Templates
PPT naughty emoticon showing his tongue time management powerpoint Templates-Use this Naughty Emoticon PowerPoint Diagram to express beam, friendliness, tenderness, grin, laugh, amusement, delightful nature, happiness, pleasing nature, simper, and smirk. You can change color, size and orientation of any icon to your liking. -PPT naughty emoticon showing his tongue time management powerpoint Templates Simplify presentations with our Ppt Naughty Emoticon Showing His Tongue Time Management PowerPoint Templates. Download without worries with our money back guaranteee.
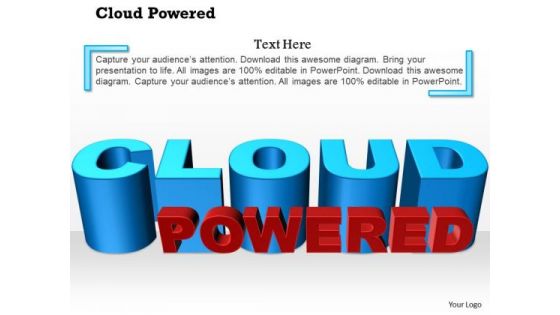
1 Three Dimensional Cloud Powered Text Show On Flat Surface Ppt Slide
This image slide explains the concept of cloud computing. This innovative image slide has been designed with graphic of cloud powered text and text space. You may change color, size and orientation of any icon to your liking. Use this image slide, in your presentations to express views on cloud computing benefits like backup, storage, networking, communication and technology. Create interesting presentations using this image slide.
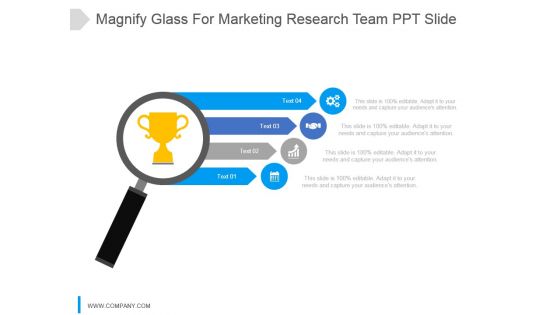
Magnify Glass For Marketing Research Team Ppt Slide
This is a magnify glass for marketing research team ppt slide. This is a four stage process. The stages in this process are search, icons, magnify, marketing, glass.
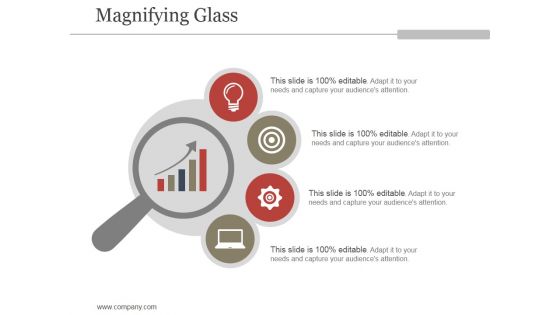
Magnifying Glass Ppt PowerPoint Presentation Inspiration
This is a magnifying glass ppt powerpoint presentation inspiration. This is a one stage process. The stages in this process are magnifier, icons, strategy, business, research.
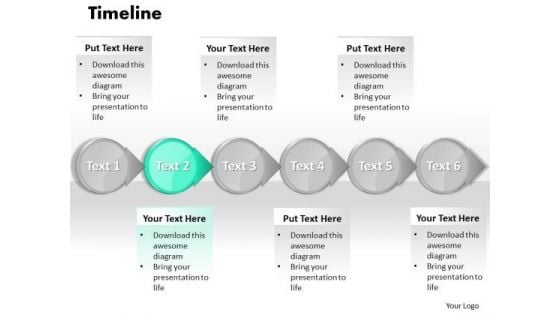
Ppt PowerPoint Slide Numbers A Procedure Or Timeline 2007 Templates
PPT powerpoint slide numbers a procedure or timeline 2007 Templates-This image represents the concept of structured analysis technique that employs a set of visual representations of the data that moves through the organization. This template is specifically designed to highlight you points. Organize your thoughts and illuminate your ideas accordingly-PPT powerpoint slide numbers a procedure or timeline 2007 Templates-Account, Arrow, Arrows, Away, Box, Business, Chart, Choice, Choose, Concept, Concepts, Consultation, Corporate, Design, Diagram, Direction, Elements, Flow, Follow, Follows, Future, Group, Grow, Increase, Lines, Many, Month, Move, Past, Period, Phase, Project, Report, Rise, Row, Step, Success, Text, Time, Timeline, Today, Up, Way, Ways, Work, Year Close deals with our Ppt PowerPoint Slide Numbers A Procedure Or Timeline 2007 Templates. Download without worries with our money back guaranteee.

Interoperability Software Testing Plan Phase Of PDCA Cycle Microsoft PDF
This slide depicts the planning phase of the PDCA cycle in which the main focus of the test condition should be on the flow of data through all of the applications. Welcome to our selection of the Interoperability Software Testing Plan Phase Of PDCA Cycle Microsoft PDF. These are designed to help you showcase your creativity and bring your sphere to life. Planning and Innovation are essential for any business that is just starting out. This collection contains the designs that you need for your everyday presentations. All of our PowerPoints are 100 percent editable, so you can customize them to suit your needs. This multi purpose template can be used in various situations. Grab these presentation templates today.

Key Texting And SMS Marketing Statistics Ppt PowerPoint Presentation Diagram Graph Charts PDF
This slide represents the statistical data to help marketers analyze the benefits and importance of SMS marketing for business growth and development. It includes key SMS marketing statistics such as click through rates, opt-ins etc. Get a simple yet stunning designed Key Texting And SMS Marketing Statistics Ppt PowerPoint Presentation Diagram Graph Charts PDF. It is the best one to establish the tone in your meetings. It is an excellent way to make your presentations highly effective. So, download this PPT today from Slidegeeks and see the positive impacts. Our easy to edit Key Texting And SMS Marketing Statistics Ppt PowerPoint Presentation Diagram Graph Charts PDF can be your go to option for all upcoming conferences and meetings. So, what are you waiting for Grab this template today.
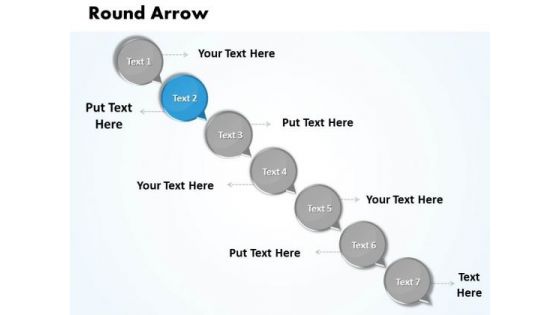
Ppt Text Circles With Circular Arrows PowerPoint 2007 Steps Business Templates
PPT text circles with circular arrows powerpoint 2007 steps Business Templates-Use this layout to define the outcome and the multiple possibilities in a way that is used in calculation of probabilities, genetics and strategic reasoning. This chart visualizes the concept of process steps, reoccurrences and components or of your company structure or product features. You can change color, size and orientation of any icon to your liking. -PPT text circles with circular arrows powerpoint 2007 steps Business Templates-Add, Aqua, Arrows, Badges, Bar, Blend, Blue, Bright, Bubbles, Buttons, Caution, Circle, Drop, Elements, Glossy, Glowing, Graphic, Heart, Help, Icons, Idea, Illustration, Navigation, Oblong, Plus, Round, Service, Shadow, Shiny, Sign, Speech, Squares Make use of the facilities our Ppt Text Circles With Circular Arrows PowerPoint 2007 Steps Business Templates offer. You will be delighted with the choices available.
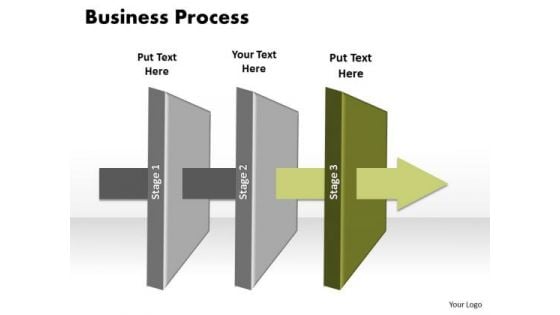
Ppt Layer 3 Free Business PowerPoint Slide Text Linear Process Templates
PPT layer 3 free business powerpoint slide text linear process Templates-Use this PowerPoint Diagram to represent the layers of Linear Process model Graphically. It shows the third stage in an animated manner through an Arrow. You can change color, size and orientation of any icon to your liking.-PPT layer 3 free business powerpoint slide text linear process Templates-3d, Air, Arrow, Art, Business, Chart, Clip, Clipart, Cooling, Diagram, Drip, Drop, Dry, Energy, Eps10, Evaporate, Evaporating, Evaporation, Graphic, Heat, Icon, Illustration, Isolated, Isometric, Layers, Material, Moisture, Process Dont ignore the perils of a boring presentation. Liven it up with our Ppt Layer 3 Free Business PowerPoint Slide Text Linear Process Templates. Make sure your presentation gets the attention it deserves.
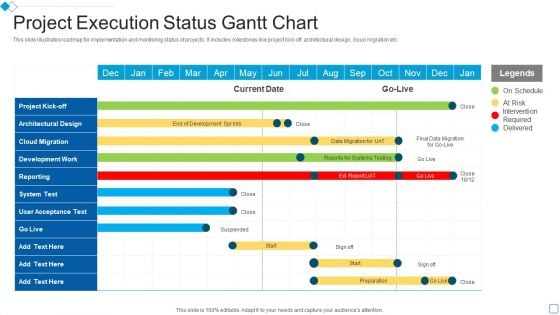
Project Execution Status Gantt Chart Slides PDF
This slide illustrates roadmap for implementation and monitoring status of projects. It includes milestones like project kick off, architectural design, cloud migration etc.Your complex projects can be managed and organized simultaneously using this detailed Project Execution Status Gantt Chart Slides PDF template. Track the milestones, tasks, phases, activities, and subtasks to get an updated visual of your project. Share your planning horizon and release plan with this well crafted presentation template. This exemplary template can be used to plot various dependencies to distinguish the tasks in the pipeline and their impact on the schedules and deadlines of the project. Apart from this, you can also share this visual presentation with your team members and stakeholders. It a resourceful tool that can be incorporated into your business structure. Therefore, download and edit it conveniently to add the data and statistics as per your requirement
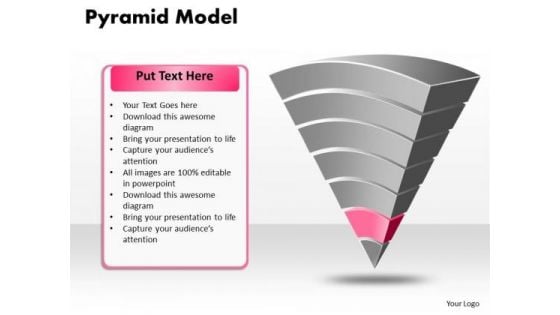
Ppt Pyramid Business Model Spider Diagram PowerPoint Template Templates
PPT pyramid business model spider diagram powerpoint template Templates-You can divide a Pyramid Chart into segments for illustrating proportion. Pyramid chart is an effective way of displaying information you can edit text, color, shade and style as per you need. This pyramid chart is perhaps the most widely used statistical chart in the business world.-PPT pyramid business model spider diagram powerpoint template Templates-Business, Chart, Color, Data Pyramid, Diagram, Graph, Group, Growth, Hierarchy, Illustration, Layer, Layered, Layered Pyramid, Level, Multicolor, Object, Performance, Presentation, Progress, Pyramid, Rank, Seam, Segment, Set, Shape, Stage, Structure, Symbol, System, Top Dismiss the blues with our Ppt Pyramid Business Model Spider Diagram PowerPoint Template Templates. Your thoughts will dispel all despondency.
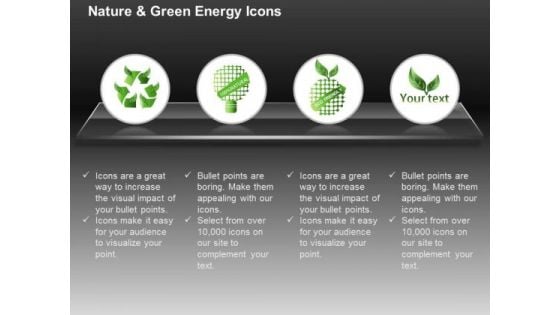
Ecology And Green Energy With Eco Friendly Text Ppt Slides Graphics
This power point template has icons of eco friendly theme. Terms such as green, natural and organic can be explained with this slide. Use these icons to make unique presentation for green energy related topics.
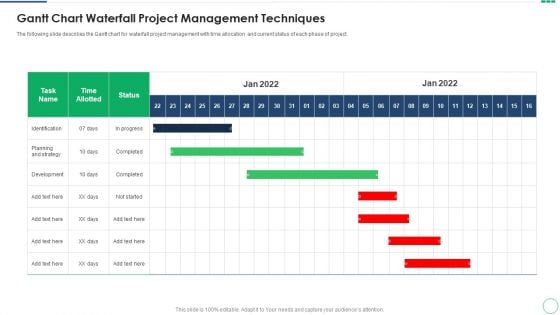
Gantt Chart Waterfall Project Management Techniques Topics PDF
The following slide describes the Gantt chart for waterfall project management with time allocation and current status of each phase of project. Your complex projects can be managed and organized simultaneously using this detailed Gantt Chart Waterfall Project Management Techniques Topics PDF template. Track the milestones, tasks, phases, activities, and subtasks to get an updated visual of your project. Share your planning horizon and release plan with this well crafted presentation template. This exemplary template can be used to plot various dependencies to distinguish the tasks in the pipeline and their impact on the schedules and deadlines of the project. Apart from this, you can also share this visual presentation with your team members and stakeholders. It a resourceful tool that can be incorporated into your business structure. Therefore, download and edit it conveniently to add the data and statistics as per your requirement.
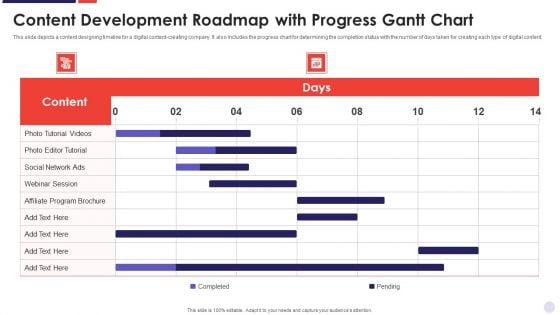
Content Development Roadmap With Progress Gantt Chart Summary PDF
Your complex projects can be managed and organized simultaneously using this detailed Content Development Roadmap With Progress Gantt Chart Summary PDF template. Track the milestones, tasks, phases, activities, and subtasks to get an updated visual of your project. Share your planning horizon and release plan with this well crafted presentation template. This exemplary template can be used to plot various dependencies to distinguish the tasks in the pipeline and their impact on the schedules and deadlines of the project. Apart from this, you can also share this visual presentation with your team members and stakeholders. It a resourceful tool that can be incorporated into your business structure. Therefore, download and edit it conveniently to add the data and statistics as per your requirement.
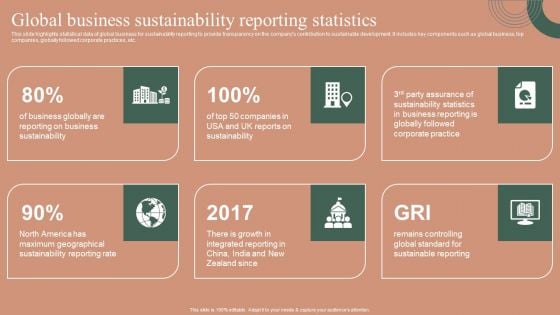
Global Business Sustainability Reporting Statistics Themes PDF
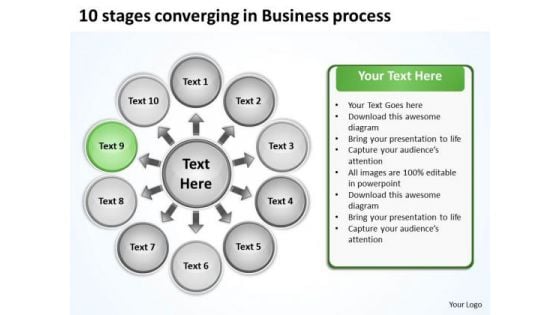
10 Stages Converging Business PowerPoint Theme Process Radial Chart Slides
We present our 10 stages converging business powerpoint theme process Radial Chart Slides.Use our Arrows PowerPoint Templates because they help to lay the base of your trend of thought. Use our Flow charts PowerPoint Templates because this template with an image of helps you chart the course of your presentation. Download and present our Business PowerPoint Templates because the majestic tiger lord of all it surveys.It exudes power even when it is in repose. Present our Process and Flows PowerPoint Templates because you can Take your team along by explaining your plans. Present our Circle charts PowerPoint Templates because it is the time to bond with family, friends, colleagues and any other group of your choice.Use these PowerPoint slides for presentations relating to Business, chart, circle, colors, concept, corporate, cycle, data, design, detail, development, diagram, engineering, graphic, ideas, illustration, image, implement, implementation, life, lifecycle, management, model, objects, organization, plan, process, product, professional, project, quality, schema, shape, stack, stage, steps, strategy, structure, success, symbol. The prominent colors used in the PowerPoint template are Yellow, Black, Gray. You can be sure our 10 stages converging business powerpoint theme process Radial Chart Slides are Luxuriant. Presenters tell us our corporate PowerPoint templates and PPT Slides are effectively colour coded to prioritise your plans They automatically highlight the sequence of events you desire. We assure you our 10 stages converging business powerpoint theme process Radial Chart Slides are Efficient. Customers tell us our data PowerPoint templates and PPT Slides are One-of-a-kind. Presenters tell us our 10 stages converging business powerpoint theme process Radial Chart Slides are Stunning. You can be sure our cycle PowerPoint templates and PPT Slides are Lush. Get rid of the blues with our 10 Stages Converging Business PowerPoint Theme Process Radial Chart Slides. Let hope and happiness flow into your mind.
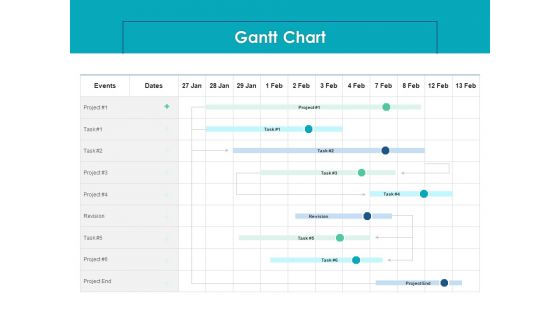
Housing Mortgage Proposal Gantt Chart Ppt Pictures Brochure PDF
Your complex projects can be managed and organized simultaneously using this detailed housing mortgage proposal gantt chart ppt pictures brochure pdf template. Track the milestones, tasks, phases, activities, and subtasks to get an updated visual of your project. Share your planning horizon and release plan with this well crafted presentation template. This exemplary template can be used to plot various dependencies to distinguish the tasks in the pipeline and their impact on the schedules and deadlines of the project. Apart from this, you can also share this visual presentation with your team members and stakeholders. It a resourceful tool that can be incorporated into your business structure. Therefore, download and edit it conveniently to add the data and statistics as per your requirement.
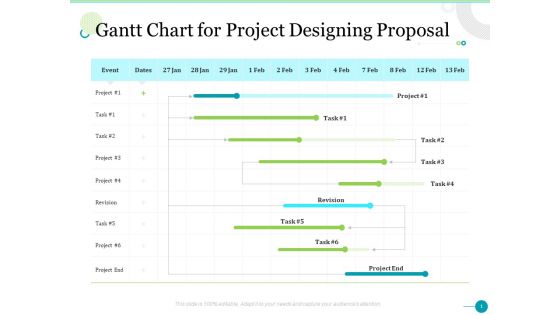
Gantt Chart For Project Designing Proposal Ppt Inspiration Pictures PDF
Your complex projects can be managed and organized simultaneously using this detailed gantt chart for project designing proposal ppt inspiration pictures pdf template. Track the milestones, tasks, phases, activities, and subtasks to get an updated visual of your project. Share your planning horizon and release plan with this well crafted presentation template. This exemplary template can be used to plot various dependencies to distinguish the tasks in the pipeline and their impact on the schedules and deadlines of the project. Apart from this, you can also share this visual presentation with your team members and stakeholders. It a resourceful tool that can be incorporated into your business structure. Therefore, download and edit it conveniently to add the data and statistics as per your requirement.
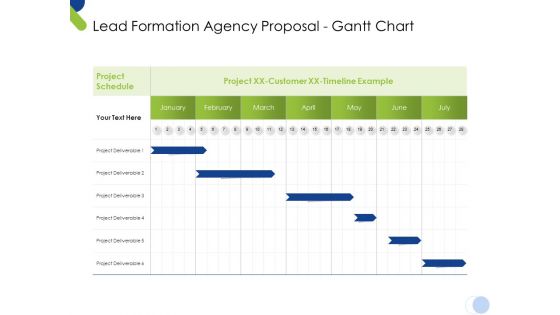
Lead Formation Agency Proposal Gantt Chart Ppt Summary Infographics PDF
Your complex projects can be managed and organized simultaneously using this detailed lead formation agency proposal gantt chart ppt summary infographics pdf template. Track the milestones, tasks, phases, activities, and subtasks to get an updated visual of your project. Share your planning horizon and release plan with this well crafted presentation template. This exemplary template can be used to plot various dependencies to distinguish the tasks in the pipeline and their impact on the schedules and deadlines of the project. Apart from this, you can also share this visual presentation with your team members and stakeholders. It a resourceful tool that can be incorporated into your business structure. Therefore, download and edit it conveniently to add the data and statistics as per your requirement.
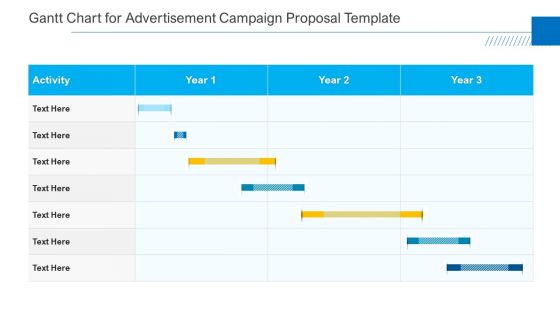
Gantt Chart For Advertisement Campaign Proposal Template Summary PDF
Your complex projects can be managed and organized simultaneously using this detailed gantt chart for advertisement campaign proposal template summary pdf template. Track the milestones, tasks, phases, activities, and subtasks to get an updated visual of your project. Share your planning horizon and release plan with this well crafted presentation template. This exemplary template can be used to plot various dependencies to distinguish the tasks in the pipeline and their impact on the schedules and deadlines of the project. Apart from this, you can also share this visual presentation with your team members and stakeholders. It a resourceful tool that can be incorporated into your business structure. Therefore, download and edit it conveniently to add the data and statistics as per your requirement.

Gantt Chart For Better Project Problem Administration Ideas PDF
Your complex projects can be managed and organized simultaneously using this detailed gantt chart for better project problem administration ideas pdf template. Track the milestones, tasks, phases, activities, and subtasks to get an updated visual of your project. Share your planning horizon and release plan with this well crafted presentation template. This exemplary template can be used to plot various dependencies to distinguish the tasks in the pipeline and their impact on the schedules and deadlines of the project. Apart from this, you can also share this visual presentation with your team members and stakeholders. It a resourceful tool that can be incorporated into your business structure. Therefore, download and edit it conveniently to add the data and statistics as per your requirement.
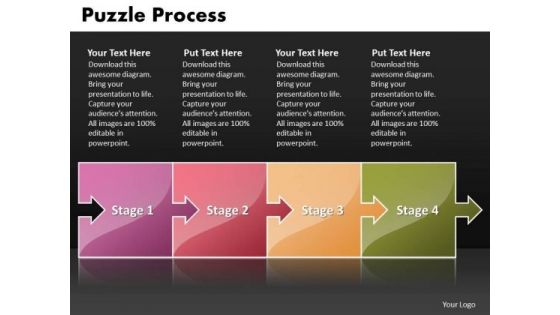
Ppt Puzzle Process Social Network PowerPoint Backgrounds Startegy Templates
PPT puzzle process social network powerpoint backgrounds startegy Templates-Illustrate your ideas and imprint them in the minds of your team with this template. Feel the buzz as they comprehend your plan to get the entire act together. Watch their eyes light up with enthusiasm as they see the dream emerge.-PPT puzzle process social network powerpoint backgrounds startegy Templates-abstract action attach box business center chain chart color communication concept connection cube cycle data diagram flow globe horizontal idea illustration individual information interaction jigsaw join link merge missing opportunity part people piece pieces process puzzle relation relationship search shape silhouette success Illustrate your plans for greater efficiency with our Ppt Puzzle Process Social Network PowerPoint Backgrounds Startegy Templates. Work out how to get more for less.
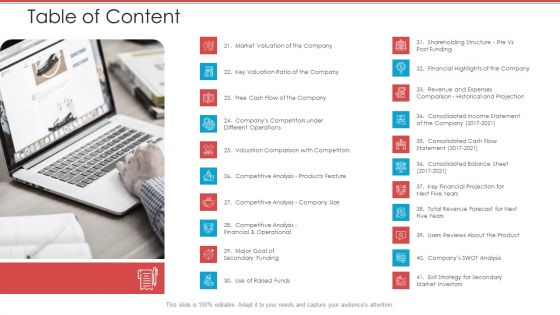
Cash Market Investor Deck Table Of Content Products Ppt Summary Design Inspiration PDF
Presenting cash market investor deck table of content ppt icon backgrounds pdf to provide visual cues and insights. Share and navigate important information on one stage that need your due attention. This template can be used to pitch topics like financial overview, products and services, business model, organization chart, markets size. In addtion, this PPT design contains high resolution images, graphics, etc, that are easily editable and available for immediate download.
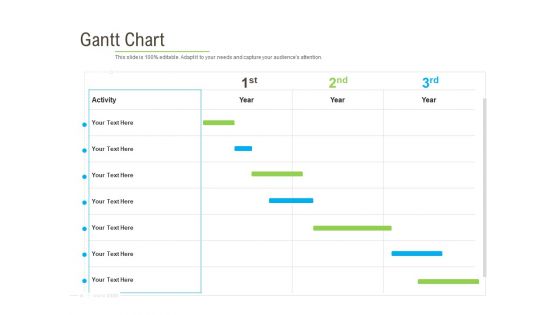
Rapid Innovation In HR Technology Space Gantt Chart Graphics PDF
Your complex projects can be managed and organized simultaneously using this detailed rapid innovation in hr technology space gantt chart graphics pdf template. Track the milestones, tasks, phases, activities, and subtasks to get an updated visual of your project. Share your planning horizon and release plan with this well crafted presentation template. This exemplary template can be used to plot various dependencies to distinguish the tasks in the pipeline and their impact on the schedules and deadlines of the project. Apart from this, you can also share this visual presentation with your team members and stakeholders. It a resourceful tool that can be incorporated into your business structure. Therefore, download and edit it conveniently to add the data and statistics as per your requirement.
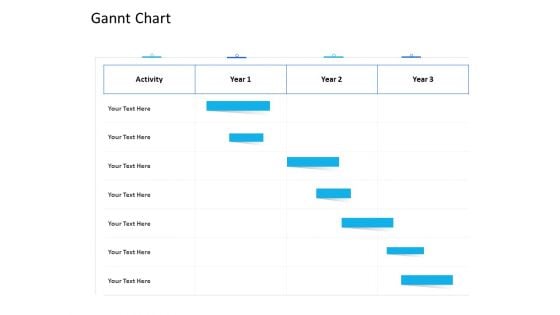
Organization Manpower Management Technology Gannt Chart Infographics PDF
Your complex projects can be managed and organized simultaneously using this detailed organization manpower management technology gannt chart infographics pdf template. Track the milestones, tasks, phases, activities, and subtasks to get an updated visual of your project. Share your planning horizon and release plan with this well crafted presentation template. This exemplary template can be used to plot various dependencies to distinguish the tasks in the pipeline and their impact on the schedules and deadlines of the project. Apart from this, you can also share this visual presentation with your team members and stakeholders. It a resourceful tool that can be incorporated into your business structure. Therefore, download and edit it conveniently to add the data and statistics as per your requirement.
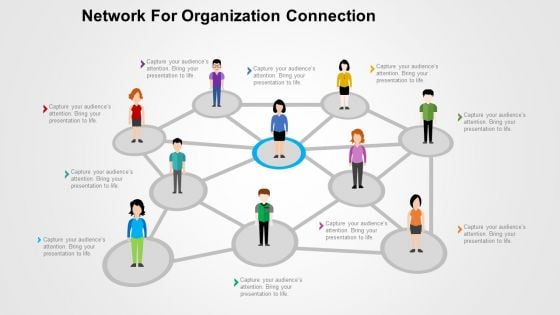
Network For Organization Connection Powerpoint Templates
Feel free to use this professionally created PowerPoint slide for various purposes. The person in the center can be used to portray a leader, a boss, a chairman, a CEO or any other important person. The PowerPoint template can be used to depict a society. This template is exactly what is needed to explain concepts of communication within society. It can be used to portray interconnection amongst various departments or professionals in an organization or business. This slide can be effectively used to explain the concept of networking or bonding. The web of people can be used to show a team and the responsibilities shared. This can also be used to show the order in which ideas, orders or any data is shared in a firm. This can be your answer to explain the working or hierarchy of your business to your clients or customers.
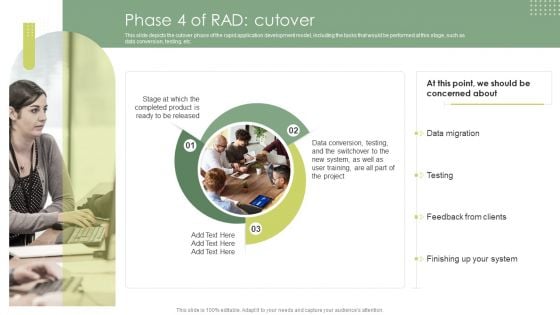
Phase 4 Of Rad Cutover Rapid Application Building RAB Model Graphics PDF
This slide depicts the cutover phase of the rapid application development model, including the tasks that would be performed at this stage, such as data conversion, testing, etc.Are you in need of a template that can accommodate all of your creative concepts This one is crafted professionally and can be altered to fit any style. Use it with Google Slides or PowerPoint. Include striking photographs, symbols, depictions, and other visuals. Fill, move around, or remove text boxes as desired. Test out color palettes and font mixtures. Edit and save your work, or work with colleagues. Download Phase 4 Of Rad Cutover Rapid Application Building RAB Model Graphics PDF and observe how to make your presentation outstanding. Give an impeccable presentation to your group and make your presentation unforgettable.
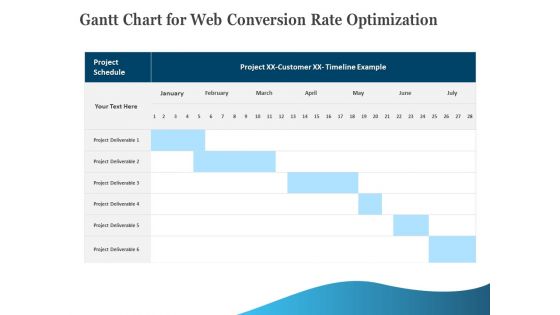
Gantt Chart For Web Conversion Rate Optimization Download PDF
Your complex projects can be managed and organized simultaneously using this detailed gantt chart for web conversion rate optimization download pdf template. Track the milestones, tasks, phases, activities, and subtasks to get an updated visual of your project. Share your planning horizon and release plan with this well-crafted presentation template. This exemplary template can be used to plot various dependencies to distinguish the tasks in the pipeline and their impact on the schedules and deadlines of the project. Apart from this, you can also share this visual presentation with your team members and stakeholders. It a resourceful tool that can be incorporated into your business structure. Therefore, download and edit it conveniently to add the data and statistics as per your requirement.
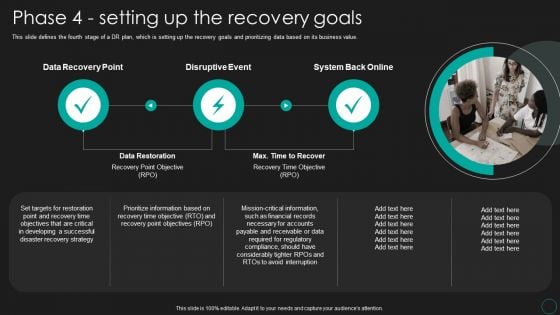
Disaster Recovery Strategic Plan Phase 4 Setting Up The Recovery Goals Topics PDF
This slide defines the fourth stage of a DR plan, which is setting up the recovery goals and prioritizing data based on its business value. Do you have to make sure that everyone on your team knows about any specific topic I yes, then you should give Disaster Recovery Strategic Plan Phase 4 Setting Up The Recovery Goals Topics PDF a try. Our experts have put a lot of knowledge and effort into creating this impeccable Disaster Recovery Strategic Plan Phase 4 Setting Up The Recovery Goals Topics PDF. You can use this template for your upcoming presentations, as the slides are perfect to represent even the tiniest detail. You can download these templates from the Slidegeeks website and these are easy to edit. So grab these today.

Impact Of Cyber Security Policies And Practices Ppt PowerPoint Presentation Diagram Graph Charts PDF
The following slide focuses on drafting cyber security policies to manage data control and breach. It mainly includes elements such as impact of existing cyber safety policies, mitigation actions, Presenting this PowerPoint presentation, titled Impact Of Cyber Security Policies And Practices Ppt PowerPoint Presentation Diagram Graph Charts PDF, with topics curated by our researchers after extensive research. This editable presentation is available for immediate download and provides attractive features when used. Download now and captivate your audience. Presenting this Impact Of Cyber Security Policies And Practices Ppt PowerPoint Presentation Diagram Graph Charts PDF. Our researchers have carefully researched and created these slides with all aspects taken into consideration. This is a completely customizable Impact Of Cyber Security Policies And Practices Ppt PowerPoint Presentation Diagram Graph Charts PDF that is available for immediate downloading. Download now and make an impact on your audience. Highlight the attractive features available with our PPTs.
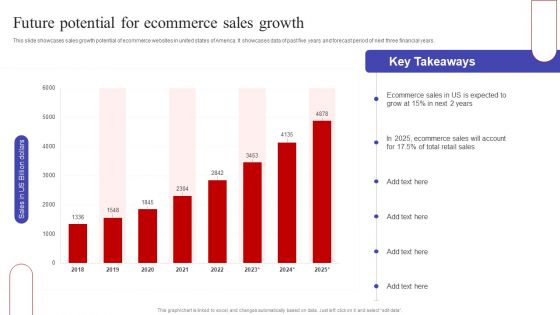
Future Potential For Ecommerce Sales Growth Ppt PowerPoint Presentation Diagram Graph Charts PDF
This slide showcases sales growth potential of ecommerce websites in united states of America. It showcases data of past five years and forecast period of next three financial years. Here you can discover an assortment of the finest PowerPoint and Google Slides templates. With these templates, you can create presentations for a variety of purposes while simultaneously providing your audience with an eye catching visual experience. Download Future Potential For Ecommerce Sales Growth Ppt PowerPoint Presentation Diagram Graph Charts PDF to deliver an impeccable presentation. These templates will make your job of preparing presentations much quicker, yet still, maintain a high level of quality. Slidegeeks has experienced researchers who prepare these templates and write high quality content for you. Later on, you can personalize the content by editing the Future Potential For Ecommerce Sales Growth Ppt PowerPoint Presentation Diagram Graph Charts PDF.
Ppt Seven PowerPoint Slide Numbers Continuous Flow Theme Of Process Templates
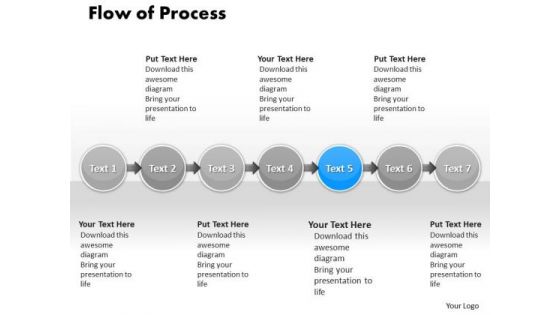
PPT seven powerpoint slide numbers continuous flow theme of process Templates-This Diagram is used to illustrate how information will move between interrelated systems in the accomplishment of a given function, task or process. The visual description of this information flow with each given level showing how data is fed into a given process step and subsequently passed along at the completion of that step.-PPT seven powerpoint slide numbers continuous flow theme of process Templates-Analysis, Arrow, Background, Backlink, Circle, Code, Content, Diagram, Engine, Illustration, Keyword, Optimization, Offpage, Process, Search, Template, Tracking, Unpage, Violet, Visitor, Concentrate on the assignment with our Ppt Seven PowerPoint Slide Numbers Continuous Flow Theme Of Process Templates. Don't give a fig about other issues.
4 Stages Diverging Arrows Activity Diagram Cycle Chart PowerPoint Templates
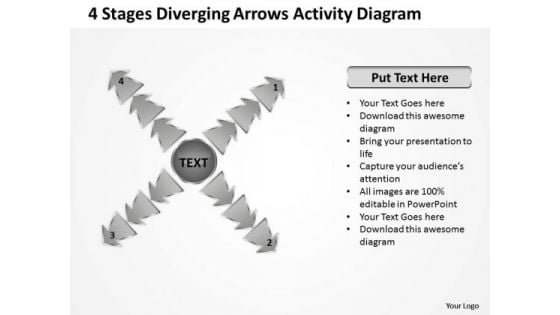
We present our 4 stages diverging arrows activity diagram Cycle Chart PowerPoint templates.Present our Flow Charts PowerPoint Templates because you are buzzing with ideas. Download our Business PowerPoint Templates because everybody knows The world over it is a priority for many. Along with it there are so many oppurtunities waiting to be utilised. Download our Process and Flows PowerPoint Templates because let your words be the drops of wisdom spreading knowledge and peace like ripples through the expectant minds of your devoted followers. Download and present our Success PowerPoint Templates because you can Adorn them with your ideas and thoughts. Download and present our Arrows PowerPoint Templates because you are aware of some pitfalls ahead where you need to be cautious not to overrun and avoid a stall.Use these PowerPoint slides for presentations relating to Business, Chart, Circle, Cyclic, Data, Diagram, Financial, Goal, Graph, Illustration, Info, Information, Marketing, Model, Option, Part, Pie, Presentation, Process, Result, Sphere, Statistics. The prominent colors used in the PowerPoint template are Black, Gray, White. People tell us our 4 stages diverging arrows activity diagram Cycle Chart PowerPoint templates are Nice. Customers tell us our Financial PowerPoint templates and PPT Slides are Vintage. People tell us our 4 stages diverging arrows activity diagram Cycle Chart PowerPoint templates are Nostalgic. Professionals tell us our Data PowerPoint templates and PPT Slides are Luxuriant. Customers tell us our 4 stages diverging arrows activity diagram Cycle Chart PowerPoint templates are Attractive. Use our Cyclic PowerPoint templates and PPT Slides will make the presenter look like a pro even if they are not computer savvy. The adaptability of our 4 Stages Diverging Arrows Activity Diagram Cycle Chart PowerPoint Templates is a fact. They will align with your bidding.
Renting Car Services Proposal Gantt Chart Ppt Outline PDF
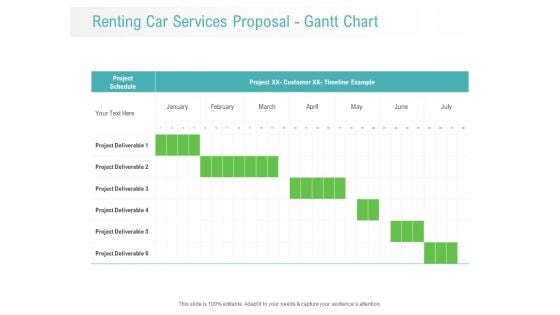
Manage your complex projects and organize them simultaneously with this detailed Gantt Chart PowerPoint Template. Track your milestones, tasks, phases, activities, subtasks amongst other constituents that will give you an updated visual of your project. Reflect your planning horizon and capture your release plan in one view with this Gantt Chart PowerPoint presentation template. You can plot various dependencies directly on this Timeline PowerPoint Presentation Layout to see which tasks are still in the pipeline and how the delays in them are impacting the schedules and deadlines of the project. Apart from this, you can also share this updated visual with your team members and stakeholders, thus making it a resourceful tool to be incorporated in your business structure. Not only this but also the editable layout of this slide helps you to add your data and statistics at your convenience.

Shipment Proposal For Corporate Occasion Gantt Chart Introduction PDF
Manage your complex projects and organize them simultaneously with this detailed Gantt Chart PowerPoint Template. Track your milestones, tasks, phases, activities, subtasks amongst other constituents that will give you an updated visual of your project. Reflect your planning horizon and capture your release plan in one view with this Gantt Chart PowerPoint presentation template. You can plot various dependencies directly on this Timeline PowerPoint Presentation Layout to see which tasks are still in the pipeline and how the delays in them are impacting the schedules and deadlines of the project. Apart from this, you can also share this updated visual with your team members and stakeholders, thus making it a resourceful tool to be incorporated in your business structure. Not only this but also the editable layout of this slide helps you to add your data and statistics at your convenience.
Cinematography Project Proposal Gantt Chart Ppt Model Slides PDF
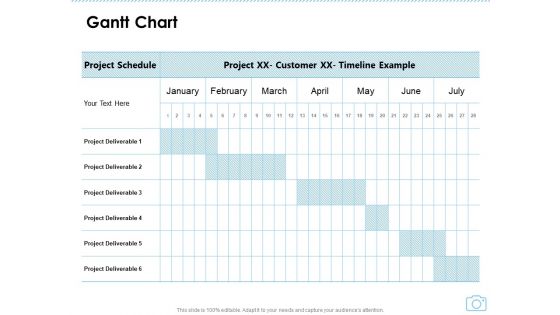
Your complex projects can be managed and organized simultaneously using this detailed cinematography project proposal gantt chart ppt model slides pdf template. Track the milestones, tasks, phases, activities, and subtasks to get an updated visual of your project. Share your planning horizon and release plan with this well crafted presentation template. This exemplary template can be used to plot various dependencies to distinguish the tasks in the pipeline and their impact on the schedules and deadlines of the project. Apart from this, you can also share this visual presentation with your team members and stakeholders. It a resourceful tool that can be incorporated into your business structure. Therefore, download and edit it conveniently to add the data and statistics as per your requirement.

 Home
Home