Data Icon
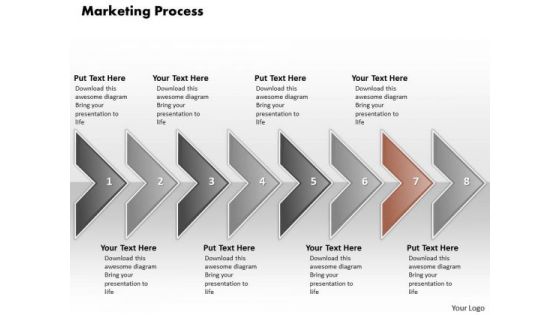
Ppt Illustration Of Marketing Process Using 8 State Diagram PowerPoint Templates
PPT illustration of marketing process using 8 state diagram PowerPoint Templates-This Diagram is used to illustrate how information will move between interrelated systems in the accomplishment of a given function, task or process. The visual description of this information flow with each given level showing how data is fed into a given process step and subsequently passed along at the completion of that step.-PPT illustration of marketing process using 8 state diagram PowerPoint Templates-Aim, Arrow, Badge, Border, Color, Connection, Curve, Design, Direction, Download, Icon, Illustration, Indicator, Internet, Label, Link, Magenta, Mark, Next, Object, Orientation, Paper, Peeling, Pointer, Rounded, Set, Shadow, Shape, Sign Have an exhilirating event with our Ppt Illustration Of Marketing Process Using 8 State Diagram PowerPoint Templates. Feel a surge of excitement in you.
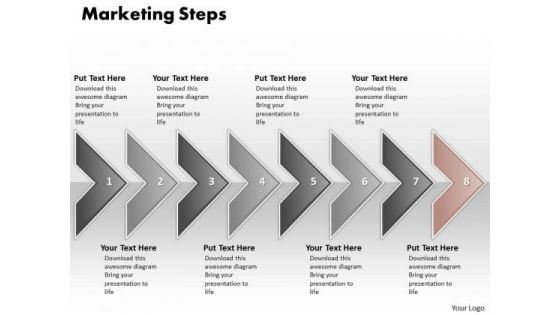
Ppt PowerPoint Slide Numbers Of Marketing Process Using 8 State Diagram Templates
PPT powerpoint slide numbers of marketing process using 8 state diagram Templates-Our compelling template consists of a design of arrow in straight line. This Diagram is used to illustrate how information will move between interrelated systems in the accomplishment of a given function, task or process. The visual description of this information flow with each given level showing how data is fed into a given process step and subsequently passed along at the completion of that step.-PPT powerpoint slide numbers of marketing process using 8 state diagram Templates-Aim, Arrow, Badge, Border, Color, Connection, Curve, Design, Direction, Download, Icon, Illustration, Indicator, Internet, Label, Link, Magenta, Mark, Next, Object, Orientation, Paper, Peeling, Pointer, Rounded, Set, Shadow, Shape, Sign Put in our Ppt PowerPoint Slide Numbers Of Marketing Process Using 8 State Diagram Templates as the catalyst. Churn out new equations with your ideas.
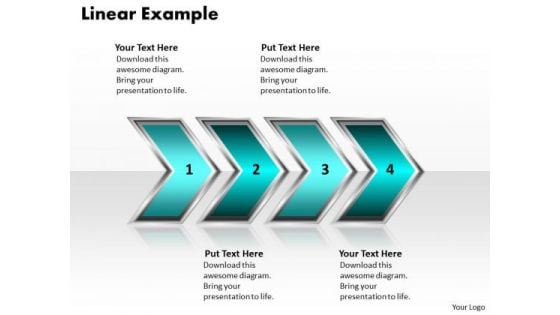
Ppt Linear Example Of Process Using 4 Stages PowerPoint Templates
PPT linear example of process using 4 stages PowerPoint Templates-This PowerPoint Diagram shows you the 3d Sequential Demonstration to explain Internet Marketing. It consists of Seven Layers explaining fourth here. Use this diagram as a method of graphically representing the flow of data as an information processing system. This is a good resource also for Marketing PowerPoint Diagrams or Business Backgrounds for PowerPoint or business presentation PowerPoint Diagram to master your strategic thinking.-PPT linear example of process using 4 stages PowerPoint Templates-Aim, Arrow, Arrowheads, Badge, Border, Click, Connection, Curve, Design, Direction, Download, Element, Fuchsia, Icon, Illustration, Indicator, Internet, Magenta, Mark, Object, Orientation, Pointer, Shadow, Shape, Sign List your strategy succinctly with our Ppt Linear Example Of Process Using 4 Stages PowerPoint Templates. You will be at the top of your game.
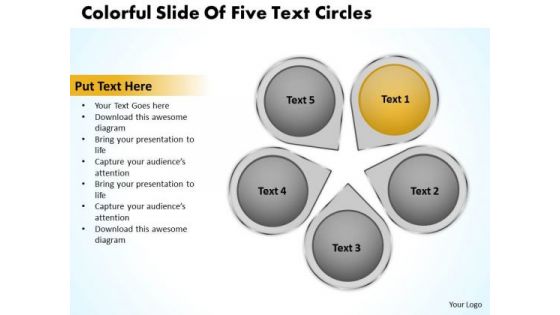
How To Draw Business Process Diagram Circles PowerPoint Templates Backgrounds For Slides
We present our how to draw business process diagram circles PowerPoint templates backgrounds for slides.Present our Circle Charts PowerPoint Templates because You are an avid believer in ethical practices. Highlight the benefits that accrue with our PowerPoint Templates and Slides. Download and present our Ring Charts PowerPoint Templates because Our PowerPoint Templates and Slides will generate and maintain the level of interest you desire. They will create the impression you want to imprint on your audience. Present our Marketing PowerPoint Templates because It is Aesthetically crafted by artistic young minds. Our PowerPoint Templates and Slides are designed to display your dexterity. Use our Business PowerPoint Templates because Our PowerPoint Templates and Slides are aesthetically designed to attract attention. We gaurantee that they will grab all the eyeballs you need. Download and present our Flow Charts PowerPoint Templates because Our PowerPoint Templates and Slides will let you Illuminate the road ahead to Pinpoint the important landmarks along the way.Use these PowerPoint slides for presentations relating to Boxes, business, button, catalog, chart, circle, company, cross, data, design, diagram, direction, document, financial, four, glossy, goals, graph, junction, management, market, marketing, model, multicolored, multiple, navigation, network, options, plan, presentation, process, purple, results, shiny, sphere, statistics. The prominent colors used in the PowerPoint template are Yellow, Gray, White. Professionals tell us our how to draw business process diagram circles PowerPoint templates backgrounds for slides are specially created by a professional team with vast experience. They diligently strive to come up with the right vehicle for your brilliant Ideas. Presenters tell us our data PowerPoint templates and PPT Slides are specially created by a professional team with vast experience. They diligently strive to come up with the right vehicle for your brilliant Ideas. The feedback we get is that our how to draw business process diagram circles PowerPoint templates backgrounds for slides provide you with a vast range of viable options. Select the appropriate ones and just fill in your text. Use our cross PowerPoint templates and PPT Slides are the best it can get when it comes to presenting. You can be sure our how to draw business process diagram circles PowerPoint templates backgrounds for slides will generate and maintain the level of interest you desire. They will create the impression you want to imprint on your audience. Customers tell us our data PowerPoint templates and PPT Slides are second to none. Our How To Draw Business Process Diagram Circles PowerPoint Templates Backgrounds For Slides don't fiddle about. They get into action right away.
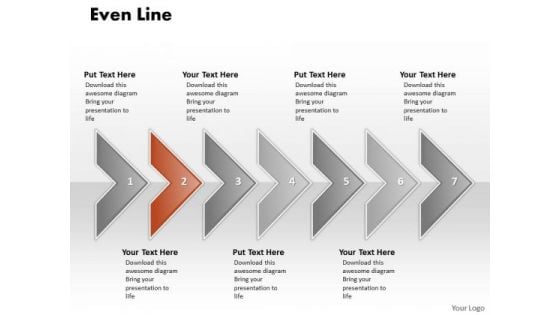
Ppt Correlated Arrows PowerPoint Templates Even Line 7 Stages
PPT correlated arrows powerpoint templates even line 7 stages-This Diagram is used to illustrate how information will move between interrelated systems in the accomplishment of a given function, task or process. The visual description of this information flow with each given level showing how data is fed into a given process step and subsequently passed along at the completion of that step.-PPT correlated arrows powerpoint templates even line 7 stages-Aim, Arrow, Badge, Border, Color, Connection, Curve, Design, Direction, Download, Icon, Illustration, Indicator, Internet, Label, Link, Magenta, Mark, Next, Object, Orientation, Paper, Peeling, Pointer, Rounded, Set, Shadow, Shape, Sign Let your ideas grow in their minds. Our Ppt Correlated Arrows PowerPoint Templates Even Line 7 Stages will act like a fertilizer.
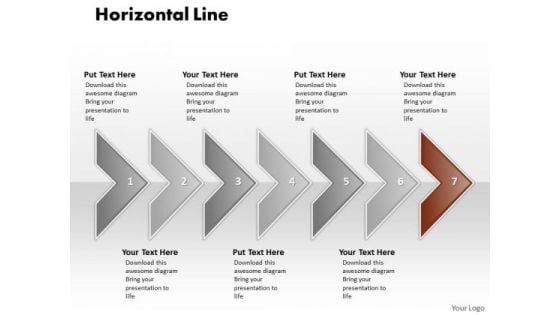
Ppt Correlated Circular Arrows PowerPoint 2010 Horizontal Line 7 Stages Templates
PPT correlated circular arrows powerpoint 2010 horizontal line 7 stages Templates-This Diagram is used to illustrate how information will move between interrelated systems in the accomplishment of a given function, task or process. The visual description of this information flow with each given level showing how data is fed into a given process step and subsequently passed along at the completion of that step.-PPT correlated circular arrows powerpoint 2010 horizontal line 7 stages Templates-Aim, Arrow, Badge, Border, Color, Connection, Curve, Design, Direction, Download, Icon, Illustration, Indicator, Internet, Label, Link, Magenta, Mark, Next, Object, Orientation, Paper, Peeling, Pointer, Rounded, Set, Shadow, Shape, Sign Pioneer changes with our Ppt Correlated Circular Arrows PowerPoint 2010 Horizontal Line 7 Stages Templates. Download without worries with our money back guaranteee.
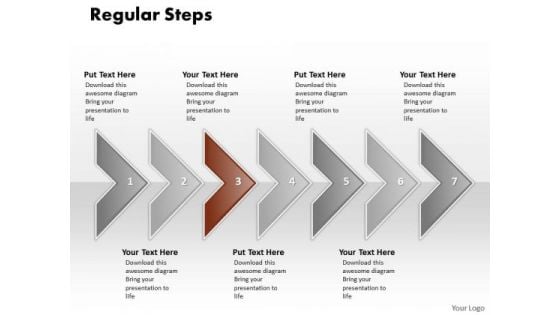
Ppt Correlated Curved Arrows PowerPoint 2010 Regular Line 7 Stages Templates
PPT correlated curved arrows powerpoint 2010 regular line 7 stages Templates-This Diagram is used to illustrate how information will move between interrelated systems in the accomplishment of a given function, task or process. The visual description of this information flow with each given level showing how data is fed into a given process step and subsequently passed along at the completion of that step.-PPT correlated curved arrows powerpoint 2010 regular line 7 stages Templates-Aim, Arrow, Badge, Border, Color, Connection, Curve, Design, Direction, Download, Icon, Illustration, Indicator, Internet, Label, Link, Magenta, Mark, Next, Object, Orientation, Paper, Peeling, Pointer, Rounded, Set, Shadow, Shape, Sign Examine every deatail with our Ppt Correlated Curved Arrows PowerPoint 2010 Regular Line 7 Stages Templates. Put each element to the test.
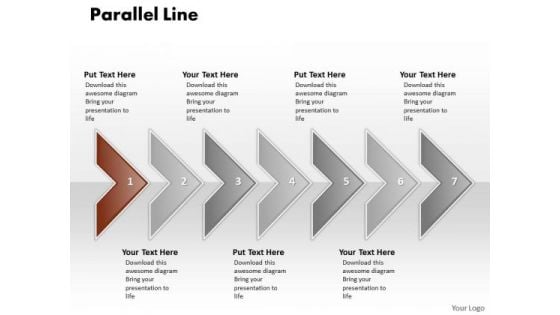
Ppt Correlated PowerPoint Graphics Arrows Parallel Line 7 Stage Templates
PPT correlated powerpoint graphics arrows parallel line 7 stage Templates-This Diagram is used to illustrate how information will move between interrelated systems in the accomplishment of a given function, task or process. The visual description of this information flow with each given level showing how data is fed into a given process step and subsequently passed along at the completion of that step.-PPT correlated powerpoint graphics arrows parallel line 7 stage Templates-Aim, Arrow, Badge, Border, Color, Connection, Curve, Design, Direction, Download, Icon, Illustration, Indicator, Internet, Label, Link, Magenta, Mark, Next, Object, Orientation, Paper, Peeling, Pointer, Rounded, Set, Shadow, Shape, Sign Analyse the effect of different factors. Our Ppt Correlated PowerPoint Graphics Arrows Parallel Line 7 Stage Templates will give them equal attention.
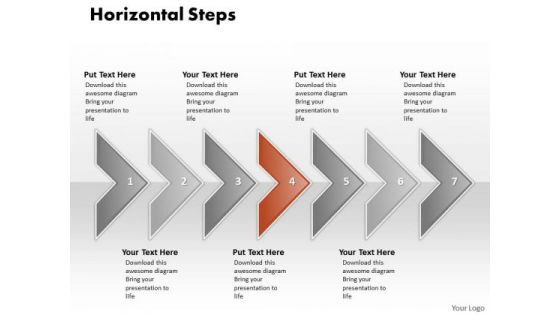
Ppt Correlated Shapes Arrows PowerPoint Horizontal Stages Templates
PPT correlated shapes arrows powerpoint horizontal stages Templates-This Diagram is used to illustrate how information will move between interrelated systems in the accomplishment of a given function, task or process. The visual description of this information flow with each given level showing how data is fed into a given process step and subsequently passed along at the completion of that step.-PPT correlated shapes arrows powerpoint horizontal stages Templates-Aim, Arrow, Badge, Border, Color, Connection, Curve, Design, Direction, Download, Icon, Illustration, Indicator, Internet, Label, Link, Magenta, Mark, Next, Object, Orientation, Paper, Peeling, Pointer, Rounded, Set, Shadow, Shape, Sign Enlist teams with our Ppt Correlated Shapes Arrows PowerPoint Horizontal Stages Templates. Download without worries with our money back guaranteee.
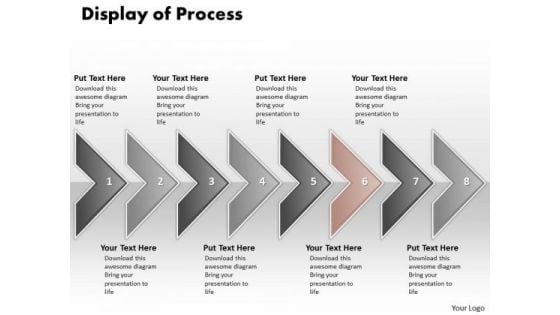
Ppt Display Of Marketing Process Using 8 Power Point Stage PowerPoint Templates
PPT display of marketing process using 8 power point stage PowerPoint Templates-This Diagram is used to illustrate how information will move between interrelated systems in the accomplishment of a given function, task or process. The visual description of this information flow with each given level showing how data is fed into a given process step and subsequently passed along at the completion of that step.-PPT display of marketing process using 8 power point stage PowerPoint Templates-Aim, Arrow, Badge, Border, Color, Connection, Curve, Design, Direction, Download, Icon, Illustration, Indicator, Internet, Label, Link, Magenta, Mark, Next, Object, Orientation, Paper, Peeling, Pointer, Rounded, Set, Shadow, Shape, Sign Solve problems with our Ppt Display Of Marketing Process Using 8 Power Point Stage PowerPoint Templates. Download without worries with our money back guaranteee.
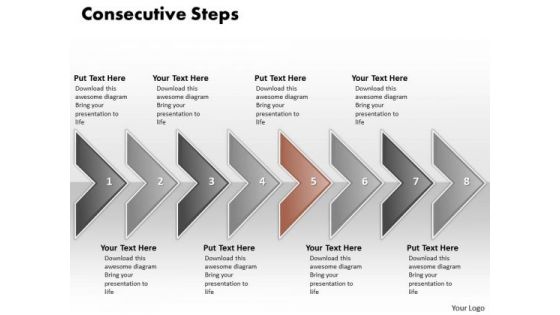
Ppt Eight Consecutive Practice The PowerPoint Macro Steps Of Marketing Process Templates
PPT eight consecutive practice the powerpoint macro steps of marketing process Templates-This Diagram is used to illustrate how information will move between interrelated systems in the accomplishment of a given function, task or process. The visual description of this information flow with each given level showing how data is fed into a given process step and subsequently passed along at the completion of that step.-PPT eight consecutive practice the powerpoint macro steps of marketing process Templates-Aim, Arrow, Badge, Border, Color, Connection, Curve, Design, Direction, Download, Icon, Illustration, Indicator, Internet, Label, Link, Magenta, Mark, Next, Object, Orientation, Paper, Peeling, Pointer, Rounded, Set, Shadow, Shape, Sign Let our Ppt Eight Consecutive Practice The PowerPoint Macro Steps Of Marketing Process Templates escort your thoughts. They will take them safely to their destination.
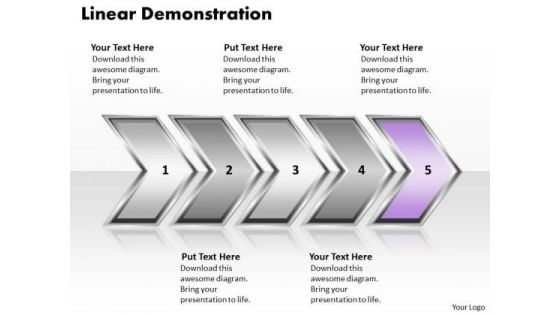
Ppt Linear Demonstration Of Process Using PowerPoint Graphics Arrows Templates
PPT linear demonstration of process using powerpoint graphics arrows Templates-This Diagram makes information accessible throughout the organization with a collective, visible view of critical data from different perspectives and providing the tools to upcoming business scenarios and plan for change. This image has been professionally designed to emphasize the concept of sequential process using curved arrows. It represents the Fifth arrow using purple color.-PPT linear demonstration of process using powerpoint graphics arrows Templates-Aim, Arrow, Arrowheads, Badge, Border, Click, Connection, Curve, Design, Direction, Download, Element, Fuchsia, Icon, Illustration, Indicator, Internet, Magenta, Mark, Object, Orientation, Pointer, Shadow, Shape, Sign Court the audience with our Ppt Linear Demonstration Of Process Using PowerPoint Graphics Arrows Templates. They will certainly be bowled over by you.
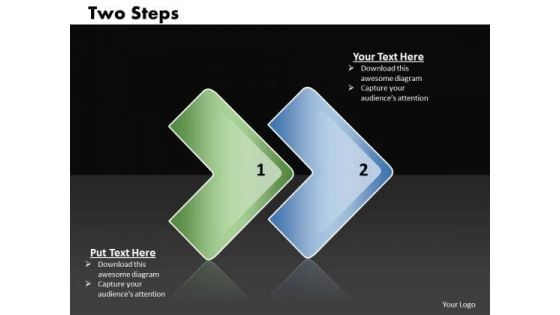
Ppt Linear Way To Represent 2 Practice The PowerPoint Macro Steps Templates
PPT linear way to represent 2 practice the powerpoint macro steps Templates-This Diagram makes information accessible throughout the organization with a collective, visible view of critical data from different perspectives and providing the tools to upcoming business scenarios and plan for change. This image has been professionally designed to emphasize the concept of sequential process using vertical arrows.-PPT linear way to represent 2 practice the powerpoint macro steps Templates-Aim, Arrow, Arrowheads, Badge, Border, Click, Connection, Curve, Design, Direction, Download, Element, Fuchsia, Icon, Illustration, Indicator, Internet, Magenta, Mark, Object, Orientation, Pointer, Shadow, Shape, Sign Our Ppt Linear Way To Represent 2 Practice The PowerPoint Macro Steps Templates are exceptionally customer-centric. They put clients before everything else.
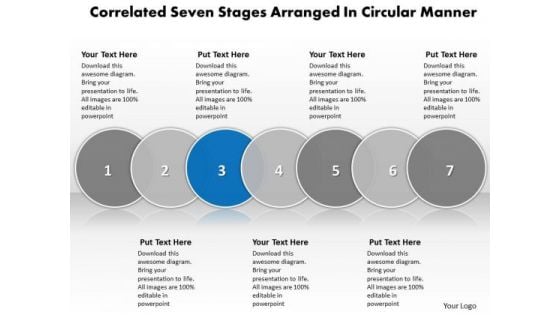
Ppt Correlated Seven Phase Diagram Business PowerPoint Templates
PPT correlated seven phase diagram Business PowerPoint Templates-This PowerPoint Diagram shows you the 3d Sequential Demonstration to explain Internet Marketing. It consists of Seven Layers explaining third here. Use this diagram as a method of graphically representing the flow of data as an information processing system. This is a good resource also for Marketing PowerPoint Diagrams or Business Backgrounds for PowerPoint or business presentation PowerPoint Diagram to master your strategic thinking.-PPT correlated seven phase diagram Business PowerPoint Templates-3, Advice, Analysis, Analyze, Answer, Area, Career, Chart, Choice, Circles, Concept, Determination, Diagram, Graph, Idea, Illustration, Intersect, Measurement, Opportunities, Options, Overlap, Overlapped, Overlapping, Passion, Passionate, Prioritize, Priority, Profession Falsify claims with our Ppt Correlated Seven Phase Diagram Business PowerPoint Templates. Just download, type and present.
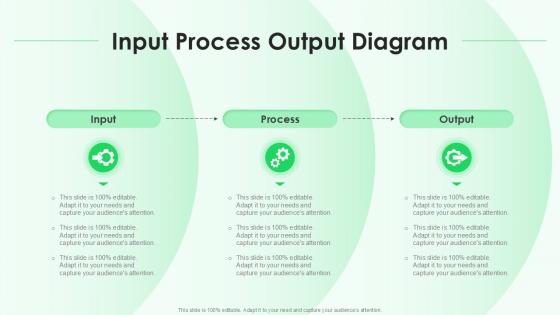
Input Process Output Diagram Sample Of Ppt Presentation
This Input Process Output Diagram Sample Of Ppt Presentation is perfect for any presentation, be it in front of clients or colleagues. It is a versatile and stylish solution for organizing your meetings. The XXXXXXXXXXXXXXXXXXXXXXXXXXXX features a modern design for your presentation meetings. The adjustable and customizable slides provide unlimited possibilities for acing up your presentation. Slidegeeks has done all the homework before launching the product for you. So, do not wait, grab the presentation templates today The Input Process Output Diagram sample PowerPoint presentation offers a clear and concise way to represent workflows, processes, and systems. This diagram effectively breaks down complex operations into three stages input, which represents resources or data process, which details how tasks or transformations occur and output, which highlights results or outcomes. Ideal for a variety of professional contexts, this visual tool helps audiences easily understand and follow the flow of information, making it a valuable addition to any impactful presentation.
Business Diagrams 3d Man With Com PowerPoint Templates
We present our business diagrams 3d man with com PowerPoint templates.Download and present our Technology PowerPoint Templates because Our PowerPoint Templates and Slides will provide weight to your words. They will bring out the depth of your thought process. Use our Business PowerPoint Templates because Our PowerPoint Templates and Slides are innately eco-friendly. Their high recall value negate the need for paper handouts. Present our Shapes PowerPoint Templates because Our PowerPoint Templates and Slides will let your team Walk through your plans. See their energy levels rise as you show them the way. Present our Process and Flows PowerPoint Templates because Our PowerPoint Templates and Slides will let you meet your Deadlines. Use our Leadership PowerPoint Templates because Our PowerPoint Templates and Slides are innately eco-friendly. Their high recall value negate the need for paper handouts.Use these PowerPoint slides for presentations relating to 3d, Com, Communication, Computer, Concepts, Connecting, Continent, Data, Discussion, Earth, Figure, Friendship, Global, Globe, Guy, Human, Icon, Idea, Information, Internet, Leadership, Male, Manager, Map, Medium, Men, Message, Network, Page, People, Person, Puppet, Render, Shape, Sign, Standing, Symbol, Text, Three-Dimensional, Web, White, World, Www. The prominent colors used in the PowerPoint template are Blue, Gray, White. Professionals tell us our business diagrams 3d man with com PowerPoint templates will generate and maintain the level of interest you desire. They will create the impression you want to imprint on your audience. The feedback we get is that our Computer PowerPoint templates and PPT Slides will make the presenter look like a pro even if they are not computer savvy. Professionals tell us our business diagrams 3d man with com PowerPoint templates will impress their bosses and teams. People tell us our Concepts PowerPoint templates and PPT Slides provide great value for your money. Be assured of finding the best projection to highlight your words. PowerPoint presentation experts tell us our business diagrams 3d man with com PowerPoint templates are incredible easy to use. You can be sure our Continent PowerPoint templates and PPT Slides will help you be quick off the draw. Just enter your specific text and see your points hit home. Construct organizations with our Business Diagrams 3d Man With Com PowerPoint Templates. Download without worries with our money back guaranteee.
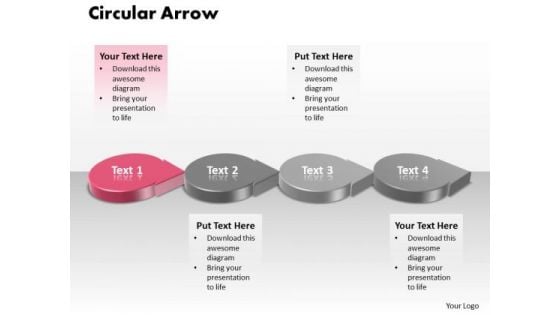
Ppt 3d Pink Circle PowerPoint Presentation Shaped Text Arrow Templates
PPT 3d pink circle powerpoint presentation shaped text arrow Templates-This PowerPoint Diagram shows the Round Description of steps which are involved in development Process. It includes four Steps. You can change color, size and orientation of any icon to your liking.-PPT 3d pink circle powerpoint presentation shaped text arrow Templates-3d, advertisement, advertising, air, arrow, blank, bus, car, collection, content, design, element, flyer, gas, icon, illustration, information, isolated, label, light, location, locator, map, mark, marker, marketing, needle, new, place, plane, point, pointer, promotion, promotional, rounded, set, shadow, sign, station, symbol, tag, text, tip, traffic, train, transport, urgent, vector Our Ppt 3d Pink Circle PowerPoint Presentation Shaped Text Arrow Templates help figure it out. Address the core aspects and dig up answers.
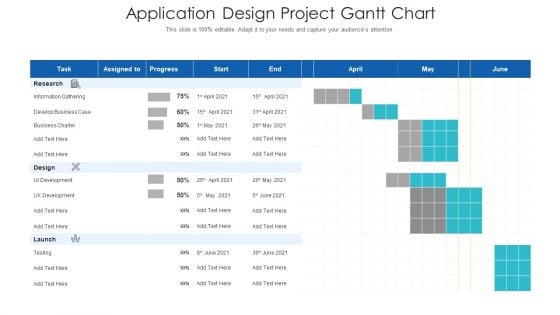
Application Design Project Gantt Chart Diagrams PDF
Your complex projects can be managed and organized simultaneously using this detailed application design project gantt chart diagrams pdf template. Track the milestones, tasks, phases, activities, and subtasks to get an updated visual of your project. Share your planning horizon and release plan with this well crafted presentation template. This exemplary template can be used to plot various dependencies to distinguish the tasks in the pipeline and their impact on the schedules and deadlines of the project. Apart from this, you can also share this visual presentation with your team members and stakeholders. It a resourceful tool that can be incorporated into your business structure. Therefore, download and edit it conveniently to add the data and statistics as per your requirement.
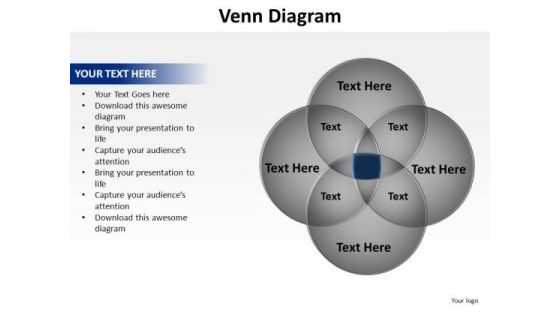
PowerPoint Layout Graphic Venn Diagram Ppt Template
PowerPoint Layout Graphic Venn Diagram PPT Template Business Power Points-The Venn graphic comprising interlinking circles geometrically demonstrate how various functions operating independently, to a large extent, are essentially interdependent. Amplify on this basic corporate concept and forefront the benefits of overlapping processes to arrive at common goals.-These amazing PowerPoint pre-designed slides and PowerPoint templates have been carefully created by our team of experts to help you impress your audience. Our stunning collection of Powerpoint slides are 100% editable and can easily fit in any PowerPoint presentations. By using these animations and graphics in PowerPoint and you can easily make professional presentations. Any text can be entered at any point in the PowerPoint template or slide. Just DOWNLOAD our awesome PowerPoint templates and you are ready to go. Put up the facts and figures on our PowerPoint Layout Graphic Venn Diagram Ppt Template. Display the data for everyone's consumption.
Ppt An Illustration Of Angry Emoticon Business Plan PowerPoint Business Templates
PPT an illustration of angry emoticon business plan powerpoint business Templates-This PowerPoint Diagram Illustrates all the Angry Emoticons which will help you to express exasperation, irritability, antagonism etc. .You can change color, size and orientation of any icon to your liking. -PPT an illustration of angry emoticon business plan powerpoint business Templates Our Ppt An Illustration Of Angry Emoticon Business Plan PowerPoint Business Templates provide an attractive backdrop. Your thoughts will be the main feature.
Ppt An Illustration Of Angry Emoticon Communication Skills PowerPoint Business Templates
PPT an illustration of angry emoticon communication skills powerpoint business Templates-This PowerPoint Diagram Illustrates all the Angry Emoticons which will help you to express exasperation, irritability, antagonism etc. .You can change color, size and orientation of any icon to your liking. -PPT an illustration of angry emoticon communication skills powerpoint business Templates Expand your organization with our Ppt An Illustration Of Angry Emoticon Communication Skills PowerPoint Business Templates. You will come out on top.
Ppt An Illustration Of Angry Emoticon Communication Skills PowerPoint Templates
PPT an illustration of angry emoticon communication skills powerpoint Templates-This PowerPoint Diagram Illustrates all the Angry Emoticons which will help you to express exasperation, irritability, antagonism etc. .You can change color, size and orientation of any icon to your liking. -PPT an illustration of angry emoticon communication skills powerpoint Templates Create an alliance that will endure for ages. Our Ppt An Illustration Of Angry Emoticon Communication Skills PowerPoint Templates will abide with you.
Ppt Naughty Emoticon Showing His Tongue Business Management PowerPoint Business Templates
PPT naughty emoticon showing his tongue business management powerpoint business Templates-Use this Naughty Emoticon PowerPoint Diagram to express beam, friendliness, tenderness, grin, laugh, amusement, delightful nature, happiness, pleasing nature, simper, and smirk. You can change color, size and orientation of any icon to your liking. -PPT naughty emoticon showing his tongue business management powerpoint business Templates Build on your charisma with our Ppt Naughty Emoticon Showing His Tongue Business Management PowerPoint Business Templates. Create a definite aura around you.
Ppt Naughty Emoticon Showing His Tongue Business Management PowerPoint Templates
PPT naughty emoticon showing his tongue business management powerpoint Templates-Use this Naughty Emoticon PowerPoint Diagram to express beam, friendliness, tenderness, grin, laugh, amusement, delightful nature, happiness, pleasing nature, simper, and smirk. You can change color, size and orientation of any icon to your liking. -PPT naughty emoticon showing his tongue business management powerpoint Templates Get the nod for your plans with our Ppt Naughty Emoticon Showing His Tongue Business Management PowerPoint Templates. You will be at the top of your game.
Ppt Naughty Emoticon Showing His Tongue Time Management PowerPoint Templates
PPT naughty emoticon showing his tongue time management powerpoint Templates-Use this Naughty Emoticon PowerPoint Diagram to express beam, friendliness, tenderness, grin, laugh, amusement, delightful nature, happiness, pleasing nature, simper, and smirk. You can change color, size and orientation of any icon to your liking. -PPT naughty emoticon showing his tongue time management powerpoint Templates Simplify presentations with our Ppt Naughty Emoticon Showing His Tongue Time Management PowerPoint Templates. Download without worries with our money back guaranteee.
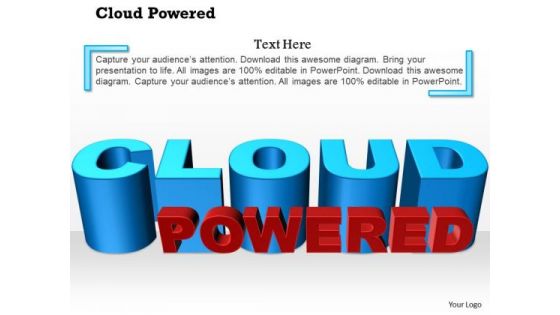
1 Three Dimensional Cloud Powered Text Show On Flat Surface Ppt Slide
This image slide explains the concept of cloud computing. This innovative image slide has been designed with graphic of cloud powered text and text space. You may change color, size and orientation of any icon to your liking. Use this image slide, in your presentations to express views on cloud computing benefits like backup, storage, networking, communication and technology. Create interesting presentations using this image slide.
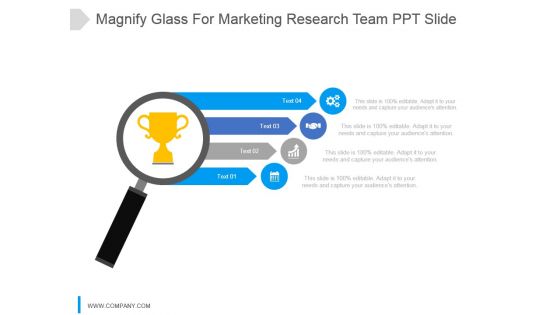
Magnify Glass For Marketing Research Team Ppt Slide
This is a magnify glass for marketing research team ppt slide. This is a four stage process. The stages in this process are search, icons, magnify, marketing, glass.
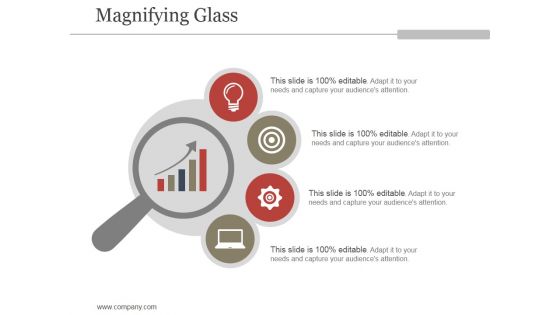
Magnifying Glass Ppt PowerPoint Presentation Inspiration
This is a magnifying glass ppt powerpoint presentation inspiration. This is a one stage process. The stages in this process are magnifier, icons, strategy, business, research.
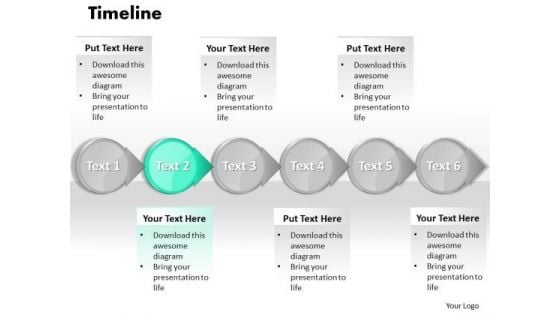
Ppt PowerPoint Slide Numbers A Procedure Or Timeline 2007 Templates
PPT powerpoint slide numbers a procedure or timeline 2007 Templates-This image represents the concept of structured analysis technique that employs a set of visual representations of the data that moves through the organization. This template is specifically designed to highlight you points. Organize your thoughts and illuminate your ideas accordingly-PPT powerpoint slide numbers a procedure or timeline 2007 Templates-Account, Arrow, Arrows, Away, Box, Business, Chart, Choice, Choose, Concept, Concepts, Consultation, Corporate, Design, Diagram, Direction, Elements, Flow, Follow, Follows, Future, Group, Grow, Increase, Lines, Many, Month, Move, Past, Period, Phase, Project, Report, Rise, Row, Step, Success, Text, Time, Timeline, Today, Up, Way, Ways, Work, Year Close deals with our Ppt PowerPoint Slide Numbers A Procedure Or Timeline 2007 Templates. Download without worries with our money back guaranteee.

Interoperability Software Testing Plan Phase Of PDCA Cycle Microsoft PDF
This slide depicts the planning phase of the PDCA cycle in which the main focus of the test condition should be on the flow of data through all of the applications. Welcome to our selection of the Interoperability Software Testing Plan Phase Of PDCA Cycle Microsoft PDF. These are designed to help you showcase your creativity and bring your sphere to life. Planning and Innovation are essential for any business that is just starting out. This collection contains the designs that you need for your everyday presentations. All of our PowerPoints are 100 percent editable, so you can customize them to suit your needs. This multi purpose template can be used in various situations. Grab these presentation templates today.

Key Texting And SMS Marketing Statistics Ppt PowerPoint Presentation Diagram Graph Charts PDF
This slide represents the statistical data to help marketers analyze the benefits and importance of SMS marketing for business growth and development. It includes key SMS marketing statistics such as click through rates, opt-ins etc. Get a simple yet stunning designed Key Texting And SMS Marketing Statistics Ppt PowerPoint Presentation Diagram Graph Charts PDF. It is the best one to establish the tone in your meetings. It is an excellent way to make your presentations highly effective. So, download this PPT today from Slidegeeks and see the positive impacts. Our easy to edit Key Texting And SMS Marketing Statistics Ppt PowerPoint Presentation Diagram Graph Charts PDF can be your go to option for all upcoming conferences and meetings. So, what are you waiting for Grab this template today.
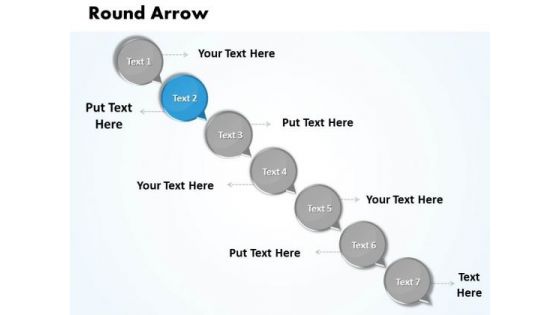
Ppt Text Circles With Circular Arrows PowerPoint 2007 Steps Business Templates
PPT text circles with circular arrows powerpoint 2007 steps Business Templates-Use this layout to define the outcome and the multiple possibilities in a way that is used in calculation of probabilities, genetics and strategic reasoning. This chart visualizes the concept of process steps, reoccurrences and components or of your company structure or product features. You can change color, size and orientation of any icon to your liking. -PPT text circles with circular arrows powerpoint 2007 steps Business Templates-Add, Aqua, Arrows, Badges, Bar, Blend, Blue, Bright, Bubbles, Buttons, Caution, Circle, Drop, Elements, Glossy, Glowing, Graphic, Heart, Help, Icons, Idea, Illustration, Navigation, Oblong, Plus, Round, Service, Shadow, Shiny, Sign, Speech, Squares Make use of the facilities our Ppt Text Circles With Circular Arrows PowerPoint 2007 Steps Business Templates offer. You will be delighted with the choices available.
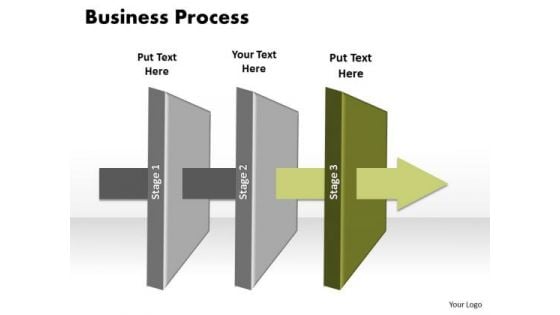
Ppt Layer 3 Free Business PowerPoint Slide Text Linear Process Templates
PPT layer 3 free business powerpoint slide text linear process Templates-Use this PowerPoint Diagram to represent the layers of Linear Process model Graphically. It shows the third stage in an animated manner through an Arrow. You can change color, size and orientation of any icon to your liking.-PPT layer 3 free business powerpoint slide text linear process Templates-3d, Air, Arrow, Art, Business, Chart, Clip, Clipart, Cooling, Diagram, Drip, Drop, Dry, Energy, Eps10, Evaporate, Evaporating, Evaporation, Graphic, Heat, Icon, Illustration, Isolated, Isometric, Layers, Material, Moisture, Process Dont ignore the perils of a boring presentation. Liven it up with our Ppt Layer 3 Free Business PowerPoint Slide Text Linear Process Templates. Make sure your presentation gets the attention it deserves.
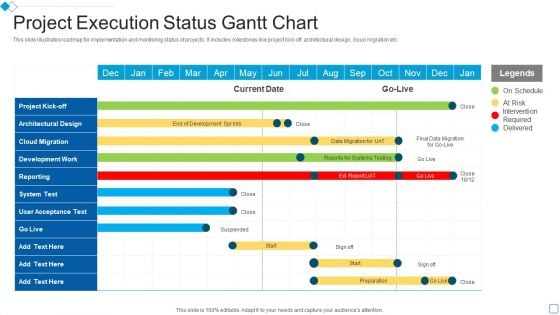
Project Execution Status Gantt Chart Slides PDF
This slide illustrates roadmap for implementation and monitoring status of projects. It includes milestones like project kick off, architectural design, cloud migration etc.Your complex projects can be managed and organized simultaneously using this detailed Project Execution Status Gantt Chart Slides PDF template. Track the milestones, tasks, phases, activities, and subtasks to get an updated visual of your project. Share your planning horizon and release plan with this well crafted presentation template. This exemplary template can be used to plot various dependencies to distinguish the tasks in the pipeline and their impact on the schedules and deadlines of the project. Apart from this, you can also share this visual presentation with your team members and stakeholders. It a resourceful tool that can be incorporated into your business structure. Therefore, download and edit it conveniently to add the data and statistics as per your requirement
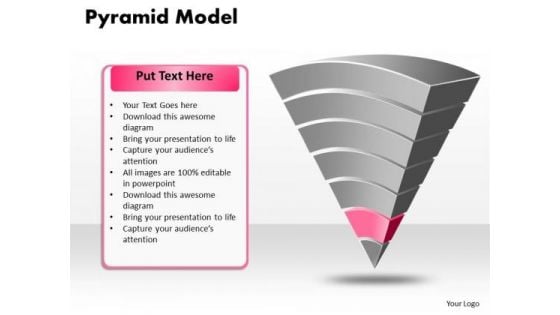
Ppt Pyramid Business Model Spider Diagram PowerPoint Template Templates
PPT pyramid business model spider diagram powerpoint template Templates-You can divide a Pyramid Chart into segments for illustrating proportion. Pyramid chart is an effective way of displaying information you can edit text, color, shade and style as per you need. This pyramid chart is perhaps the most widely used statistical chart in the business world.-PPT pyramid business model spider diagram powerpoint template Templates-Business, Chart, Color, Data Pyramid, Diagram, Graph, Group, Growth, Hierarchy, Illustration, Layer, Layered, Layered Pyramid, Level, Multicolor, Object, Performance, Presentation, Progress, Pyramid, Rank, Seam, Segment, Set, Shape, Stage, Structure, Symbol, System, Top Dismiss the blues with our Ppt Pyramid Business Model Spider Diagram PowerPoint Template Templates. Your thoughts will dispel all despondency.
Ecology And Green Energy With Eco Friendly Text Ppt Slides Graphics
This power point template has icons of eco friendly theme. Terms such as green, natural and organic can be explained with this slide. Use these icons to make unique presentation for green energy related topics.
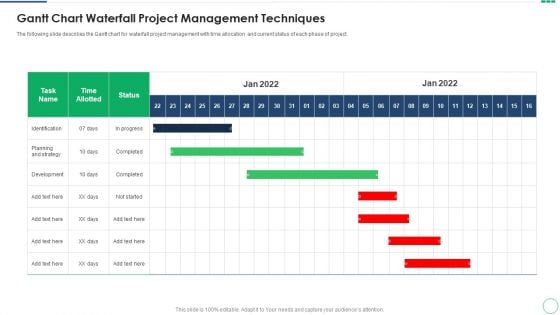
Gantt Chart Waterfall Project Management Techniques Topics PDF
The following slide describes the Gantt chart for waterfall project management with time allocation and current status of each phase of project. Your complex projects can be managed and organized simultaneously using this detailed Gantt Chart Waterfall Project Management Techniques Topics PDF template. Track the milestones, tasks, phases, activities, and subtasks to get an updated visual of your project. Share your planning horizon and release plan with this well crafted presentation template. This exemplary template can be used to plot various dependencies to distinguish the tasks in the pipeline and their impact on the schedules and deadlines of the project. Apart from this, you can also share this visual presentation with your team members and stakeholders. It a resourceful tool that can be incorporated into your business structure. Therefore, download and edit it conveniently to add the data and statistics as per your requirement.
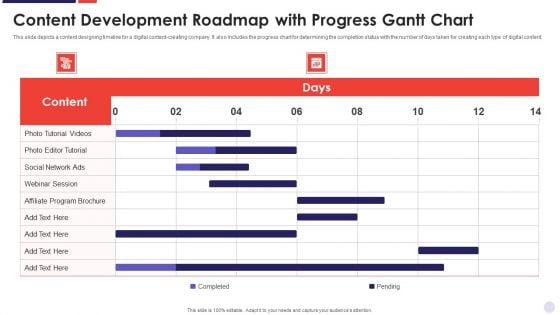
Content Development Roadmap With Progress Gantt Chart Summary PDF
Your complex projects can be managed and organized simultaneously using this detailed Content Development Roadmap With Progress Gantt Chart Summary PDF template. Track the milestones, tasks, phases, activities, and subtasks to get an updated visual of your project. Share your planning horizon and release plan with this well crafted presentation template. This exemplary template can be used to plot various dependencies to distinguish the tasks in the pipeline and their impact on the schedules and deadlines of the project. Apart from this, you can also share this visual presentation with your team members and stakeholders. It a resourceful tool that can be incorporated into your business structure. Therefore, download and edit it conveniently to add the data and statistics as per your requirement.
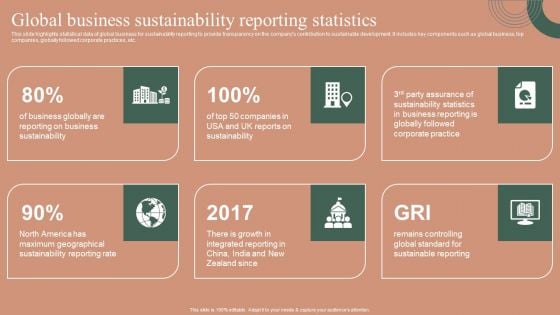
Global Business Sustainability Reporting Statistics Themes PDF
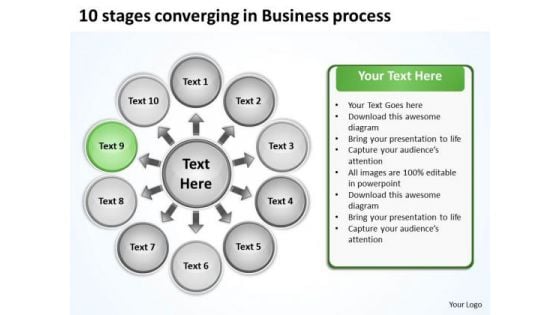
10 Stages Converging Business PowerPoint Theme Process Radial Chart Slides
We present our 10 stages converging business powerpoint theme process Radial Chart Slides.Use our Arrows PowerPoint Templates because they help to lay the base of your trend of thought. Use our Flow charts PowerPoint Templates because this template with an image of helps you chart the course of your presentation. Download and present our Business PowerPoint Templates because the majestic tiger lord of all it surveys.It exudes power even when it is in repose. Present our Process and Flows PowerPoint Templates because you can Take your team along by explaining your plans. Present our Circle charts PowerPoint Templates because it is the time to bond with family, friends, colleagues and any other group of your choice.Use these PowerPoint slides for presentations relating to Business, chart, circle, colors, concept, corporate, cycle, data, design, detail, development, diagram, engineering, graphic, ideas, illustration, image, implement, implementation, life, lifecycle, management, model, objects, organization, plan, process, product, professional, project, quality, schema, shape, stack, stage, steps, strategy, structure, success, symbol. The prominent colors used in the PowerPoint template are Yellow, Black, Gray. You can be sure our 10 stages converging business powerpoint theme process Radial Chart Slides are Luxuriant. Presenters tell us our corporate PowerPoint templates and PPT Slides are effectively colour coded to prioritise your plans They automatically highlight the sequence of events you desire. We assure you our 10 stages converging business powerpoint theme process Radial Chart Slides are Efficient. Customers tell us our data PowerPoint templates and PPT Slides are One-of-a-kind. Presenters tell us our 10 stages converging business powerpoint theme process Radial Chart Slides are Stunning. You can be sure our cycle PowerPoint templates and PPT Slides are Lush. Get rid of the blues with our 10 Stages Converging Business PowerPoint Theme Process Radial Chart Slides. Let hope and happiness flow into your mind.
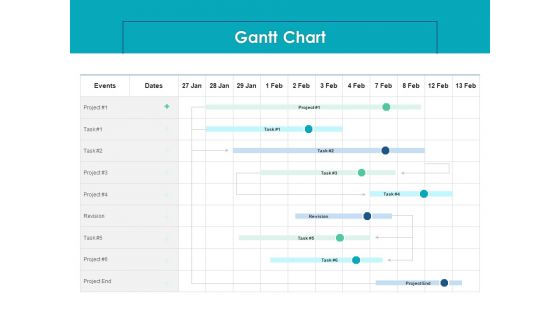
Housing Mortgage Proposal Gantt Chart Ppt Pictures Brochure PDF
Your complex projects can be managed and organized simultaneously using this detailed housing mortgage proposal gantt chart ppt pictures brochure pdf template. Track the milestones, tasks, phases, activities, and subtasks to get an updated visual of your project. Share your planning horizon and release plan with this well crafted presentation template. This exemplary template can be used to plot various dependencies to distinguish the tasks in the pipeline and their impact on the schedules and deadlines of the project. Apart from this, you can also share this visual presentation with your team members and stakeholders. It a resourceful tool that can be incorporated into your business structure. Therefore, download and edit it conveniently to add the data and statistics as per your requirement.
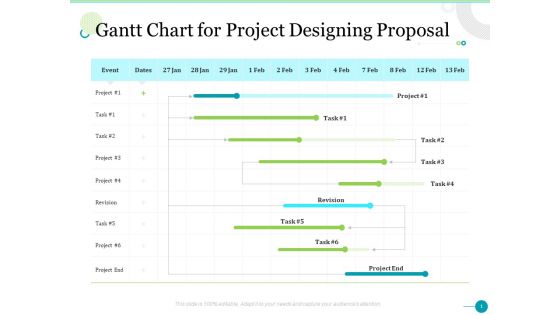
Gantt Chart For Project Designing Proposal Ppt Inspiration Pictures PDF
Your complex projects can be managed and organized simultaneously using this detailed gantt chart for project designing proposal ppt inspiration pictures pdf template. Track the milestones, tasks, phases, activities, and subtasks to get an updated visual of your project. Share your planning horizon and release plan with this well crafted presentation template. This exemplary template can be used to plot various dependencies to distinguish the tasks in the pipeline and their impact on the schedules and deadlines of the project. Apart from this, you can also share this visual presentation with your team members and stakeholders. It a resourceful tool that can be incorporated into your business structure. Therefore, download and edit it conveniently to add the data and statistics as per your requirement.
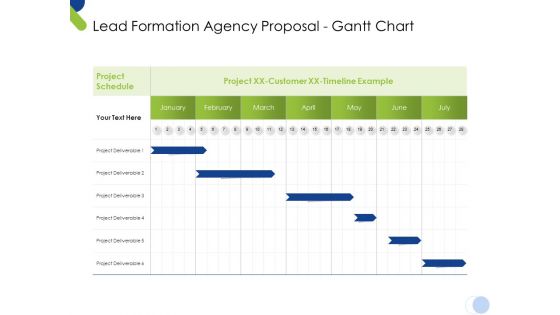
Lead Formation Agency Proposal Gantt Chart Ppt Summary Infographics PDF
Your complex projects can be managed and organized simultaneously using this detailed lead formation agency proposal gantt chart ppt summary infographics pdf template. Track the milestones, tasks, phases, activities, and subtasks to get an updated visual of your project. Share your planning horizon and release plan with this well crafted presentation template. This exemplary template can be used to plot various dependencies to distinguish the tasks in the pipeline and their impact on the schedules and deadlines of the project. Apart from this, you can also share this visual presentation with your team members and stakeholders. It a resourceful tool that can be incorporated into your business structure. Therefore, download and edit it conveniently to add the data and statistics as per your requirement.
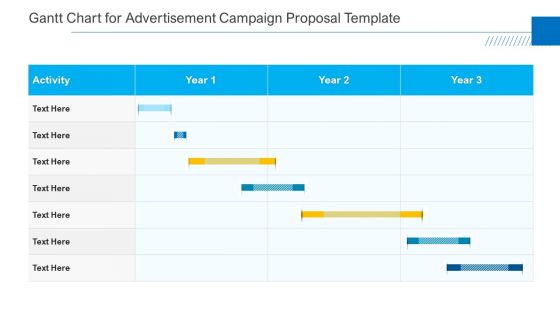
Gantt Chart For Advertisement Campaign Proposal Template Summary PDF
Your complex projects can be managed and organized simultaneously using this detailed gantt chart for advertisement campaign proposal template summary pdf template. Track the milestones, tasks, phases, activities, and subtasks to get an updated visual of your project. Share your planning horizon and release plan with this well crafted presentation template. This exemplary template can be used to plot various dependencies to distinguish the tasks in the pipeline and their impact on the schedules and deadlines of the project. Apart from this, you can also share this visual presentation with your team members and stakeholders. It a resourceful tool that can be incorporated into your business structure. Therefore, download and edit it conveniently to add the data and statistics as per your requirement.

Gantt Chart For Better Project Problem Administration Ideas PDF
Your complex projects can be managed and organized simultaneously using this detailed gantt chart for better project problem administration ideas pdf template. Track the milestones, tasks, phases, activities, and subtasks to get an updated visual of your project. Share your planning horizon and release plan with this well crafted presentation template. This exemplary template can be used to plot various dependencies to distinguish the tasks in the pipeline and their impact on the schedules and deadlines of the project. Apart from this, you can also share this visual presentation with your team members and stakeholders. It a resourceful tool that can be incorporated into your business structure. Therefore, download and edit it conveniently to add the data and statistics as per your requirement.
Ppt Puzzle Process Social Network PowerPoint Backgrounds Startegy Templates
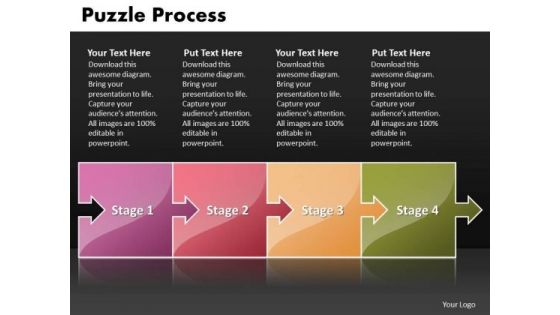
PPT puzzle process social network powerpoint backgrounds startegy Templates-Illustrate your ideas and imprint them in the minds of your team with this template. Feel the buzz as they comprehend your plan to get the entire act together. Watch their eyes light up with enthusiasm as they see the dream emerge.-PPT puzzle process social network powerpoint backgrounds startegy Templates-abstract action attach box business center chain chart color communication concept connection cube cycle data diagram flow globe horizontal idea illustration individual information interaction jigsaw join link merge missing opportunity part people piece pieces process puzzle relation relationship search shape silhouette success Illustrate your plans for greater efficiency with our Ppt Puzzle Process Social Network PowerPoint Backgrounds Startegy Templates. Work out how to get more for less.
Cash Market Investor Deck Table Of Content Products Ppt Summary Design Inspiration PDF
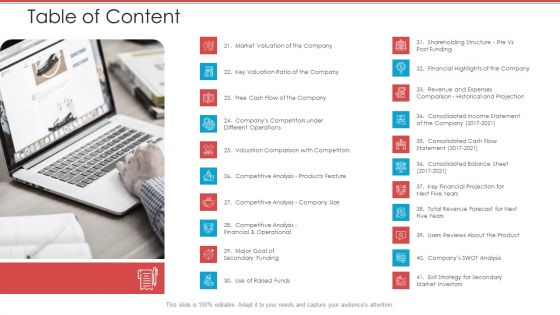
Presenting cash market investor deck table of content ppt icon backgrounds pdf to provide visual cues and insights. Share and navigate important information on one stage that need your due attention. This template can be used to pitch topics like financial overview, products and services, business model, organization chart, markets size. In addtion, this PPT design contains high resolution images, graphics, etc, that are easily editable and available for immediate download.
Rapid Innovation In HR Technology Space Gantt Chart Graphics PDF
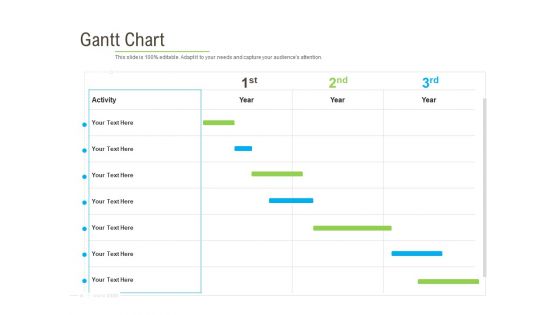
Your complex projects can be managed and organized simultaneously using this detailed rapid innovation in hr technology space gantt chart graphics pdf template. Track the milestones, tasks, phases, activities, and subtasks to get an updated visual of your project. Share your planning horizon and release plan with this well crafted presentation template. This exemplary template can be used to plot various dependencies to distinguish the tasks in the pipeline and their impact on the schedules and deadlines of the project. Apart from this, you can also share this visual presentation with your team members and stakeholders. It a resourceful tool that can be incorporated into your business structure. Therefore, download and edit it conveniently to add the data and statistics as per your requirement.
Organization Manpower Management Technology Gannt Chart Infographics PDF
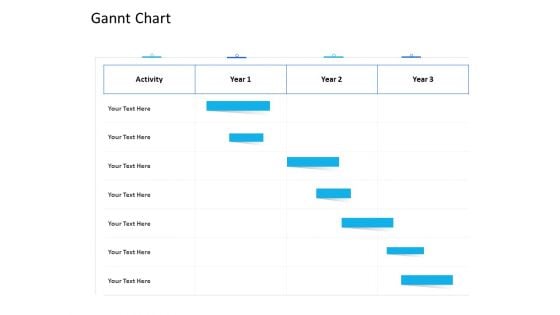
Your complex projects can be managed and organized simultaneously using this detailed organization manpower management technology gannt chart infographics pdf template. Track the milestones, tasks, phases, activities, and subtasks to get an updated visual of your project. Share your planning horizon and release plan with this well crafted presentation template. This exemplary template can be used to plot various dependencies to distinguish the tasks in the pipeline and their impact on the schedules and deadlines of the project. Apart from this, you can also share this visual presentation with your team members and stakeholders. It a resourceful tool that can be incorporated into your business structure. Therefore, download and edit it conveniently to add the data and statistics as per your requirement.
Network For Organization Connection Powerpoint Templates
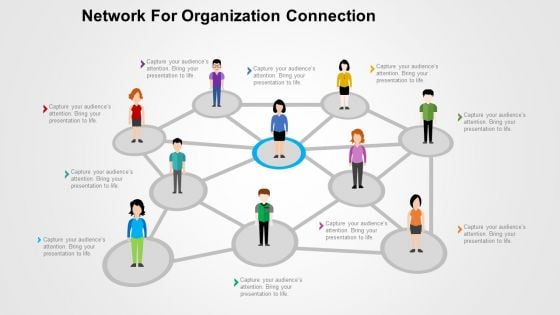
Feel free to use this professionally created PowerPoint slide for various purposes. The person in the center can be used to portray a leader, a boss, a chairman, a CEO or any other important person. The PowerPoint template can be used to depict a society. This template is exactly what is needed to explain concepts of communication within society. It can be used to portray interconnection amongst various departments or professionals in an organization or business. This slide can be effectively used to explain the concept of networking or bonding. The web of people can be used to show a team and the responsibilities shared. This can also be used to show the order in which ideas, orders or any data is shared in a firm. This can be your answer to explain the working or hierarchy of your business to your clients or customers.
Phase 4 Of Rad Cutover Rapid Application Building RAB Model Graphics PDF
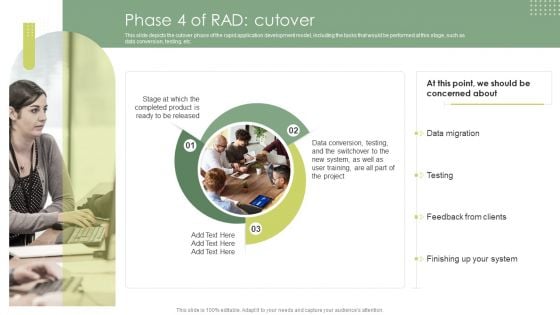
This slide depicts the cutover phase of the rapid application development model, including the tasks that would be performed at this stage, such as data conversion, testing, etc.Are you in need of a template that can accommodate all of your creative concepts This one is crafted professionally and can be altered to fit any style. Use it with Google Slides or PowerPoint. Include striking photographs, symbols, depictions, and other visuals. Fill, move around, or remove text boxes as desired. Test out color palettes and font mixtures. Edit and save your work, or work with colleagues. Download Phase 4 Of Rad Cutover Rapid Application Building RAB Model Graphics PDF and observe how to make your presentation outstanding. Give an impeccable presentation to your group and make your presentation unforgettable.
Gantt Chart For Web Conversion Rate Optimization Download PDF
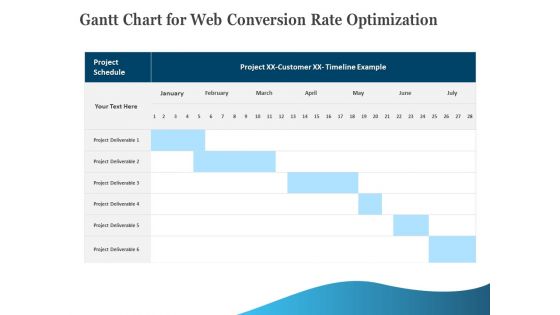
Your complex projects can be managed and organized simultaneously using this detailed gantt chart for web conversion rate optimization download pdf template. Track the milestones, tasks, phases, activities, and subtasks to get an updated visual of your project. Share your planning horizon and release plan with this well-crafted presentation template. This exemplary template can be used to plot various dependencies to distinguish the tasks in the pipeline and their impact on the schedules and deadlines of the project. Apart from this, you can also share this visual presentation with your team members and stakeholders. It a resourceful tool that can be incorporated into your business structure. Therefore, download and edit it conveniently to add the data and statistics as per your requirement.
Disaster Recovery Strategic Plan Phase 4 Setting Up The Recovery Goals Topics PDF
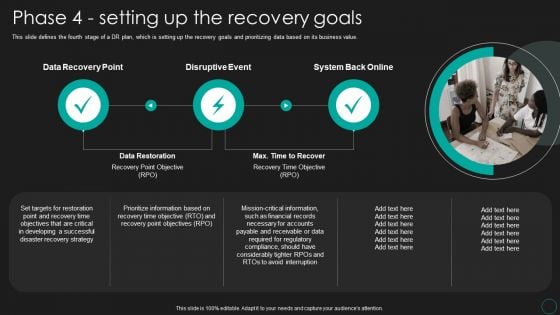
This slide defines the fourth stage of a DR plan, which is setting up the recovery goals and prioritizing data based on its business value. Do you have to make sure that everyone on your team knows about any specific topic I yes, then you should give Disaster Recovery Strategic Plan Phase 4 Setting Up The Recovery Goals Topics PDF a try. Our experts have put a lot of knowledge and effort into creating this impeccable Disaster Recovery Strategic Plan Phase 4 Setting Up The Recovery Goals Topics PDF. You can use this template for your upcoming presentations, as the slides are perfect to represent even the tiniest detail. You can download these templates from the Slidegeeks website and these are easy to edit. So grab these today.
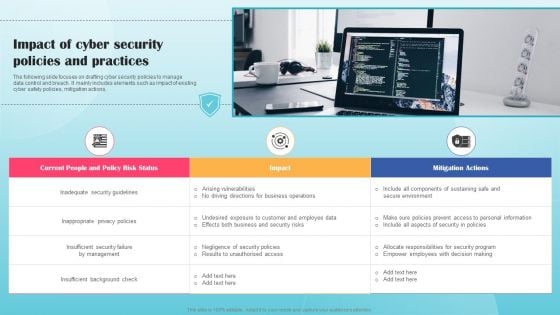
Impact Of Cyber Security Policies And Practices Ppt PowerPoint Presentation Diagram Graph Charts PDF
The following slide focuses on drafting cyber security policies to manage data control and breach. It mainly includes elements such as impact of existing cyber safety policies, mitigation actions, Presenting this PowerPoint presentation, titled Impact Of Cyber Security Policies And Practices Ppt PowerPoint Presentation Diagram Graph Charts PDF, with topics curated by our researchers after extensive research. This editable presentation is available for immediate download and provides attractive features when used. Download now and captivate your audience. Presenting this Impact Of Cyber Security Policies And Practices Ppt PowerPoint Presentation Diagram Graph Charts PDF. Our researchers have carefully researched and created these slides with all aspects taken into consideration. This is a completely customizable Impact Of Cyber Security Policies And Practices Ppt PowerPoint Presentation Diagram Graph Charts PDF that is available for immediate downloading. Download now and make an impact on your audience. Highlight the attractive features available with our PPTs.
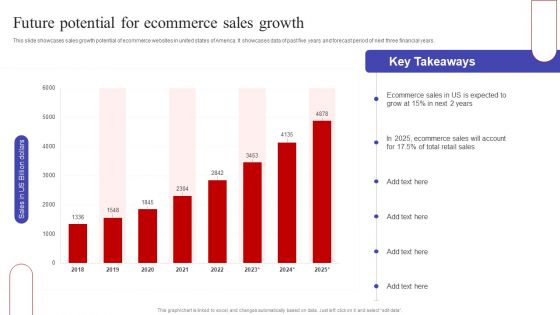
Future Potential For Ecommerce Sales Growth Ppt PowerPoint Presentation Diagram Graph Charts PDF
This slide showcases sales growth potential of ecommerce websites in united states of America. It showcases data of past five years and forecast period of next three financial years. Here you can discover an assortment of the finest PowerPoint and Google Slides templates. With these templates, you can create presentations for a variety of purposes while simultaneously providing your audience with an eye catching visual experience. Download Future Potential For Ecommerce Sales Growth Ppt PowerPoint Presentation Diagram Graph Charts PDF to deliver an impeccable presentation. These templates will make your job of preparing presentations much quicker, yet still, maintain a high level of quality. Slidegeeks has experienced researchers who prepare these templates and write high quality content for you. Later on, you can personalize the content by editing the Future Potential For Ecommerce Sales Growth Ppt PowerPoint Presentation Diagram Graph Charts PDF.
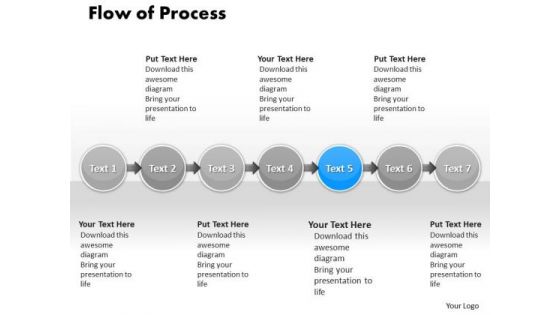
Ppt Seven PowerPoint Slide Numbers Continuous Flow Theme Of Process Templates
PPT seven powerpoint slide numbers continuous flow theme of process Templates-This Diagram is used to illustrate how information will move between interrelated systems in the accomplishment of a given function, task or process. The visual description of this information flow with each given level showing how data is fed into a given process step and subsequently passed along at the completion of that step.-PPT seven powerpoint slide numbers continuous flow theme of process Templates-Analysis, Arrow, Background, Backlink, Circle, Code, Content, Diagram, Engine, Illustration, Keyword, Optimization, Offpage, Process, Search, Template, Tracking, Unpage, Violet, Visitor, Concentrate on the assignment with our Ppt Seven PowerPoint Slide Numbers Continuous Flow Theme Of Process Templates. Don't give a fig about other issues.
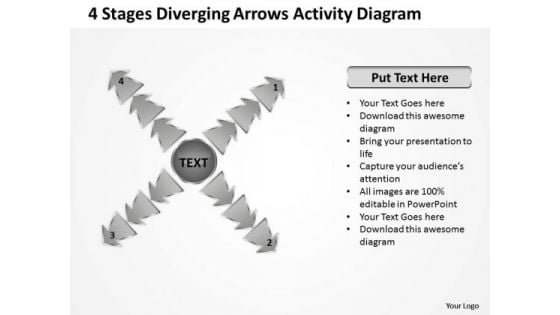
4 Stages Diverging Arrows Activity Diagram Cycle Chart PowerPoint Templates
We present our 4 stages diverging arrows activity diagram Cycle Chart PowerPoint templates.Present our Flow Charts PowerPoint Templates because you are buzzing with ideas. Download our Business PowerPoint Templates because everybody knows The world over it is a priority for many. Along with it there are so many oppurtunities waiting to be utilised. Download our Process and Flows PowerPoint Templates because let your words be the drops of wisdom spreading knowledge and peace like ripples through the expectant minds of your devoted followers. Download and present our Success PowerPoint Templates because you can Adorn them with your ideas and thoughts. Download and present our Arrows PowerPoint Templates because you are aware of some pitfalls ahead where you need to be cautious not to overrun and avoid a stall.Use these PowerPoint slides for presentations relating to Business, Chart, Circle, Cyclic, Data, Diagram, Financial, Goal, Graph, Illustration, Info, Information, Marketing, Model, Option, Part, Pie, Presentation, Process, Result, Sphere, Statistics. The prominent colors used in the PowerPoint template are Black, Gray, White. People tell us our 4 stages diverging arrows activity diagram Cycle Chart PowerPoint templates are Nice. Customers tell us our Financial PowerPoint templates and PPT Slides are Vintage. People tell us our 4 stages diverging arrows activity diagram Cycle Chart PowerPoint templates are Nostalgic. Professionals tell us our Data PowerPoint templates and PPT Slides are Luxuriant. Customers tell us our 4 stages diverging arrows activity diagram Cycle Chart PowerPoint templates are Attractive. Use our Cyclic PowerPoint templates and PPT Slides will make the presenter look like a pro even if they are not computer savvy. The adaptability of our 4 Stages Diverging Arrows Activity Diagram Cycle Chart PowerPoint Templates is a fact. They will align with your bidding.
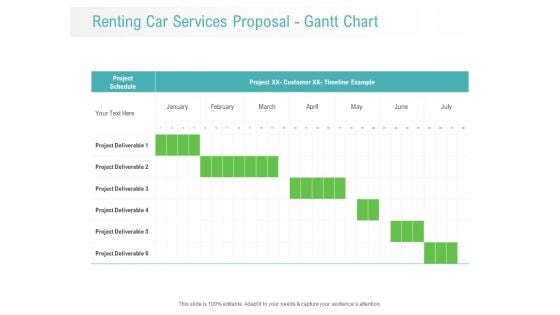
Renting Car Services Proposal Gantt Chart Ppt Outline PDF
Manage your complex projects and organize them simultaneously with this detailed Gantt Chart PowerPoint Template. Track your milestones, tasks, phases, activities, subtasks amongst other constituents that will give you an updated visual of your project. Reflect your planning horizon and capture your release plan in one view with this Gantt Chart PowerPoint presentation template. You can plot various dependencies directly on this Timeline PowerPoint Presentation Layout to see which tasks are still in the pipeline and how the delays in them are impacting the schedules and deadlines of the project. Apart from this, you can also share this updated visual with your team members and stakeholders, thus making it a resourceful tool to be incorporated in your business structure. Not only this but also the editable layout of this slide helps you to add your data and statistics at your convenience.

Shipment Proposal For Corporate Occasion Gantt Chart Introduction PDF
Manage your complex projects and organize them simultaneously with this detailed Gantt Chart PowerPoint Template. Track your milestones, tasks, phases, activities, subtasks amongst other constituents that will give you an updated visual of your project. Reflect your planning horizon and capture your release plan in one view with this Gantt Chart PowerPoint presentation template. You can plot various dependencies directly on this Timeline PowerPoint Presentation Layout to see which tasks are still in the pipeline and how the delays in them are impacting the schedules and deadlines of the project. Apart from this, you can also share this updated visual with your team members and stakeholders, thus making it a resourceful tool to be incorporated in your business structure. Not only this but also the editable layout of this slide helps you to add your data and statistics at your convenience.
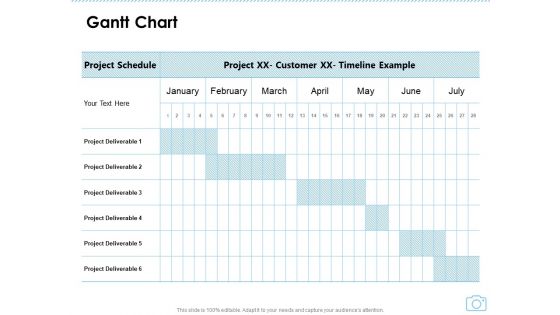
Cinematography Project Proposal Gantt Chart Ppt Model Slides PDF
Your complex projects can be managed and organized simultaneously using this detailed cinematography project proposal gantt chart ppt model slides pdf template. Track the milestones, tasks, phases, activities, and subtasks to get an updated visual of your project. Share your planning horizon and release plan with this well crafted presentation template. This exemplary template can be used to plot various dependencies to distinguish the tasks in the pipeline and their impact on the schedules and deadlines of the project. Apart from this, you can also share this visual presentation with your team members and stakeholders. It a resourceful tool that can be incorporated into your business structure. Therefore, download and edit it conveniently to add the data and statistics as per your requirement.
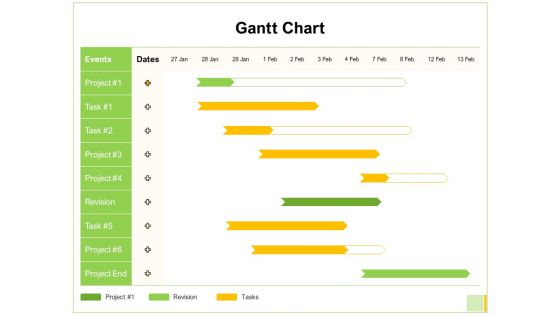
Electronic Mail Proposal Gantt Chart Ppt Outline Layout Ideas PDF
Your complex projects can be managed and organized simultaneously using this detailed electronic mail proposal gantt chart ppt outline layout ideas pdf template. Track the milestones, tasks, phases, activities, and subtasks to get an updated visual of your project. Share your planning horizon and release plan with this well crafted presentation template. This exemplary template can be used to plot various dependencies to distinguish the tasks in the pipeline and their impact on the schedules and deadlines of the project. Apart from this, you can also share this visual presentation with your team members and stakeholders. It a resourceful tool that can be incorporated into your business structure. Therefore, download and edit it conveniently to add the data and statistics as per your requirement.
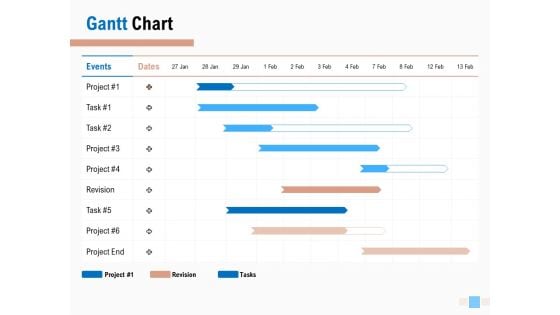
Email Advertising Proposal Gantt Chart Ppt Model Infographic Template PDF
Your complex projects can be managed and organized simultaneously using this detailed email advertising proposal gantt chart ppt model infographic template pdf template. Track the milestones, tasks, phases, activities, and subtasks to get an updated visual of your project. Share your planning horizon and release plan with this well crafted presentation template. This exemplary template can be used to plot various dependencies to distinguish the tasks in the pipeline and their impact on the schedules and deadlines of the project. Apart from this, you can also share this visual presentation with your team members and stakeholders. It a resourceful tool that can be incorporated into your business structure. Therefore, download and edit it conveniently to add the data and statistics as per your requirement.
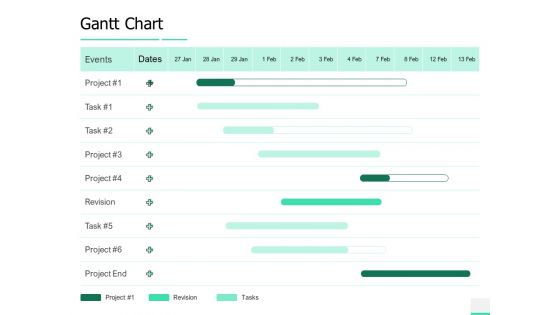
Online Mail Corporate Proposal Gantt Chart Ppt Ideas Shapes PDF
Your complex projects can be managed and organized simultaneously using this detailed online mail corporate proposal gantt chart ppt ideas shapes pdf template. Track the milestones, tasks, phases, activities, and subtasks to get an updated visual of your project. Share your planning horizon and release plan with this well crafted presentation template. This exemplary template can be used to plot various dependencies to distinguish the tasks in the pipeline and their impact on the schedules and deadlines of the project. Apart from this, you can also share this visual presentation with your team members and stakeholders. It a resourceful tool that can be incorporated into your business structure. Therefore, download and edit it conveniently to add the data and statistics as per your requirement.
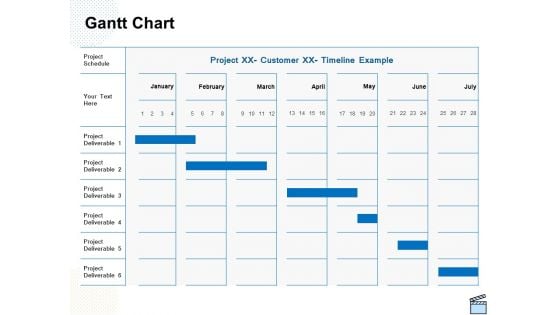
Professional Picture Proposal Gantt Chart Ppt Infographics Graphics Design PDF
Your complex projects can be managed and organized simultaneously using this detailed professional picture proposal gantt chart ppt infographics graphics design pdf template. Track the milestones, tasks, phases, activities, and subtasks to get an updated visual of your project. Share your planning horizon and release plan with this well crafted presentation template. This exemplary template can be used to plot various dependencies to distinguish the tasks in the pipeline and their impact on the schedules and deadlines of the project. Apart from this, you can also share this visual presentation with your team members and stakeholders. It a resourceful tool that can be incorporated into your business structure. Therefore, download and edit it conveniently to add the data and statistics as per your requirement.
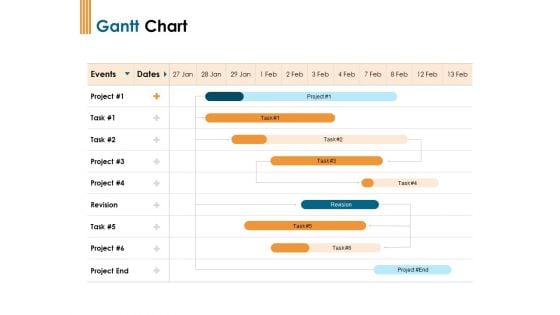
Enterprise Revamping Gantt Chart Ppt Layouts Files PDF
Your complex projects can be managed and organized simultaneously using this detailed enterprise revamping gantt chart ppt layouts files pdf template. Track the milestones, tasks, phases, activities, and subtasks to get an updated visual of your project. Share your planning horizon and release plan with this well-crafted presentation template. This exemplary template can be used to plot various dependencies to distinguish the tasks in the pipeline and their impact on the schedules and deadlines of the project. Apart from this, you can also share this visual presentation with your team members and stakeholders. It a resourceful tool that can be incorporated into your business structure. Therefore, download and edit it conveniently to add the data and statistics as per your requirement.
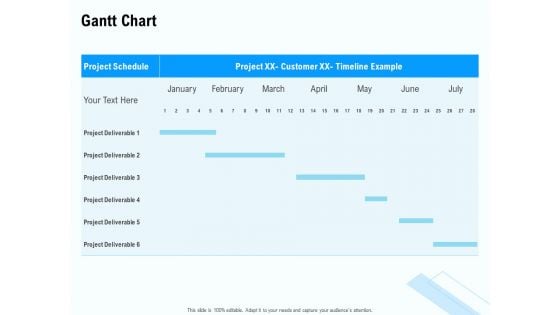
Staffing Offshoring Proposal Gantt Chart Ppt Professional Brochure PDF
Your complex projects can be managed and organized simultaneously using this detailed staffing offshoring proposal gantt chart ppt professional brochure pdf template. Track the milestones, tasks, phases, activities, and subtasks to get an updated visual of your project. Share your planning horizon and release plan with this well crafted presentation template. This exemplary template can be used to plot various dependencies to distinguish the tasks in the pipeline and their impact on the schedules and deadlines of the project. Apart from this, you can also share this visual presentation with your team members and stakeholders. It a resourceful tool that can be incorporated into your business structure. Therefore, download and edit it conveniently to add the data and statistics as per your requirement.
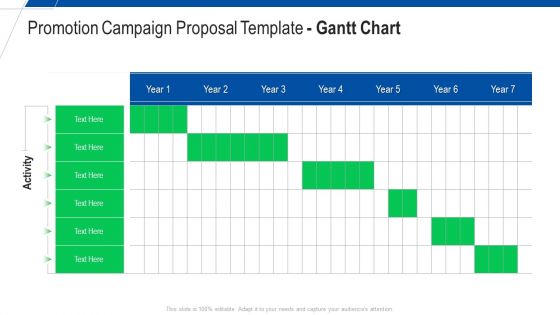
Promotion Campaign Proposal Template Gantt Chart Ppt Pictures Slide PDF
Your complex projects can be managed and organized simultaneously using this detailed promotion campaign proposal template gantt chart ppt pictures slide pdf template. Track the milestones, tasks, phases, activities, and subtasks to get an updated visual of your project. Share your planning horizon and release plan with this well crafted presentation template. This exemplary template can be used to plot various dependencies to distinguish the tasks in the pipeline and their impact on the schedules and deadlines of the project. Apart from this, you can also share this visual presentation with your team members and stakeholders. It a resourceful tool that can be incorporated into your business structure. Therefore, download and edit it conveniently to add the data and statistics as per your requirement.
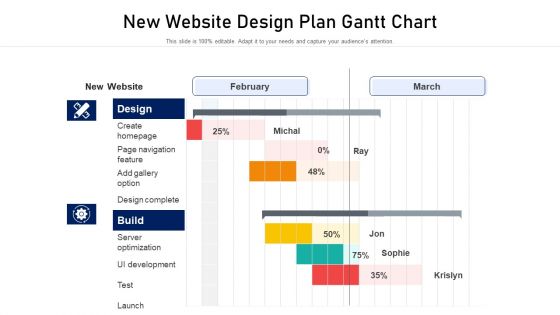
New Website Design Plan Gantt Chart Designs PDF
Your complex projects can be managed and organized simultaneously using this detailed new website design plan gantt chart designs pdf template. Track the milestones, tasks, phases, activities, and subtasks to get an updated visual of your project. Share your planning horizon and release plan with this well crafted presentation template. This exemplary template can be used to plot various dependencies to distinguish the tasks in the pipeline and their impact on the schedules and deadlines of the project. Apart from this, you can also share this visual presentation with your team members and stakeholders. It a resourceful tool that can be incorporated into your business structure. Therefore, download and edit it conveniently to add the data and statistics as per your requirement.
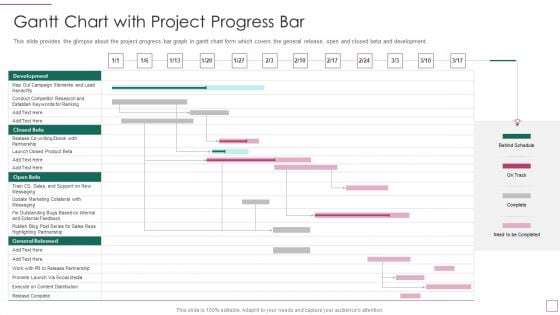
Approach Avoidance Conflict Gantt Chart With Project Progress Bar Topics PDF
This slide provides the glimpse about the project progress bar graph in gantt chart form which covers the general release, open and closed beta and development. Your complex projects can be managed and organized simultaneously using this detailed approach avoidance conflict gantt chart with project progress bar topics pdf template. Track the milestones, tasks, phases, activities, and subtasks to get an updated visual of your project. Share your planning horizon and release plan with this well crafted presentation template. This exemplary template can be used to plot various dependencies to distinguish the tasks in the pipeline and their impact on the schedules and deadlines of the project. Apart from this, you can also share this visual presentation with your team members and stakeholders. It a resourceful tool that can be incorporated into your business structure. Therefore, download and edit it conveniently to add the data and statistics as per your requirement.
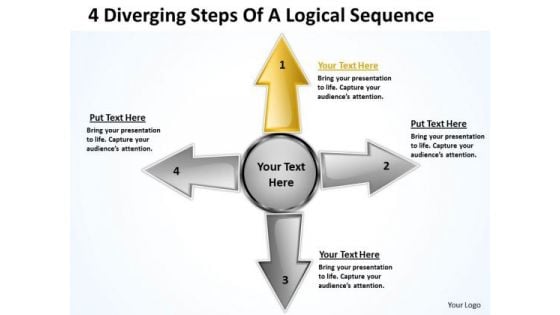
4 Diverging Steps Of Logical Sequence Circular Arrow Diagram PowerPoint Templates
We present our 4 diverging steps of logical sequence Circular Arrow Diagram PowerPoint templates.Present our Success PowerPoint Templates because the choices you make today will determine the future growth of your enterprise. Use our Business PowerPoint Templates because the NASA Space programme took mankind to the moon and so much more. Like them you too can look far beyond normal boundaries. Show them that in your mind the sky is certainly not the limit. Download and present our Arrows PowerPoint Templates because you have the moves to sway the market. Use our Flow Charts PowerPoint Templates because it helps you to clearly delegate the different tasks along with their necessary resources and responsibilities. Use our Shapes PowerPoint Templates because you know the path so show the way.Use these PowerPoint slides for presentations relating to Arrow, Brochure, Business, Chart, Circle, Cyclic, Data, Diagram, Financial, Goal, Graph, Illustration, Info, Information, Investment, Manage, Marketing, Model, Option, Part, Pie, Presentation, Process, Result, Sphere, Statistics, Stock, Strategy, Template, Wheel. The prominent colors used in the PowerPoint template are Yellow, Gray, White. People tell us our 4 diverging steps of logical sequence Circular Arrow Diagram PowerPoint templates are Luxuriant. Customers tell us our Financial PowerPoint templates and PPT Slides are Awesome. People tell us our 4 diverging steps of logical sequence Circular Arrow Diagram PowerPoint templates are Handsome. Professionals tell us our Financial PowerPoint templates and PPT Slides are Exuberant. Customers tell us our 4 diverging steps of logical sequence Circular Arrow Diagram PowerPoint templates are Adorable. Use our Data PowerPoint templates and PPT Slides will make the presenter successul in his career/life. Make your audience feel exclusive with our 4 Diverging Steps Of Logical Sequence Circular Arrow Diagram PowerPoint Templates. Give them special attention with your thoughts.
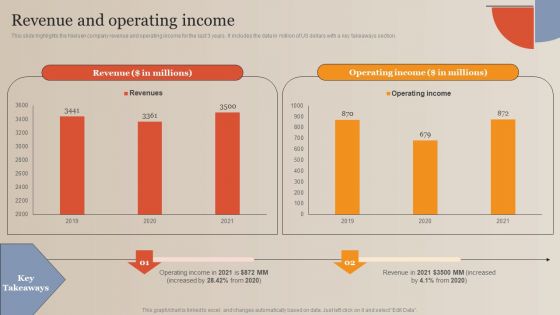
Market Study Company Outline Revenue And Operating Income Themes PDF
This slide highlights the Nielsen company revenue and operating income for the last 3 years. It includes the data in million of US dollars with a key takeaways section. Slidegeeks is here to make your presentations a breeze with Market Study Company Outline Revenue And Operating Income Themes PDF With our easy to use and customizable templates, you can focus on delivering your ideas rather than worrying about formatting. With a variety of designs to choose from, you are sure to find one that suits your needs. And with animations and unique photos, illustrations, and fonts, you can make your presentation pop. So whether you are giving a sales pitch or presenting to the board, make sure to check out Slidegeeks first.
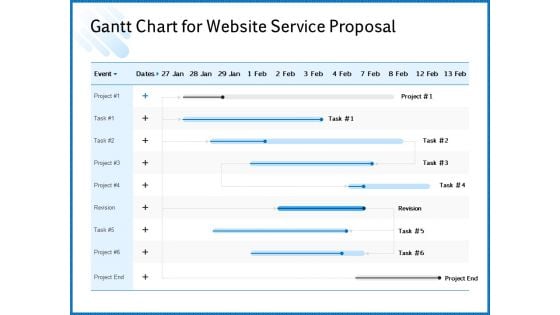
Web Design Template Gantt Chart For Website Service Proposal Formats PDF
Your complex projects can be managed and organized simultaneously using this detailed web design template gantt chart for website service proposal formats pdf template. Track the milestones, tasks, phases, activities, and subtasks to get an updated visual of your project. Share your planning horizon and release plan with this well crafted presentation template. This exemplary template can be used to plot various dependencies to distinguish the tasks in the pipeline and their impact on the schedules and deadlines of the project. Apart from this, you can also share this visual presentation with your team members and stakeholders. It a resourceful tool that can be incorporated into your business structure. Therefore, download and edit it conveniently to add the data and statistics as per your requirement.
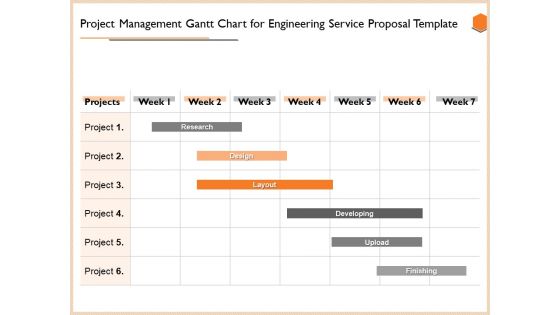
Project Management Gantt Chart For Engineering Service Proposal Template Graphics PDF
Your complex projects can be managed and organized simultaneously using this detailed project management gantt chart for engineering service proposal template graphics pdf template. Track the milestones, tasks, phases, activities, and subtasks to get an updated visual of your project. Share your planning horizon and release plan with this well crafted presentation template. This exemplary template can be used to plot various dependencies to distinguish the tasks in the pipeline and their impact on the schedules and deadlines of the project. Apart from this, you can also share this visual presentation with your team members and stakeholders. It a resourceful tool that can be incorporated into your business structure. Therefore, download and edit it conveniently to add the data and statistics as per your requirement.
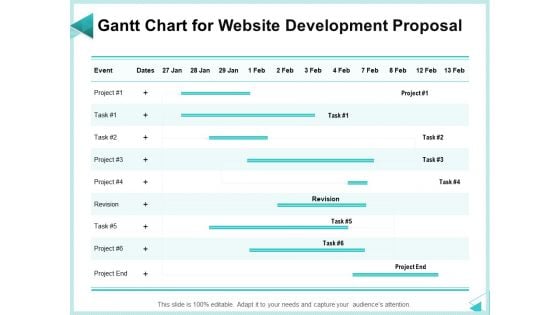
Web Development IT And Design Templates Gantt Chart For Website Development Proposal Demonstration PDF
Your complex projects can be managed and organized simultaneously using this detailed web development it and design templates gantt chart for website development proposal demonstration pdf template. Track the milestones, tasks, phases, activities, and subtasks to get an updated visual of your project. Share your planning horizon and release plan with this well crafted presentation template. This exemplary template can be used to plot various dependencies to distinguish the tasks in the pipeline and their impact on the schedules and deadlines of the project. Apart from this, you can also share this visual presentation with your team members and stakeholders. It a resourceful tool that can be incorporated into your business structure. Therefore, download and edit it conveniently to add the data and statistics as per your requirement.
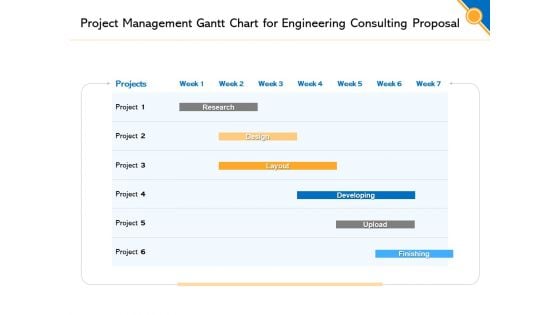
Civil Construction Project Management Gantt Chart For Engineering Consulting Proposal Introduction PDF
Your complex projects can be managed and organized simultaneously using this detailed civil construction project management gantt chart for engineering consulting proposal introduction pdf template. Track the milestones, tasks, phases, activities, and subtasks to get an updated visual of your project. Share your planning horizon and release plan with this well crafted presentation template. This exemplary template can be used to plot various dependencies to distinguish the tasks in the pipeline and their impact on the schedules and deadlines of the project. Apart from this, you can also share this visual presentation with your team members and stakeholders. It a resourceful tool that can be incorporated into your business structure. Therefore, download and edit it conveniently to add the data and statistics as per your requirement.
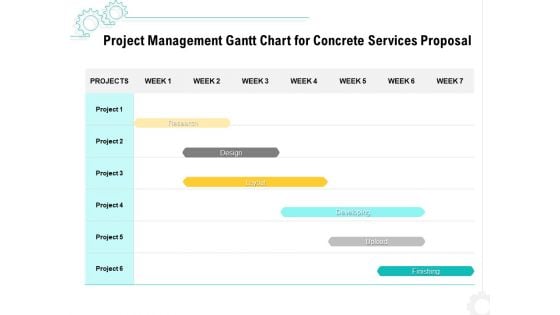
Construction Material Service Project Management Gantt Chart For Concrete Services Proposal Professional PDF
Your complex projects can be managed and organized simultaneously using this detailed construction material service project management gantt chart for concrete services proposal professional pdf template. Track the milestones, tasks, phases, activities, and subtasks to get an updated visual of your project. Share your planning horizon and release plan with this well crafted presentation template. This exemplary template can be used to plot various dependencies to distinguish the tasks in the pipeline and their impact on the schedules and deadlines of the project. Apart from this, you can also share this visual presentation with your team members and stakeholders. It a resourceful tool that can be incorporated into your business structure. Therefore, download and edit it conveniently to add the data and statistics as per your requirement.
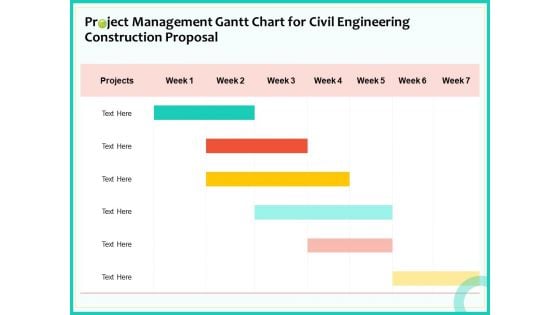
Civil Engineering Consulting Services Project Management Gantt Chart For Civil Engineering Construction Proposal Formats PDF
Your complex projects can be managed and organized simultaneously using this detailed civil engineering consulting services project management gantt chart for civil engineering construction proposal formats pdf template. Track the milestones, tasks, phases, activities, and subtasks to get an updated visual of your project. Share your planning horizon and release plan with this well crafted presentation template. This exemplary template can be used to plot various dependencies to distinguish the tasks in the pipeline and their impact on the schedules and deadlines of the project. Apart from this, you can also share this visual presentation with your team members and stakeholders. It a resourceful tool that can be incorporated into your business structure. Therefore, download and edit it conveniently to add the data and statistics as per your requirement.
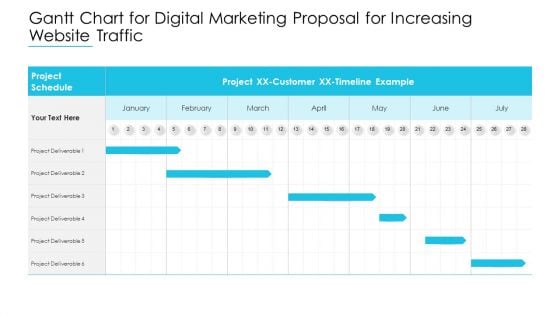
Gantt Chart For Digital Marketing Proposal For Increasing Website Traffic Summary PDF
Your complex projects can be managed and organized simultaneously using this detailed gantt chart for digital marketing proposal for increasing website traffic summary pdf template. Track the milestones, tasks, phases, activities, and subtasks to get an updated visual of your project. Share your planning horizon and release plan with this well crafted presentation template. This exemplary template can be used to plot various dependencies to distinguish the tasks in the pipeline and their impact on the schedules and deadlines of the project. Apart from this, you can also share this visual presentation with your team members and stakeholders. It a resourceful tool that can be incorporated into your business structure. Therefore, download and edit it conveniently to add the data and statistics as per your requirement.
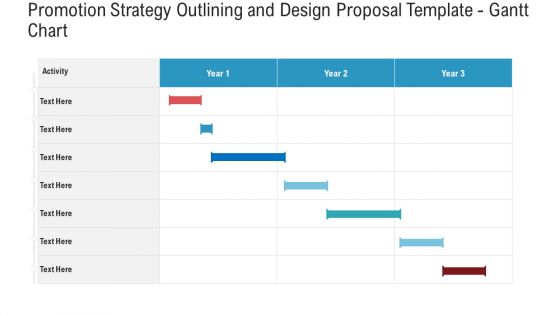
Promotion Strategy Outlining And Design Proposal Template Gantt Chart Clipart PDF
Your complex projects can be managed and organized simultaneously using this detailed promotion strategy outlining and design proposal template gantt chart clipart pdf template. Track the milestones, tasks, phases, activities, and subtasks to get an updated visual of your project. Share your planning horizon and release plan with this well crafted presentation template. This exemplary template can be used to plot various dependencies to distinguish the tasks in the pipeline and their impact on the schedules and deadlines of the project. Apart from this, you can also share this visual presentation with your team members and stakeholders. It a resourceful tool that can be incorporated into your business structure. Therefore, download and edit it conveniently to add the data and statistics as per your requirement.
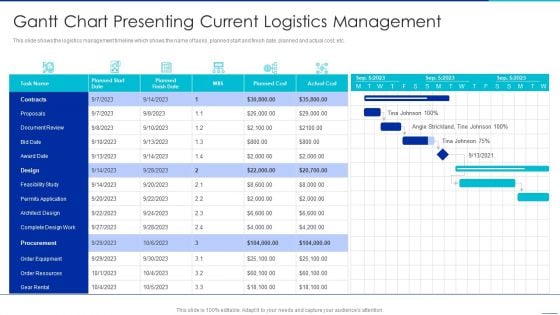
Optimizing Logistics Management Process Gantt Chart Presenting Current Logistics Management Clipart PDF
This slide shows the logistics management timeline which shows the name of tasks, planned start and finish date, planned and actual cost, etc. Your complex projects can be managed and organized simultaneously using this detailed optimizing logistics management process gantt chart presenting current logistics management clipart pdf template. Track the milestones, tasks, phases, activities, and subtasks to get an updated visual of your project. Share your planning horizon and release plan with this well crafted presentation template. This exemplary template can be used to plot various dependencies to distinguish the tasks in the pipeline and their impact on the schedules and deadlines of the project. Apart from this, you can also share this visual presentation with your team members and stakeholders. It a resourceful tool that can be incorporated into your business structure. Therefore, download and edit it conveniently to add the data and statistics as per your requirement.
Revenue Cycle Management Deal Gantt Chart Ppt Slides Graphics Download PDF
Your complex projects can be managed and organized simultaneously using this detailed revenue cycle management deal gantt chart ppt slides graphics download pdf template. Track the milestones, tasks, phases, activities, and subtasks to get an updated visual of your project. Share your planning horizon and release plan with this well-crafted presentation template. This exemplary template can be used to plot various dependencies to distinguish the tasks in the pipeline and their impact on the schedules and deadlines of the project. Apart from this, you can also share this visual presentation with your team members and stakeholders. It a resourceful tool that can be incorporated into your business structure. Therefore, download and edit it conveniently to add the data and statistics as per your requirement.
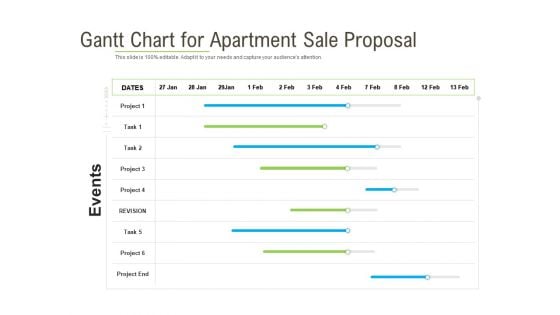
Rapid Innovation In HR Technology Space Gantt Chart For Apartment Sale Proposal Structure PDF
Your complex projects can be managed and organized simultaneously using this detailed rapid innovation in hr technology space gantt chart for apartment sale proposal structure pdf template. Track the milestones, tasks, phases, activities, and subtasks to get an updated visual of your project. Share your planning horizon and release plan with this well crafted presentation template. This exemplary template can be used to plot various dependencies to distinguish the tasks in the pipeline and their impact on the schedules and deadlines of the project. Apart from this, you can also share this visual presentation with your team members and stakeholders. It a resourceful tool that can be incorporated into your business structure. Therefore, download and edit it conveniently to add the data and statistics as per your requirement.
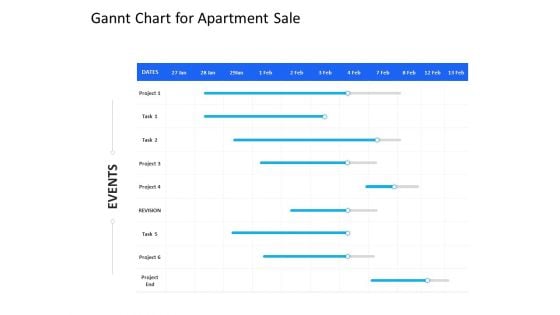
Organization Manpower Management Technology Gannt Chart For Apartment Sale Elements PDF
Your complex projects can be managed and organized simultaneously using this detailed organization manpower management technology gannt chart for apartment sale elements pdf template. Track the milestones, tasks, phases, activities, and subtasks to get an updated visual of your project. Share your planning horizon and release plan with this well crafted presentation template. This exemplary template can be used to plot various dependencies to distinguish the tasks in the pipeline and their impact on the schedules and deadlines of the project. Apart from this, you can also share this visual presentation with your team members and stakeholders. It a resourceful tool that can be incorporated into your business structure. Therefore, download and edit it conveniently to add the data and statistics as per your requirement.
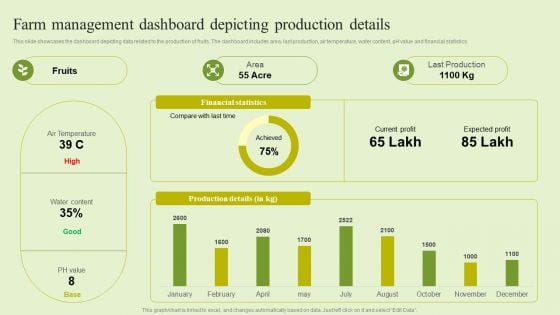
Agriculture Marketing Strategy To Improve Revenue Performance Farm Management Dashboard Depicting Production Themes PDF
This slide showcases the dashboard depicting data related to the production of fruits. The dashboard includes area, last production, air temperature, water content, pH value and financial statistics. Coming up with a presentation necessitates that the majority of the effort goes into the content and the message you intend to convey. The visuals of a PowerPoint presentation can only be effective if it supplements and supports the story that is being told. Keeping this in mind our experts created Agriculture Marketing Strategy To Improve Revenue Performance Farm Management Dashboard Depicting Production Themes PDF to reduce the time that goes into designing the presentation. This way, you can concentrate on the message while our designers take care of providing you with the right template for the situation.
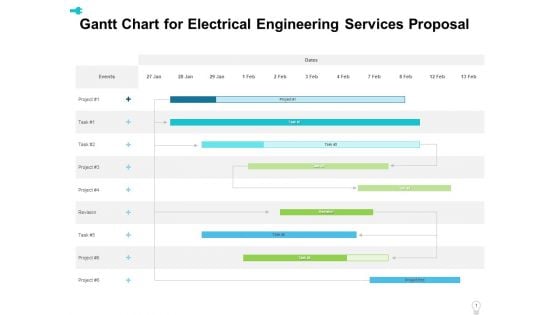
Gantt Chart For Electrical Engineering Services Proposal Ppt Layouts Layout PDF
Your complex projects can be managed and organized simultaneously using this detailed gantt chart for electrical engineering services proposal ppt layouts layout pdf template. Track the milestones, tasks, phases, activities, and subtasks to get an updated visual of your project. Share your planning horizon and release plan with this well-crafted presentation template. This exemplary template can be used to plot various dependencies to distinguish the tasks in the pipeline and their impact on the schedules and deadlines of the project. Apart from this, you can also share this visual presentation with your team members and stakeholders. It a resourceful tool that can be incorporated into your business structure. Therefore, download and edit it conveniently to add the data and statistics as per your requirement.
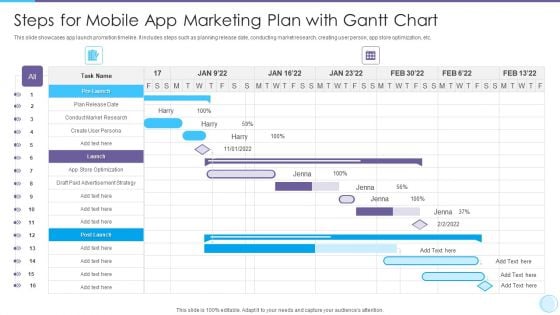
Steps For Mobile App Marketing Plan With Gantt Chart Rules PDF
Your complex projects can be managed and organized simultaneously using this detailed Steps For Mobile App Marketing Plan With Gantt Chart Rules PDF template. Track the milestones, tasks, phases, activities, and subtasks to get an updated visual of your project. Share your planning horizon and release plan with this well crafted presentation template. This exemplary template can be used to plot various dependencies to distinguish the tasks in the pipeline and their impact on the schedules and deadlines of the project. Apart from this, you can also share this visual presentation with your team members and stakeholders. It a resourceful tool that can be incorporated into your business structure. Therefore, download and edit it conveniently to add the data and statistics as per your requirement
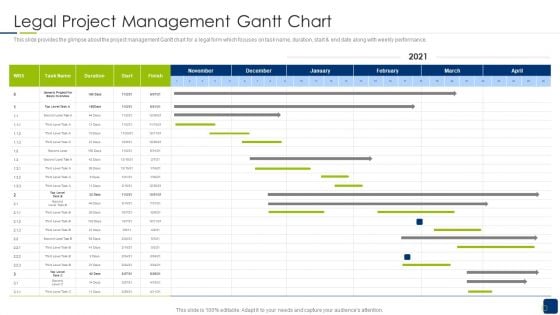
Scrum Statutory Management IT Legal Project Management Gantt Chart Mockup PDF
Your complex projects can be managed and organized simultaneously using this detailed scrum statutory management it legal project management gantt chart mockup pdf template. Track the milestones, tasks, phases, activities, and subtasks to get an updated visual of your project. Share your planning horizon and release plan with this well crafted presentation template. This exemplary template can be used to plot various dependencies to distinguish the tasks in the pipeline and their impact on the schedules and deadlines of the project. Apart from this, you can also share this visual presentation with your team members and stakeholders. It a resourceful tool that can be incorporated into your business structure. Therefore, download and edit it conveniently to add the data and statistics as per your requirement.
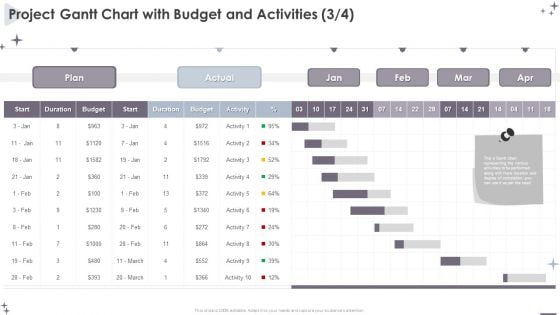
Project Administration Bundle Project Gantt Chart With Budget And Activities Infographics PDF
Your complex projects can be managed and organized simultaneously using this detailed Project Administration Bundle Project Gantt Chart With Budget And Activities Infographics PDF template. Track the milestones, tasks, phases, activities, and subtasks to get an updated visual of your project. Share your planning horizon and release plan with this well crafted presentation template. This exemplary template can be used to plot various dependencies to distinguish the tasks in the pipeline and their impact on the schedules and deadlines of the project. Apart from this, you can also share this visual presentation with your team members and stakeholders. It a resourceful tool that can be incorporated into your business structure. Therefore, download and edit it conveniently to add the data and statistics as per your requirement.
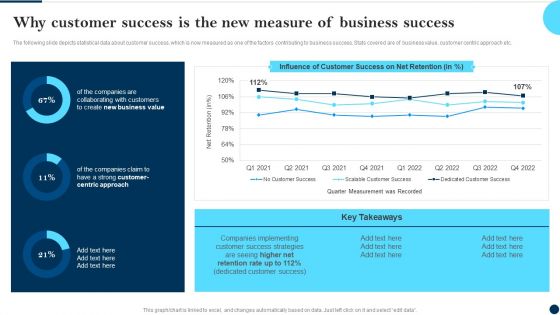
Why Customer Success Is The New Measure Of Business Success Client Success Best Practices Guide Themes PDF
The following slide depicts statistical data about customer success, which is now measured as one of the factors contributing to business success. Stats covered are of business value, customer centric approach etc.Find highly impressive Why Customer Success Is The New Measure Of Business Success Client Success Best Practices Guide Themes PDF on Slidegeeks to deliver a meaningful presentation. You can save an ample amount of time using these presentation templates. No need to worry to prepare everything from scratch because Slidegeeks experts have already done a huge research and work for you. You need to download Why Customer Success Is The New Measure Of Business Success Client Success Best Practices Guide Themes PDF for your upcoming presentation. All the presentation templates are 100 precent editable and you can change the color and personalize the content accordingly. Download now.
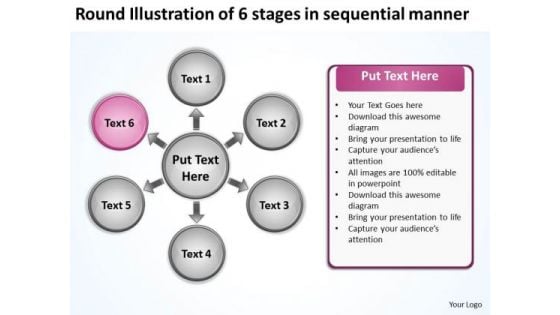
Illustration Of 6 Stages In Sequential Manner Chart Circular Diagram PowerPoint Templates
We present our illustration of 6 stages in sequential manner chart Circular Diagram PowerPoint templates.Download our Process and Flows PowerPoint Templates because knowledge is power goes the popular saying. Use our Marketing PowerPoint Templates because customer satisfaction is a mantra of the marketplace. Building a loyal client base is an essential element of your business. Use our Business PowerPoint Templates because you have had your share of being a goldfish in a small bowl.you are ready to launch out and spread your wings. Present our Circle Charts PowerPoint Templates because this graphics helps you to prove how they mesh to motivate the company team and provide the steam to activate the composite machine. Download our Future PowerPoint Templates because others respect the intrinsic value of your words.Use these PowerPoint slides for presentations relating to Business, chart, circle,colors, concept, corporate, cycle, data,design, detail, development, diagram,engineering, graphic, ideas, illustration,image, implement, implementation, life,lifecycle, management, model, objects,organization, phase, plan, process,product, professional, project, quality,schema, shape, software, stack, stage,steps, strategy, structure, success. The prominent colors used in the PowerPoint template are Pink, White, Black. Customers tell us our illustration of 6 stages in sequential manner chart Circular Diagram PowerPoint templates are Zippy. Customers tell us our concept PowerPoint templates and PPT Slides are Striking. Customers tell us our illustration of 6 stages in sequential manner chart Circular Diagram PowerPoint templates are Detailed. People tell us our cycle PowerPoint templates and PPT Slides are Nifty. Customers tell us our illustration of 6 stages in sequential manner chart Circular Diagram PowerPoint templates are Upbeat. Customers tell us our data PowerPoint templates and PPT Slides are incredible easy to use. Embark upon an epic journey. Chart it out to the last detail on our Illustration Of 6 Stages In Sequential Manner Chart Circular Diagram PowerPoint Templates.
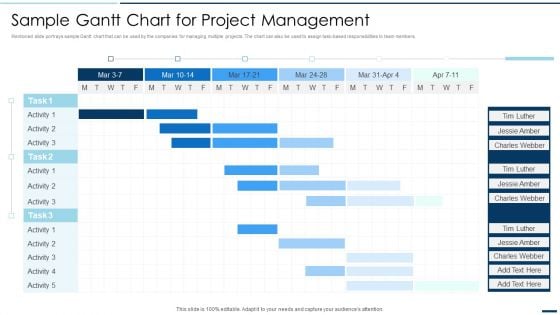
QA Plan Set 2 Sample Gantt Chart For Project Management Ppt PowerPoint Presentation File Mockup PDF
Mentioned slide portrays sample Gantt chart that can be used by the companies for managing multiple projects. The chart can also be used to assign task-based responsibilities to team members. Your complex projects can be managed and organized simultaneously using this detailed QA Plan Set 2 Sample Gantt Chart For Project Management Ppt PowerPoint Presentation File Mockup PDF template. Track the milestones, tasks, phases, activities, and subtasks to get an updated visual of your project. Share your planning horizon and release plan with this well crafted presentation template. This exemplary template can be used to plot various dependencies to distinguish the tasks in the pipeline and their impact on the schedules and deadlines of the project. Apart from this, you can also share this visual presentation with your team members and stakeholders. It a resourceful tool that can be incorporated into your business structure. Therefore, download and edit it conveniently to add the data and statistics as per your requirement.
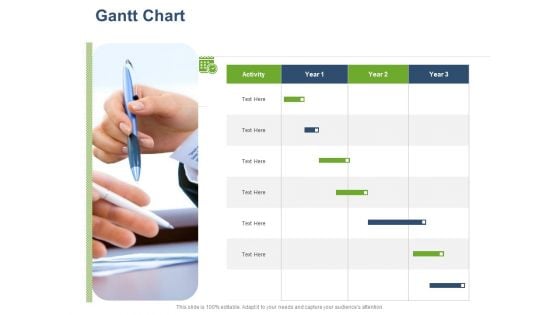
Online Banking Administration Procedure Gantt Chart Ppt Inspiration Master Slide PDF
Manage your complex projects and organize them simultaneously with this detailed Gantt Chart PowerPoint Template. Track your milestones, tasks, phases, activities, subtasks amongst other constituents that will give you an updated visual of your project. Reflect your planning horizon and capture your release plan in one view with this Gantt Chart PowerPoint presentation template. You can plot various dependencies directly on this Timeline PowerPoint Presentation Layout to see which tasks are still in the pipeline and how the delays in them are impacting the schedules and deadlines of the project. Apart from this, you can also share this updated visual with your team members and stakeholders, thus making it a resourceful tool to be incorporated in your business structure. Not only this but also the editable layout of this slide helps you to add your data and statistics at your convenience.
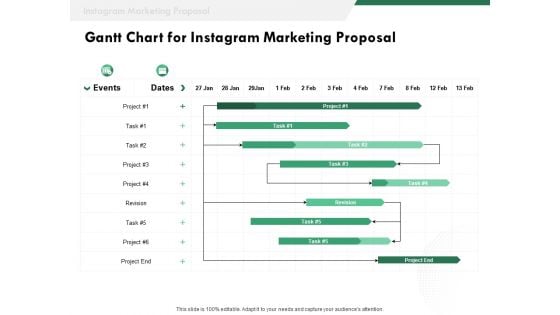
SMM Gantt Chart For Instagram Marketing Proposal Ppt Professional Backgrounds PDF
Manage your complex projects and organize them simultaneously with this detailed Gantt Chart PowerPoint Template. Track your milestones, tasks, phases, activities, subtasks amongst other constituents that will give you an updated visual of your project. Reflect your planning horizon and capture your release plan in one view with this Gantt Chart PowerPoint presentation template. You can plot various dependencies directly on this Timeline PowerPoint Presentation Layout to see which tasks are still in the pipeline and how the delays in them are impacting the schedules and deadlines of the project. Apart from this, you can also share this updated visual with your team members and stakeholders, thus making it a resourceful tool to be incorporated in your business structure. Not only this but also the editable layout of this slide helps you to add your data and statistics at your convenience.
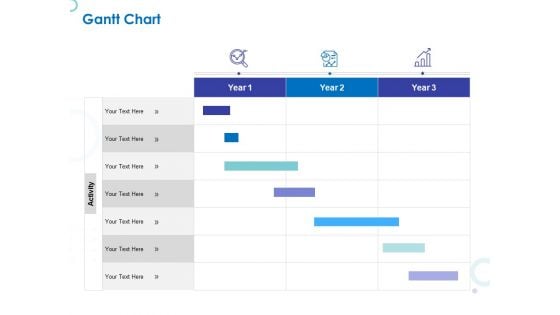
Web Banking For Financial Transactions Gantt Chart Ppt Slides Graphics Download PDF
Manage your complex projects and organize them simultaneously with this detailed Gantt Chart PowerPoint Template. Track your milestones, tasks, phases, activities, subtasks amongst other constituents that will give you an updated visual of your project. Reflect your planning horizon and capture your release plan in one view with this Gantt Chart PowerPoint presentation template. You can plot various dependencies directly on this Timeline PowerPoint Presentation Layout to see which tasks are still in the pipeline and how the delays in them are impacting the schedules and deadlines of the project. Apart from this, you can also share this updated visual with your team members and stakeholders, thus making it a resourceful tool to be incorporated in your business structure. Not only this but also the editable layout of this slide helps you to add your data and statistics at your convenience.
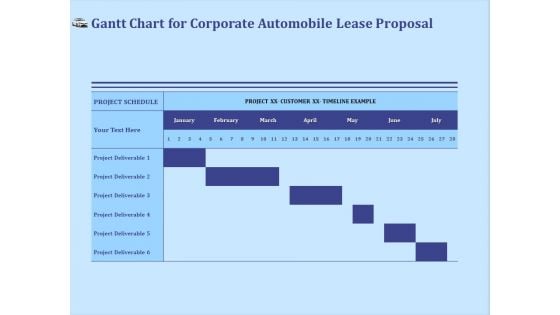
Vehicle Leasing Gantt Chart For Corporate Automobile Lease Proposal Portrait PDF
Manage your complex projects and organize them simultaneously with this detailed Gantt Chart PowerPoint Template. Track your milestones, tasks, phases, activities, subtasks amongst other constituents that will give you an updated visual of your project. Reflect your planning horizon and capture your release plan in one view with this Gantt Chart PowerPoint presentation template. You can plot various dependencies directly on this Timeline PowerPoint Presentation Layout to see which tasks are still in the pipeline and how the delays in them are impacting the schedules and deadlines of the project. Apart from this, you can also share this updated visual with your team members and stakeholders, thus making it a resourceful tool to be incorporated in your business structure. Not only this but also the editable layout of this slide helps you to add your data and statistics at your convenience.
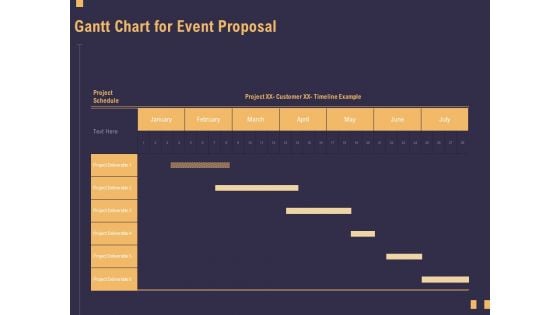
Business Event Planning Gantt Chart For Event Proposal Ppt Ideas Tips PDF
Manage your complex projects and organize them simultaneously with this detailed Gantt Chart PowerPoint Template. Track your milestones, tasks, phases, activities, subtasks amongst other constituents that will give you an updated visual of your project. Reflect your planning horizon and capture your release plan in one view with this Gantt Chart PowerPoint presentation template. You can plot various dependencies directly on this Timeline PowerPoint Presentation Layout to see which tasks are still in the pipeline and how the delays in them are impacting the schedules and deadlines of the project. Apart from this, you can also share this updated visual with your team members and stakeholders, thus making it a resourceful tool to be incorporated in your business structure. Not only this but also the editable layout of this slide helps you to add your data and statistics at your convenience.
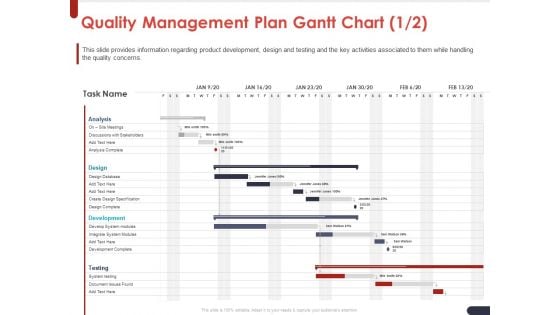
Project Quality Planning And Controlling Quality Management Plan Gantt Chart Design Mockup PDF
Manage your complex projects and organize them simultaneously with this detailed Gantt Chart PowerPoint Template. Track your milestones, tasks, phases, activities, subtasks amongst other constituents that will give you an updated visual of your project. Reflect your planning horizon and capture your release plan in one view with this Gantt Chart PowerPoint presentation template. You can plot various dependencies directly on this Timeline PowerPoint Presentation Layout to see which tasks are still in the pipeline and how the delays in them are impacting the schedules and deadlines of the project. Apart from this, you can also share this updated visual with your team members and stakeholders, thus making it a resourceful tool to be incorporated in your business structure. Not only this but also the editable layout of this slide helps you to add your data and statistics at your convenience.
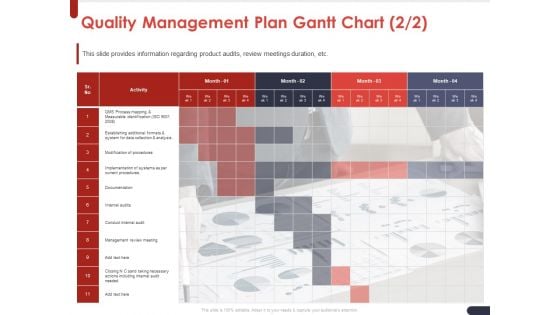
Project Quality Planning And Controlling Quality Management Plan Gantt Chart Mockup PDF
Manage your complex projects and organize them simultaneously with this detailed Gantt Chart PowerPoint Template. Track your milestones, tasks, phases, activities, subtasks amongst other constituents that will give you an updated visual of your project. Reflect your planning horizon and capture your release plan in one view with this Gantt Chart PowerPoint presentation template. You can plot various dependencies directly on this Timeline PowerPoint Presentation Layout to see which tasks are still in the pipeline and how the delays in them are impacting the schedules and deadlines of the project. Apart from this, you can also share this updated visual with your team members and stakeholders, thus making it a resourceful tool to be incorporated in your business structure. Not only this but also the editable layout of this slide helps you to add your data and statistics at your convenience.
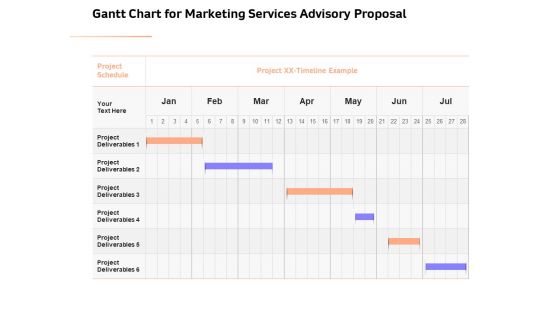
Sales Strategy Consulting Gantt Chart For Marketing Services Advisory Proposal Elements PDF
Manage your complex projects and organize them simultaneously with this detailed Gantt Chart PowerPoint Template. Track your milestones, tasks, phases, activities, subtasks amongst other constituents that will give you an updated visual of your project. Reflect your planning horizon and capture your release plan in one view with this Gantt Chart PowerPoint presentation template. You can plot various dependencies directly on this Timeline PowerPoint Presentation Layout to see which tasks are still in the pipeline and how the delays in them are impacting the schedules and deadlines of the project. Apart from this, you can also share this updated visual with your team members and stakeholders, thus making it a resourceful tool to be incorporated in your business structure. Not only this but also the editable layout of this slide helps you to add your data and statistics at your convenience.
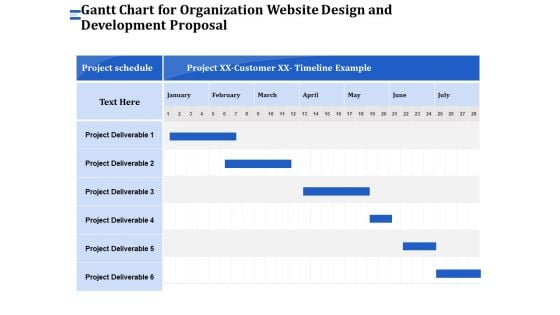
Firm Webpage Builder And Design Gantt Chart For Organization Website Design And Development Proposal Designs PDF
Manage your complex projects and organize them simultaneously with this detailed Gantt Chart PowerPoint Template. Track your milestones, tasks, phases, activities, subtasks amongst other constituents that will give you an updated visual of your project. Reflect your planning horizon and capture your release plan in one view with this Gantt Chart PowerPoint presentation template. You can plot various dependencies directly on this Timeline PowerPoint Presentation Layout to see which tasks are still in the pipeline and how the delays in them are impacting the schedules and deadlines of the project. Apart from this, you can also share this updated visual with your team members and stakeholders, thus making it a resourceful tool to be incorporated in your business structure. Not only this but also the editable layout of this slide helps you to add your data and statistics at your convenience.
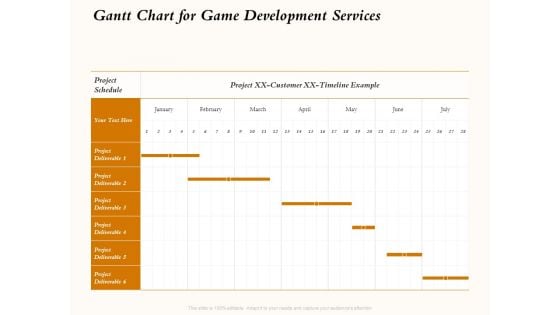
Three Dimensional Games Proposal Gantt Chart For Game Development Services Inspiration PDF
Manage your complex projects and organize them simultaneously with this detailed Gantt Chart PowerPoint Template. Track your milestones, tasks, phases, activities, subtasks amongst other constituents that will give you an updated visual of your project. Reflect your planning horizon and capture your release plan in one view with this Gantt Chart PowerPoint presentation template. You can plot various dependencies directly on this Timeline PowerPoint Presentation Layout to see which tasks are still in the pipeline and how the delays in them are impacting the schedules and deadlines of the project. Apart from this, you can also share this updated visual with your team members and stakeholders, thus making it a resourceful tool to be incorporated in your business structure. Not only this but also the editable layout of this slide helps you to add your data and statistics at your convenience.
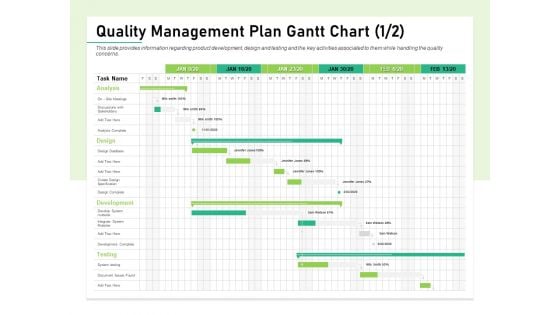
Quality Management Plan QMP Quality Management Plan Gantt Chart Design Clipart PDF
Manage your complex projects and organize them simultaneously with this detailed Gantt Chart PowerPoint Template. Track your milestones, tasks, phases, activities, subtasks amongst other constituents that will give you an updated visual of your project. Reflect your planning horizon and capture your release plan in one view with this Gantt Chart PowerPoint presentation template. You can plot various dependencies directly on this Timeline PowerPoint Presentation Layout to see which tasks are still in the pipeline and how the delays in them are impacting the schedules and deadlines of the project. Apart from this, you can also share this updated visual with your team members and stakeholders, thus making it a resourceful tool to be incorporated in your business structure. Not only this but also the editable layout of this slide helps you to add your data and statistics at your convenience.
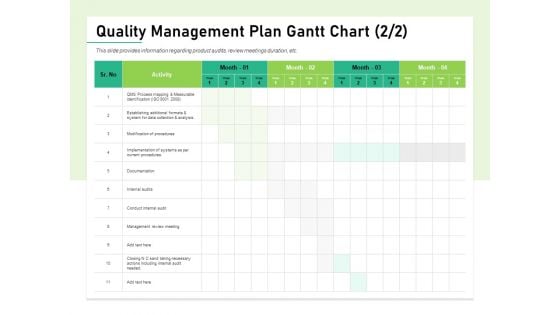
Quality Management Plan QMP Quality Management Plan Gantt Chart Mockup PDF
Manage your complex projects and organize them simultaneously with this detailed Gantt Chart PowerPoint Template. Track your milestones, tasks, phases, activities, subtasks amongst other constituents that will give you an updated visual of your project. Reflect your planning horizon and capture your release plan in one view with this Gantt Chart PowerPoint presentation template. You can plot various dependencies directly on this Timeline PowerPoint Presentation Layout to see which tasks are still in the pipeline and how the delays in them are impacting the schedules and deadlines of the project. Apart from this, you can also share this updated visual with your team members and stakeholders, thus making it a resourceful tool to be incorporated in your business structure. Not only this but also the editable layout of this slide helps you to add your data and statistics at your convenience.
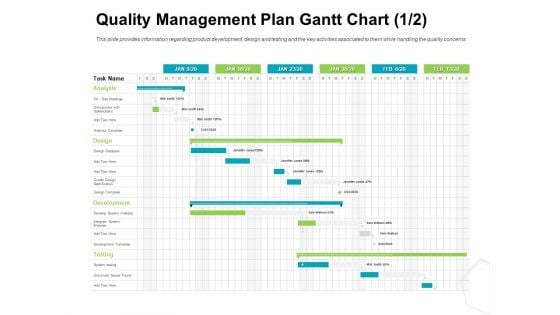
Project Quality Management Plan Quality Management Plan Gantt Chart Design Template PDF
Manage your complex projects and organize them simultaneously with this detailed Gantt Chart PowerPoint Template. Track your milestones, tasks, phases, activities, subtasks amongst other constituents that will give you an updated visual of your project. Reflect your planning horizon and capture your release plan in one view with this Gantt Chart PowerPoint presentation template. You can plot various dependencies directly on this Timeline PowerPoint Presentation Layout to see which tasks are still in the pipeline and how the delays in them are impacting the schedules and deadlines of the project. Apart from this, you can also share this updated visual with your team members and stakeholders, thus making it a resourceful tool to be incorporated in your business structure. Not only this but also the editable layout of this slide helps you to add your data and statistics at your convenience.
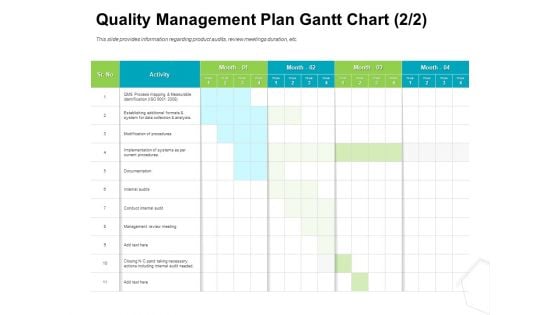
Project Quality Management Plan Quality Management Plan Gantt Chart Graphics PDF
Manage your complex projects and organize them simultaneously with this detailed Gantt Chart PowerPoint Template. Track your milestones, tasks, phases, activities, subtasks amongst other constituents that will give you an updated visual of your project. Reflect your planning horizon and capture your release plan in one view with this Gantt Chart PowerPoint presentation template. You can plot various dependencies directly on this Timeline PowerPoint Presentation Layout to see which tasks are still in the pipeline and how the delays in them are impacting the schedules and deadlines of the project. Apart from this, you can also share this updated visual with your team members and stakeholders, thus making it a resourceful tool to be incorporated in your business structure. Not only this but also the editable layout of this slide helps you to add your data and statistics at your convenience.
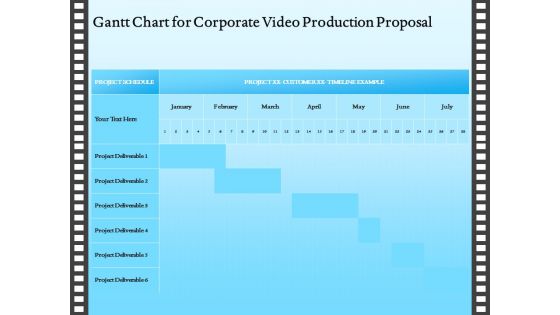
Corporate Video Gantt Chart For Corporate Video Production Proposal Ppt Gallery Outline PDF
Manage your complex projects and organize them simultaneously with this detailed Gantt Chart PowerPoint Template. Track your milestones, tasks, phases, activities, subtasks amongst other constituents that will give you an updated visual of your project. Reflect your planning horizon and capture your release plan in one view with this Gantt Chart PowerPoint presentation template. You can plot various dependencies directly on this Timeline PowerPoint Presentation Layout to see which tasks are still in the pipeline and how the delays in them are impacting the schedules and deadlines of the project. Apart from this, you can also share this updated visual with your team members and stakeholders, thus making it a resourceful tool to be incorporated in your business structure. Not only this but also the editable layout of this slide helps you to add your data and statistics at your convenience.
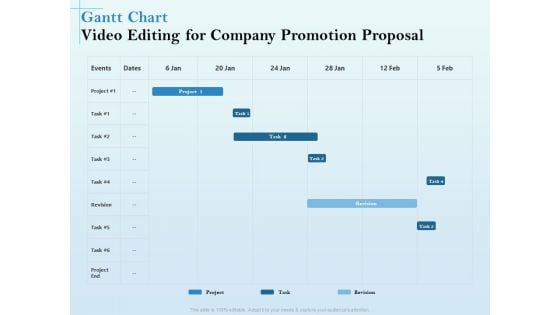
Business Marketing Video Making Gantt Chart Video Editing For Company Promotion Proposal Rules PDF
Manage your complex projects and organize them simultaneously with this detailed Gantt Chart PowerPoint Template. Track your milestones, tasks, phases, activities, subtasks amongst other constituents that will give you an updated visual of your project. Reflect your planning horizon and capture your release plan in one view with this Gantt Chart PowerPoint presentation template. You can plot various dependencies directly on this Timeline PowerPoint Presentation Layout to see which tasks are still in the pipeline and how the delays in them are impacting the schedules and deadlines of the project. Apart from this, you can also share this updated visual with your team members and stakeholders, thus making it a resourceful tool to be incorporated in your business structure. Not only this but also the editable layout of this slide helps you to add your data and statistics at your convenience.
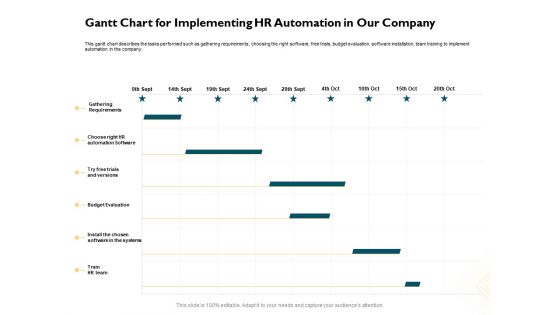
Automatically Controlling Process Gantt Chart For Implementing HR Automation In Our Company Mockup PDF
Manage your complex projects and organize them simultaneously with this detailed Gantt Chart PowerPoint Template. Track your milestones, tasks, phases, activities, subtasks amongst other constituents that will give you an updated visual of your project. Reflect your planning horizon and capture your release plan in one view with this Gantt Chart PowerPoint presentation template. You can plot various dependencies directly on this Timeline PowerPoint Presentation Layout to see which tasks are still in the pipeline and how the delays in them are impacting the schedules and deadlines of the project. Apart from this, you can also share this updated visual with your team members and stakeholders, thus making it a resourceful tool to be incorporated in your business structure. Not only this but also the editable layout of this slide helps you to add your data and statistics at your convenience.
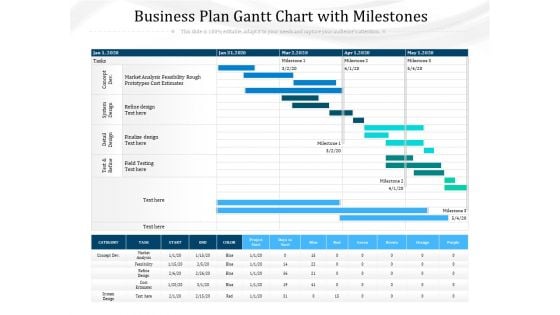
Business Plan Gantt Chart With Milestones Ppt PowerPoint Presentation Gallery Samples PDF
Manage your complex projects and organize them simultaneously with this detailed Gantt Chart PowerPoint Template. Track your milestones, tasks, phases, activities, subtasks amongst other constituents that will give you an updated visual of your project. Reflect your planning horizon and capture your release plan in one view with this Gantt Chart PowerPoint presentation template. You can plot various dependencies directly on this Timeline PowerPoint Presentation Layout to see which tasks are still in the pipeline and how the delays in them are impacting the schedules and deadlines of the project. Apart from this, you can also share this updated visual with your team members and stakeholders, thus making it a resourceful tool to be incorporated in your business structure. Not only this but also the editable layout of this slide helps you to add your data and statistics at your convenience.
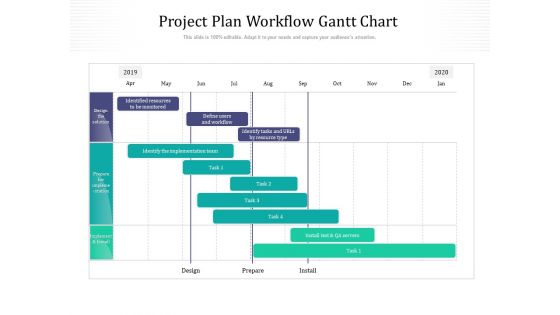
Project Plan Workflow Gantt Chart Ppt PowerPoint Presentation File Model PDF
Manage your complex projects and organize them simultaneously with this detailed Gantt Chart PowerPoint Template. Track your milestones, tasks, phases, activities, subtasks amongst other constituents that will give you an updated visual of your project. Reflect your planning horizon and capture your release plan in one view with this Gantt Chart PowerPoint presentation template. You can plot various dependencies directly on this Timeline PowerPoint Presentation Layout to see which tasks are still in the pipeline and how the delays in them are impacting the schedules and deadlines of the project. Apart from this, you can also share this updated visual with your team members and stakeholders, thus making it a resourceful tool to be incorporated in your business structure. Not only this but also the editable layout of this slide helps you to add your data and statistics at your convenience.
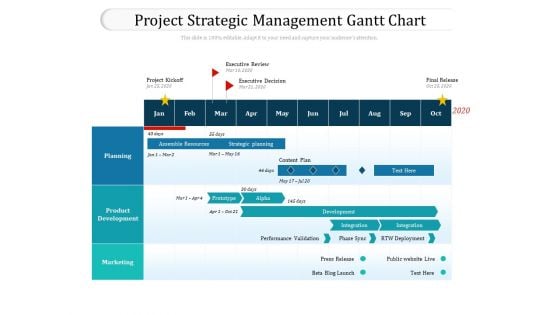
Project Strategic Management Gantt Chart Ppt PowerPoint Presentation Gallery Templates PDF
Manage your complex projects and organize them simultaneously with this detailed Gantt Chart PowerPoint Template. Track your milestones, tasks, phases, activities, subtasks amongst other constituents that will give you an updated visual of your project. Reflect your planning horizon and capture your release plan in one view with this Gantt Chart PowerPoint presentation template. You can plot various dependencies directly on this Timeline PowerPoint Presentation Layout to see which tasks are still in the pipeline and how the delays in them are impacting the schedules and deadlines of the project. Apart from this, you can also share this updated visual with your team members and stakeholders, thus making it a resourceful tool to be incorporated in your business structure. Not only this but also the editable layout of this slide helps you to add your data and statistics at your convenience.
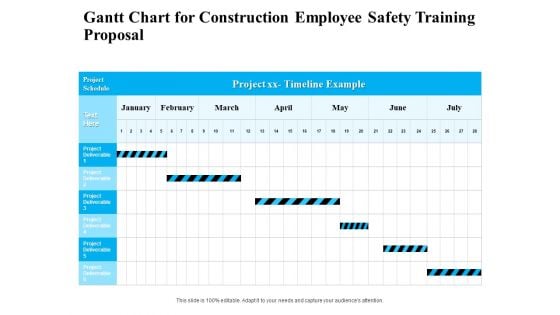
Employee Safety Health Training Program Gantt Chart For Construction Employee Training Proposal Rules PDF
Manage your complex projects and organize them simultaneously with this detailed Gantt Chart PowerPoint Template. Track your milestones, tasks, phases, activities, subtasks amongst other constituents that will give you an updated visual of your project. Reflect your planning horizon and capture your release plan in one view with this Gantt Chart PowerPoint presentation template. You can plot various dependencies directly on this Timeline PowerPoint Presentation Layout to see which tasks are still in the pipeline and how the delays in them are impacting the schedules and deadlines of the project. Apart from this, you can also share this updated visual with your team members and stakeholders, thus making it a resourceful tool to be incorporated in your business structure. Not only this but also the editable layout of this slide helps you to add your data and statistics at your convenience.
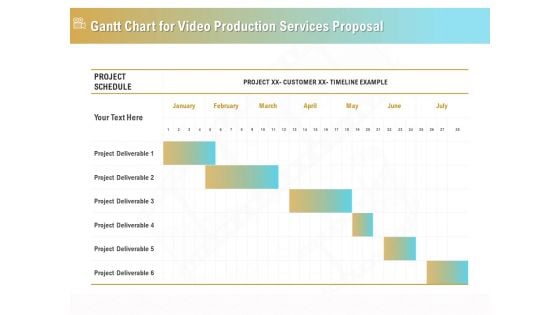
Movie Making Solutions Gantt Chart For Video Production Services Proposal Ideas PDF
Manage your complex projects and organize them simultaneously with this detailed Gantt Chart PowerPoint Template. Track your milestones, tasks, phases, activities, subtasks amongst other constituents that will give you an updated visual of your project. Reflect your planning horizon and capture your release plan in one view with this Gantt Chart PowerPoint presentation template. You can plot various dependencies directly on this Timeline PowerPoint Presentation Layout to see which tasks are still in the pipeline and how the delays in them are impacting the schedules and deadlines of the project. Apart from this, you can also share this updated visual with your team members and stakeholders, thus making it a resourceful tool to be incorporated in your business structure. Not only this but also the editable layout of this slide helps you to add your data and statistics at your convenience.
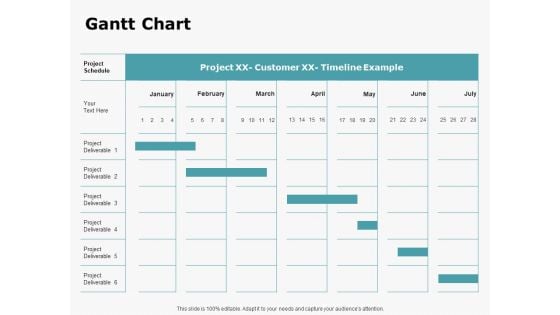
HR Outsourcing Service Proposal Gantt Chart Ppt Infographic Template Visuals PDF
Manage your complex projects and organize them simultaneously with this detailed Gantt Chart PowerPoint Template. Track your milestones, tasks, phases, activities, subtasks amongst other constituents that will give you an updated visual of your project. Reflect your planning horizon and capture your release plan in one view with this Gantt Chart PowerPoint presentation template. You can plot various dependencies directly on this Timeline PowerPoint Presentation Layout to see which tasks are still in the pipeline and how the delays in them are impacting the schedules and deadlines of the project. Apart from this, you can also share this updated visual with your team members and stakeholders, thus making it a resourceful tool to be incorporated in your business structure. Not only this but also the editable layout of this slide helps you to add your data and statistics at your convenience.
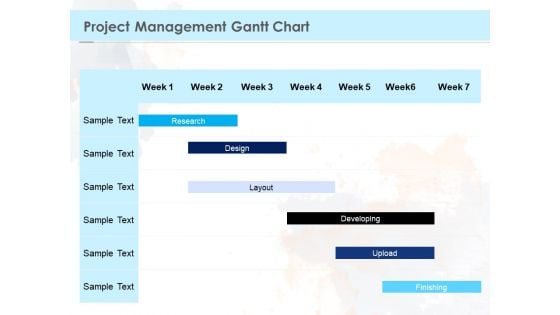
Proposal Template For Concrete Supplier Service Project Management Gantt Chart Rules PDF
Your complex projects can be managed and organized simultaneously using this detailed proposal template for concrete supplier service project management gantt chart rules pdf template. Track the milestones, tasks, phases, activities, and subtasks to get an updated visual of your project. Share your planning horizon and release plan with this well-crafted presentation template. This exemplary template can be used to plot various dependencies to distinguish the tasks in the pipeline and their impact on the schedules and deadlines of the project. Apart from this, you can also share this visual presentation with your team members and stakeholders. It a resourceful tool that can be incorporated into your business structure. Therefore, download and edit it conveniently to add the data and statistics as per your requirement.
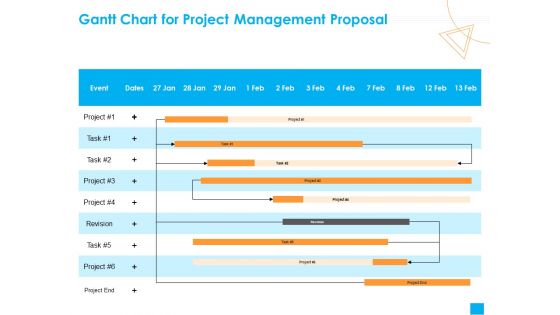
Benefits Realization Management Gantt Chart For Project Management Proposal Brochure PDF
Your complex projects can be managed and organized simultaneously using this detailed benefits realization management gantt chart for project management proposal brochure pdf template. Track the milestones, tasks, phases, activities, and subtasks to get an updated visual of your project. Share your planning horizon and release plan with this well crafted presentation template. This exemplary template can be used to plot various dependencies to distinguish the tasks in the pipeline and their impact on the schedules and deadlines of the project. Apart from this, you can also share this visual presentation with your team members and stakeholders. It a resourceful tool that can be incorporated into your business structure. Therefore, download and edit it conveniently to add the data and statistics as per your requirement.
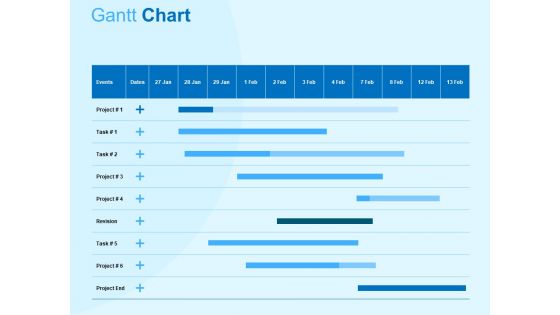
Damage Security Insurance Proposal Gantt Chart Ppt Gallery Graphic Tips PDF
Your complex projects can be managed and organized simultaneously using this detailed damage security insurance proposal gantt chart ppt gallery graphic tips pdf template. Track the milestones, tasks, phases, activities, and subtasks to get an updated visual of your project. Share your planning horizon and release plan with this well crafted presentation template. This exemplary template can be used to plot various dependencies to distinguish the tasks in the pipeline and their impact on the schedules and deadlines of the project. Apart from this, you can also share this visual presentation with your team members and stakeholders. It a resourceful tool that can be incorporated into your business structure. Therefore, download and edit it conveniently to add the data and statistics as per your requirement.
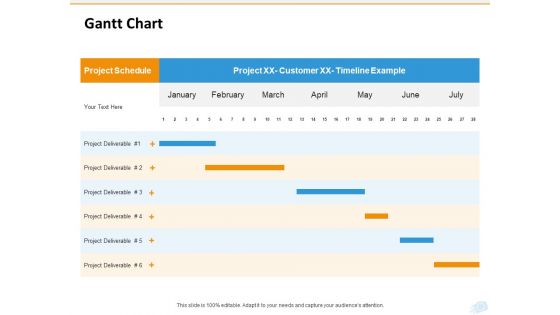
Corporate Occasion Videography Proposal Gantt Chart Ppt Ideas Graphics Design PDF
Your complex projects can be managed and organized simultaneously using this detailed corporate occasion videography proposal gantt chart ppt ideas graphics design pdf template. Track the milestones, tasks, phases, activities, and subtasks to get an updated visual of your project. Share your planning horizon and release plan with this well crafted presentation template. This exemplary template can be used to plot various dependencies to distinguish the tasks in the pipeline and their impact on the schedules and deadlines of the project. Apart from this, you can also share this visual presentation with your team members and stakeholders. It a resourceful tool that can be incorporated into your business structure. Therefore, download and edit it conveniently to add the data and statistics as per your requirement.
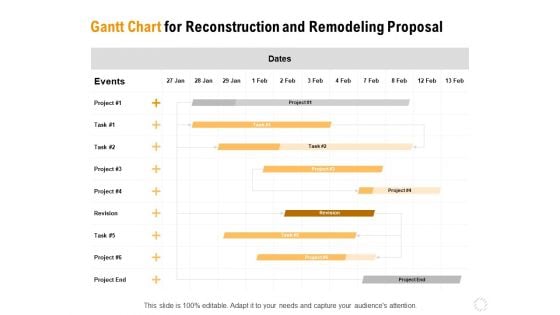
Sustainable Building Renovation Gantt Chart For Reconstruction And Remodeling Proposal Brochure PDF
Your complex projects can be managed and organized simultaneously using this detailed sustainable building renovation gantt chart for reconstruction and remodeling proposal brochure pdf template. Track the milestones, tasks, phases, activities, and subtasks to get an updated visual of your project. Share your planning horizon and release plan with this well crafted presentation template. This exemplary template can be used to plot various dependencies to distinguish the tasks in the pipeline and their impact on the schedules and deadlines of the project. Apart from this, you can also share this visual presentation with your team members and stakeholders. It a resourceful tool that can be incorporated into your business structure. Therefore, download and edit it conveniently to add the data and statistics as per your requirement.
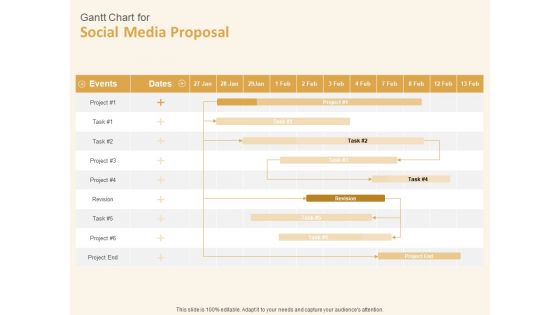
Social Network Gantt Chart For Social Media Proposal Revision Ppt Pictures Ideas PDF
Your complex projects can be managed and organized simultaneously using this detailed social network gantt chart for social media proposal revision ppt pictures ideas pdf template. Track the milestones, tasks, phases, activities, and subtasks to get an updated visual of your project. Share your planning horizon and release plan with this well-crafted presentation template. This exemplary template can be used to plot various dependencies to distinguish the tasks in the pipeline and their impact on the schedules and deadlines of the project. Apart from this, you can also share this visual presentation with your team members and stakeholders. It a resourceful tool that can be incorporated into your business structure. Therefore, download and edit it conveniently to add the data and statistics as per your requirement.
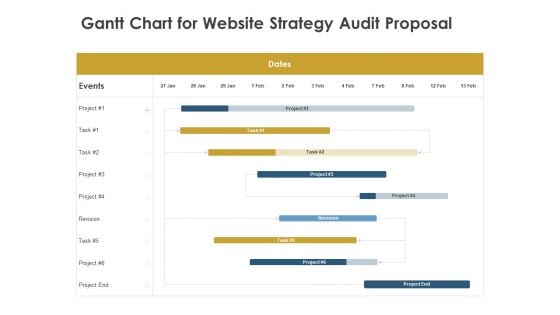
Strategic SEO Audit Gantt Chart For Website Strategy Audit Proposal Sample PDF
Your complex projects can be managed and organized simultaneously using this detailed strategic seo audit gantt chart for website strategy audit proposal sample pdf template. Track the milestones, tasks, phases, activities, and subtasks to get an updated visual of your project. Share your planning horizon and release plan with this well-crafted presentation template. This exemplary template can be used to plot various dependencies to distinguish the tasks in the pipeline and their impact on the schedules and deadlines of the project. Apart from this, you can also share this visual presentation with your team members and stakeholders. It a resourceful tool that can be incorporated into your business structure. Therefore, download and edit it conveniently to add the data and statistics as per your requirement.
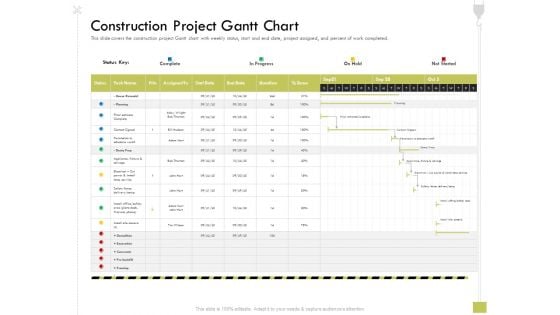
Civil Contractors Construction Project Gantt Chart Ppt Layouts Graphic Images PDF
Your complex projects can be managed and organized simultaneously using this detailed civil contractors construction project gantt chart ppt layouts graphic images pdf template. Track the milestones, tasks, phases, activities, and subtasks to get an updated visual of your project. Share your planning horizon and release plan with this well-crafted presentation template. This exemplary template can be used to plot various dependencies to distinguish the tasks in the pipeline and their impact on the schedules and deadlines of the project. Apart from this, you can also share this visual presentation with your team members and stakeholders. It a resourceful tool that can be incorporated into your business structure. Therefore, download and edit it conveniently to add the data and statistics as per your requirement.
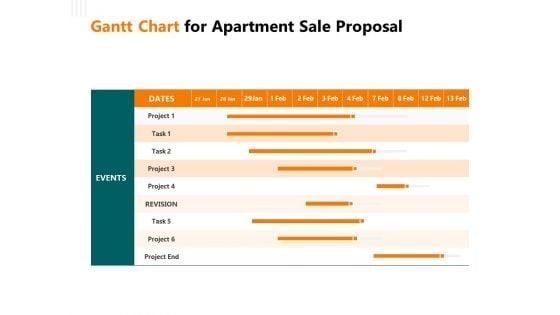
Rent Condominium Gantt Chart For Apartment Sale Proposal Ppt Gallery Visuals PDF
Your complex projects can be managed and organized simultaneously using this detailed rent condominium gantt chart for apartment sale proposal ppt gallery visuals pdf template. Track the milestones, tasks, phases, activities, and subtasks to get an updated visual of your project. Share your planning horizon and release plan with this well-crafted presentation template. This exemplary template can be used to plot various dependencies to distinguish the tasks in the pipeline and their impact on the schedules and deadlines of the project. Apart from this, you can also share this visual presentation with your team members and stakeholders. It a resourceful tool that can be incorporated into your business structure. Therefore, download and edit it conveniently to add the data and statistics as per your requirement.
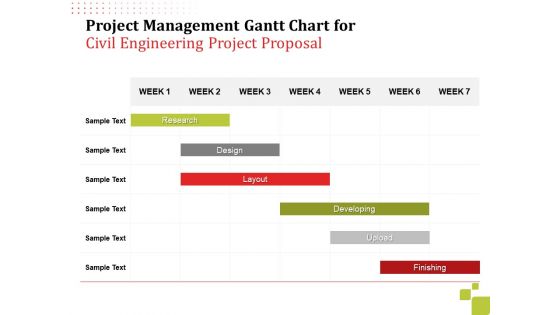
Project Management Gantt Chart For Civil Engineering Project Proposal Ppt Summary Inspiration PDF
Your complex projects can be managed and organized simultaneously using this detailed project management gantt chart for civil engineering project proposal ppt summary inspiration pdf template. Track the milestones, tasks, phases, activities, and subtasks to get an updated visual of your project. Share your planning horizon and release plan with this well crafted presentation template. This exemplary template can be used to plot various dependencies to distinguish the tasks in the pipeline and their impact on the schedules and deadlines of the project. Apart from this, you can also share this visual presentation with your team members and stakeholders. It a resourceful tool that can be incorporated into your business structure. Therefore, download and edit it conveniently to add the data and statistics as per your requirement.
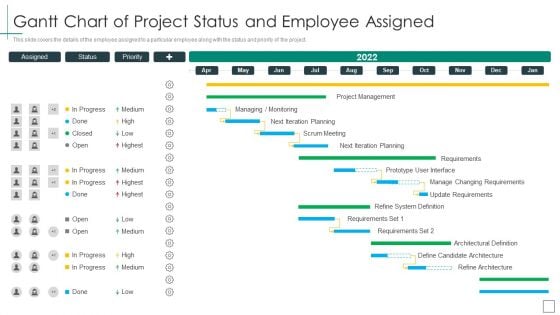
Cross Functional Teams Collaboration Gantt Chart Of Project Status And Employee Formats PDF
Your complex projects can be managed and organized simultaneously using this detailed Cross Functional Teams Collaboration Gantt Chart Of Project Status And Employee Formats PDF template. Track the milestones, tasks, phases, activities, and subtasks to get an updated visual of your project. Share your planning horizon and release plan with this well crafted presentation template. This exemplary template can be used to plot various dependencies to distinguish the tasks in the pipeline and their impact on the schedules and deadlines of the project. Apart from this, you can also share this visual presentation with your team members and stakeholders. It a resourceful tool that can be incorporated into your business structure. Therefore, download and edit it conveniently to add the data and statistics as per your requirement.
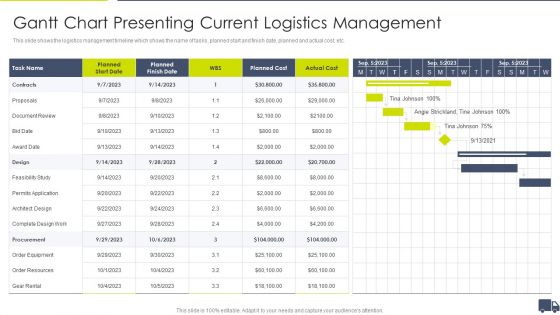
Enhancing Logistics Customer Service Gantt Chart Presenting Current Logistics Management Brochure PDF
This slide shows the logistics management timeline which shows the name of tasks, planned start and finish date, planned and actual cost, etc. Your complex projects can be managed and organized simultaneously using this detailed Enhancing Logistics Customer Service Gantt Chart Presenting Current Logistics Management Brochure PDF template. Track the milestones, tasks, phases, activities, and subtasks to get an updated visual of your project. Share your planning horizon and release plan with this well crafted presentation template. This exemplary template can be used to plot various dependencies to distinguish the tasks in the pipeline and their impact on the schedules and deadlines of the project. Apart from this, you can also share this visual presentation with your team members and stakeholders. It a resourceful tool that can be incorporated into your business structure. Therefore, download and edit it conveniently to add the data and statistics as per your requirement.
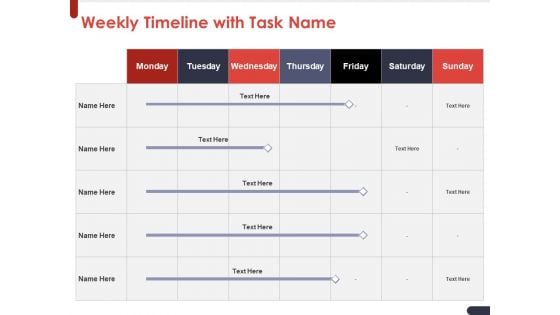
Project Quality Planning And Controlling Weekly Timeline With Task Name Diagrams PDF
Manage your complex projects and organize them simultaneously with this detailed Gantt Chart PowerPoint Template. Track your milestones, tasks, phases, activities, subtasks amongst other constituents that will give you an updated visual of your project. Reflect your planning horizon and capture your release plan in one view with this Gantt Chart PowerPoint presentation template. You can plot various dependencies directly on this Timeline PowerPoint Presentation Layout to see which tasks are still in the pipeline and how the delays in them are impacting the schedules and deadlines of the project. Apart from this, you can also share this updated visual with your team members and stakeholders, thus making it a resourceful tool to be incorporated in your business structure. Not only this but also the editable layout of this slide helps you to add your data and statistics at your convenience.
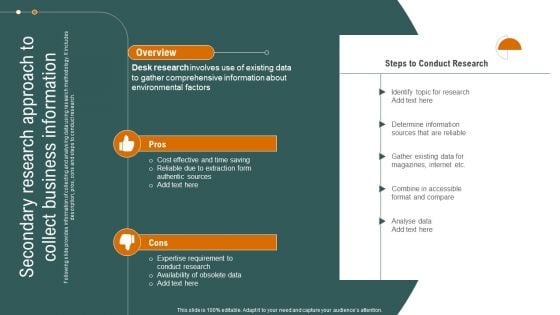
Secondary Research Approach To Collect Business Information Themes PDF
Following slide provides information of collecting and analysing data using research methodology. It includes description, pros, cons and steps to conduct research. If you are looking for a format to display your unique thoughts, then the professionally designed Secondary Research Approach To Collect Business Information Themes PDF is the one for you. You can use it as a Google Slides template or a PowerPoint template. Incorporate impressive visuals, symbols, images, and other charts. Modify or reorganize the text boxes as you desire. Experiment with shade schemes and font pairings. Alter, share or cooperate with other people on your work. Download Secondary Research Approach To Collect Business Information Themes PDF and find out how to give a successful presentation. Present a perfect display to your team and make your presentation unforgettable.
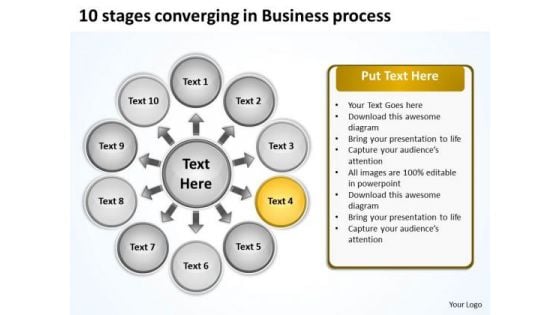
10 Stages Converging Business PowerPoint Theme Process Radial Network Slides
We present our 10 stages converging business powerpoint theme process Radial Network Slides.Use our Arrows PowerPoint Templates because this Diagram emphasizes on any critical or key factors within them. Use our Flow charts PowerPoint Templates because you can Amplify your views, ideas and thoughts from very basic aspects to the highly technical and complicated issus using this template as a tool. Download and present our Business PowerPoint Templates because this is the unerring accuracy in reaching the target. the effortless ability to launch into flight. Use our Process and Flows PowerPoint Templates because your team and you always raise a toast. Download and present our Circle charts PowerPoint Templates because this slide helps you to give your team an overview of your capability and insight into the minute details of the overall picture highlighting the interdependence at every operational level.Use these PowerPoint slides for presentations relating to Business, chart, circle, colors, concept, corporate, cycle, data, design, detail, development, diagram, engineering, graphic, ideas, illustration, image, implement, implementation, life, lifecycle, management, model, objects, organization, plan, process, product, professional, project, quality, schema, shape, stack, stage, steps, strategy, structure, success, symbol. The prominent colors used in the PowerPoint template are Yellow, White, Black. You can be sure our 10 stages converging business powerpoint theme process Radial Network Slides are Swanky. Presenters tell us our colors PowerPoint templates and PPT Slides are specially created by a professional team with vast experience. They diligently strive to come up with the right vehicle for your brilliant Ideas. We assure you our 10 stages converging business powerpoint theme process Radial Network Slides are Nice. Customers tell us our concept PowerPoint templates and PPT Slides are Delightful. Presenters tell us our 10 stages converging business powerpoint theme process Radial Network Slides are Efficacious. You can be sure our data PowerPoint templates and PPT Slides are Elevated. Attract attention with our 10 Stages Converging Business PowerPoint Theme Process Radial Network Slides. You will come out on top.
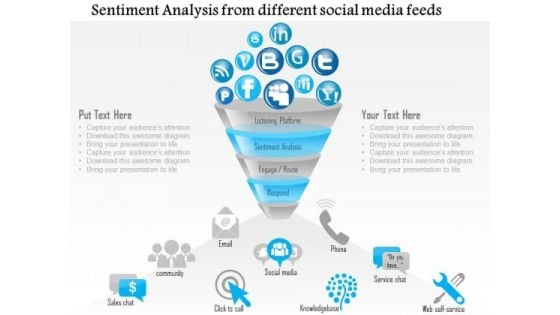
Business Diagram Sentiment Analysis From Different Social Media Feeds Ppt Slide
This diagram has been designed with graphic of funnel diagram displaying multiple icons of social media. These icons may be used to display social media sentiment analysis. Use this diagram slide for social media related presentations.
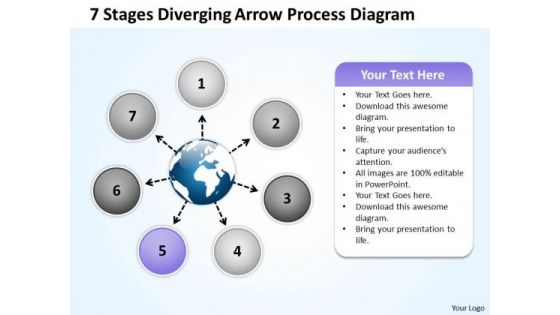
Diverging Arrow Process Diagram Ppt Relative Circular Flow PowerPoint Template
We present our diverging arrow process diagram ppt Relative Circular Flow PowerPoint template.Download and present our Circle Charts PowerPoint Templates because business ethics is an essential element in your growth. Download and present our Flow Charts PowerPoint Templates because this diagram helps you to show goal also clearly etched in your mind. Download and present our Process and Flows PowerPoint Templates because you can enlighten your skills with the help of our topical templates. Present our Globe PowerPoint Templates because they will Amplify your thoughts via our appropriate templates. Download our Ring Charts PowerPoint Templates because it helps you to get your team in the desired sequence into the bracket.Use these PowerPoint slides for presentations relating to Business,chart, circle, colors, concept,contemporary, corporate, cycle, data,design, detail, development, diagram, engineering, graphic, ideas,illustration, implement, implementation,management, model, modern,organization, phase, plan, process,product, professional, project, quality,schema, set, software, stack, stage, steps, strategy, success, system, tag, team. The prominent colors used in the PowerPoint template are Blue, Gray, White. Professionals tell us our diverging arrow process diagram ppt Relative Circular Flow PowerPoint template are Radiant. People tell us our concept PowerPoint templates and PPT Slides will impress their bosses and teams. The feedback we get is that our diverging arrow process diagram ppt Relative Circular Flow PowerPoint template are Luxurious. Presenters tell us our cycle PowerPoint templates and PPT Slides are No-nonsense. You can be sure our diverging arrow process diagram ppt Relative Circular Flow PowerPoint template are Perfect. PowerPoint presentation experts tell us our data PowerPoint templates and PPT Slides are Lush. Our Diverging Arrow Process Diagram Ppt Relative Circular Flow PowerPoint Template will entice the audience. They will make a beeline for you.
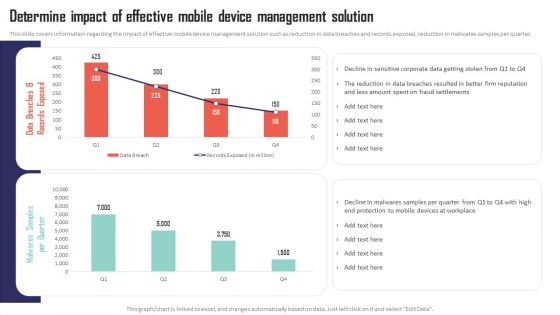
Mobile Device Management Determine Impact Of Effective Mobile Device Management Diagrams PDF
This slide covers information regarding the impact of effective mobile device management solution such as reduction in data breaches and records exposed, reduction in malwares samples per quarter. If you are looking for a format to display your unique thoughts, then the professionally designed Mobile Device Management Determine Impact Of Effective Mobile Device Management Diagrams PDF is the one for you. You can use it as a Google Slides template or a PowerPoint template. Incorporate impressive visuals, symbols, images, and other charts. Modify or reorganize the text boxes as you desire. Experiment with shade schemes and font pairings. Alter, share or cooperate with other people on your work. Download Mobile Device Management Determine Impact Of Effective Mobile Device Management Diagrams PDF and find out how to give a successful presentation. Present a perfect display to your team and make your presentation unforgettable.
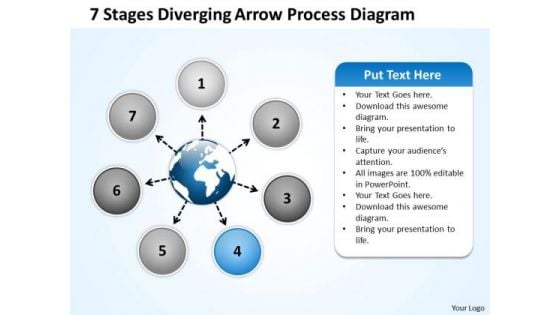
Diverging Arrow Process Diagram Ppt Relative Circular Flow PowerPoint Templates
We present our diverging arrow process diagram ppt Relative Circular Flow PowerPoint templates.Download our Process and Flows PowerPoint Templates because this diagram put it all together to form the complete picture and reach the goal. Download our Flow Charts PowerPoint Templates because displaying your ideas and highlighting your ability will accelerate the growth of your company and yours. Download and present our Circle Charts PowerPoint Templates because you have churned your mind and come up with effective ways and means to further refine it. Present our Ring Charts PowerPoint Templates because there are a bucketful of brilliant ideas swirling around within your group. Present our Globe PowerPoint Templates because all elements of the venture are equally critical.Use these PowerPoint slides for presentations relating to Circle, colors, concept,contemporary, corporate, cycle, data,design, detail, development, diagram, engineering, graphic, ideas,illustration, implement, implementation,management, model, modern,organization, phase, plan, process,product, professional, project, quality,schema, set, software, stack, stage, steps, strategy, success, system, tag, team. The prominent colors used in the PowerPoint template are Blue, White , Black. Professionals tell us our diverging arrow process diagram ppt Relative Circular Flow PowerPoint templates are Breathtaking. People tell us our concept PowerPoint templates and PPT Slides are Dynamic. The feedback we get is that our diverging arrow process diagram ppt Relative Circular Flow PowerPoint templates are Magical. Presenters tell us our cycle PowerPoint templates and PPT Slides are Precious. You can be sure our diverging arrow process diagram ppt Relative Circular Flow PowerPoint templates are Colorful. PowerPoint presentation experts tell us our data PowerPoint templates and PPT Slides are Efficacious. Our Diverging Arrow Process Diagram Ppt Relative Circular Flow PowerPoint Templates empower educators. Conveying concepts and ideas becomes easier.
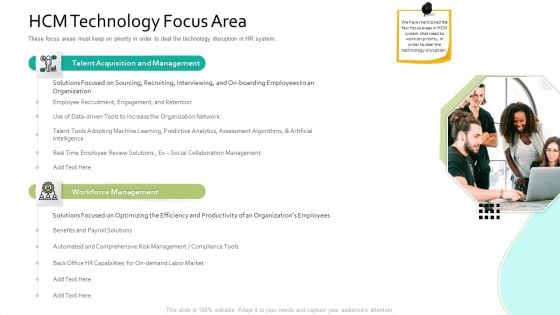
HCM Technology Focus Area Human Resource Information System For Organizational Effectiveness Sample PDF
Your complex projects can be managed and organized simultaneously using this detailed Hcm Technology Focus Area Human Resource Information System For Organizational Effectiveness Sample Pdf template. Track the milestones, tasks, phases, activities, and subtasks to get an updated visual of your project. Share your planning horizon and release plan with this well crafted presentation template. This exemplary template can be used to plot various dependencies to distinguish the tasks in the pipeline and their impact on the schedules and deadlines of the project. Apart from this, you can also share this visual presentation with your team members and stakeholders. It a resourceful tool that can be incorporated into your business structure. Therefore, download and edit it conveniently to add the data and statistics as per your requirement.

Information Security Adhere To Strict Compliance Requirements Diagrams PDF
This slide shows that you can use a data classification engine to locate and categorize regulated and sensitive material also, compliance standards serve as a foundation. If you are looking for a format to display your unique thoughts, then the professionally designed Information Security Adhere To Strict Compliance Requirements Diagrams PDF is the one for you. You can use it as a Google Slides template or a PowerPoint template. Incorporate impressive visuals, symbols, images, and other charts. Modify or reorganize the text boxes as you desire. Experiment with shade schemes and font pairings. Alter, share or cooperate with other people on your work. Download Information Security Adhere To Strict Compliance Requirements Diagrams PDF and find out how to give a successful presentation. Present a perfect display to your team and make your presentation unforgettable.

Nielsen Business Profile Revenue And Operating Income Ppt PowerPoint Presentation Diagram PDF
This slide highlights the Nielsen company revenue and operating income for the last 3 years. It includes the data in million of US dollars with a key takeaways section. This Nielsen Business Profile Revenue And Operating Income Ppt PowerPoint Presentation Diagram PDF from Slidegeeks makes it easy to present information on your topic with precision. It provides customization options, so you can make changes to the colors, design, graphics, or any other component to create a unique layout. It is also available for immediate download, so you can begin using it right away. Slidegeeks has done good research to ensure that you have everything you need to make your presentation stand out. Make a name out there for a brilliant performance.
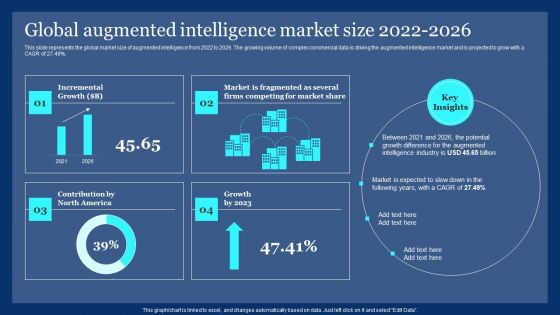
Global Augmented Intelligence Market Size 2022 2026 Ppt PowerPoint Presentation Diagram PDF
This slide represents the global market size of augmented intelligence from 2022 to 2026. The growing volume of complex commercial data is driving the augmented intelligence market and is projected to grow with a CAGR of 27.49 percent. This Global Augmented Intelligence Market Size 2022 2026 Ppt PowerPoint Presentation Diagram PDF from Slidegeeks makes it easy to present information on your topic with precision. It provides customization options, so you can make changes to the colors, design, graphics, or any other component to create a unique layout. It is also available for immediate download, so you can begin using it right away. Slidegeeks has done good research to ensure that you have everything you need to make your presentation stand out. Make a name out there for a brilliant performance.
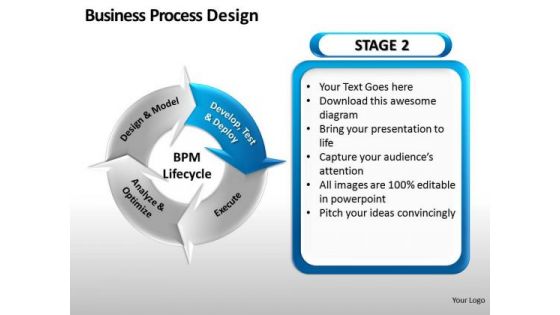
4 Stage Business Process Design PowerPoint Slides And Ppt Diagram Templates
4 Stage Business Process Design PowerPoint Slides And PPT Diagram Templates-These high quality, editable pre-designed powerpoint slides have been carefully created by our professional team to help you impress your audience. Each graphic in every slide is vector based and is 100% editable in powerpoint. Each and every property of any slide - color, size, shading etc can be modified to build an effective powerpoint presentation. Use these slides to convey complex business concepts in a simplified manner. Any text can be entered at any point in the powerpoint slide. Simply DOWNLOAD, TYPE and PRESENT! Examine data with our 4 Stage Business Process Design PowerPoint Slides And Ppt Diagram Templates. You will come out on top.
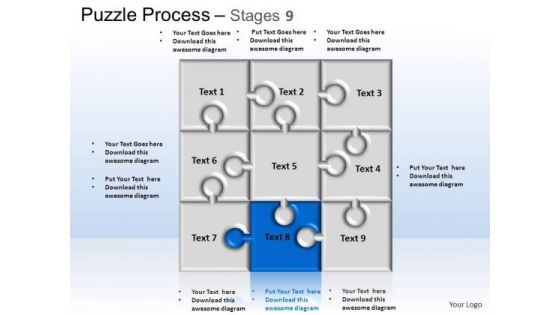
PowerPoint Themes Business Puzzle Process Ppt Layouts
PowerPoint Themes Business Puzzle Process PPT Layouts-Puzzles PowerPoint templates being the perennial educational tool. Emphasize the process of your business/corporate growth. Highlight your ideas broad- based on strong fundamentals and illustrate how they step by step achieve the set growth factor.-These amazing PowerPoint pre-designed slides and PowerPoint templates have been carefully created by our team of experts to help you impress your audience. Our stunning collection of Powerpoint slides are 100% editable and can easily fit in any PowerPoint presentations. By using these animations and graphics in PowerPoint and you can easily make professional presentations. Any text can be entered at any point in the PowerPoint template or slide. Just DOWNLOAD our awesome PowerPoint templates and you are ready to go. Figure out the market with our PowerPoint Themes Business Puzzle Process Ppt Layouts. Analyse the data accurately for the audience.
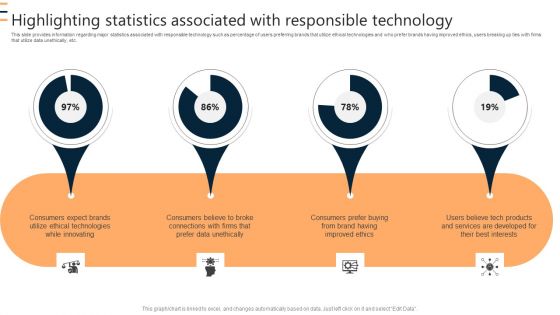
Highlighting Statistics Associated With Responsible Technology Ppt Inspiration Visuals PDF
This slide provides information regarding major statistics associated with responsible technology such as percentage of users preferring brands that utilize ethical technologies and who prefer brands having improved ethics, users breaking up ties with firms that utilize data unethically, etc. Formulating a presentation can take up a lot of effort and time, so the content and message should always be the primary focus. The visuals of the PowerPoint can enhance the presenters message, so our Highlighting Statistics Associated With Responsible Technology Ppt Inspiration Visuals PDF was created to help save time. Instead of worrying about the design, the presenter can concentrate on the message while our designers work on creating the ideal templates for whatever situation is needed. Slidegeeks has experts for everything from amazing designs to valuable content, we have put everything into Highlighting Statistics Associated With Responsible Technology Ppt Inspiration Visuals PDF.
Leadership Team Management Analysis Ppt Slides Graphics
Concept of leadership and team management can be well explained with these icons. This template contains the professional designed icons for time management, leadership and analysis. Amplify your thoughts via our appropriate template.
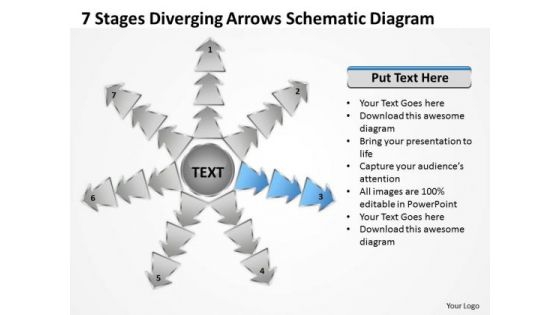
7 Stages Diverging Arrows Schematic Diagram Ppt Charts And Networks PowerPoint Slide
We present our 7 stages diverging arrows schematic diagram ppt Charts and Networks PowerPoint Slide.Use our Marketing PowerPoint Templates because you can Break it all down to Key Result Areas. Use our Shapes PowerPoint Templates because this diagram is designed to help your audience to develop their thoughts along the way. Use our Arrows PowerPoint Templates because this slide illuminates the spiritual brilliance of Jesus and showers the love for mankind he showed even while being crucified. Use our Business PowerPoint Templates because you can Lead your flock steadily to greater heights. Look around at the vast potential of achievement around you. Use our Process and Flows PowerPoint Templates because you can Highlight the key components of your entire manufacturing/ business process.Use these PowerPoint slides for presentations relating to Arrows, Business, Chart, Cyclic, Data, Diagram, Financial, Goal, Graph, Illustration, Info, Information, Marketing, Model, Option, Part, Pie, Presentation, Process, Result, Sphere, Statistics. The prominent colors used in the PowerPoint template are Blue, Gray, Black. The feedback we get is that our 7 stages diverging arrows schematic diagram ppt Charts and Networks PowerPoint Slide are Fashionable. People tell us our Data PowerPoint templates and PPT Slides are Perfect. Presenters tell us our 7 stages diverging arrows schematic diagram ppt Charts and Networks PowerPoint Slide will make the presenter successul in his career/life. Use our Goal PowerPoint templates and PPT Slides are Bold. Use our 7 stages diverging arrows schematic diagram ppt Charts and Networks PowerPoint Slide are Spiffy. Use our Financial PowerPoint templates and PPT Slides are Functional. Feather your nest with our 7 Stages Diverging Arrows Schematic Diagram Ppt Charts And Networks PowerPoint Slide. Your thoughts will evolve in a comfortable climate.
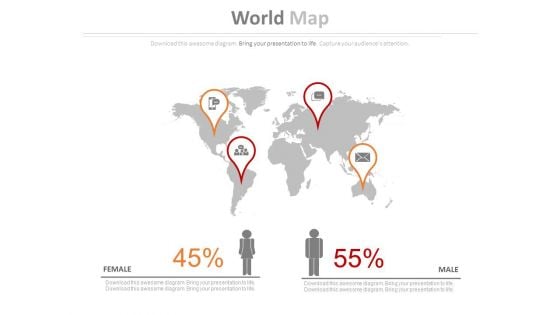
World Map With Gender Ratio Analysis PowerPoint Slides
This slide can be the perfect slide to demonstrate the comparison or changes between the different genders. This PowerPoint slide will be useful to show the ratio of males and females in different parts of the world. Have business abroad? Let your clients and investors know that visually. Above is the PowerPoint slide which can help you explain where all you have your empire. Now isn?t this great. Well yes. You can also use the above template to tell your colleagues or teammates about the places or countries where you plan to further expand your business or open a franchise. This would be an apt background template if you have tourism business. This PPT template is completely customizable. You can adjust the icons present in the slide. Color, icon and text can be modified the way you want. Download this and include it in your presentation to make it more impactful than before.
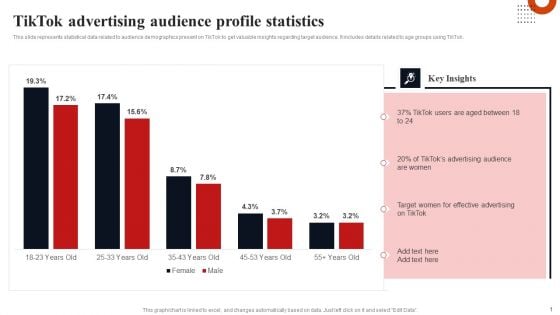
Tiktok Advertising Audience Profile Statistics Inspiration PDF
This slide represents statistical data related to audience demographics present on TikTok to get valuable insights regarding target audience. It includes details related to age groups using TikTok. Are you in need of a template that can accommodate all of your creative concepts This one is crafted professionally and can be altered to fit any style. Use it with Google Slides or PowerPoint. Include striking photographs, symbols, depictions, and other visuals. Fill, move around, or remove text boxes as desired. Test out color palettes and font mixtures. Edit and save your work, or work with colleagues. Download Tiktok Advertising Audience Profile Statistics Inspiration PDF and observe how to make your presentation outstanding. Give an impeccable presentation to your group and make your presentation unforgettable.

Arrow Diagram Shows Required Order Of Tasks Ppt 4 Arrows Process Software PowerPoint Templates
We present our arrow diagram shows required order of tasks ppt 4 Arrows Process Software PowerPoint templates.Use our Business PowerPoint Templates because it helps you to project your enthusiasm and single mindedness to your colleagues. Download and present our Marketing PowerPoint Templates because this template with an image of helps you chart the course of your presentation. Download our Arrows PowerPoint Templates because you can Explain the contribution of each of the elements and how they provide impetus to the next phase. Download our Circle Charts PowerPoint Templates because if making a mark is your obsession, then let others get Obsessed with you. Use our Flow Charts PowerPoint Templates because the graphic is a symbol of growth and success.Use these PowerPoint slides for presentations relating to Arrow, Blue, Business, Button, Chart, Circle, Company, Cross, Data, Design, Diagram, Direction, Document, Five, Function, Market, Marketing, Model, Multicolored, Multiple, Navigation, Network, Options, Presentation, Process, Results, Shiny, Sphere, Structure, Template, Three, Vector, Website, Wheel. The prominent colors used in the PowerPoint template are Blue light, Gray, White. Presenters tell us our arrow diagram shows required order of tasks ppt 4 Arrows Process Software PowerPoint templates are Quaint. We assure you our Circle PowerPoint templates and PPT Slides are Fashionable. Presenters tell us our arrow diagram shows required order of tasks ppt 4 Arrows Process Software PowerPoint templates are Perfect. Use our Data PowerPoint templates and PPT Slides are Wonderful. We assure you our arrow diagram shows required order of tasks ppt 4 Arrows Process Software PowerPoint templates are Stylish. You can be sure our Cross PowerPoint templates and PPT Slides are Efficacious. Deliver your ideas decisively with our Arrow Diagram Shows Required Order Of Tasks Ppt 4 Arrows Process Software PowerPoint Templates. They help you look the audience in the eye.
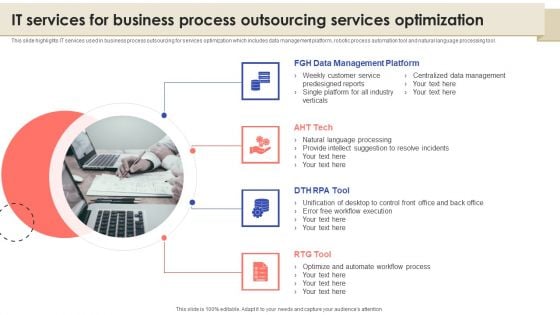
IT Services For Business Process Outsourcing Services Optimization Themes PDF
This slide highlights IT services used in business process outsourcing for services optimization which includes data management platform, robotic process automation tool and natural language processing tool. Find highly impressive IT Services For Business Process Outsourcing Services Optimization Themes PDF on Slidegeeks to deliver a meaningful presentation. You can save an ample amount of time using these presentation templates. No need to worry to prepare everything from scratch because Slidegeeks experts have already done a huge research and work for you. You need to download IT Services For Business Process Outsourcing Services Optimization Themes PDF for your upcoming presentation. All the presentation templates are 100 percent editable and you can change the color and personalize the content accordingly. Download now.
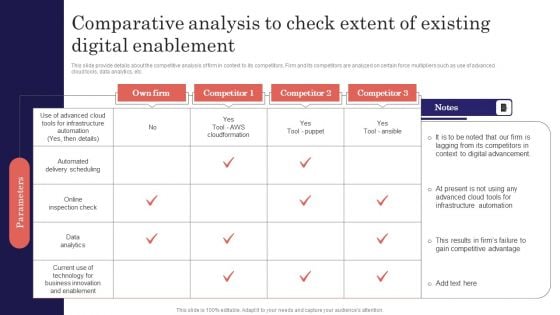
Comparative Analysis To Check Extent Of Existing Digital Enablement Themes PDF
This slide provide details about the competitive analysis of firm in context to its competitors. Firm and its competitors are analyzed on certain force multipliers such as use of advanced cloud tools, data analytics, etc. If you are looking for a format to display your unique thoughts, then the professionally designed Comparative Analysis To Check Extent Of Existing Digital Enablement Themes PDF is the one for you. You can use it as a Google Slides template or a PowerPoint template. Incorporate impressive visuals, symbols, images, and other charts. Modify or reorganize the text boxes as you desire. Experiment with shade schemes and font pairings. Alter, share or cooperate with other people on your work. Download Comparative Analysis To Check Extent Of Existing Digital Enablement Themes PDF and find out how to give a successful presentation. Present a perfect display to your team and make your presentation unforgettable.
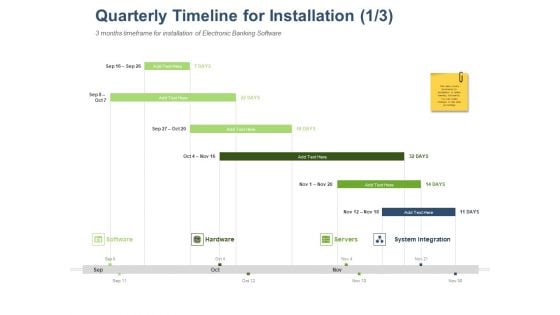
Online Banking Administration Procedure Quarterly Timeline For Installation Ppt Infographic Template Deck PDF
Manage your complex projects and organize them simultaneously with this detailed Gantt Chart PowerPoint Template. Track your milestones, tasks, phases, activities, subtasks amongst other constituents that will give you an updated visual of your project. Reflect your planning horizon and capture your release plan in one view with this Gantt Chart PowerPoint presentation template. You can plot various dependencies directly on this Timeline PowerPoint Presentation Layout to see which tasks are still in the pipeline and how the delays in them are impacting the schedules and deadlines of the project. Apart from this, you can also share this updated visual with your team members and stakeholders, thus making it a resourceful tool to be incorporated in your business structure. Not only this but also the editable layout of this slide helps you to add your data and statistics at your convenience.
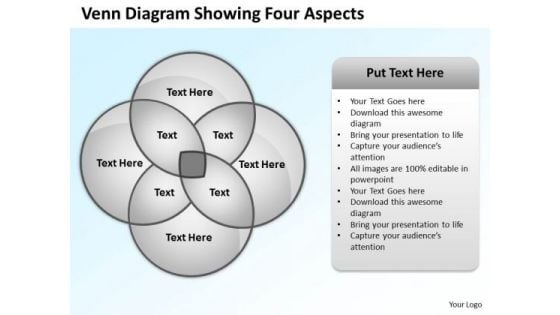
Business Intelligence Architecture Diagram Showing Four Aspects Ppt PowerPoint Slides
We present our business intelligence architecture diagram showing four aspects ppt PowerPoint Slides.Present our Process and Flows PowerPoint Templates because It will Raise the bar of your Thoughts. They are programmed to take you to the next level. Use our Flow Charts PowerPoint Templates because Your audience will believe you are the cats whiskers. Download our Future PowerPoint Templates because Our PowerPoint Templates and Slides will help you be quick off the draw. Just enter your specific text and see your points hit home. Download and present our Business PowerPoint Templates because It will get your audience in sync. Download our Circle Charts PowerPoint Templates because You can Create a matrix with our PowerPoint Templates and Slides. Feel the strength of your ideas click into place.Use these PowerPoint slides for presentations relating to Algorithm, architecture, black, blue, business, chart, computer, cylinder, dark, data, data warehouse, database, design, development, diagram, dimensional, engineering, flowchart, glow, glowing, graphic, information, intelligence, logic, model, plan, relation, render, server, software, structure, table, technology. The prominent colors used in the PowerPoint template are Gray, Black, White. People tell us our business intelligence architecture diagram showing four aspects ppt PowerPoint Slides will impress their bosses and teams. PowerPoint presentation experts tell us our black PowerPoint templates and PPT Slides are designed to make your presentations professional. Presenters tell us our business intelligence architecture diagram showing four aspects ppt PowerPoint Slides are designed to make your presentations professional. Use our black PowerPoint templates and PPT Slides have awesome images to get your point across. Customers tell us our business intelligence architecture diagram showing four aspects ppt PowerPoint Slides are designed to make your presentations professional. People tell us our chart PowerPoint templates and PPT Slides will impress their bosses and teams. Our Business Intelligence Architecture Diagram Showing Four Aspects Ppt PowerPoint Slides are truly fair minded. They take all arguments into account.
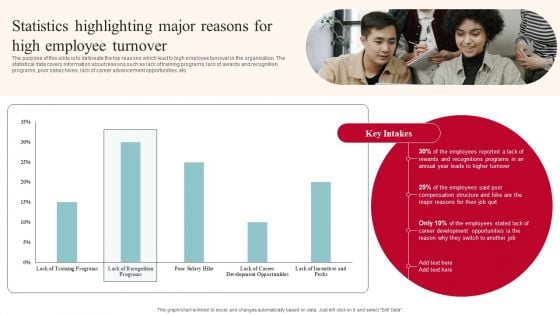
Statistics Highlighting Major Reasons For High Employee Turnover Sample PDF
The purpose of this slide is to delineate the top reasons which lead to high employee turnover in the organization. The statistical data covers information about reasons such as lack of training programs, lack of awards and recognition programs, poor salary hikes, lack of career advancement opportunities, etc. Present like a pro with Statistics Highlighting Major Reasons For High Employee Turnover Sample PDF Create beautiful presentations together with your team, using our easy to use presentation slides. Share your ideas in real time and make changes on the fly by downloading our templates. So whether you are in the office, on the go, or in a remote location, you can stay in sync with your team and present your ideas with confidence. With Slidegeeks presentation got a whole lot easier. Grab these presentations today.
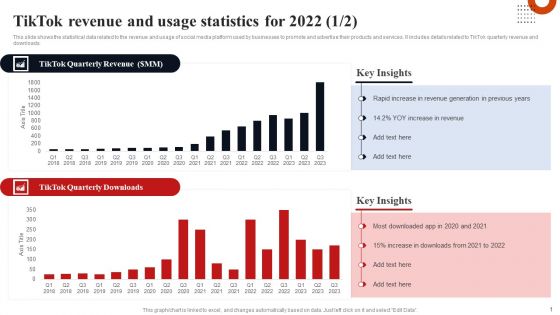
Tiktok Revenue And Usage Statistics For 2022 Introduction PDF
This slide shows the statistical data related to the revenue and usage of social media platform used by businesses to promote and advertise their products and services. It includes details related to TikTok quarterly revenue and downloads. This Tiktok Revenue And Usage Statistics For 2022 Introduction PDF is perfect for any presentation, be it in front of clients or colleagues. It is a versatile and stylish solution for organizing your meetings. The product features a modern design for your presentation meetings. The adjustable and customizable slides provide unlimited possibilities for acing up your presentation. Slidegeeks has done all the homework before launching the product for you. So, do not wait, grab the presentation templates today
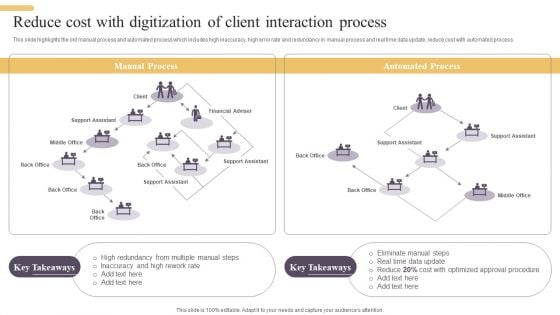
Reduce Cost With Digitization Of Client Interaction Process Themes PDF
This slide highlights the old manual process and automated process which includes high inaccuracy, high error rate and redundancy in manual process and real time data update, reduce cost with automated process. Explore a selection of the finest Reduce Cost With Digitization Of Client Interaction Process Themes PDF here. With a plethora of professionally designed and pre made slide templates, you can quickly and easily find the right one for your upcoming presentation. You can use our Reduce Cost With Digitization Of Client Interaction Process Themes PDF to effectively convey your message to a wider audience. Slidegeeks has done a lot of research before preparing these presentation templates. The content can be personalized and the slides are highly editable. Grab templates today from Slidegeeks.
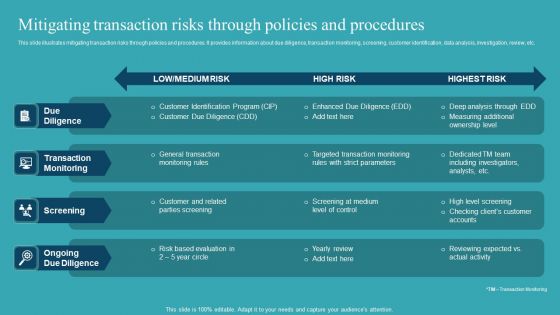
Integrating AML And Transaction Mitigating Transaction Risks Through Policies Themes PDF
This slide illustrates mitigating transaction risks through policies and procedures. It provides information about due diligence, transaction monitoring, screening, customer identification, data analysis, investigation, review, etc. Are you searching for a Integrating AML And Transaction Mitigating Transaction Risks Through Policies Themes PDF that is uncluttered, straightforward, and original Its easy to edit, and you can change the colors to suit your personal or business branding. For a presentation that expresses how much effort youve put in, this template is ideal With all of its features, including tables, diagrams, statistics, and lists, its perfect for a business plan presentation. Make your ideas more appealing with these professional slides. Download Integrating AML And Transaction Mitigating Transaction Risks Through Policies Themes PDF from Slidegeeks today.
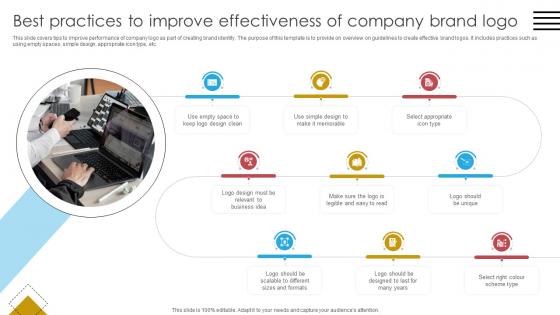
A69 Blueprint For Effective Best Practices To Improve Effectiveness Of Company Brand Strategy SS V
This slide covers tips to improve performance of company logo as part of creating brand identity. The purpose of this template is to provide on overview on guidelines to create effective brand logos. It includes practices such as using empty spaces, simple design, appropriate icon type, etc. Find a pre-designed and impeccable A69 Blueprint For Effective Best Practices To Improve Effectiveness Of Company Brand Strategy SS V. The templates can ace your presentation without additional effort. You can download these easy-to-edit presentation templates to make your presentation stand out from others. So, what are you waiting for Download the template from Slidegeeks today and give a unique touch to your presentation. This slide covers tips to improve performance of company logo as part of creating brand identity. The purpose of this template is to provide on overview on guidelines to create effective brand logos. It includes practices such as using empty spaces, simple design, appropriate icon type, etc.
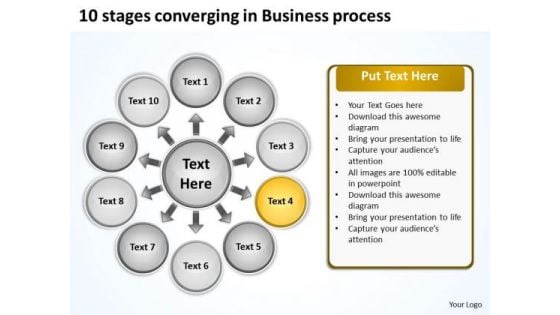
10 Stages Converging Business Process Circular Flow Diagram PowerPoint Slides
We present our 10 stages converging business process Circular Flow Diagram PowerPoint Slides.Download and present our Arrows PowerPoint Templates because they enhance the essence of your viable ideas. Download and present our Flow charts PowerPoint Templates because this slide can help to bullet point your views. Download our Business PowerPoint Templates because it will demonstrate the strength of character under severe stress. Shine the torch ahead and bring the light to shine on all. Present our Process and Flows PowerPoint Templates because you are aware of some pitfalls ahead where you need to be cautious not to overrun and avoid a stall. Download and present our Circle charts PowerPoint Templates because you have what it takes to grow.Use these PowerPoint slides for presentations relating to Business, chart, circle, colors, concept, corporate, cycle, data, design, detail, development, diagram, engineering, graphic, ideas, illustration, image, implement, implementation, life, lifecycle, management, model, objects, organization, plan, process, product, professional, project, quality, schema, shape, stack, stage, steps, strategy, structure, success, symbol. The prominent colors used in the PowerPoint template are Yellow, Black, White. You can be sure our 10 stages converging business process Circular Flow Diagram PowerPoint Slides have awesome images to get your point across. Presenters tell us our data PowerPoint templates and PPT Slides are Beautiful. We assure you our 10 stages converging business process Circular Flow Diagram PowerPoint Slides are Delightful. Customers tell us our corporate PowerPoint templates and PPT Slides will impress their bosses and teams. Presenters tell us our 10 stages converging business process Circular Flow Diagram PowerPoint Slides are Perfect. You can be sure our corporate PowerPoint templates and PPT Slides will impress their bosses and teams. Exhibit your plan with our 10 Stages Converging Business Process Circular Flow Diagram PowerPoint Slides. Display the clarity of your ideas.
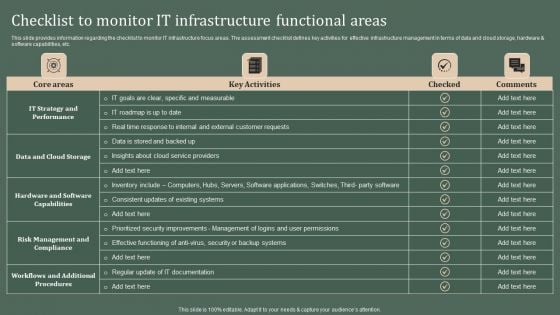
Deploying Corporate Aligned IT Strategy Checklist To Monitor IT Infrastructure Functional Areas Themes PDF
This slide provides information regarding the checklist to monitor IT infrastructure focus areas. The assessment checklist defines key activities for effective infrastructure management in terms of data and cloud storage, hardware and software capabilities, etc. If you are looking for a format to display your unique thoughts, then the professionally designed Deploying Corporate Aligned IT Strategy Checklist To Monitor IT Infrastructure Functional Areas Themes PDF is the one for you. You can use it as a Google Slides template or a PowerPoint template. Incorporate impressive visuals, symbols, images, and other charts. Modify or reorganize the text boxes as you desire. Experiment with shade schemes and font pairings. Alter, share or cooperate with other people on your work. Download Deploying Corporate Aligned IT Strategy Checklist To Monitor IT Infrastructure Functional Areas Themes PDF and find out how to give a successful presentation. Present a perfect display to your team and make your presentation unforgettable.
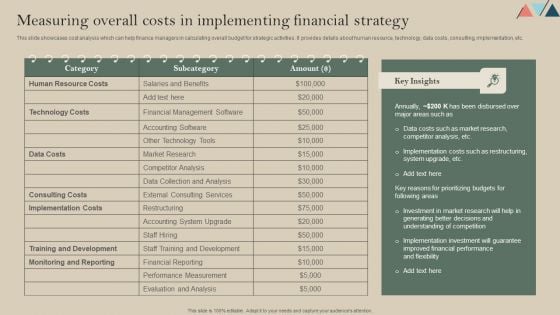
Measuring Overall Costs In Implementing Financial Strategy Themes PDF
This slide showcases cost analysis which can help finance managers in calculating overall budget for strategic activities. It provides details about human resource, technology, data costs, consulting, implementation, etc. Retrieve professionally designed Measuring Overall Costs In Implementing Financial Strategy Themes PDF to effectively convey your message and captivate your listeners. Save time by selecting pre-made slideshows that are appropriate for various topics, from business to educational purposes. These themes come in many different styles, from creative to corporate, and all of them are easily adjustable and can be edited quickly. Access them as PowerPoint templates or as Google Slides themes. You do not have to go on a hunt for the perfect presentation because Slidegeeks got you covered from everywhere.

Concept Of Locked Money Finance PowerPoint Templates And PowerPoint Themes 1012
Concept Of Locked Money Finance PowerPoint Templates And PowerPoint Themes 1012-Develop competitive advantage with our above template which contains a diagram of 3d money and lock. This image signifies the concept of data security. This image has been conceived to enable you to emphatically communicate your ideas in your Business and Financial PPT presentations on finance, protection and banking. Our PPT images are so perfectly designed that it reveals the very basis of our PPT template to make your clients understand.-Concept Of Locked Money Finance PowerPoint Templates And PowerPoint Themes 1012-This PowerPoint template can be used for presentations relating to-Money and lock, security, success, money, finance, business Describe your path to success with our Concept Of Locked Money Finance PowerPoint Templates And PowerPoint Themes 1012. You will come out on top.
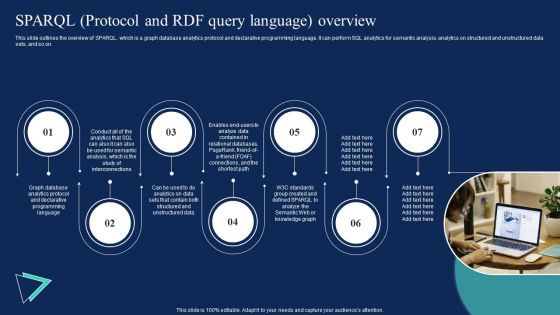
Enterprise Information Web Standards Sparql Protocol And RDF Query Language Overview Themes PDF
This slide outlines the overview of SPARQL, which is a graph database analytics protocol and declarative programming language. It can perform SQL analytics for semantic analysis, analytics on structured and unstructured data sets, and so on. Do you have an important presentation coming up Are you looking for something that will make your presentation stand out from the rest Look no further than Enterprise Information Web Standards Sparql Protocol And RDF Query Language Overview Themes PDF. With our professional designs, you can trust that your presentation will pop and make delivering it a smooth process. And with Slidegeeks, you can trust that your presentation will be unique and memorable. So why wait Grab Enterprise Information Web Standards Sparql Protocol And RDF Query Language Overview Themes PDF today and make your presentation stand out from the rest.
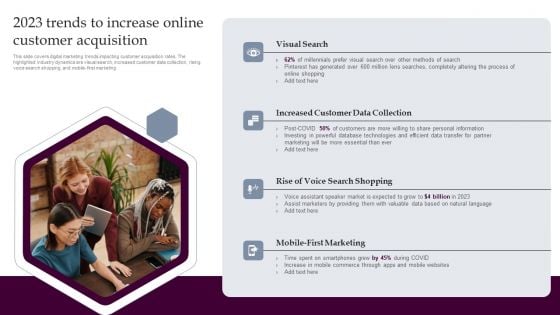
2023 Trends To Increase Online Customer Acquisition Strategies For Acquiring Consumers Themes PDF
This slide covers digital marketing trends impacting customer acquisition rates. The highlighted industry dynamics are visual search, increased customer data collection, rising voice search shopping, and mobile-first marketing. If you are looking for a format to display your unique thoughts, then the professionally designed 30 60 90 Days Plan Strategies For Acquiring Consumers With Customer Acquisition Budget Mockup PDF is the one for you. You can use it as a Google Slides template or a PowerPoint template. Incorporate impressive visuals, symbols, images, and other charts. Modify or reorganize the text boxes as you desire. Experiment with shade schemes and font pairings. Alter, share or cooperate with other people on your work. Download 30 60 90 Days Plan Strategies For Acquiring Consumers With Customer Acquisition Budget Mockup PDF and find out how to give a successful presentation. Present a perfect display to your team and make your presentation unforgettable.
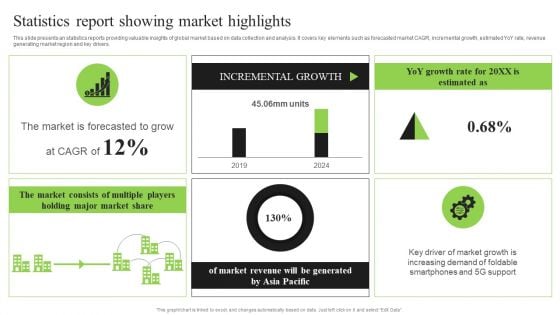
Guidebook For Executing Business Market Intelligence Statistics Report Showing Market Graphics PDF
This slide presents an statistics reports providing valuable insights of global market based on data collection and analysis. It covers key elements such as forecasted market CAGR, incremental growth, estimated YoY rate, revenue generating market region and key drivers. Do you have to make sure that everyone on your team knows about any specific topic I yes, then you should give Guidebook For Executing Business Market Intelligence Statistics Report Showing Market Graphics PDF a try. Our experts have put a lot of knowledge and effort into creating this impeccable Guidebook For Executing Business Market Intelligence Statistics Report Showing Market Graphics PDF. You can use this template for your upcoming presentations, as the slides are perfect to represent even the tiniest detail. You can download these templates from the Slidegeeks website and these are easy to edit. So grab these today.
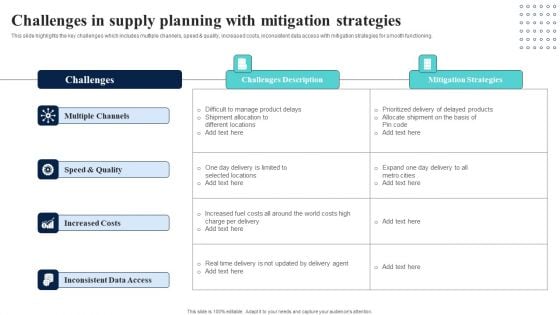
Challenges In Supply Planning With Mitigation Strategies Themes PDF
This slide highlights the key challenges which includes multiple channels, speed and quality, increased costs, inconsistent data access with mitigation strategies for smooth functioning. Are you in need of a template that can accommodate all of your creative concepts This one is crafted professionally and can be altered to fit any style. Use it with Google Slides or PowerPoint. Include striking photographs, symbols, depictions, and other visuals. Fill, move around, or remove text boxes as desired. Test out color palettes and font mixtures. Edit and save your work, or work with colleagues. Download Challenges In Supply Planning With Mitigation Strategies Themes PDF and observe how to make your presentation outstanding. Give an impeccable presentation to your group and make your presentation unforgettable.
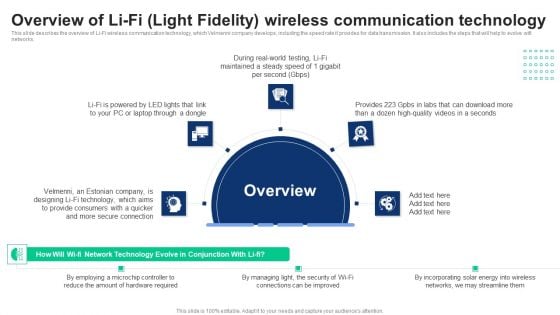
1G To 5G Cellular Overview Of Lifi Light Fidelity Wireless Communication Technology Diagrams PDF
This slide describes the overview of Li-Fi wireless communication technology, which Velmenni company develops, including the speed rate it provides for data transmission. It also includes the steps that will help to evolve wifi networks. If you are looking for a format to display your unique thoughts, then the professionally designed 1G To 5G Cellular Overview Of Lifi Light Fidelity Wireless Communication Technology Diagrams PDF is the one for you. You can use it as a Google Slides template or a PowerPoint template. Incorporate impressive visuals, symbols, images, and other charts. Modify or reorganize the text boxes as you desire. Experiment with shade schemes and font pairings. Alter, share or cooperate with other people on your work. Download 1G To 5G Cellular Overview Of Lifi Light Fidelity Wireless Communication Technology Diagrams PDF and find out how to give a successful presentation. Present a perfect display to your team and make your presentation unforgettable.
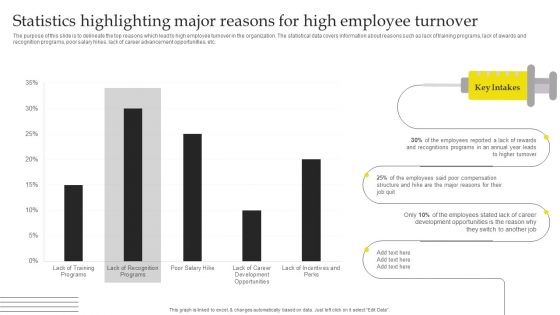
Effective Strategies For Retaining Healthcare Staff Statistics Highlighting Major Reasons For High Employee Guidelines PDF
The purpose of this slide is to delineate the top reasons which lead to high employee turnover in the organization. The statistical data covers information about reasons such as lack of training programs, lack of awards and recognition programs, poor salary hikes, lack of career advancement opportunities, etc. Do you have to make sure that everyone on your team knows about any specific topic I yes, then you should give Effective Strategies For Retaining Healthcare Staff Statistics Highlighting Major Reasons For High Employee Guidelines PDF a try. Our experts have put a lot of knowledge and effort into creating this impeccable Effective Strategies For Retaining Healthcare Staff Statistics Highlighting Major Reasons For High Employee Guidelines PDF. You can use this template for your upcoming presentations, as the slides are perfect to represent even the tiniest detail. You can download these templates from the Slidegeeks website and these are easy to edit. So grab these today.
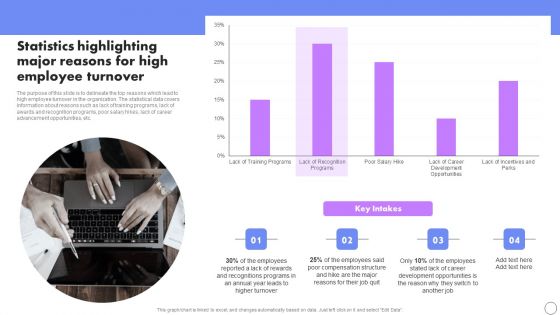
Statistics Highlighting Major Reasons For High Employee Turnover Developing Employee Retention Techniques Demonstration PDF
The purpose of this slide is to delineate the top reasons which lead to high employee turnover in the organization. The statistical data covers information about reasons such as lack of training programs, lack of awards and recognition programs, poor salary hikes, lack of career advancement opportunities, etc. This modern and well-arranged Statistics Highlighting Major Reasons For High Employee Turnover Developing Employee Retention Techniques Demonstration PDF provides lots of creative possibilities. It is very simple to customize and edit with the Powerpoint Software. Just drag and drop your pictures into the shapes. All facets of this template can be edited with Powerpoint no extra software is necessary. Add your own material, put your images in the places assigned for them, adjust the colors, and then you can show your slides to the world, with an animated slide included.
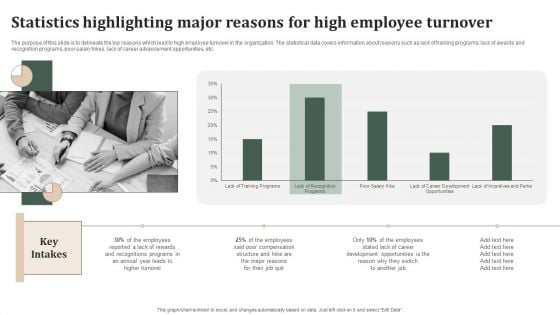
Successful Staff Retention Techniques Statistics Highlighting Major Reasons For High Employee Turnover Ideas PDF
The purpose of this slide is to delineate the top reasons which lead to high employee turnover in the organization. The statistical data covers information about reasons such as lack of training programs, lack of awards and recognition programs, poor salary hikes, lack of career advancement opportunities, etc. Slidegeeks is here to make your presentations a breeze with Successful Staff Retention Techniques Statistics Highlighting Major Reasons For High Employee Turnover Ideas PDF With our easy to use and customizable templates, you can focus on delivering your ideas rather than worrying about formatting. With a variety of designs to choose from, you are sure to find one that suits your needs. And with animations and unique photos, illustrations, and fonts, you can make your presentation pop. So whether you are giving a sales pitch or presenting to the board, make sure to check out Slidegeeks first.
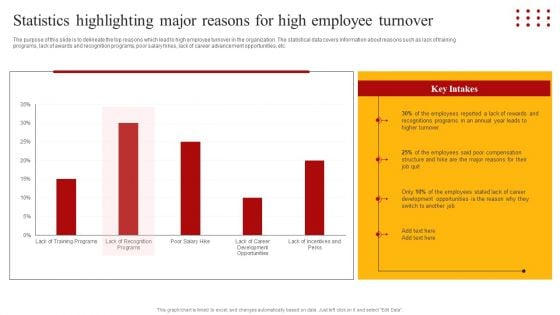
Staff Retention Techniques To Minimize Hiring Expenses Statistics Highlighting Major Reasons For High Employee Pictures PDF
The purpose of this slide is to delineate the top reasons which lead to high employee turnover in the organization. The statistical data covers information about reasons such as lack of training programs, lack of awards and recognition programs, poor salary hikes, lack of career advancement opportunities, etc. Present like a pro with Staff Retention Techniques To Minimize Hiring Expenses Statistics Highlighting Major Reasons For High Employee Pictures PDF Create beautiful presentations together with your team, using our easy to use presentation slides. Share your ideas in real time and make changes on the fly by downloading our templates. So whether you are in the office, on the go, or in a remote location, you can stay in sync with your team and present your ideas with confidence. With Slidegeeks presentation got a whole lot easier. Grab these presentations today.
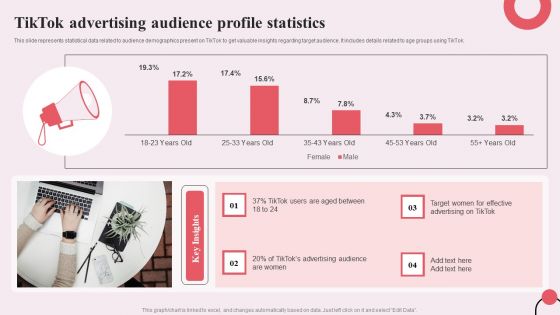
Tiktok Digital Marketing Campaign Tiktok Advertising Audience Profile Statistics Infographics PDF
This slide represents statistical data related to audience demographics present on TikTok to get valuable insights regarding target audience. It includes details related to age groups using TikTok. Crafting an eye-catching presentation has never been more straightforward. Let your presentation shine with this tasteful yet straightforward Tiktok Digital Marketing Campaign Tiktok Advertising Audience Profile Statistics Infographics PDF template. It offers a minimalistic and classy look that is great for making a statement. The colors have been employed intelligently to add a bit of playfulness while still remaining professional. Construct the ideal Tiktok Digital Marketing Campaign Tiktok Advertising Audience Profile Statistics Infographics PDF that effortlessly grabs the attention of your audience Begin now and be certain to wow your customers
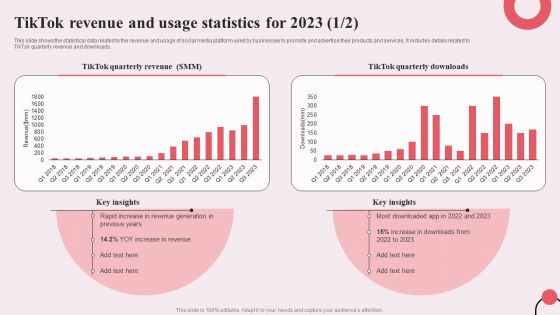
Tiktok Digital Marketing Campaign Tiktok Revenue And Usage Statistics For 2023 Demonstration PDF
This slide shows the statistical data related to the revenue and usage of social media platform used by businesses to promote and advertise their products and services. It includes details related to TikTok quarterly revenue and downloads. Create an editable Tiktok Digital Marketing Campaign Tiktok Revenue And Usage Statistics For 2023 Demonstration PDF that communicates your idea and engages your audience. Whether you are presenting a business or an educational presentation, pre-designed presentation templates help save time. Tiktok Digital Marketing Campaign Tiktok Revenue And Usage Statistics For 2023 Demonstration PDF is highly customizable and very easy to edit, covering many different styles from creative to business presentations. Slidegeeks has creative team members who have crafted amazing templates. So, go and get them without any delay.

Dollar Question Mark Finance PowerPoint Templates And PowerPoint Themes 1112
We present our Dollar Question Mark Finance PowerPoint Templates And PowerPoint Themes 1112.Use our Success PowerPoint Templates because, Timelines Display:- You have developed a vision of where you want to be a few years from now. Use our Money PowerPoint Templates because, Illustrate your ideas one by one and demonstrate how each is an important cog in running the entire wheel. Use our Success PowerPoint Templates because, Start the gears of youthful minds and set them in motion. Use our Signs PowerPoint Templates because,They are indicators of the path you have in mind. Use our Business PowerPoint Templates because,Marketing Strategy Business Template:- Maximising sales of your product is the intended destination.Use these PowerPoint slides for presentations relating to Dollar question mark, money, finance, success, signs, business. The prominent colors used in the PowerPoint template are Green, Red, Black Examine data with our Dollar Question Mark Finance PowerPoint Templates And PowerPoint Themes 1112. You will come out on top.
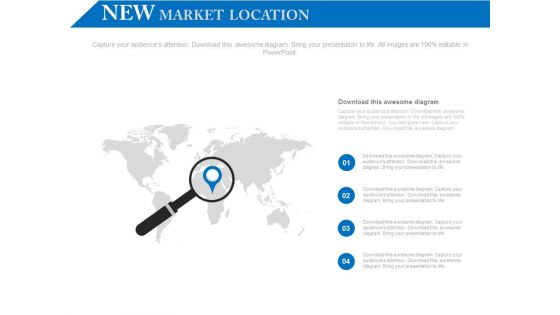
Four Steps Global Search Diagram PowerPoint Slides
?The world is so huge that people are always getting lost in it? - Susan Orlean. Similarly your audience too can get lost if you don?t specify the location in your PowerPoint presentation. This slide is a perfect fit to explain that your resources, data or information have been sourced from a specific city or country. The magnifying glass signifies that you are going in depth or talking in detail about the location marked on the map and not generally about the world. This slide in your presentation can help the audience relate to the content. This slide can be of perfect use to depict a report or analysis prepared after thorough investigation or a survey conducted at a particular city or location.
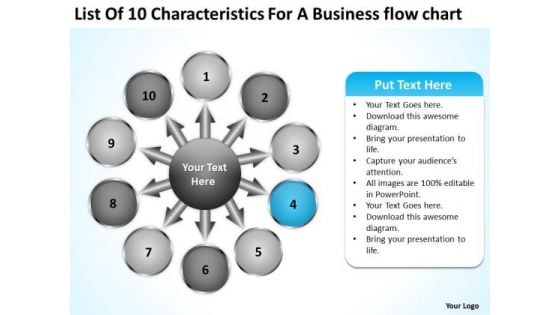
For A Free Business PowerPoint Templates Flow Chart Business Circular Process Slides
We present our for a free business powerpoint templates flow chart business Circular Process Slides.Use our Business PowerPoint Templates because this diagram can set an example to enthuse your team with the passion and fervour of your ideas. Download our Process and Flows PowerPoint Templates because you can Educate your team with the attention to be paid. Download our Ring Charts PowerPoint Templates because in this Slide Various threads are joining up and being stitched together providing necessary strength Now you have to take the last leap. Download our Shapes PowerPoint Templates because this slide shows each path to the smallest detail. Present our Circle Charts PowerPoint Templates because this Layout can explain the relevance of the different layers and stages in getting down to your core competence, ability and desired result.Use these PowerPoint slides for presentations relating to Business,chart, circle, colors, concept,contemporary, corporate, cycle, data,design, detail, development, diagram, engineering, graphic, ideas,illustration, implement, implementation,management, model, modern,organization, phase, plan, process,product, professional, project, quality,schema, set, software, stack, stage, steps, strategy, success, system, tag, team. The prominent colors used in the PowerPoint template are Blue light, Gray, Black. Customers tell us our for a free business powerpoint templates flow chart business Circular Process Slides are Lush. Customers tell us our concept PowerPoint templates and PPT Slides are Vintage. Customers tell us our for a free business powerpoint templates flow chart business Circular Process Slides are Fantastic. People tell us our corporate PowerPoint templates and PPT Slides are Fashionable. Customers tell us our for a free business powerpoint templates flow chart business Circular Process Slides will help you be quick off the draw. Just enter your specific text and see your points hit home. Customers tell us our data PowerPoint templates and PPT Slides are Breathtaking. Encapsulate your thoughts in our For A Free Business PowerPoint Templates Flow Chart Business Circular Process Slides. They will become a class apart.

Zero Trust Network Access Architectural Models Diagrams PDF
This slide describes the main models of ZTNA architecture. The purpose of this slide is to showcase the two essential models of zero trust network access architecture, including client-based and browser-based. Both models perform security functions, including identity verification, access control, and data encryption. Are you searching for a Zero Trust Network Access Architectural Models Diagrams PDF that is uncluttered, straightforward, and original Its easy to edit, and you can change the colors to suit your personal or business branding. For a presentation that expresses how much effort you have put in, this template is ideal With all of its features, including tables, diagrams, statistics, and lists, its perfect for a business plan presentation. Make your ideas more appealing with these professional slides. Download Zero Trust Network Access Architectural Models Diagrams PDF from Slidegeeks today.
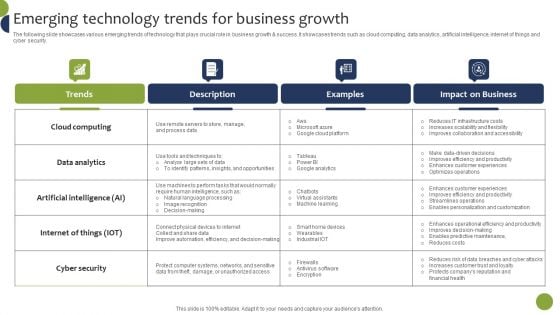
Emerging Technology Trends For Business Growth Diagrams PDF
The following slide showcases various emerging trends of technology that plays crucial role in business growth and success. It showcases trends such as cloud computing, data analytics, artificial intelligence, internet of things and cyber security. Formulating a presentation can take up a lot of effort and time, so the content and message should always be the primary focus. The visuals of the PowerPoint can enhance the presenters message, so our Emerging Technology Trends For Business Growth Diagrams PDF was created to help save time. Instead of worrying about the design, the presenter can concentrate on the message while our designers work on creating the ideal templates for whatever situation is needed. Slidegeeks has experts for everything from amazing designs to valuable content, we have put everything into Emerging Technology Trends For Business Growth Diagrams PDF.
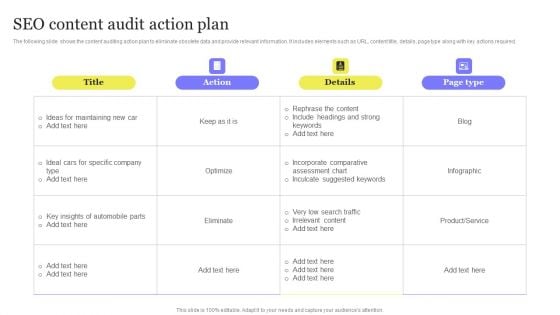
Enhancing Digital Visibility Using SEO Content Strategy SEO Content Audit Action Plan Themes PDF
The following slide shows the content auditing action plan to eliminate obsolete data and provide relevant information. It includes elements such as URL, content title, details, page type along with key actions required. Here you can discover an assortment of the finest PowerPoint and Google Slides templates. With these templates, you can create presentations for a variety of purposes while simultaneously providing your audience with an eye catching visual experience. Download Enhancing Digital Visibility Using SEO Content Strategy SEO Content Audit Action Plan Themes PDF to deliver an impeccable presentation. These templates will make your job of preparing presentations much quicker, yet still, maintain a high level of quality. Slidegeeks has experienced researchers who prepare these templates and write high quality content for you. Later on, you can personalize the content by editing the Enhancing Digital Visibility Using SEO Content Strategy SEO Content Audit Action Plan Themes PDF.
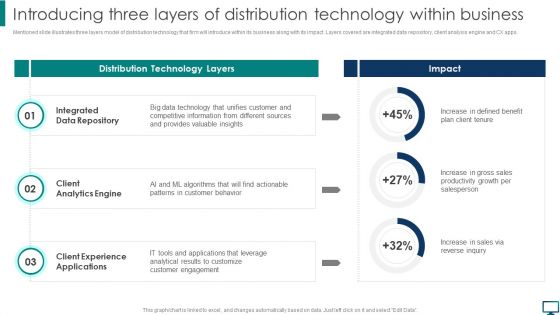
Introducing Three Layers Of Distribution Technology Within Business Structure PDF
Mentioned slide illustrates three layers model of distribution technology that firm will introduce within its business along with its impact. Layers covered are integrated data repository, client analysis engine and CX apps. Do you know about Slidesgeeks Introducing Three Layers Of Distribution Technology Within Business Structure PDF These are perfect for delivering any kind od presentation. Using it, create PowerPoint presentations that communicate your ideas and engage audiences. Save time and effort by using our pre designed presentation templates that are perfect for a wide range of topic. Our vast selection of designs covers a range of styles, from creative to business, and are all highly customizable and easy to edit. Download as a PowerPoint template or use them as Google Slides themes.
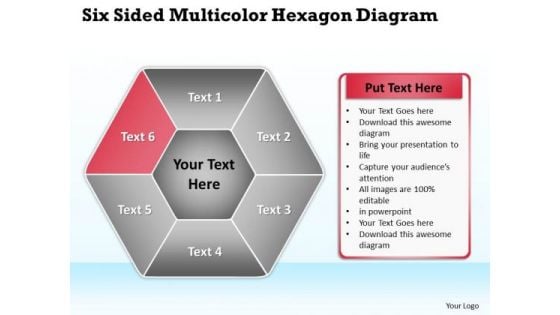
Vision Business Process Diagram PowerPoint Templates Backgrounds For Slides
We present our vision business process diagram PowerPoint templates backgrounds for slides.Present our Process and flows PowerPoint Templates because Our PowerPoint Templates and Slides will let your words and thoughts hit bullseye everytime. Present our Business PowerPoint Templates because Our PowerPoint Templates and Slides will let you Hit the right notes. Watch your audience start singing to your tune. Download our Marketing PowerPoint Templates because You have a driving passion to excel in your field. Our PowerPoint Templates and Slides will prove ideal vehicles for your ideas. Present our Flow Charts PowerPoint Templates because You have gained great respect for your brilliant ideas. Use our PowerPoint Templates and Slides to strengthen and enhance your reputation. Present our Shapes PowerPoint Templates because Our PowerPoint Templates and Slides are the chords of your song. String them along and provide the lilt to your views.Use these PowerPoint slides for presentations relating to Business, button, catalog, chart, circle, company, cross, data, design, diagram, direction, document, financial, four, glossy, goals, graph, green, junction, management, market, marketing, model, multicolored, multiple, navigation, network, options, plan, presentation, process, purple, results, shiny, sphere. The prominent colors used in the PowerPoint template are Red, White, Gray. Professionals tell us our vision business process diagram PowerPoint templates backgrounds for slides are incredible easy to use. Presenters tell us our circle PowerPoint templates and PPT Slides are the best it can get when it comes to presenting. The feedback we get is that our vision business process diagram PowerPoint templates backgrounds for slides are designed by professionals Use our chart PowerPoint templates and PPT Slides will save the presenter time. You can be sure our vision business process diagram PowerPoint templates backgrounds for slides are readymade to fit into any presentation structure. Customers tell us our data PowerPoint templates and PPT Slides are designed by professionals Clip the wings of failure with our Vision Business Process Diagram PowerPoint Templates Backgrounds For Slides. You will come out on top.
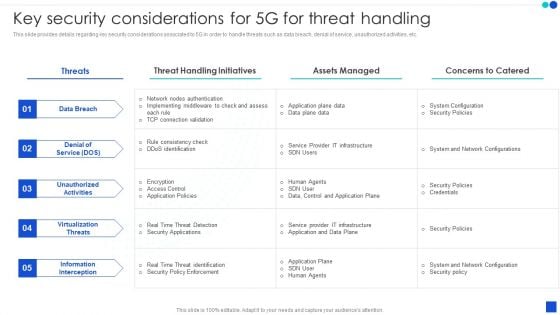
5G Technology Development For Digital Transformation Key Security Considerations For 5G For Threat Handling Themes PDF
This slide provides details regarding key security considerations associated to 5G in order to handle threats such as data breach, denial of service, unauthorized activities, etc. Here you can discover an assortment of the finest PowerPoint and Google Slides templates. With these templates, you can create presentations for a variety of purposes while simultaneously providing your audience with an eye catching visual experience. Download 5G Technology Development For Digital Transformation Key Security Considerations For 5G For Threat Handling Themes PDF to deliver an impeccable presentation. These templates will make your job of preparing presentations much quicker, yet still, maintain a high level of quality. Slidegeeks has experienced researchers who prepare these templates and write high quality content for you. Later on, you can personalize the content by editing the 5G Technology Development For Digital Transformation Key Security Considerations For 5G For Threat Handling Themes PDF.
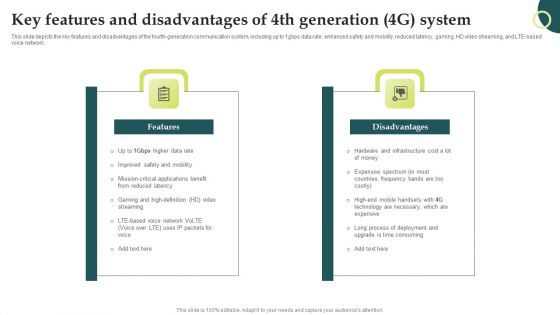
Evolution Of Wireless Technologies Key Features And Disadvantages Of 4Th Generation Themes PDF
This slide depicts the key features and disadvantages of the fourth-generation communication system, including up to 1gbps data rate, enhanced safety and mobility, reduced latency, gaming, HD video streaming, and LTE-based voice network. Formulating a presentation can take up a lot of effort and time, so the content and message should always be the primary focus. The visuals of the PowerPoint can enhance the presenters message, so our Evolution Of Wireless Technologies Key Features And Disadvantages Of 4Th Generation Themes PDF was created to help save time. Instead of worrying about the design, the presenter can concentrate on the message while our designers work on creating the ideal templates for whatever situation is needed. Slidegeeks has experts for everything from amazing designs to valuable content, we have put everything into Evolution Of Wireless Technologies Key Features And Disadvantages Of 4Th Generation Themes PDF.
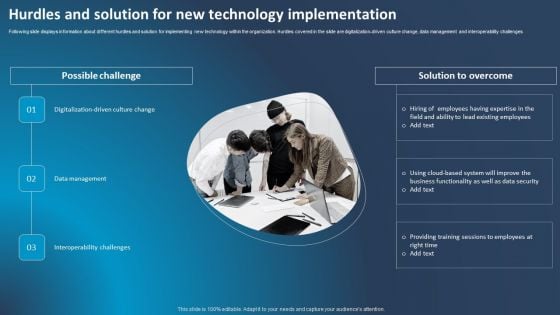
Improving Corporate Performance Hurdles And Solution For New Technology Themes PDF
Following slide displays information about different hurdles and solution for implementing new technology within the organization. Hurdles covered in the slide are digitalization-driven culture change, data management and interoperability challenges. Whether you have daily or monthly meetings, a brilliant presentation is necessary. Improving Corporate Performance Hurdles And Solution For New Technology Themes PDF can be your best option for delivering a presentation. Represent everything in detail using Improving Corporate Performance Hurdles And Solution For New Technology Themes PDF and make yourself stand out in meetings. The template is versatile and follows a structure that will cater to your requirements. All the templates prepared by Slidegeeks are easy to download and edit. Our research experts have taken care of the corporate themes as well. So, give it a try and see the results.

 Home
Home