Data Icon
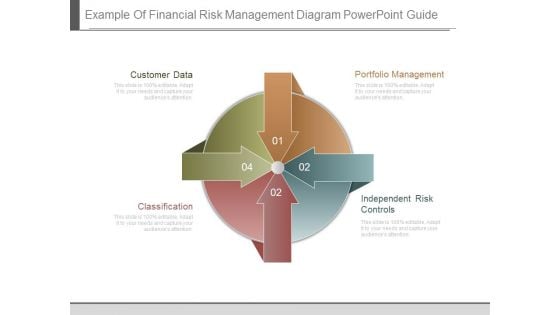
Example Of Financial Risk Management Diagram Powerpoint Guide
This is a example of financial risk management diagram powerpoint guide. This is a four stage process. The stages in this process are customer data, portfolio management, classification, independent risk controls.
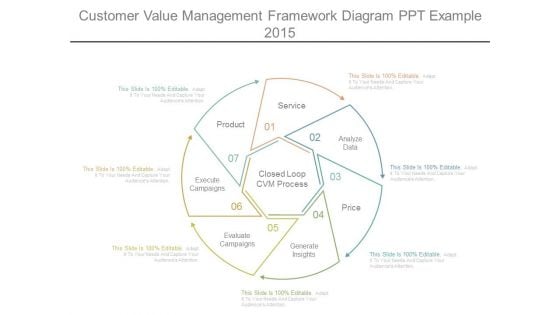
Customer Value Management Framework Diagram Ppt Example 2015
This is a customer value management framework diagram ppt example 2015. This is a seven stage process. The stages in this process are closed loop cvm process, evaluate campaigns, generate insights, price, analyze data, service, product, execute campaigns.
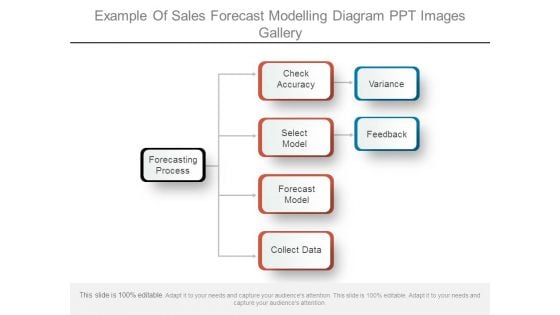
Example Of Sales Forecast Modelling Diagram Ppt Images Gallery
This is a example of sales forecast modelling diagram ppt images gallery. This is a three stage process. The stages in this process are forecasting process, check accuracy, select model, forecast model, collect data, variance, feedback.
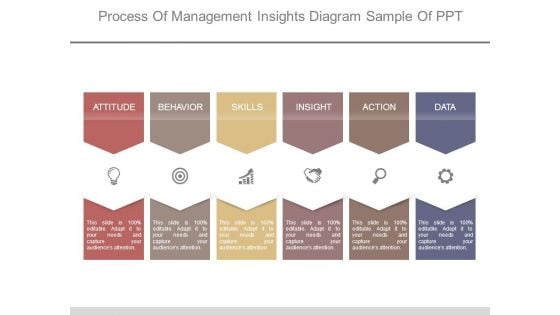
Process Of Management Insights Diagram Sample Of Ppt
This is a process of management insights diagram sample of ppt. This is a six stage process. The stages in this process are attitude, behavior, skills, insight, action, data.
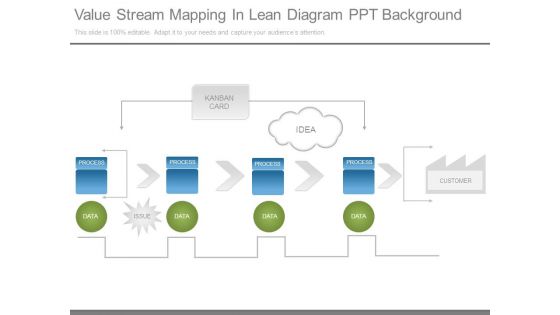
Value Stream Mapping In Lean Diagram Ppt Background
This is a value stream mapping in lean diagram ppt background. This is a four stage process. The stages in this process are kanban card, idea, process, customer, data, issue.
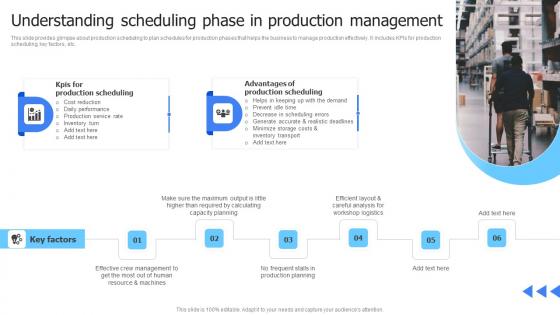
Leveraging Advanced Manufacturing Understanding Scheduling Phase In Production Template Pdf
This slide provides glimpse about production scheduling to plan schedules for production phases that helps the business to manage production effectively. It includes KPIs for production scheduling, key factors, etc. The Leveraging Advanced Manufacturing Understanding Scheduling Phase In Production Template Pdf is a compilation of the most recent design trends as a series of slides. It is suitable for any subject or industry presentation, containing attractive visuals and photo spots for businesses to clearly express their messages. This template contains a variety of slides for the user to input data, such as structures to contrast two elements, bullet points, and slides for written information. Slidegeeks is prepared to create an impression. This slide provides glimpse about production scheduling to plan schedules for production phases that helps the business to manage production effectively. It includes KPIs for production scheduling, key factors, etc.
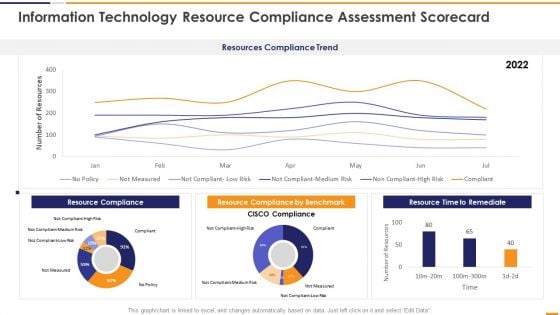
IT Security Evaluation Scorecard Information Technology Resource Compliance Background PDF
This graph or chart is linked to excel, and changes automatically based on data. Just left click on it and select Edit Data. Deliver and pitch your topic in the best possible manner with this IT Security Evaluation Scorecard Information Technology Resource Compliance Background PDF. Use them to share invaluable insights on Resources Compliance Trend, Resource Compliance 2022, Resource Compliance Benchmark, Resource Time Remediate and impress your audience. This template can be altered and modified as per your expectations. So, grab it now.
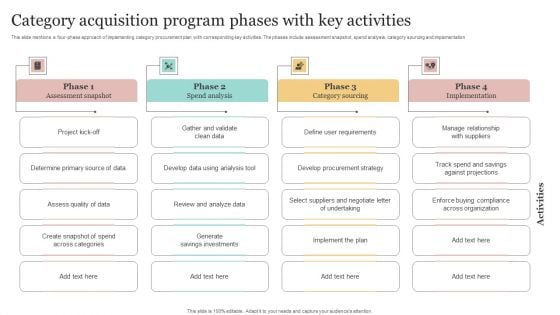
Category Acquisition Program Phases With Key Activities Demonstration PDF
This slide mentions a four-phase approach of implementing category procurement plan with corresponding key activities. The phases include assessment snapshot, spend analysis, category sourcing and implementation. Presenting Category Acquisition Program Phases With Key Activities Demonstration PDF to dispense important information. This template comprises four stages. It also presents valuable insights into the topics including Project Kick Off, Determine Primary Source Data, Assess Quality Data. This is a completely customizable PowerPoint theme that can be put to use immediately. So, download it and address the topic impactfully.
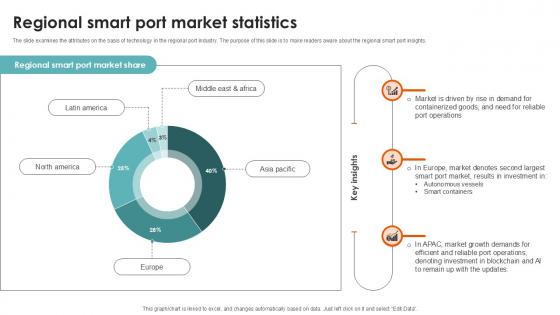
Regional Smart Port Market Statistics Port Terminal Industry Ppt Sample
The slide examines the attributes on the basis of technology in the regional port industry. The purpose of this slide is to make readers aware about the regional smart port insights. Boost your pitch with our creative Regional Smart Port Market Statistics Port Terminal Industry Ppt Sample. Deliver an awe inspiring pitch that will mesmerize everyone. Using these presentation templates you will surely catch everyones attention. You can browse the ppts collection on our website. We have researchers who are experts at creating the right content for the templates. So you do not have to invest time in any additional work. Just grab the template now and use them. The slide examines the attributes on the basis of technology in the regional port industry. The purpose of this slide is to make readers aware about the regional smart port insights.
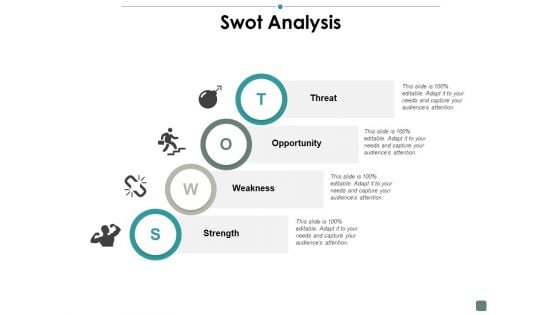
Swot Analysis Contribution Ppt PowerPoint Presentation Pictures Information
This is a swot analysis contribution ppt powerpoint presentation pictures information. This is a four stage process. The stages in this process are marketing, icons, business, management, strategy.
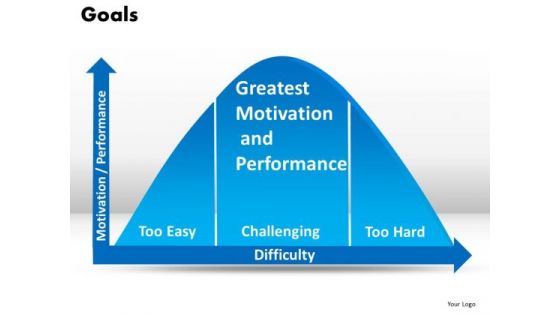
PowerPoint Templates Statistical Bell Curve PowerPoint Slides Download
PowerPoint_Templates_Statistical_Bell_Curve_PowerPoint_Slides_Download-These high quality powerpoint pre-designed slides and powerpoint templates have been carefully created by our professional team to help you impress your audience. All slides have been created and are 100% editable in powerpoint. Each and every property of any graphic - color, size, orientation, shading, outline etc. can be modified to help you build an effective powerpoint presentation. Any text can be entered at any point in the powerpoint template or slide. Simply DOWNLOAD, TYPE and PRESENT! These PowerPoint presentation slides can be used to represent themes relating to --Arrow, alphabet, ball, blue, business, chart, concept, creative, crystal, circle, diagram, shape, round, shadow, reflection, glossy, glowing, shiny, icon, process, flow, link, connect, connection, style, relation, text, textbox-PowerPoint_Templates_Statistical_Bell_Curve_PowerPoint_Slides_Download Make the greatest presentation ever with our PowerPoint Templates Statistical Bell Curve PowerPoint Slides Download. Dont waste time struggling with PowerPoint. Let us do it for you.
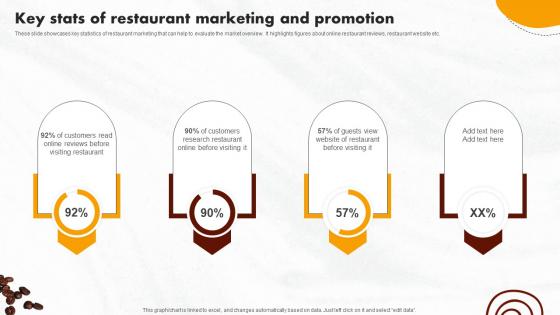
Online Promotional Activities Key Stats Of Restaurant Marketing Formats Pdf
These slide showcases key statistics of restaurant marketing that can help to evaluate the market overview. It highlights figures about online restaurant reviews, restaurant website etc. Explore a selection of the finest Online Promotional Activities Key Stats Of Restaurant Marketing Formats Pdf here. With a plethora of professionally designed and pre made slide templates, you can quickly and easily find the right one for your upcoming presentation. You can use our Online Promotional Activities Key Stats Of Restaurant Marketing Formats Pdf to effectively convey your message to a wider audience. Slidegeeks has done a lot of research before preparing these presentation templates. The content can be personalized and the slides are highly editable. Grab templates today from Slidegeeks. These slide showcases key statistics of restaurant marketing that can help to evaluate the market overview. It highlights figures about online restaurant reviews, restaurant website etc.
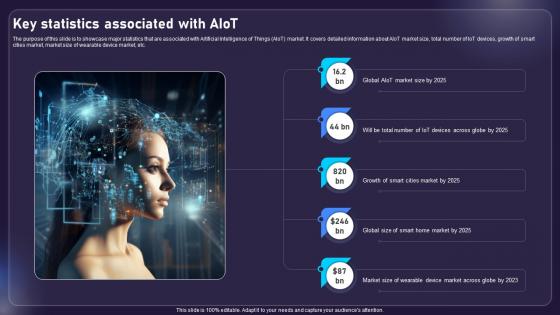
Key Statistics Associated With AIOT AIOT Applications For Various Industries IoT SS V
The purpose of this slide is to showcase major statistics that are associated with Artificial Intelligence of Things AIoT market. It covers detailed information about AIoT market size, total number of IoT devices, growth of smart cities market, market size of wearable device market, etc. Retrieve professionally designed Key Statistics Associated With AIOT AIOT Applications For Various Industries IoT SS V to effectively convey your message and captivate your listeners. Save time by selecting pre-made slideshows that are appropriate for various topics, from business to educational purposes. These themes come in many different styles, from creative to corporate, and all of them are easily adjustable and can be edited quickly. Access them as PowerPoint templates or as Google Slides themes. You do not have to go on a hunt for the perfect presentation because Slidegeeks got you covered from everywhere. The purpose of this slide is to showcase major statistics that are associated with Artificial Intelligence of Things AIoT market. It covers detailed information about AIoT market size, total number of IoT devices, growth of smart cities market, market size of wearable device market, etc.

Top Tenets Of Zero Trust Network Access Model Zero Trust Network Security Graphics Pdf
This graph chart is linked to excel, and changes automatically based on data. Just left click on it and select Edit Data. Do you have an important presentation coming up Are you looking for something that will make your presentation stand out from the rest Look no further than Top Tenets Of Zero Trust Network Access Model Zero Trust Network Security Graphics Pdf. With our professional designs, you can trust that your presentation will pop and make delivering it a smooth process. And with Slidegeeks, you can trust that your presentation will be unique and memorable. So why wait Grab Top Tenets Of Zero Trust Network Access Model Zero Trust Network Security Graphics Pdf today and make your presentation stand out from the rest This graph chart is linked to excel, and changes automatically based on data. Just left click on it and select Edit Data.
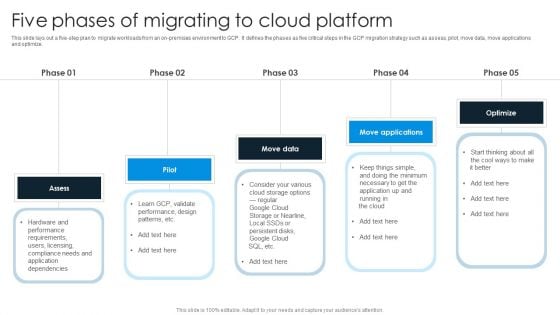
Five Phases Of Migrating To Cloud Platform Portrait PDF
This slide lays out a five-step plan to migrate workloads from an on-premises environment to GCP. It defines the phases as five critical steps in the GCP migration strategy such as assess, pilot, move data, move applications and optimize. Presenting Five Phases Of Migrating To Cloud Platform Portrait PDF to dispense important information. This template comprises five stages. It also presents valuable insights into the topics including Assess, Pilot, Move Data. This is a completely customizable PowerPoint theme that can be put to use immediately. So, download it and address the topic impactfully.
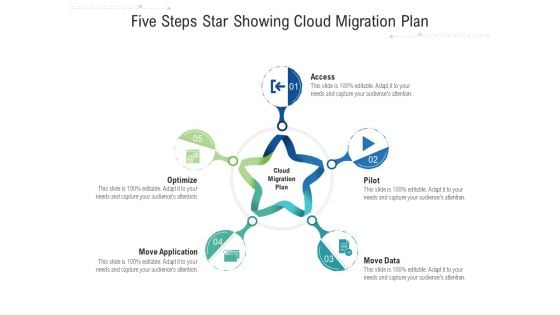
Five Steps Star Showing Cloud Migration Plan Ppt PowerPoint Presentation Visual Aids Summary PDF
Presenting this set of slides with name five steps star showing cloud migration plan ppt powerpoint presentation visual aids summary pdf. This is a five stage process. The stages in this process are access, pilot, move data, optimize, move application. This is a completely editable PowerPoint presentation and is available for immediate download. Download now and impress your audience.
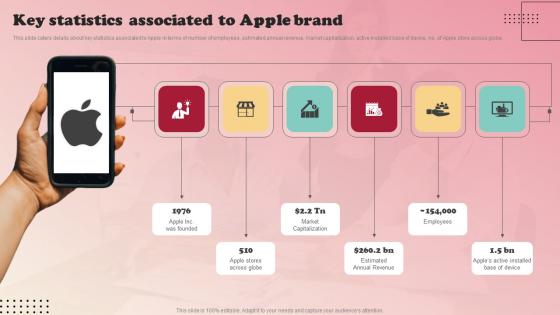
Product Branding Strategy Of Apple Key Statistics Associated To Apple Brand Guidelines Pdf
This slide caters details about key statistics associated to Apple in terms of number of employees, estimated annual revenue, market capitalization, active installed base of device, no. of Apple store across globe. Retrieve professionally designed Product Branding Strategy Of Apple Key Statistics Associated To Apple Brand Guidelines Pdf to effectively convey your message and captivate your listeners. Save time by selecting pre-made slideshows that are appropriate for various topics, from business to educational purposes. These themes come in many different styles, from creative to corporate, and all of them are easily adjustable and can be edited quickly. Access them as PowerPoint templates or as Google Slides themes. You dont have to go on a hunt for the perfect presentation because Slidegeeks got you covered from everywhere. This slide caters details about key statistics associated to Apple in terms of number of employees, estimated annual revenue, market capitalization, active installed base of device, no. of Apple store across globe.
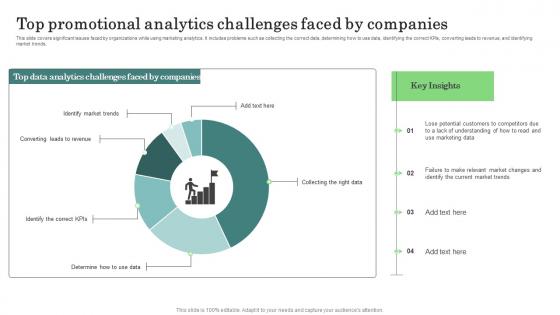
Major Promotional Analytics Future Trends Top Promotional Analytics Ideas Pdf
This slide covers significant issues faced by organizations while using marketing analytics. It includes problems such as collecting the correct data, determining how to use data, identifying the correct KPIs, converting leads to revenue, and identifying market trends. qSlidegeeks has constructed Major Promotional Analytics Future Trends Top Promotional Analytics Ideas Pdf after conducting extensive research and examination. These presentation templates are constantly being generated and modified based on user preferences and critiques from editors. Here, you will find the most attractive templates for a range of purposes while taking into account ratings and remarks from users regarding the content. This is an excellent jumping off point to explore our content and will give new users an insight into our top notch PowerPoint Templates. This slide covers significant issues faced by organizations while using marketing analytics. It includes problems such as collecting the correct data, determining how to use data, identifying the correct KPIs, converting leads to revenue, and identifying market trends.
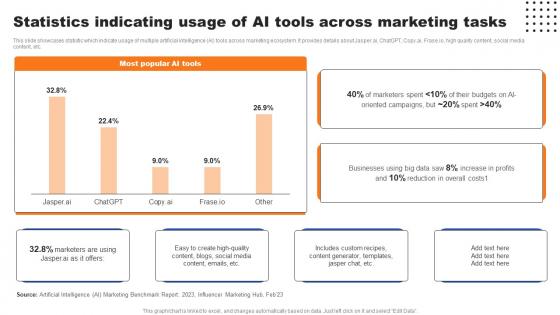
Statistics Indicating Usage Of AI Tools Across Marketing Tasks Ppt Inspiration Clipart Images Pdf
This slide showcases statistic which indicate usage of multiple artificial intelligence AI tools across marketing ecosystem. It provides details about Jasper.ai, ChatGPT, Copy.ai, Frase.io, high quality content, social media content, etc. Retrieve professionally designed Statistics Indicating Usage Of AI Tools Across Marketing Tasks Ppt Inspiration Clipart Images Pdf to effectively convey your message and captivate your listeners. Save time by selecting pre-made slideshows that are appropriate for various topics, from business to educational purposes. These themes come in many different styles, from creative to corporate, and all of them are easily adjustable and can be edited quickly. Access them as PowerPoint templates or as Google Slides themes. You do not have to go on a hunt for the perfect presentation because Slidegeeks got you covered from everywhere. This slide showcases statistic which indicate usage of multiple artificial intelligence AI tools across marketing ecosystem. It provides details about Jasper.ai, ChatGPT, Copy.ai, Frase.io, high quality content, social media content, etc.
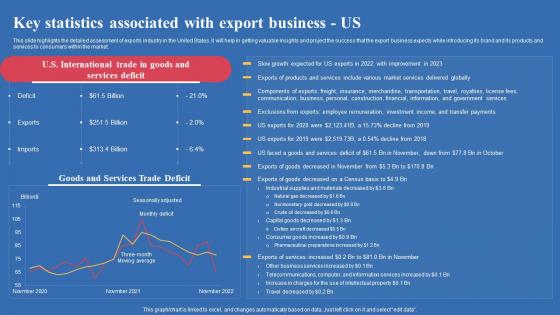
Key Statistics Associated With Export Business Us Export Business Plan Introduction Pdf
This slide highlights the detailed assessment of exports industry in the United States. It will help in getting valuable insights and project the success that the export business expects while introducing its brand and its products and services to consumers within the market. The Key Statistics Associated With Export Business Us Export Business Plan Introduction Pdf is a compilation of the most recent design trends as a series of slides. It is suitable for any subject or industry presentation, containing attractive visuals and photo spots for businesses to clearly express their messages. This template contains a variety of slides for the user to input data, such as structures to contrast two elements, bullet points, and slides for written information. Slidegeeks is prepared to create an impression. This slide highlights the detailed assessment of exports industry in the United States. It will help in getting valuable insights and project the success that the export business expects while introducing its brand and its products and services to consumers within the market.
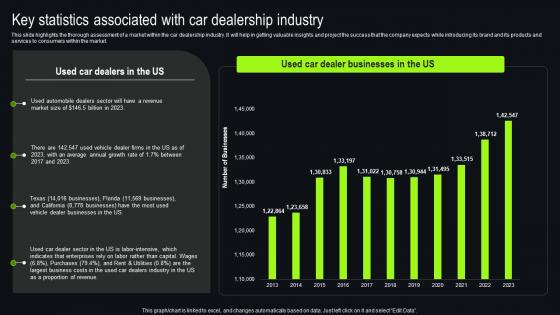
Key Statistics Associated With Car Dealership Industry New And Used Car Dealership Brochure Pdf
This slide highlights the thorough assessment of a market within the car dealership industry. It will help in getting valuable insights and project the success that the company expects while introducing its brand and its products and services to consumers within the market. The Key Statistics Associated With Car Dealership Industry New And Used Car Dealership Brochure Pdf is a compilation of the most recent design trends as a series of slides. It is suitable for any subject or industry presentation, containing attractive visuals and photo spots for businesses to clearly express their messages. This template contains a variety of slides for the user to input data, such as structures to contrast two elements, bullet points, and slides for written information. Slidegeeks is prepared to create an impression. This slide highlights the thorough assessment of a market within the car dealership industry. It will help in getting valuable insights and project the success that the company expects while introducing its brand and its products and services to consumers within the market.
Colorful Infographic For Text Representation Powerpoint Templates
Our above business diagram has been designed with colorful circular tags with icons. This slide is suitable for text representation in visual manner. Use this business diagram to present your work in a more smart and precise manner.
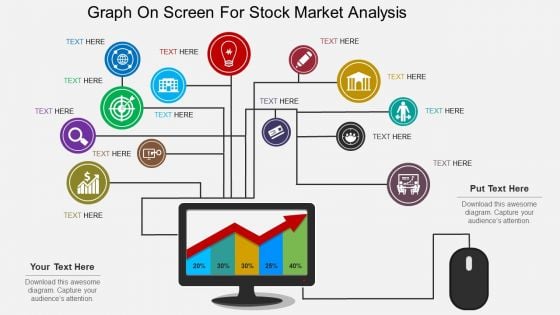
Graph On Screen For Stock Market Analysis Powerpoint Template
This PowerPoint slide contains computer screen with business graph. This professional slide may be used for visual explanation of data. Adjust the above diagram in your business presentations to give professional impact.
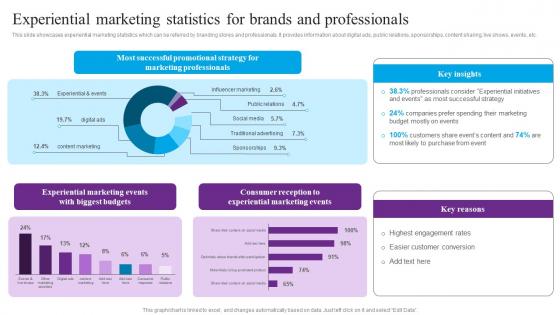
Experiential Marketing Statistics Centric Marketing To Enhance Brand Connections Summary Pdf
This slide showcases experiential marketing statistics which can be referred by branding stores and professionals. It provides information about digital ads, public relations, sponsorships, content sharing, live shows, events, etc. Do you know about Slidesgeeks Experiential Marketing Statistics Centric Marketing To Enhance Brand Connections Summary Pdf These are perfect for delivering any kind od presentation. Using it, create PowerPoint presentations that communicate your ideas and engage audiences. Save time and effort by using our pre designed presentation templates that are perfect for a wide range of topic. Our vast selection of designs covers a range of styles, from creative to business, and are all highly customizable and easy to edit. Download as a PowerPoint template or use them as Google Slides themes. This slide showcases experiential marketing statistics which can be referred by branding stores and professionals. It provides information about digital ads, public relations, sponsorships, content sharing, live shows, events, etc.
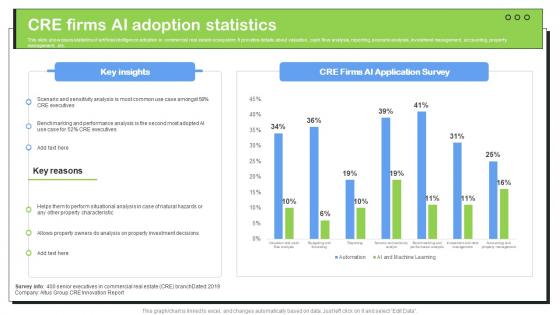
Transforming Real Estate Cre Firms Ai Adoption Statistics ChatGPT SS V
This slide showcases statistics of artificial intelligence adoption in commercial real estate ecosystem. It provides details about valuation, cash flow analysis, reporting, scenario analysis, investment management, accounting, property management, etc. Make sure to capture your audiences attention in your business displays with our gratis customizable Transforming Real Estate Cre Firms Ai Adoption Statistics ChatGPT SS V. These are great for business strategies, office conferences, capital raising or task suggestions. If you desire to acquire more customers for your tech business and ensure they stay satisfied, create your own sales presentation with these plain slides. This slide showcases statistics of artificial intelligence adoption in commercial real estate ecosystem. It provides details about valuation, cash flow analysis, reporting, scenario analysis, investment management, accounting, property management, etc.
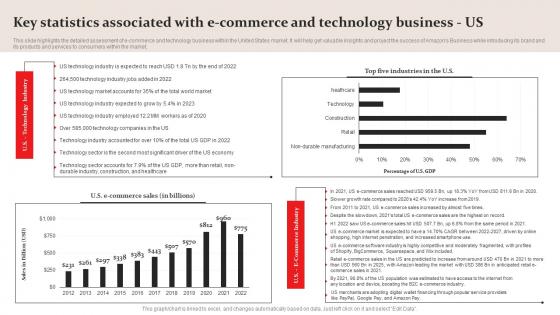
Key Statistics Associated E Commerce Amazon Business Plan Go To Market Strategy Graphics Pdf
This slide highlights the detailed assessment of e commerce and technology business within the United States market. It will help get valuable insights and project the success of Amazons Business while introducing its brand and its products and services to consumers within the market. Are you searching for a Key Statistics Associated E Commerce Amazon Business Plan Go To Market Strategy Graphics Pdf that is uncluttered, straightforward, and original Its easy to edit, and you can change the colors to suit your personal or business branding. For a presentation that expresses how much effort you have put in, this template is ideal With all of its features, including tables, diagrams, statistics, and lists, its perfect for a business plan presentation. Make your ideas more appealing with these professional slides. Download Key Statistics Associated E Commerce Amazon Business Plan Go To Market Strategy Graphics Pdf from Slidegeeks today. This slide highlights the detailed assessment of e commerce and technology business within the United States market. It will help get valuable insights and project the success of Amazons Business while introducing its brand and its products and services to consumers within the market.
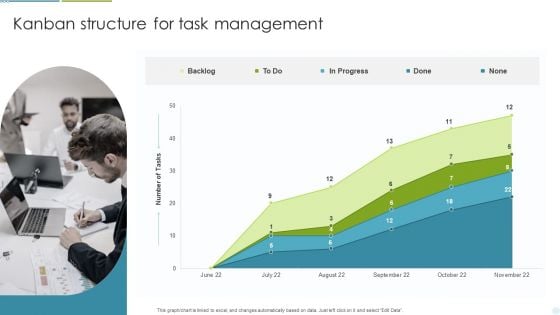
Kanban Structure For Task Management Ppt Summary Information PDF
This graph or chart is linked to excel, and changes automatically based on data. Just left click on it and select Edit Data. Showcasing this set of slides titled Kanban Structure For Task Management Ppt Summary Information PDF. The topics addressed in these templates are Backlog, In Progress, New Epic Added. All the content presented in this PPT design is completely editable. Download it and make adjustments in color, background, font etc. as per your unique business setting.
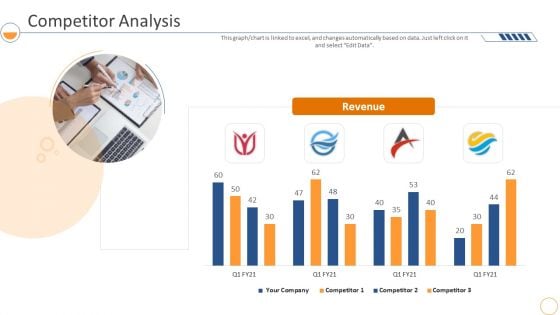
Monthly Company Performance Analysiscompetitor Analysis Pictures PDF
This graph or chart is linked to excel, and changes automatically based on data. Just left click on it and select Edit Data. Deliver and pitch your topic in the best possible manner with this monthly company performance analysiscompetitor analysis pictures pdf. Use them to share invaluable insights on revenue, competitor analysis and impress your audience. This template can be altered and modified as per your expectations. So, grab it now.
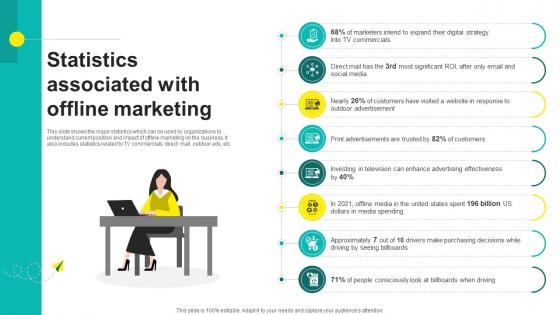
One On One Advertising Statistics Associated With Offline Marketing Strategy SS V
This slide shows the major statistics which can be used by organizations to understand current position and impact of offline marketing on the business. It also includes statistics related to TV commercials, direct mail, outdoor ads, etc. Whether you have daily or monthly meetings, a brilliant presentation is necessary. One On One Advertising Statistics Associated With Offline Marketing Strategy SS V can be your best option for delivering a presentation. Represent everything in detail using One On One Advertising Statistics Associated With Offline Marketing Strategy SS V and make yourself stand out in meetings. The template is versatile and follows a structure that will cater to your requirements. All the templates prepared by Slidegeeks are easy to download and edit. Our research experts have taken care of the corporate themes as well. So, give it a try and see the results. This slide shows the major statistics which can be used by organizations to understand current position and impact of offline marketing on the business. It also includes statistics related to TV commercials, direct mail, outdoor ads, etc.
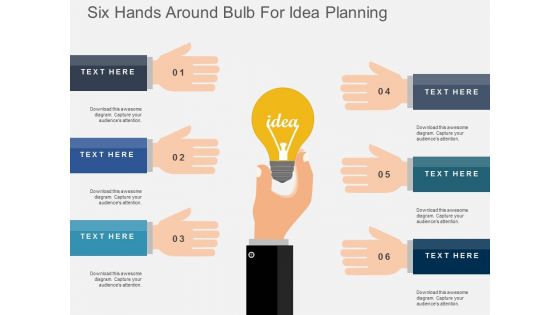
Six Hands Around Bulb For Idea Planning Powerpoint Templates
This business diagram has been crafted with graphic of five tags icons. This slide helps to display business steps in visual manner. Download this PowerPoint template to build unique presentations.
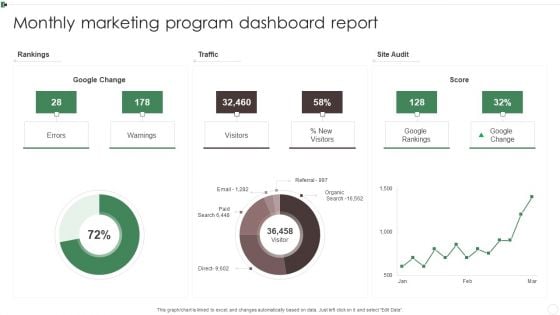
Monthly Marketing Program Dashboard Report Ppt Inspiration Information PDF
This graph or chart is linked to excel, and changes automatically based on data. Just left click on it and select Edit Data. Pitch your topic with ease and precision using this Monthly Marketing Program Dashboard Report Ppt Inspiration Information PDF. This layout presents information on Rankings, Traffic, Site Audit, Warnings. It is also available for immediate download and adjustment. So, changes can be made in the color, design, graphics or any other component to create a unique layout.
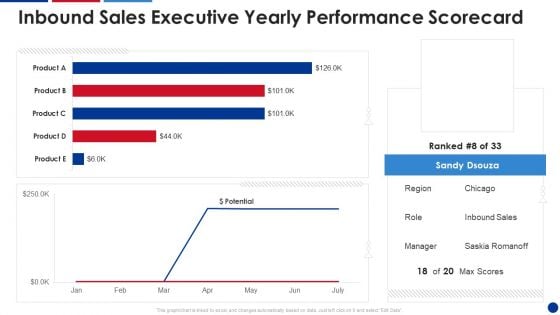
Inbound Sales Executive Yearly Performance Scorecard Information PDF
This graph or chart is linked to excel, and changes automatically based on data. Just left click on it and select Edit Data. Deliver and pitch your topic in the best possible manner with this Inbound Sales Executive Yearly Performance Scorecard Information PDF. Use them to share invaluable insights on Inbound Sales, Executive Yearly, Performance Scorecard and impress your audience. This template can be altered and modified as per your expectations. So, grab it now.
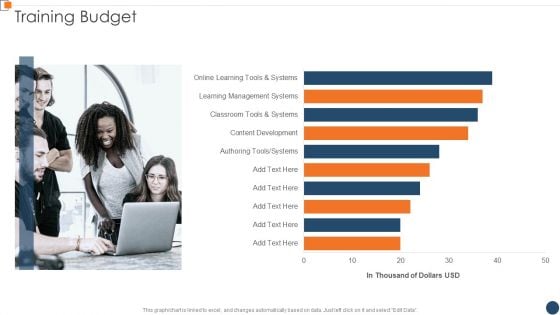
BANT Sales Lead Qualification Model Training Budget Template PDF
This graph or chart is linked to excel and change automatically based on data. Just left click on it and select Edit Data. Deliver an awe inspiring pitch with this creative BANT Sales Lead Qualification Model Training Budget Template PDF bundle. Topics like Content Development, Learning Management, Online Learning can be discussed with this completely editable template. It is available for immediate download depending on the needs and requirements of the user.

Three Text Tags With Alphabets Powerpoint Templates
The above template displays a diagram of circular arrows with icons. This diagram has been professionally designed to display steps of financial planning. Capture the attention of your audience.
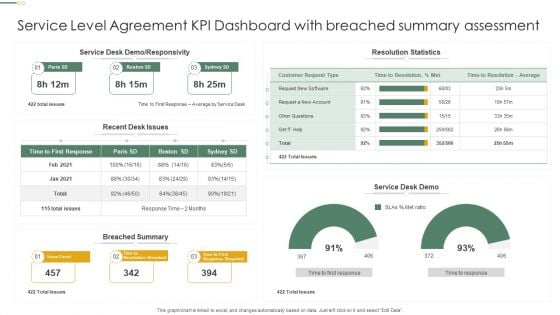
Service Level Agreement KPI Dashboard With Breached Summary Assessment Professional PDF
This graph or chart is linked to excel, and changes automatically based on data. Just left click on it and select Edit Data. Pitch your topic with ease and precision using this Service Level Agreement KPI Dashboard With Breached Summary Assessment Professional PDF. This layout presents information on Resolution Statistics, Service Desk Demo, Breached Summary. It is also available for immediate download and adjustment. So, changes can be made in the color, design, graphics or any other component to create a unique layout.

Busines Diagram Five Staged Test Tubes For Science Based Values Representation Ppt Template
Five staged test tubes are used to design this business diagram. This business slide contains the concept of value representation based on scientific data. Ideas are best expressed easily with the help of this diagram slide
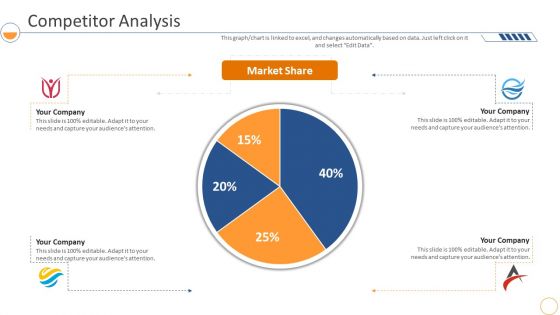
Monthly Company Performance Analysiscompetitor Analysis Market Formats PDF
This graph or chart is linked to excel, and changes automatically based on data. Just left click on it and select Edit Data. Deliver an awe inspiring pitch with this creative monthly company performance analysiscompetitor analysis market formats pdf bundle. Topics like competitor analysis, market share can be discussed with this completely editable template. It is available for immediate download depending on the needs and requirements of the user.
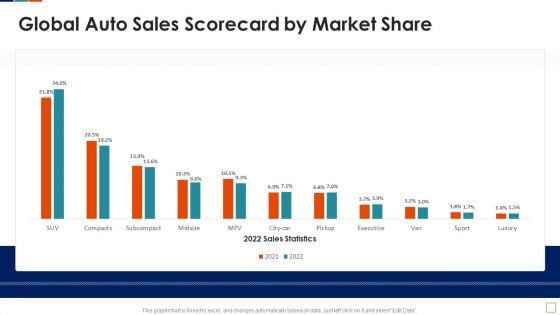
Global Auto Sales Scorecard By Market Share Ideas PDF
This graph or chart is linked to excel, and changes automatically based on data. Just left click on it and select Edit Data. Deliver an awe inspiring pitch with this creative Global Auto Sales Scorecard By Market Share Ideas PDF bundle. Topics like 2022 Sales Statistics, Global Auto Sales, Scorecard Market Share can be discussed with this completely editable template. It is available for immediate download depending on the needs and requirements of the user.
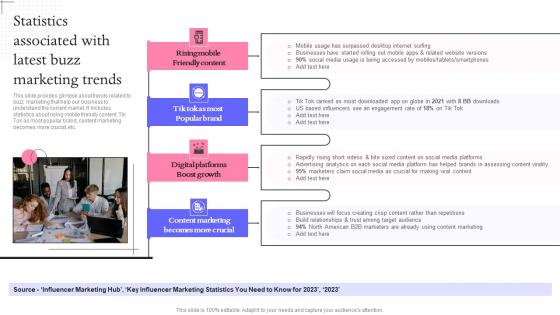
Statistics Associated With Latest Buzz Marketing Techniques For Engaging Elements Pdf
This slide provides glimpse about trends related to buzz marketing that help our business to understand the current market. It includes statistics about rising mobile friendly content, Tik Tok as most popular brand, content marketing becomes more crucial, etc. Whether you have daily or monthly meetings, a brilliant presentation is necessary. Statistics Associated With Latest Buzz Marketing Techniques For Engaging Elements Pdf can be your best option for delivering a presentation. Represent everything in detail using Statistics Associated With Latest Buzz Marketing Techniques For Engaging Elements Pdf and make yourself stand out in meetings. The template is versatile and follows a structure that will cater to your requirements. All the templates prepared by Slidegeeks are easy to download and edit. Our research experts have taken care of the corporate themes as well. So, give it a try and see the results. This slide provides glimpse about trends related to buzz marketing that help our business to understand the current market. It includes statistics about rising mobile friendly content, Tik Tok as most popular brand, content marketing becomes more crucial, etc.
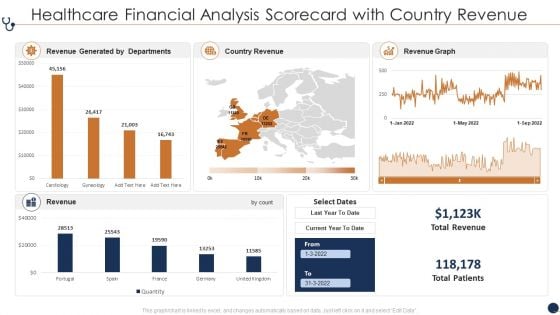
Healthcare Financial Analysis Scorecard With Country Revenue Ppt Layouts PDF
This graph or chart is linked to excel, and changes automatically based on data. Just left click on it and select Edit Data. Deliver an awe inspiring pitch with this creative Healthcare Financial Analysis Scorecard With Country Revenue Ppt Layouts PDF bundle. Topics like Revenue Generated Departments, Country Revenue Current can be discussed with this completely editable template. It is available for immediate download depending on the needs and requirements of the user.
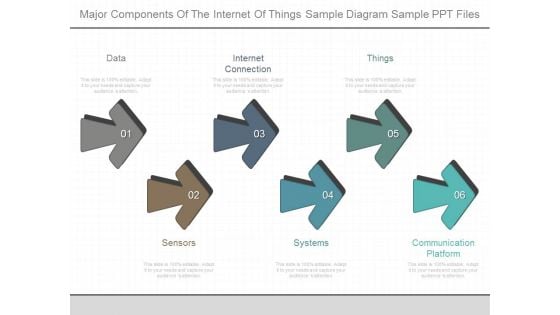
Major Components Of The Internet Of Things Sample Diagram Sample Ppt Files
This is a major components of the internet of things sample diagram sample ppt files. This is a six stage process. The stages in this process are data, internet connection, things, sensors, systems, communication platform.
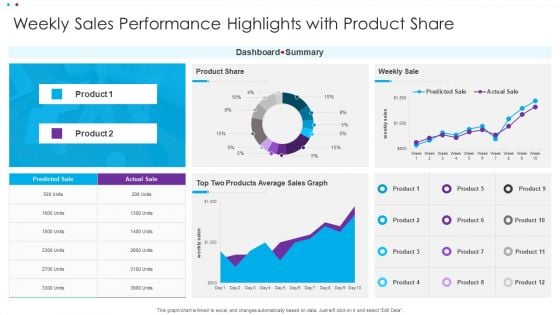
Weekly Sales Performance Highlights With Product Share Ppt File Information PDF
This graph or chart is linked to excel, and changes automatically based on data. Just left click on it and select Edit Data. Pitch your topic with ease and precision using this Weekly Sales Performance Highlights With Product Share Ppt File Information PDF. This layout presents information on Dashboard Summary, Weekly Sale, Product Share. It is also available for immediate download and adjustment. So, changes can be made in the color, design, graphics or any other component to create a unique layout.
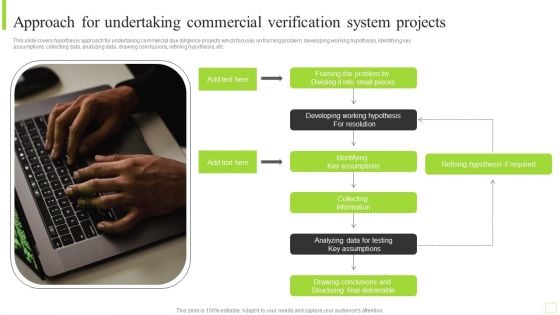
Approach For Undertaking Commercial Verification System Projects Guidelines PDF
This slide covers hypothesis approach for undertaking commercial due diligence projects which focuses on framing problem, developing working hypothesis, identifying key assumptions, collecting data, analyzing data, drawing conclusions, refining hypothesis, etc. Presenting Approach For Undertaking Commerc Approach For Undertaking Commercial Verification System Projects Guidelines PDF to dispense important information. This template comprises one stages. It also presents valuable insights into the topics including Collecting Information, Analyzing Data, Required. This is a completely customizable PowerPoint theme that can be put to use immediately. So, download it and address the topic impactfully
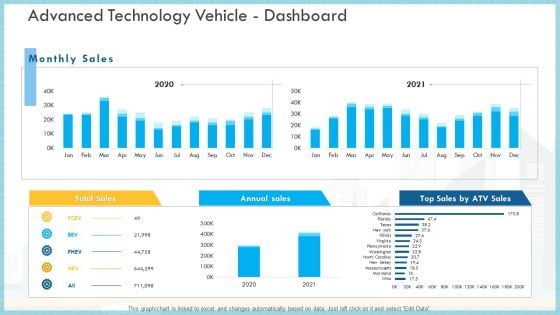
Loss Of Income And Financials Decline In An Automobile Organization Case Study Advanced Technology Vehicle Dashboard Infographics PDF
This graph or chart is linked to excel, and changes automatically based on data. Just left click on it and select Edit Data.Deliver an awe inspiring pitch with this creative loss of income and financials decline in an automobile organization case study advanced technology vehicle dashboard infographics pdf bundle. Topics like total sales, annual sales, monthly sales can be discussed with this completely editable template. It is available for immediate download depending on the needs and requirements of the user.
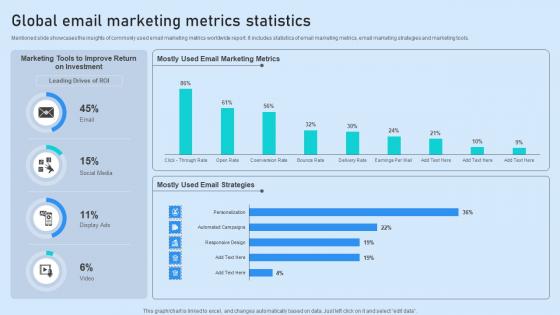
Global Email Marketing Metrics Statistics Structure Pdf
Mentioned slide showcases the insights of commonly used email marketing metrics worldwide report. It includes statistics of email marketing metrics, email marketing strategies and marketing tools. Showcasing this set of slides titled Global Email Marketing Metrics Statistics Structure Pdf. The topics addressed in these templates are Marketing Metrics, Strategies, Investment. All the content presented in this PPT design is completely editable. Download it and make adjustments in color, background, font etc. as per your unique business setting. Mentioned slide showcases the insights of commonly used email marketing metrics worldwide report. It includes statistics of email marketing metrics, email marketing strategies and marketing tools.

Summary Financial Accounting Statement Profit And Loss Analysis Dashboard Elements PDF
This graph or chart is linked to excel, and changes automatically based on data. Just left click on it and select Edit Data. Deliver an awe inspiring pitch with this creative Summary Financial Accounting Statement Profit And Loss Analysis Dashboard Elements PDF bundle. Topics like P And L Structure Dynamics, Dupont Rations, Debt Coverage Ratios, Creditworthiness Assessment can be discussed with this completely editable template. It is available for immediate download depending on the needs and requirements of the user.
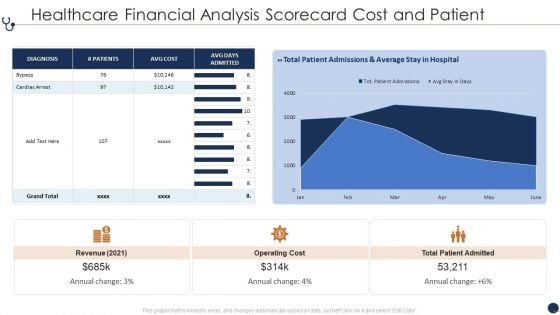
Healthcare Financial Analysis Scorecard Cost And Patient Ppt Pictures Rules PDF
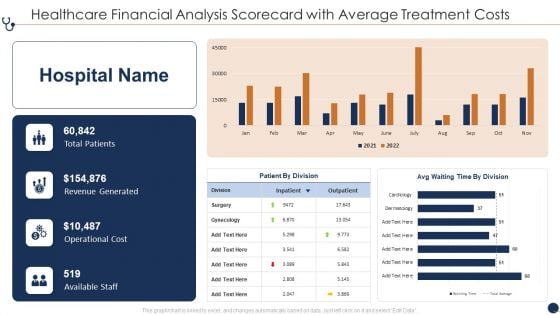
Healthcare Financial Analysis Scorecard With Average Treatment Costs Ppt Gallery Inspiration PDF
This graph or chart is linked to excel, and changes automatically based on data. Just left click on it and select Edit Data. Deliver and pitch your topic in the best possible manner with this Healthcare Financial Analysis Scorecard With Average Treatment Costs Ppt Gallery Inspiration PDF. Use them to share invaluable insights on Total Patients Revenue, Generated Operational Cost, Available Staff Outpatient and impress your audience. This template can be altered and modified as per your expectations. So, grab it now.
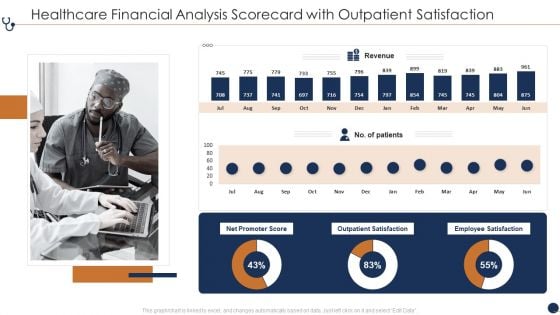
Healthcare Financial Analysis Scorecard With Outpatient Satisfaction Ppt Professional Background Image PDF
This graph or chart is linked to excel, and changes automatically based on data. Just left click on it and select Edit Data. Deliver and pitch your topic in the best possible manner with this Healthcare Financial Analysis Scorecard With Outpatient Satisfaction Ppt Professional Background Image PDF. Use them to share invaluable insights on Net Promoter Score, Outpatient Satisfaction Employee, Revenue Satisfaction Patients and impress your audience. This template can be altered and modified as per your expectations. So, grab it now.
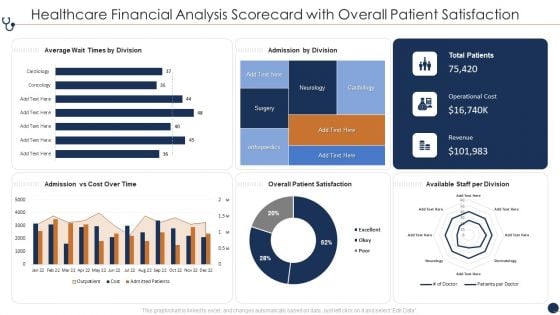
Healthcare Financial Analysis Scorecard With Overall Patient Satisfaction Ppt File Graphics PDF
This graph or chart is linked to excel, and changes automatically based on data. Just left click on it and select Edit Data. Deliver an awe inspiring pitch with this creative Healthcare Financial Analysis Scorecard With Overall Patient Satisfaction Ppt File Graphics PDF bundle. Topics like Average Wait Times, Admission By Division, Admission Vs Cost, Overall Patient Satisfaction can be discussed with this completely editable template. It is available for immediate download depending on the needs and requirements of the user.
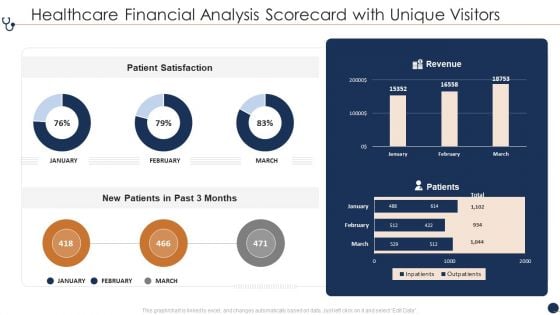
Healthcare Financial Analysis Scorecard With Unique Visitors Ppt File Visuals PDF
This graph or chart is linked to excel, and changes automatically based on data. Just left click on it and select Edit Data. Deliver an awe inspiring pitch with this creative Healthcare Financial Analysis Scorecard With Unique Visitors Ppt File Visuals PDF bundle. Topics like Patient Satisfaction Revenue, New Patients Past can be discussed with this completely editable template. It is available for immediate download depending on the needs and requirements of the user.
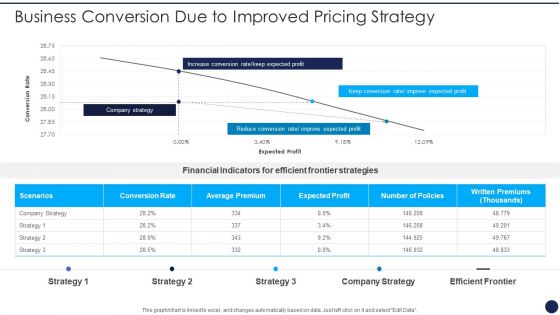
Product Pricing Strategies Analysis Business Conversion Due To Improved Pricing Strategy Slides PDF
This graph or chart is linked to excel, and changes automatically based on data. Just left click on it and select Edit Data. Deliver an awe inspiring pitch with this creative Product Pricing Strategies Analysis Business Conversion Due To Improved Pricing Strategy Slides PDF bundle. Topics like Increase Conversion Rate, Keep Expected Profit, Reduce Conversion Rate, Improve Expected Profit can be discussed with this completely editable template. It is available for immediate download depending on the needs and requirements of the user.
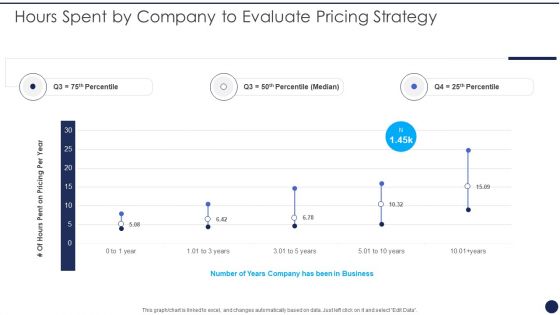
Product Pricing Strategies Analysis Hours Spent By Company To Evaluate Pricing Strategy Professional PDF
This graph or chart is linked to excel, and changes automatically based on data. Just left click on it and select Edit Data. Deliver an awe inspiring pitch with this creative Product Pricing Strategies Analysis Hours Spent By Company To Evaluate Pricing Strategy Professional PDF bundle. Topics like Pricing Per Year, Number Years Business can be discussed with this completely editable template. It is available for immediate download depending on the needs and requirements of the user.
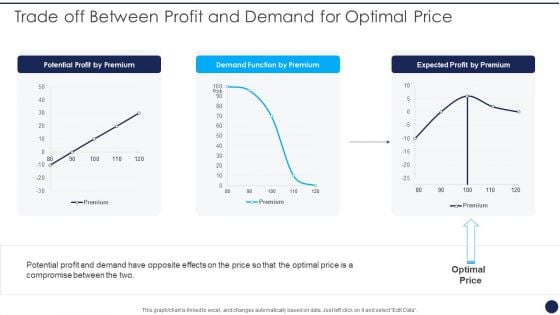
Product Pricing Strategies Analysis Trade Off Between Profit And Demand For Optimal Price Portrait PDF
This graph or chart is linked to excel, and changes automatically based on data. Just left click on it and select Edit Data. Deliver and pitch your topic in the best possible manner with this Product Pricing Strategies Analysis Trade Off Between Profit And Demand For Optimal Price Portrait PDF. Use them to share invaluable insights on Potential Profit Premium, Demand Function Premium and impress your audience. This template can be altered and modified as per your expectations. So, grab it now.
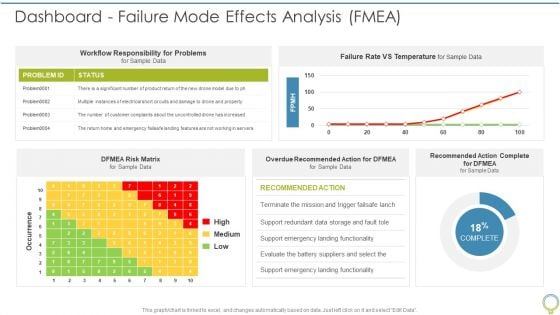
FMEA To Determine Potential Dashboard Failure Mode Effects Analysis FMEA Brochure PDF
This graph or chart is linked to excel, and changes automatically based on data. Just left click on it and select Edit Data. Deliver an awe inspiring pitch with this creative FMEA To Determine Potential Dashboard Failure Mode Effects Analysis FMEA Brochure PDF bundle. Topics like Workflow Responsibility, High Medium, Recommended Action can be discussed with this completely editable template. It is available for immediate download depending on the needs and requirements of the user.
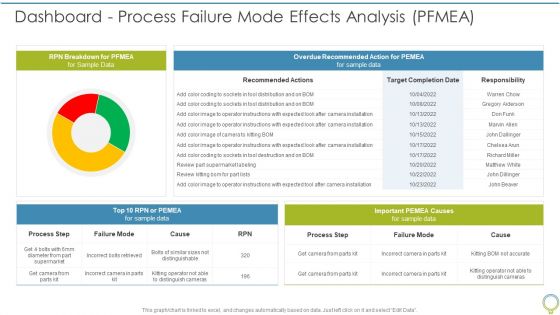
FMEA To Determine Potential Dashboard Process Failure Mode Effects Analysis PFMEA Elements PDF
This graph or chart is linked to excel, and changes automatically based on data. Just left click on it and select Edit Data. Deliver and pitch your topic in the best possible manner with this FMEA To Determine Potential Dashboard Process Failure Mode Effects Analysis PFMEA Elements PDF. Use them to share invaluable insights on RPN Breakdown, Overdue Recommended, Process Step and impress your audience. This template can be altered and modified as per your expectations. So, grab it now.
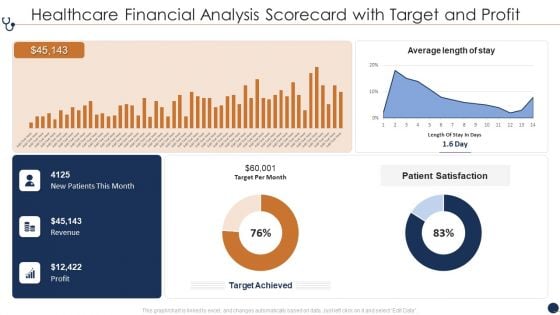
Healthcare Financial Analysis Scorecard With Target And Profit Ppt Gallery Example File PDF
This graph or chart is linked to excel, and changes automatically based on data. Just left click on it and select Edit Data. Deliver an awe inspiring pitch with this creative Avg Nurse Patient, Revenue And Expenses, Avg Treatment Costs bundle. Topics like Average Length Stay, Patient Satisfaction Target, Target Per Month can be discussed with this completely editable template. It is available for immediate download depending on the needs and requirements of the user.
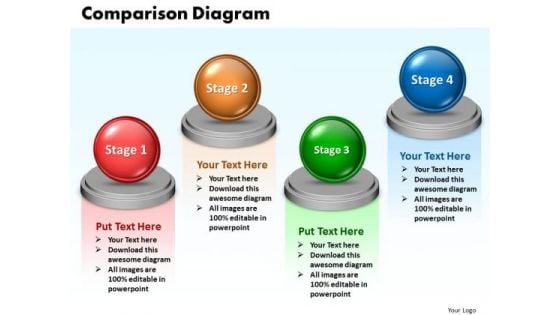
Ppt Comparison Network Diagram PowerPoint Template 4 Phase Templates
PPT comparison network diagram powerpoint template 4 phase Templates-This PowerPoint diagram slide shows four opposing views. You can use the This PowerPoint diagram slide to represent views from different functions on an issue.-PPT comparison network diagram powerpoint template 4 phase Templates-Abstract, Achievement, Business, Chart, Comparison, Concepts, Data, Descriptive, Design, Development, Diagram, Element, Figure, Finance, Financial, Graph, Graphic, Growth, Icon, Ideas, Improvement, Investment, Market, Money, Progress, Raise, Real, Report, Revenue, Sale, Shape, Sign, Silhouette, Stock, Success, Symbol, Technology Reveal the depth of your knowledge. Showcase your erudition on our Ppt Comparison Network Diagram PowerPoint Template 4 Phase Templates.
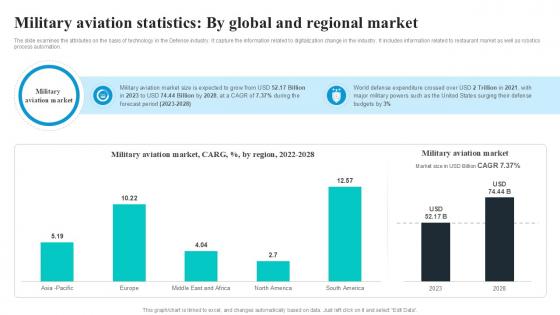
Military Aviation Statistics By Global Security Industry PPT PowerPoint IR SS V
The slide examines the attributes on the basis of technology in the Defense industry. It capture the information related to digitalization change in the industry. It includes information related to restaurant market as well as robotics process automation. Welcome to our selection of the Military Aviation Statistics By Global Security Industry PPT PowerPoint IR SS V. These are designed to help you showcase your creativity and bring your sphere to life. Planning and Innovation are essential for any business that is just starting out. This collection contains the designs that you need for your everyday presentations. All of our PowerPoints are 100Percent editable, so you can customize them to suit your needs. This multi-purpose template can be used in various situations. Grab these presentation templates today. The slide examines the attributes on the basis of technology in the Defense industry. It capture the information related to digitalization change in the industry. It includes information related to restaurant market as well as robotics process automation.
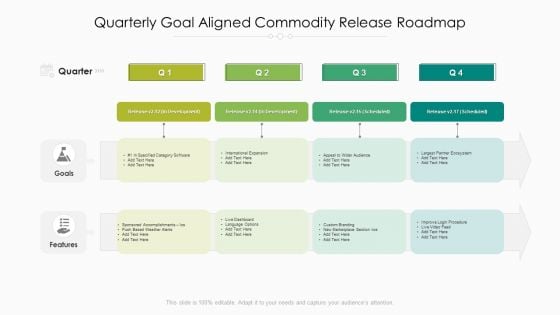
Quarterly Goal Aligned Commodity Release Roadmap Portrait
Introducing our quarterly goal aligned commodity release roadmap portrait. This PPT presentation is Google Slides compatible, therefore, you can share it easily with the collaborators for measuring the progress. Also, the presentation is available in both standard screen and widescreen aspect ratios. So edit the template design by modifying the font size, font type, color, and shapes as per your requirements. As this PPT design is fully editable it can be presented in PDF, JPG and PNG formats.
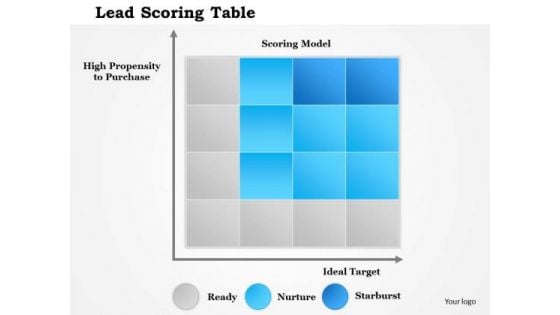
Business Framework Lead Scoring Table PowerPoint Presentation
A graph style cubical chart has been used to decorate this power point template slide. This PPT slide contains the concept of explaining score. Use this score table for displaying any data.

Business Diagram Business Diagram 3d Bulb With Stair Design For Idea Generation Presentation Templat
This business diagram has been designed with graphic of light bulb and stairs and icons. These stairs contains various business icons. This professional slide depicts innovative business ideas. Use this PPT slide for your business presentations.
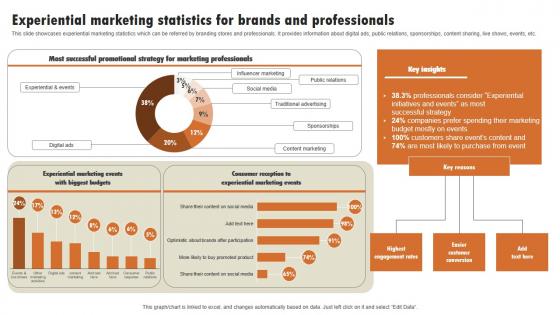
Experiential Marketing Statistics For Brands And Experiential Marketing Technique Designs PDF
This slide showcases experiential marketing statistics which can be referred by branding stores and professionals. It provides information about digital ads, public relations, sponsorships, content sharing, live shows, events, etc. Explore a selection of the finest Experiential Marketing Statistics For Brands And Experiential Marketing Technique Designs PDF here. With a plethora of professionally designed and pre-made slide templates, you can quickly and easily find the right one for your upcoming presentation. You can use our Experiential Marketing Statistics For Brands And Experiential Marketing Technique Designs PDF to effectively convey your message to a wider audience. Slidegeeks has done a lot of research before preparing these presentation templates. The content can be personalized and the slides are highly editable. Grab templates today from Slidegeeks. This slide showcases experiential marketing statistics which can be referred by branding stores and professionals. It provides information about digital ads, public relations, sponsorships, content sharing, live shows, events, etc.
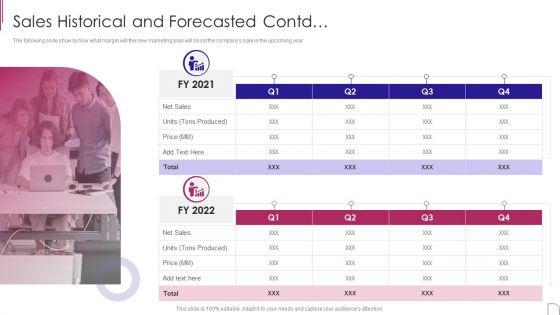
Yearly Product Performance Assessment Repor Sales Historical And Forecasted Contd Information PDF
The following slide show by how what margin will the new marketing plan will boost the companys sale in the upcoming year.Deliver an awe inspiring pitch with this creative Yearly Product Performance Assessment Repor Sales Historical And Forecasted Contd Information PDF bundle. Topics like Historical Data, Forecasted Data, Tons Produced can be discussed with this completely editable template. It is available for immediate download depending on the needs and requirements of the user.
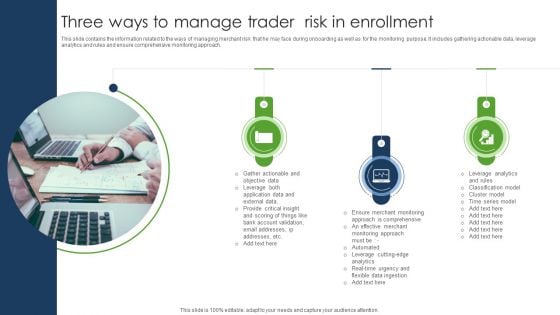
Three Ways To Manage Trader Risk In Enrollment Summary PDF
This slide contains the information related to the ways of managing merchant risk that he may face during onboarding as well as for the monitoring purpose. It includes gathering actionable data, leverage analytics and rules and ensure comprehensive monitoring approach. Presenting Three Ways To Manage Trader Risk In Enrollment Summary PDF to dispense important information. This template comprises three stages. It also presents valuable insights into the topics including Leverage Analytics, Application Data, External Data. This is a completely customizable PowerPoint theme that can be put to use immediately. So, download it and address the topic impactfully.
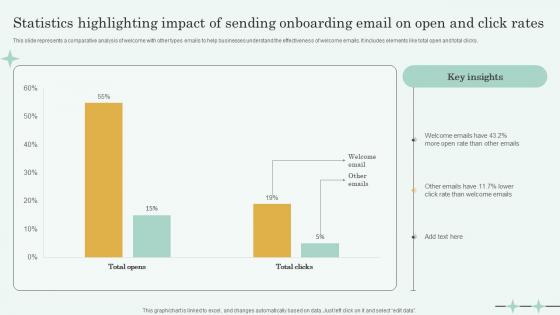
Statistics Highlighting Impact Of Sending Onboarding Email On Open And Click Rates Sample Pdf
This slide represents a comparative analysis of welcome with other types emails to help businesses understand the effectiveness of welcome emails. It includes elements like total open and total clicks. Pitch your topic with ease and precision using this Statistics Highlighting Impact Of Sending Onboarding Email On Open And Click Rates Sample Pdf. This layout presents information on Welcome Emails, Open Rate, Sending Onboarding Email. It is also available for immediate download and adjustment. So, changes can be made in the color, design, graphics or any other component to create a unique layout. This slide represents a comparative analysis of welcome with other types emails to help businesses understand the effectiveness of welcome emails. It includes elements like total open and total clicks.
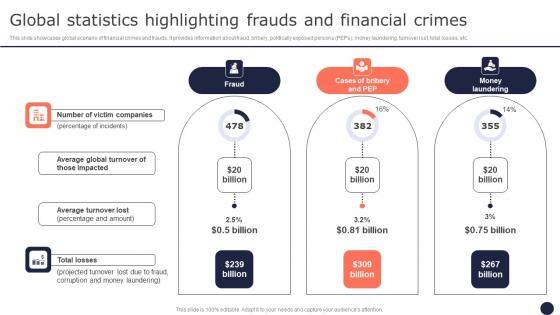
Global Statistics Highlighting Frauds And Financial Mitigating Corporate Scams And Robberies Clipart Pdf
This slide showcases global scenario of financial crimes and frauds. It provides information about fraud, bribery, politically exposed persons PEPs, money laundering, turnover lost, total losses, etc. Are you in need of a template that can accommodate all of your creative concepts This one is crafted professionally and can be altered to fit any style. Use it with Google Slides or PowerPoint. Include striking photographs, symbols, depictions, and other visuals. Fill, move around, or remove text boxes as desired. Test out color palettes and font mixtures. Edit and save your work, or work with colleagues. Download Global Statistics Highlighting Frauds And Financial Mitigating Corporate Scams And Robberies Clipart Pdf and observe how to make your presentation outstanding. Give an impeccable presentation to your group and make your presentation unforgettable. This slide showcases global scenario of financial crimes and frauds. It provides information about fraud, bribery, politically exposed persons PEPs, money laundering, turnover lost, total losses, etc.
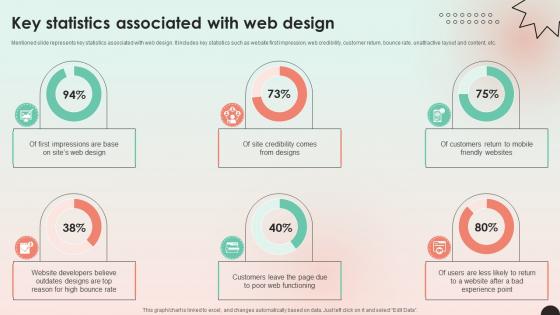
Web Consulting Business Performance Key Statistics Associated With Web Design
Mentioned slide represents key statistics associated with web design. It includes key statistics such as website first impression, web credibility, customer return, bounce rate, unattractive layout and content, etc. Do you have an important presentation coming up Are you looking for something that will make your presentation stand out from the rest Look no further than Web Consulting Business Performance Key Statistics Associated With Web Design. With our professional designs, you can trust that your presentation will pop and make delivering it a smooth process. And with Slidegeeks, you can trust that your presentation will be unique and memorable. So why wait Grab Web Consulting Business Performance Key Statistics Associated With Web Design today and make your presentation stand out from the rest Mentioned slide represents key statistics associated with web design. It includes key statistics such as website first impression, web credibility, customer return, bounce rate, unattractive layout and content, etc.
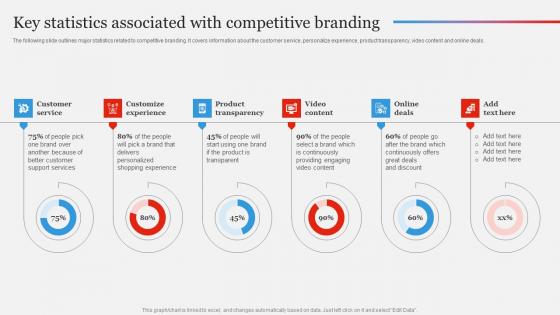
Key Statistics Associated Branding Strategy To Gain Competitive Edge Elements Pdf
The following slide outlines major statistics related to competitive branding. It covers information about the customer service, personalize experience, product transparency, video content and online deals. Coming up with a presentation necessitates that the majority of the effort goes into the content and the message you intend to convey. The visuals of a PowerPoint presentation can only be effective if it supplements and supports the story that is being told. Keeping this in mind our experts created Key Statistics Associated Branding Strategy To Gain Competitive Edge Elements Pdf to reduce the time that goes into designing the presentation. This way, you can concentrate on the message while our designers take care of providing you with the right template for the situation. The following slide outlines major statistics related to competitive branding. It covers information about the customer service, personalize experience, product transparency, video content and online deals.
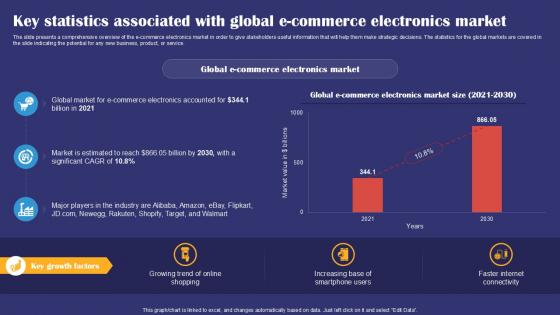
Key Statistics Associated With Global E Commerce Smartphones Industry Report PPT Presentation IR SS V
The slide presents a comprehensive overview of the e commerce electronics market in order to give stakeholders useful information that will help them make strategic decisions. The statistics for the global markets are covered in the slide indicating the potential for any new business, product, or service. If you are looking for a format to display your unique thoughts, then the professionally designed Key Statistics Associated With Global E Commerce Smartphones Industry Report PPT Presentation IR SS V is the one for you. You can use it as a Google Slides template or a PowerPoint template. Incorporate impressive visuals, symbols, images, and other charts. Modify or reorganize the text boxes as you desire. Experiment with shade schemes and font pairings. Alter, share or cooperate with other people on your work. Download Key Statistics Associated With Global E Commerce Smartphones Industry Report PPT Presentation IR SS V and find out how to give a successful presentation. Present a perfect display to your team and make your presentation unforgettable. The slide presents a comprehensive overview of the e commerce electronics market in order to give stakeholders useful information that will help them make strategic decisions. The statistics for the global markets are covered in the slide indicating the potential for any new business, product, or service.
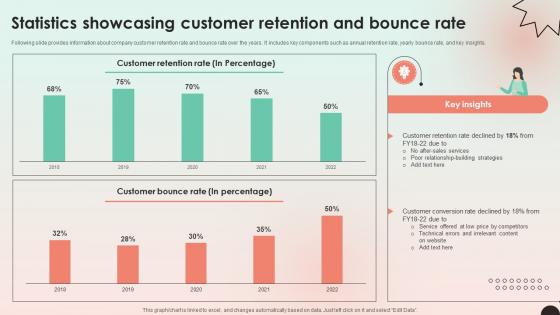
Web Consulting Business Performance Statistics Showcasing Customer Retention
Following slide provides information about company customer retention rate and bounce rate over the years. It includes key components such as annual retention rate, yearly bounce rate, and key insights. Find highly impressive Web Consulting Business Performance Statistics Showcasing Customer Retention on Slidegeeks to deliver a meaningful presentation. You can save an ample amount of time using these presentation templates. No need to worry to prepare everything from scratch because Slidegeeks experts have already done a huge research and work for you. You need to download Web Consulting Business Performance Statistics Showcasing Customer Retention for your upcoming presentation. All the presentation templates are 100 percent editable and you can change the color and personalize the content accordingly. Download now Following slide provides information about company customer retention rate and bounce rate over the years. It includes key components such as annual retention rate, yearly bounce rate, and key insights.
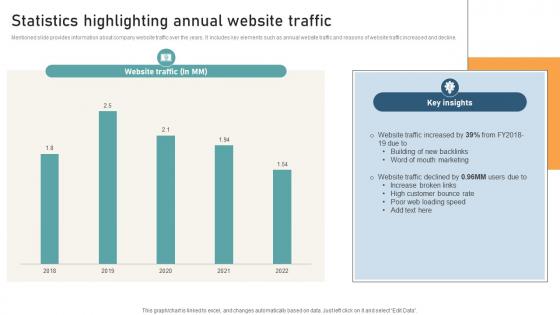
Comprehensive Guide For Website Statistics Highlighting Annual Website Traffic
Mentioned slide provides information about company website traffic over the years. It includes key elements such as annual website traffic and reasons of website traffic increased and decline. Find highly impressive Comprehensive Guide For Website Statistics Highlighting Annual Website Traffic on Slidegeeks to deliver a meaningful presentation. You can save an ample amount of time using these presentation templates. No need to worry to prepare everything from scratch because Slidegeeks experts have already done a huge research and work for you. You need to download Comprehensive Guide For Website Statistics Highlighting Annual Website Traffic for your upcoming presentation. All the presentation templates are 100 percent editable and you can change the color and personalize the content accordingly. Download now Mentioned slide provides information about company website traffic over the years. It includes key elements such as annual website traffic and reasons of website traffic increased and decline.
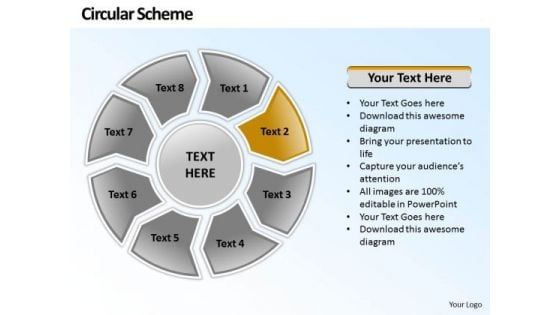
Ppt Circular PowerPoint Menu Template Scheme 8 Phase Diagram Templates
PPT circular powerpoint menu template scheme 8 phase diagram Templates-Use this graphical approach to represent global business issues such as financial data, stock market Exchange, increase in sales, corporate presentations and more. It illustrates the second stage of the process.-PPT circular powerpoint menu template scheme 8 phase diagram Templates-Arrow, Art, Blue, Business, Button, Circular, Clip, Design, Diagram, Drop, Element, Glowing, Graph, Graphic, Icon, Illustration, Isolated, Process, Round, Set, Shadow, Sphere, Symbol Our Ppt Circular PowerPoint Menu Template Scheme 8 Phase Diagram Templates provide a common thread. Stitch all different factions together.
Brand Tracking Info Graphics Ppt PowerPoint Presentation Infographic Template Graphics Download
This is a brand tracking info graphics ppt powerpoint presentation infographic template graphics download. This is a four stage process. The stages in this process are business, marketing, finance, strategy, icons.

Business Framework Shed Light On Topic Flashlight PowerPoint Presentation
This Power Point template slide has been designed with graphic of torch. This flash light has been used to display the concept of highlighting the any business data. Use this business slide for your technical presentation.
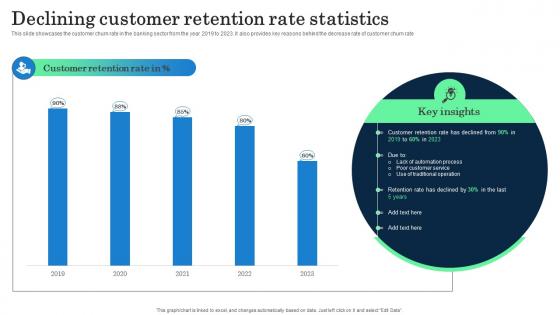
Declining Customer Retention Rate Statistics Incorporating Banking Operational Growth
This slide showcases the customer churn rate in the banking sector from the year 2019 to 2023. it also provides key reasons behind the decrease rate of customer churn rate. Are you in need of a template that can accommodate all of your creative concepts This one is crafted professionally and can be altered to fit any style. Use it with Google Slides or PowerPoint. Include striking photographs, symbols, depictions, and other visuals. Fill, move around, or remove text boxes as desired. Test out color palettes and font mixtures. Edit and save your work, or work with colleagues. Download Declining Customer Retention Rate Statistics Incorporating Banking Operational Growth and observe how to make your presentation outstanding. Give an impeccable presentation to your group and make your presentation unforgettable. This slide showcases the customer churn rate in the banking sector from the year 2019 to 2023. it also provides key reasons behind the decrease rate of customer churn rate
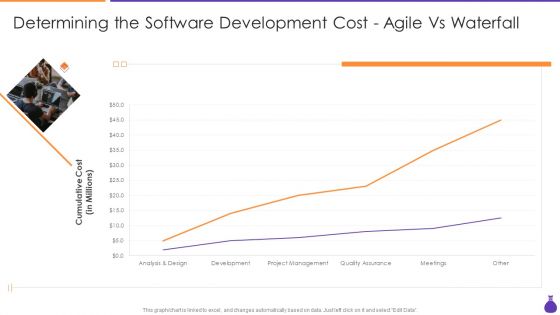
Why Is Agile Cost Effective IT Determining The Software Development Cost Agile Demonstration PDF
This graph or chart is linked to excel, and changes automatically based on data. Just left click on it and select Edit Data. Deliver and pitch your topic in the best possible manner with this Why Is Agile Cost Effective IT Determining The Software Development Cost Agile Demonstration PDF. Use them to share invaluable insights on Analysis And Design, Development, Project Management, Quality Assurance and impress your audience. This template can be altered and modified as per your expectations. So, grab it now.
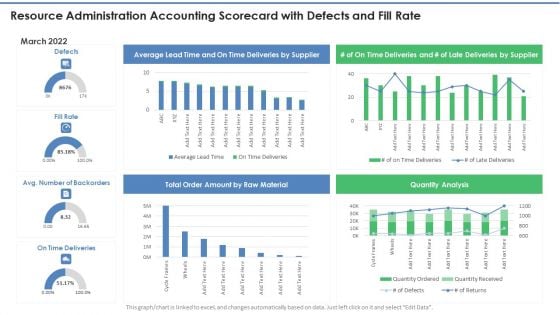
Resource Administration Accounting Scorecard With Defects And Fill Rate Mockup PDF
This graph or chart is linked to excel, and changes automatically based on data. Just left click on it and select Edit Data. Deliver and pitch your topic in the best possible manner with this Resource Administration Accounting Scorecard With Defects And Fill Rate Mockup PDF. Use them to share invaluable insights on Total Order Amount, Raw Material, Quantity Analysis and impress your audience. This template can be altered and modified as per your expectations. So, grab it now.
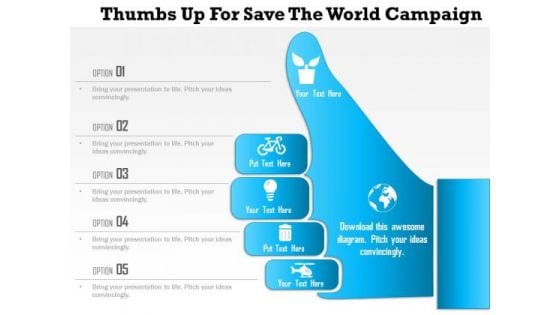
Business Diagram Thumbs Up For Save The World Campaign Presentation Template
This Power Point diagram has been crafted with graphic of text boxes with icons. It contains diagram of thumb up hand graphics with communication icons. Use this diagram to build professional presentation for your viewers.
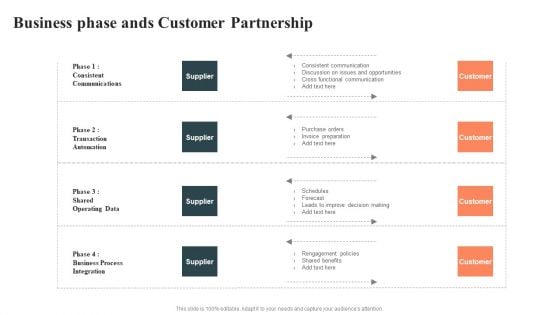
Business Phase Ands Customer Partnership Formats PDF
Pitch your topic with ease and precision using this Business Phase Ands Customer Partnership Formats PDF. This layout presents information on Supplier, Cross Functional Communication, Operating Data. It is also available for immediate download and adjustment. So, changes can be made in the color, design, graphics or any other component to create a unique layout.
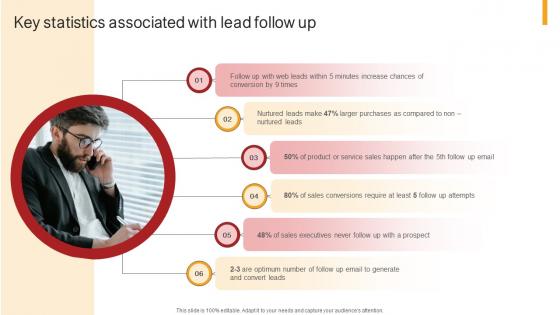
Remote Sales Plan For Lead Key Statistics Associated With Lead Follow Up Strategy SS V
Retrieve professionally designed Remote Sales Plan For Lead Key Statistics Associated With Lead Follow Up Strategy SS V to effectively convey your message and captivate your listeners. Save time by selecting pre-made slideshows that are appropriate for various topics, from business to educational purposes. These themes come in many different styles, from creative to corporate, and all of them are easily adjustable and can be edited quickly. Access them as PowerPoint templates or as Google Slides themes. You do not have to go on a hunt for the perfect presentation because Slidegeeks got you covered from everywhere. Our Remote Sales Plan For Lead Key Statistics Associated With Lead Follow Up Strategy SS V are topically designed to provide an attractive backdrop to any subject. Use them to look like a presentation pro.
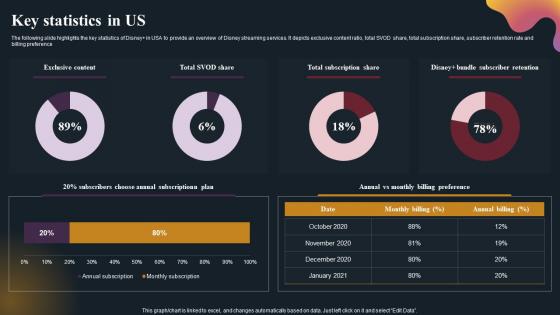
Key Statistics In Us OTT Platform Company Outline Brochure Pdf
The following slide highlights the key statistics of DisneyPlus in USA to provide an overview of Disney streaming services. It depicts exclusive content ratio, total SVOD share, total subscription share, subscriber retention rate and billing preference. Crafting an eye-catching presentation has never been more straightforward. Let your presentation shine with this tasteful yet straightforward Key Statistics In Us OTT Platform Company Outline Brochure Pdf template. It offers a minimalistic and classy look that is great for making a statement. The colors have been employed intelligently to add a bit of playfulness while still remaining professional. Construct the ideal Key Statistics In Us OTT Platform Company Outline Brochure Pdf that effortlessly grabs the attention of your audience Begin now and be certain to wow your customers The following slide highlights the key statistics of DisneyPlus in USA to provide an overview of Disney streaming services. It depicts exclusive content ratio, total SVOD share, total subscription share, subscriber retention rate and billing preference
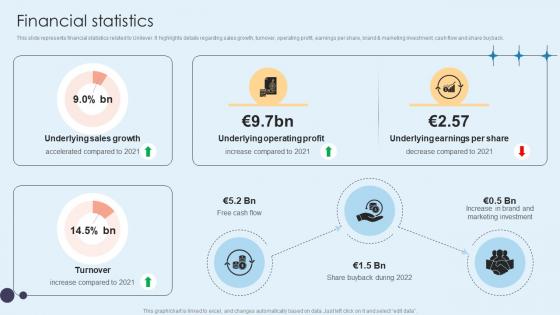
Financial Statistics Home Care Solutions Company Profile CP SS V
This slide represents financial statistics related to Unilever. It highlights details regarding sales growth, turnover, operating profit, earnings per share, brand and marketing investment, cash flow and share buyback.Formulating a presentation can take up a lot of effort and time, so the content and message should always be the primary focus. The visuals of the PowerPoint can enhance the presenters message, so our Financial Statistics Home Care Solutions Company Profile CP SS V was created to help save time. Instead of worrying about the design, the presenter can concentrate on the message while our designers work on creating the ideal templates for whatever situation is needed. Slidegeeks has experts for everything from amazing designs to valuable content, we have put everything into Financial Statistics Home Care Solutions Company Profile CP SS V. This slide represents financial statistics related to Unilever. It highlights details regarding sales growth, turnover, operating profit, earnings per share, brand and marketing investment, cash flow and share buyback.
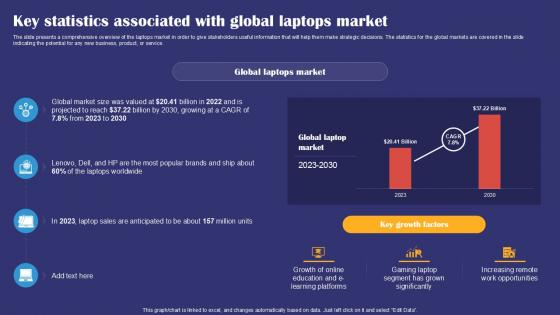
Key Statistics Associated With Global Laptops Market Smartphones Industry Report PPT Template IR SS V
The slide presents a comprehensive overview of the laptops market in order to give stakeholders useful information that will help them make strategic decisions. The statistics for the global markets are covered in the slide indicating the potential for any new business, product, or service. Are you in need of a template that can accommodate all of your creative concepts This one is crafted professionally and can be altered to fit any style. Use it with Google Slides or PowerPoint. Include striking photographs, symbols, depictions, and other visuals. Fill, move around, or remove text boxes as desired. Test out color palettes and font mixtures. Edit and save your work, or work with colleagues. Download Key Statistics Associated With Global Laptops Market Smartphones Industry Report PPT Template IR SS V and observe how to make your presentation outstanding. Give an impeccable presentation to your group and make your presentation unforgettable. The slide presents a comprehensive overview of the laptops market in order to give stakeholders useful information that will help them make strategic decisions. The statistics for the global markets are covered in the slide indicating the potential for any new business, product, or service.
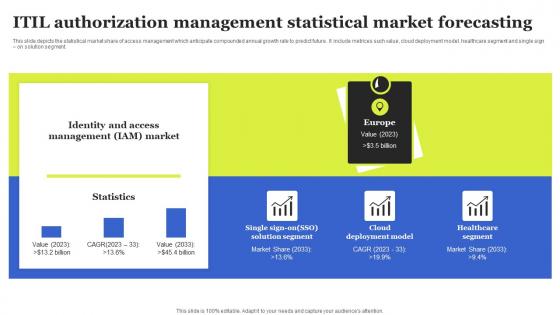
ITIL Authorization Management Statistical Market Forecasting Diagrams Pdf
This slide depicts the statistical market share of access management which anticipate compounded annual growth rate to predict future. It include metrices such value, cloud deployment model, healthcare segment and single sign on solution segment. Pitch your topic with ease and precision using this ITIL Authorization Management Statistical Market Forecasting Diagrams Pdf This layout presents information on Statistics, Cloud Deployment Model, Healthcare Segment It is also available for immediate download and adjustment. So, changes can be made in the color, design, graphics or any other component to create a unique layout. This slide depicts the statistical market share of access management which anticipate compounded annual growth rate to predict future. It include metrices such value, cloud deployment model, healthcare segment and single sign on solution segment.
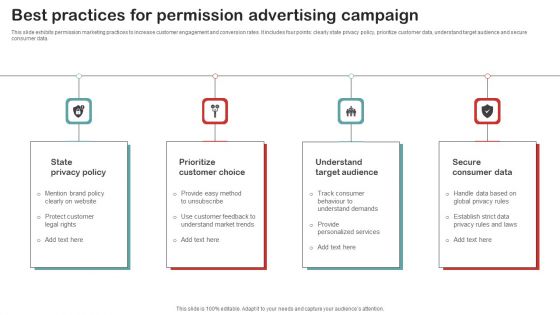
Best Practices For Permission Advertising Campaign Mockup PDF
This slide exhibits permission marketing practices to increase customer engagement and conversion rates. It includes four points clearly state privacy policy, prioritize customer data, understand target audience and secure consumer data. Presenting Best Practices For Permission Advertising Campaign Mockup PDF to dispense important information. This template comprises four stages. It also presents valuable insights into the topics including Understand Target Audience, Secure Consumer Data, Prioritize Customer Choice. This is a completely customizable PowerPoint theme that can be put to use immediately. So, download it and address the topic impactfully.
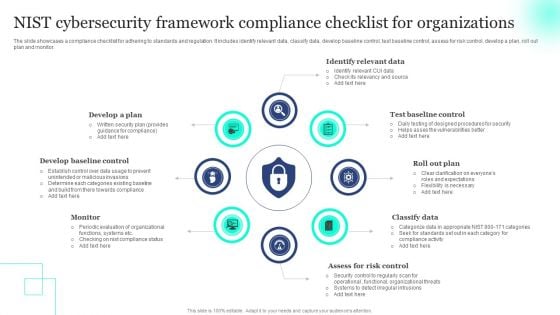
NIST Cybersecurity Framework Compliance Checklist For Organizations Inspiration PDF
The slide showcases a compliance checklist for adhering to standards and regulation. It includes identify relevant data, classify data, develop baseline control, test baseline control, assess for risk control, develop a plan, roll out plan and monitor. Presenting NIST Cybersecurity Framework Compliance Checklist For Organizations Inspiration PDF to dispense important information. This template comprises eight stages. It also presents valuable insights into the topics including Develop Baseline Control, Monitor, Classify Data. This is a completely customizable PowerPoint theme that can be put to use immediately. So, download it and address the topic impactfully.

Bar Graph Showing Revenues Generated By Sales Department Ppt Portfolio Graphics Example PDF
This graph or chart is linked to excel, and changes automatically based on data. Just left click on it and select edit data. Showcasing this set of slides titled bar graph showing revenues generated by sales department ppt portfolio graphics example pdf. The topics addressed in these templates are yearly sales revenues, sales team, profits. All the content presented in this PPT design is completely editable. Download it and make adjustments in color, background, font etc. as per your unique business setting.
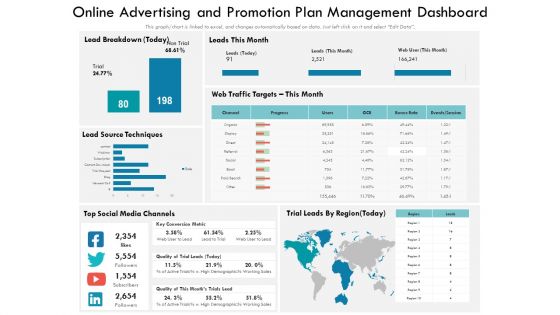
Online Advertising And Promotion Plan Management Dashboard Ppt PowerPoint Presentation Show Tips PDF
This graph chart is linked to excel, and changes automatically based on data. Just left click on it and select Edit Data. Showcasing this set of slides titled online advertising and promotion plan management dashboard ppt powerpoint presentation show tips pdf. The topics addressed in these templates are source techniques, social media channels, traffic targets. All the content presented in this PPT design is completely editable. Download it and make adjustments in color, background, font etc. as per your unique business setting.
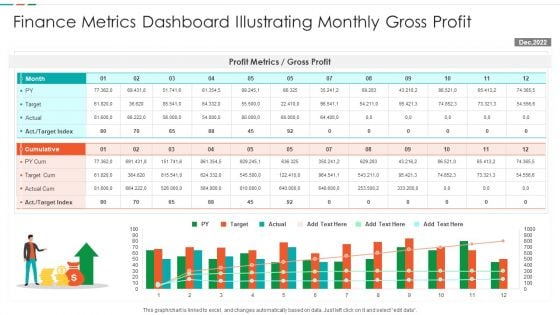
Finance Metrics Dashboard Illustrating Monthly Gross Profit Formats PDF
This graph or chart is linked to excel, and changes automatically based on data. Just left click on it and select edit data. Showcasing this set of slides titled Finance Metrics Dashboard Illustrating Monthly Gross Profit Formats PDF. The topics addressed in these templates are Profit Metrics Gross, Profit Target Cum, Actual Cum Target. All the content presented in this PPT design is completely editable. Download it and make adjustments in color, background, font etc. as per your unique business setting.
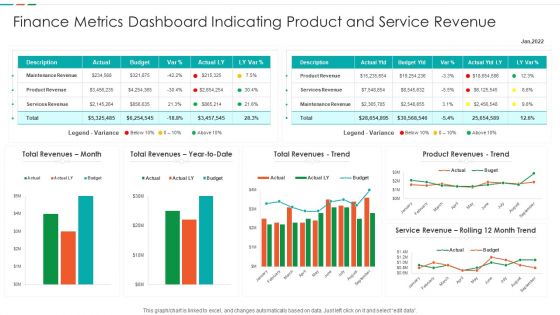
Finance Metrics Dashboard Indicating Product And Service Revenue Designs PDF
This graph or chart is linked to excel, and changes automatically based on data. Just left click on it and select edit data. Showcasing this set of slides titled Finance Metrics Dashboard Indicating Product And Service Revenue Designs PDF. The topics addressed in these templates are Maintenance Revenue Product, Revenue Product Revenues, Service Revenue Rolling. All the content presented in this PPT design is completely editable. Download it and make adjustments in color, background, font etc. as per your unique business setting.
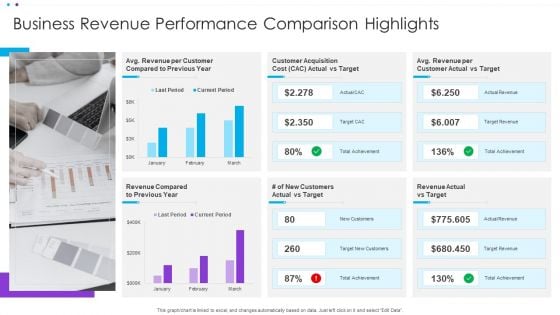
Business Revenue Performance Comparison Highlights Ppt Summary Rules PDF
This graph or chart is linked to excel, and changes automatically based on data. Just left click on it and select Edit Data. Showcasing this set of slides titled Business Revenue Performance Comparison Highlights Ppt Summary Rules PDF. The topics addressed in these templates are Customer Acquisition, Customer Actual, Revenue Compared. All the content presented in this PPT design is completely editable. Download it and make adjustments in color, background, font etc. as per your unique business setting.
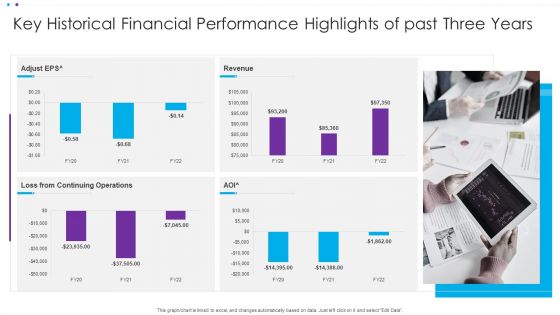
Key Historical Financial Performance Highlights Of Past Three Years Ppt Ideas Background PDF
This graph or chart is linked to excel, and changes automatically based on data. Just left click on it and select Edit Data. Showcasing this set of slides titled Key Historical Financial Performance Highlights Of Past Three Years Ppt Ideas Background PDF. The topics addressed in these templates are Continuing Operations, Adjust EP. All the content presented in this PPT design is completely editable. Download it and make adjustments in color, background, font etc. as per your unique business setting.
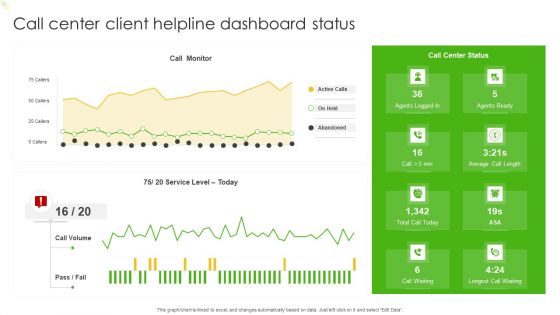
Call Center Client Helpline Dashboard Status Ppt Show Graphics Design PDF
This graph or chart is linked to excel, and changes automatically based on data. Just left click on it and select Edit Data. Showcasing this set of slides titled Call Center Client Helpline Dashboard Status Ppt Show Graphics Design PDF. The topics addressed in these templates are Call Monitor, Active Calls, Abandoned, Agents Ready. All the content presented in this PPT design is completely editable. Download it and make adjustments in color, background, font etc. as per your unique business setting.
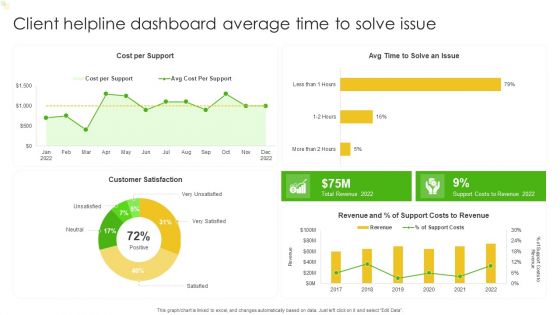
Client Helpline Dashboard Average Time To Solve Issue Ppt Portfolio Visuals PDF
This graph or chart is linked to excel, and changes automatically based on data. Just left click on it and select Edit Data. Showcasing this set of slides titled Client Helpline Dashboard Average Time To Solve Issue Ppt Portfolio Visuals PDF. The topics addressed in these templates are Cost Per Support, Customer Satisfaction, Costs To Revenue. All the content presented in this PPT design is completely editable. Download it and make adjustments in color, background, font etc. as per your unique business setting.
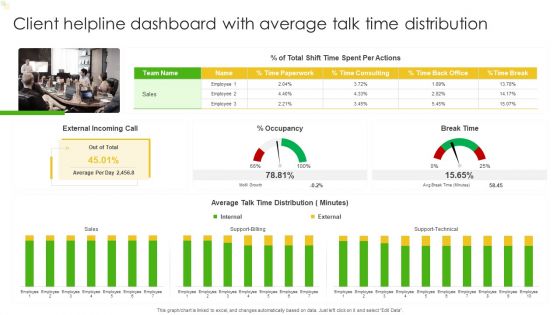
Client Helpline Dashboard With Average Talk Time Distribution Ppt Gallery Backgrounds PDF
This graph or chart is linked to excel, and changes automatically based on data. Just left click on it and select Edit Data. Showcasing this set of slides titled Client Helpline Dashboard With Average Talk Time Distribution Ppt Gallery Backgrounds PDF. The topics addressed in these templates are External Incoming Call, Occupancy, Break Time, Sales. All the content presented in this PPT design is completely editable. Download it and make adjustments in color, background, font etc. as per your unique business setting.
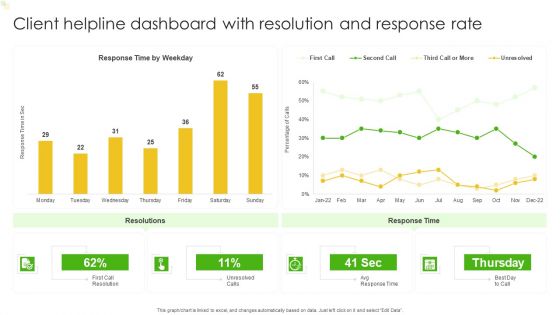
Client Helpline Dashboard With Resolution And Response Rate Ppt File Example Topics PDF
This graph or chart is linked to excel, and changes automatically based on data. Just left click on it and select Edit Data. Showcasing this set of slides titled Client Helpline Dashboard With Resolution And Response Rate Ppt File Example Topics PDF. The topics addressed in these templates are Resolutions, Response Time, Response Time Weekday. All the content presented in this PPT design is completely editable. Download it and make adjustments in color, background, font etc. as per your unique business setting.
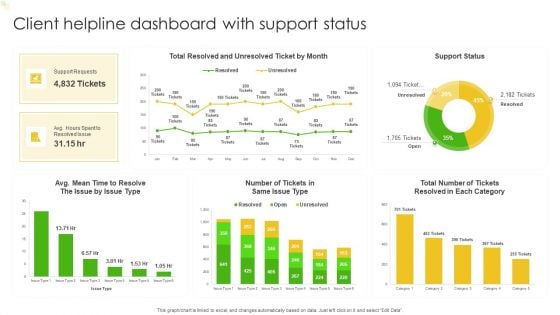
Client Helpline Dashboard With Support Status Ppt Portfolio Rules PDF
This graph or chart is linked to excel, and changes automatically based on data. Just left click on it and select Edit Data. Showcasing this set of slides titled Client Helpline Dashboard With Support Status Ppt Portfolio Rules PDF. The topics addressed in these templates are Total Number, Support Requests, Total Resolved, Support Status. All the content presented in this PPT design is completely editable. Download it and make adjustments in color, background, font etc. as per your unique business setting.
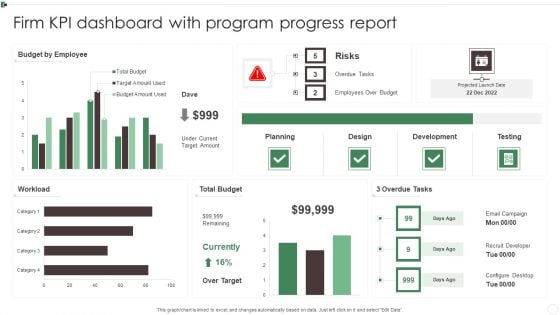
Firm KPI Dashboard With Program Progress Report Ppt Pictures Deck PDF
This graph or chart is linked to excel, and changes automatically based on data. Just left click on it and select Edit Data. Showcasing this set of slides titled Firm KPI Dashboard With Program Progress Report Ppt Pictures Deck PDF. The topics addressed in these templates are Budget By Employee, Total Budget, 3 Overdue Tasks, Workload. All the content presented in this PPT design is completely editable. Download it and make adjustments in color, background, font etc. as per your unique business setting.
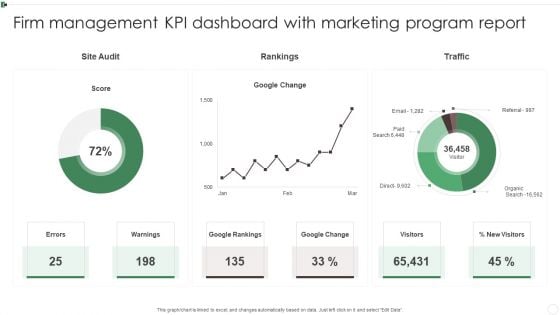
Firm Management KPI Dashboard With Marketing Program Report Ppt Styles Introduction PDF
This graph or chart is linked to excel, and changes automatically based on data. Just left click on it and select Edit Data. Showcasing this set of slides titled Firm Management KPI Dashboard With Marketing Program Report Ppt Styles Introduction PDF. The topics addressed in these templates are Google Rankings, Google Change, Warnings, Visitors. All the content presented in this PPT design is completely editable. Download it and make adjustments in color, background, font etc. as per your unique business setting.
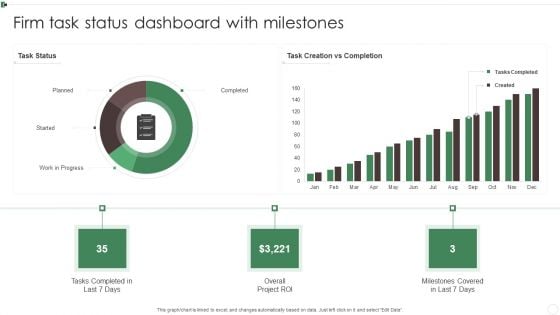
Firm Task Status Dashboard With Milestones Ppt Show Sample PDF
This graph or chart is linked to excel, and changes automatically based on data. Just left click on it and select Edit Data. Showcasing this set of slides titled Firm Task Status Dashboard With Milestones Ppt Show Sample PDF. The topics addressed in these templates are Tasks Completed, Planned, Work Progress, Overall Project ROI. All the content presented in this PPT design is completely editable. Download it and make adjustments in color, background, font etc. as per your unique business setting.
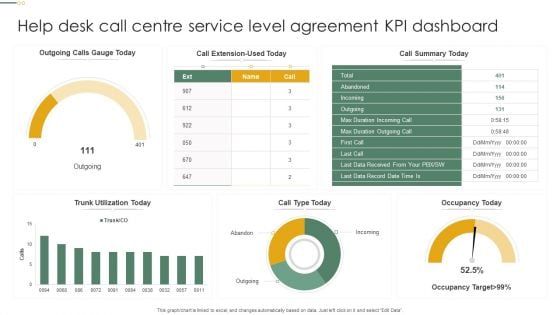
Help Desk Call Centre Service Level Agreement KPI Dashboard Pictures PDF
This graph or chart is linked to excel, and changes automatically based on data. Just left click on it and select Edit Data. Showcasing this set of slides titled Help Desk Call Centre Service Level Agreement KPI Dashboard Pictures PDF. The topics addressed in these templates are Call Type Today, Occupancy Today, Call Summary Today. All the content presented in this PPT design is completely editable. Download it and make adjustments in color, background, font etc. as per your unique business setting.
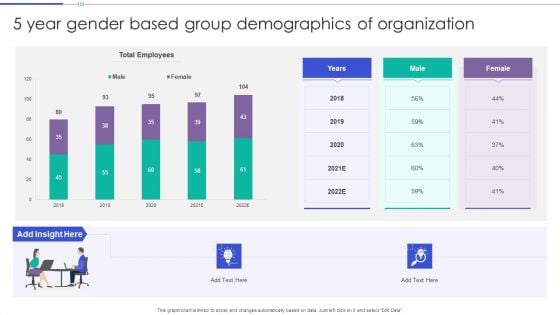
5 Year Gender Based Group Demographics Of Organization Background PDF
This graph or chart is linked to excel, and changes automatically based on data. Just left click on it and select Edit Data. Showcasing this set of slides titled 5 Year Gender Based Group Demographics Of Organization Background PDF. The topics addressed in these templates are Total Employees, Male, Female. All the content presented in this PPT design is completely editable. Download it and make adjustments in color, background, font etc. as per your unique business setting.
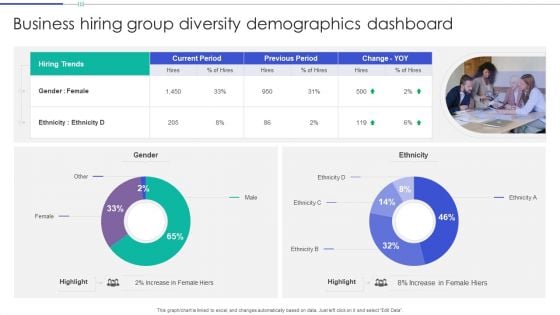
Business Hiring Group Diversity Demographics Dashboard Guidelines PDF
This graph or chart is linked to excel, and changes automatically based on data. Just left click on it and select Edit Data. Showcasing this set of slides titled Business Hiring Group Diversity Demographics Dashboard Guidelines PDF. The topics addressed in these templates are Hiring Trends, Current Period, Previous Period. All the content presented in this PPT design is completely editable. Download it and make adjustments in color, background, font etc. as per your unique business setting.
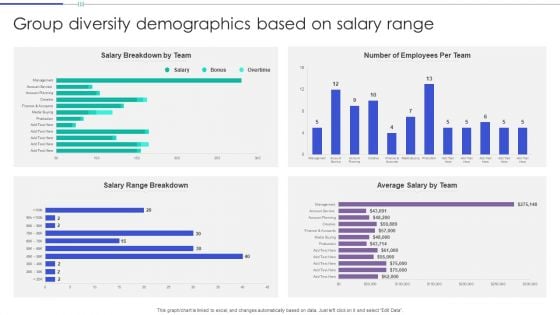
Group Diversity Demographics Based On Salary Range Portrait PDF
This graph or chart is linked to excel, and changes automatically based on data. Just left click on it and select Edit Data. Showcasing this set of slides titled Group Diversity Demographics Based On Salary Range Portrait PDF. The topics addressed in these templates are Salary Breakdown Team, Number Employees, Per Team. All the content presented in this PPT design is completely editable. Download it and make adjustments in color, background, font etc. as per your unique business setting.
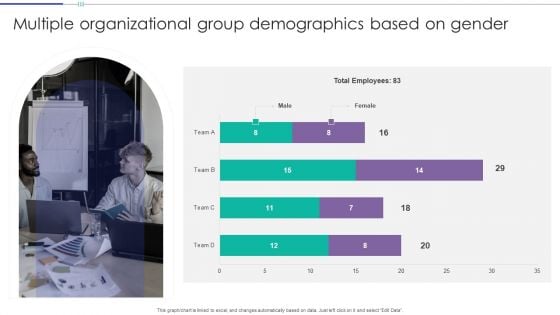
Multiple Organizational Group Demographics Based On Gender Download PDF
This graph or chart is linked to excel, and changes automatically based on data. Just left click on it and select Edit Data. Showcasing this set of slides titled Multiple Organizational Group Demographics Based On Gender Download PDF. The topics addressed in these templates are Total Employees, Team, Female. All the content presented in this PPT design is completely editable. Download it and make adjustments in color, background, font etc. as per your unique business setting.
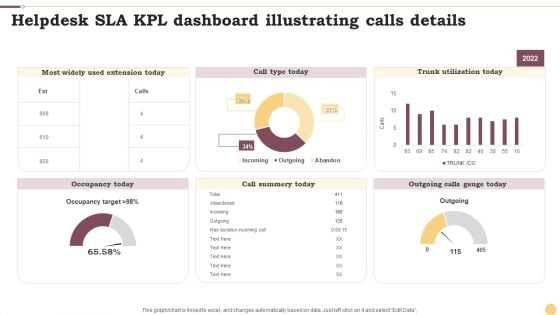
Helpdesk SLA KPL Dashboard Illustrating Calls Details Ppt Slides Show PDF
This graph or chart is linked to excel, and changes automatically based on data. Just left click on it and select Edit Data. Showcasing this set of slides titled Helpdesk SLA KPL Dashboard Illustrating Calls Details Ppt Slides Show PDF. The topics addressed in these templates are Call Type Today, Trunk Utilization Today, Call Summery Today. All the content presented in this PPT design is completely editable. Download it and make adjustments in color, background, font etc. as per your unique business setting.
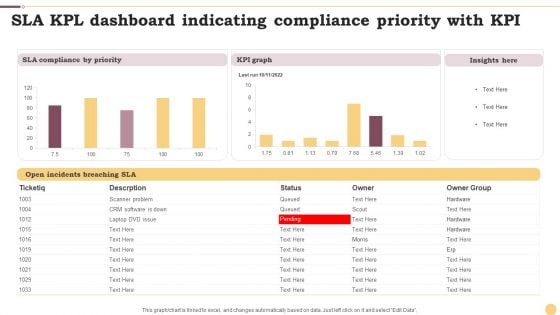
SLA KPL Dashboard Indicating Compliance Priority With KPI Ppt File Format PDF
This graph or chart is linked to excel, and changes automatically based on data. Just left click on it and select Edit Data. Showcasing this set of slides titled SLA KPL Dashboard Indicating Compliance Priority With KPI Ppt File Format PDF. The topics addressed in these templates are KPI Graph, Insights Here, SLA Compliance Priority. All the content presented in this PPT design is completely editable. Download it and make adjustments in color, background, font etc. as per your unique business setting.
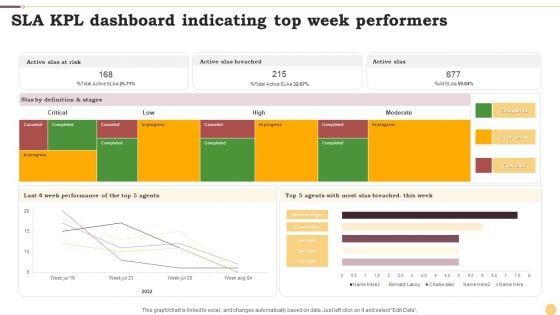
SLA KPL Dashboard Indicating Top Week Performers Ppt Infographics Examples PDF
This graph or chart is linked to excel, and changes automatically based on data. Just left click on it and select Edit Data. Showcasing this set of slides titled SLA KPL Dashboard Indicating Top Week Performers Ppt Infographics Examples PDF. The topics addressed in these templates are Active Slas Risk, Active Slas Breached, Active Slas. All the content presented in this PPT design is completely editable. Download it and make adjustments in color, background, font etc. as per your unique business setting.
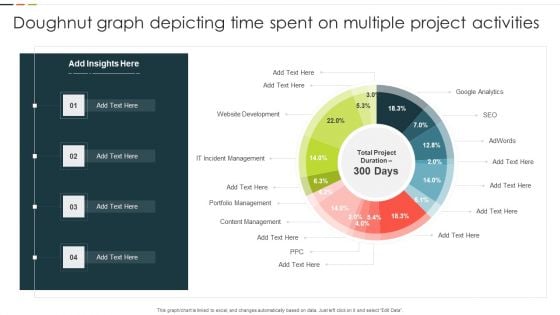
Doughnut Graph Depicting Time Spent On Multiple Project Activities Microsoft PDF
This graph or chart is linked to excel, and changes automatically based on data. Just left click on it and select Edit Data. Showcasing this set of slides titled Doughnut Graph Depicting Time Spent On Multiple Project Activities Microsoft PDF. The topics addressed in these templates are Website Development, IT Incident Management, Portfolio Management. All the content presented in this PPT design is completely editable. Download it and make adjustments in color, background, font etc. as per your unique business setting.
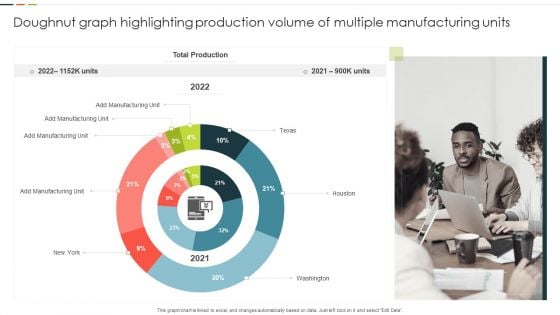
Doughnut Graph Highlighting Production Volume Of Multiple Manufacturing Units Guidelines PDF
This graph or chart is linked to excel, and changes automatically based on data. Just left click on it and select Edit Data. Showcasing this set of slides titled Doughnut Graph Highlighting Production Volume Of Multiple Manufacturing Units Guidelines PDF. The topics addressed in these templates are Total Production, Manufacturing Unit, Washington. All the content presented in this PPT design is completely editable. Download it and make adjustments in color, background, font etc. as per your unique business setting.
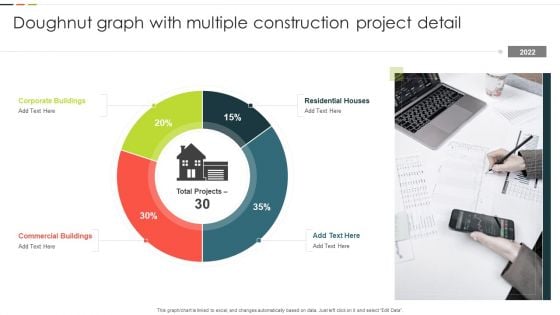
Doughnut Graph With Multiple Construction Project Detail Structure PDF
This graph or chart is linked to excel, and changes automatically based on data. Just left click on it and select Edit Data. Showcasing this set of slides titled Doughnut Graph With Multiple Construction Project Detail Structure PDF. The topics addressed in these templates are Corporate Buildings, Residential Houses, Commercial Buildings. All the content presented in this PPT design is completely editable. Download it and make adjustments in color, background, font etc. as per your unique business setting.
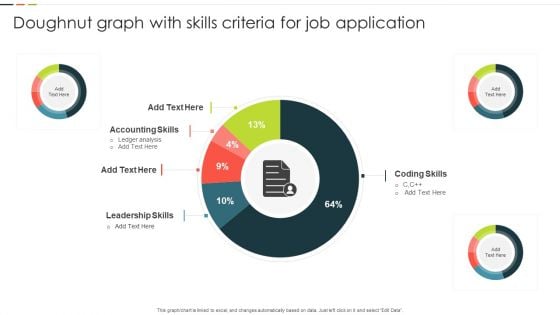
Doughnut Graph With Skills Criteria For Job Application Designs PDF
This graph or chart is linked to excel, and changes automatically based on data. Just left click on it and select Edit Data. Showcasing this set of slides titled Doughnut Graph With Skills Criteria For Job Application Designs PDF. The topics addressed in these templates are Accounting Skills, Leadership Skills, Coding Skills. All the content presented in this PPT design is completely editable. Download it and make adjustments in color, background, font etc. as per your unique business setting.
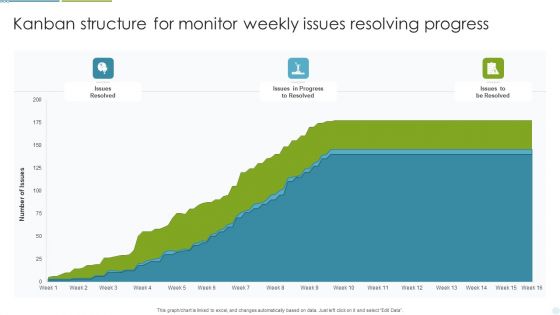
Kanban Structure For Monitor Weekly Issues Resolving Progress Ppt Professional Outline PDF
This graph or chart is linked to excel, and changes automatically based on data. Just left click on it and select Edit Data. Showcasing this set of slides titled Kanban Structure For Monitor Weekly Issues Resolving Progress Ppt Professional Outline PDF. The topics addressed in these templates are Issues Resolved, Progress To Resolved, Issues To Resolved. All the content presented in this PPT design is completely editable. Download it and make adjustments in color, background, font etc. as per your unique business setting.
Kanban Structure For Yearly Project Progress Tracking Ppt File Example Introduction PDF
This graph or chart is linked to excel, and changes automatically based on data. Just left click on it and select Edit Data. Showcasing this set of slides titled Kanban Structure For Yearly Project Progress Tracking Ppt File Example Introduction PDF. The topics addressed in these templates are Number Projects, Backlog Approved, Final Review. All the content presented in this PPT design is completely editable. Download it and make adjustments in color, background, font etc. as per your unique business setting.
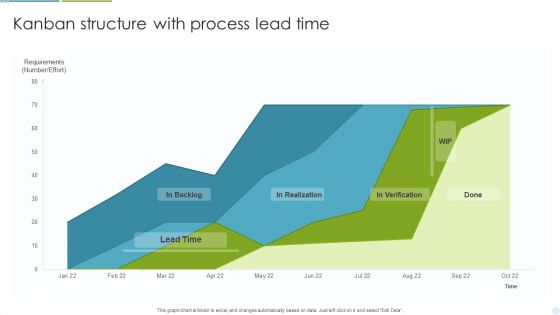
Kanban Structure With Process Lead Time Ppt Gallery Template PDF
This graph or chart is linked to excel, and changes automatically based on data. Just left click on it and select Edit Data. Showcasing this set of slides titled Kanban Structure With Process Lead Time Ppt Gallery Template PDF. The topics addressed in these templates are Lead Time, In Realization, Requirements. All the content presented in this PPT design is completely editable. Download it and make adjustments in color, background, font etc. as per your unique business setting.
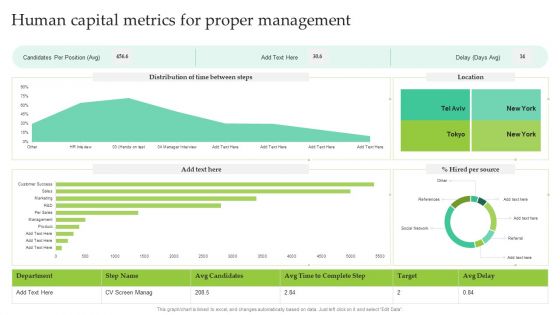
Human Capital Metrics For Proper Management Ppt Show Inspiration PDF
This graph or chart is linked to excel, and changes automatically based on data. Just left click on it and select Edit Data. Showcasing this set of slides titled Human Capital Metrics For Proper Management Ppt Show Inspiration PDF. The topics addressed in these templates are Candidates Per Position, Hired Per Source, Location. All the content presented in this PPT design is completely editable. Download it and make adjustments in color, background, font etc. as per your unique business setting.
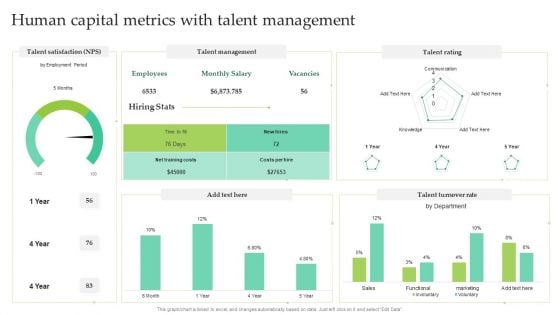
Human Capital Metrics With Talent Management Ppt Layouts Mockup PDF
This graph or chart is linked to excel, and changes automatically based on data. Just left click on it and select Edit Data. Showcasing this set of slides titled Human Capital Metrics With Talent Management Ppt Layouts Mockup PDF. The topics addressed in these templates are Talent Management, Talent Rating, Talent Turnover Rate. All the content presented in this PPT design is completely editable. Download it and make adjustments in color, background, font etc. as per your unique business setting.
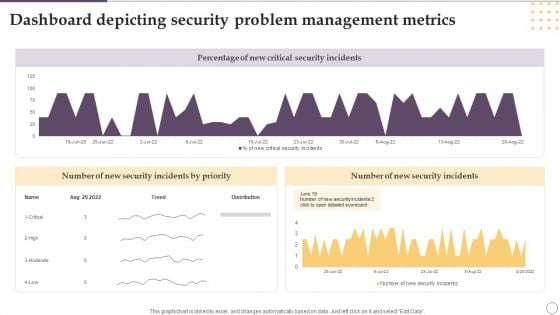
Dashboard Depicting Security Problem Management Metrics Ppt Gallery Designs PDF
This graph or chart is linked to excel, and changes automatically based on data. Just left click on it and select Edit Data. Showcasing this set of slides titled Dashboard Depicting Security Problem Management Metrics Ppt Gallery Designs PDF. The topics addressed in these templates are Percentage, New Critical, Security Incidents. All the content presented in this PPT design is completely editable. Download it and make adjustments in color, background, font etc. as per your unique business setting.
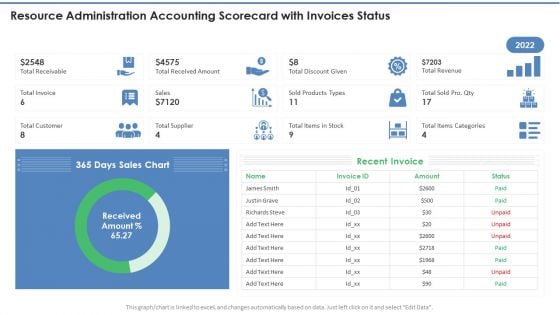
Resource Administration Accounting Scorecard With Invoices Status Topics PDF
This graph or chart is linked to excel, and changes automatically based on data. Just left click on it and select Edit Data. Deliver an awe inspiring pitch with this creative Resource Administration Accounting Scorecard With Invoices Status Topics PDF bundle. Topics like Recent Invoice, Sales Chart, Total Receivable can be discussed with this completely editable template. It is available for immediate download depending on the needs and requirements of the user.
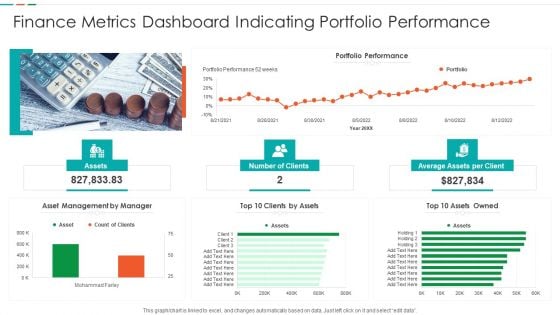
Finance Metrics Dashboard Indicating Portfolio Performance Microsoft PDF
This graph or chart is linked to excel, and changes automatically based on data. Just left click on it and select edit data. Pitch your topic with ease and precision using this Finance Metrics Dashboard Indicating Portfolio Performance Microsoft PDF. This layout presents information on Portfolio Performance Portfolio, Asset Management Manager, Top 10 Assets. It is also available for immediate download and adjustment. So, changes can be made in the color, design, graphics or any other component to create a unique layout.
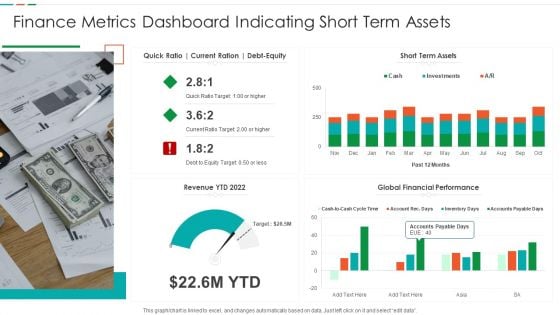
Finance Metrics Dashboard Indicating Short Term Assets Download PDF
This graph or chart is linked to excel, and changes automatically based on data. Just left click on it and select edit data. Pitch your topic with ease and precision using this Finance Metrics Dashboard Indicating Short Term Assets Download PDF. This layout presents information on Short Term Assets, Global Financial Performance, Revenue YTD 2022. It is also available for immediate download and adjustment. So, changes can be made in the color, design, graphics or any other component to create a unique layout.
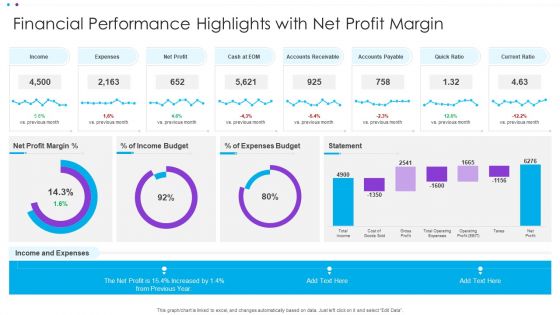
Financial Performance Highlights With Net Profit Margin Ppt Model Ideas PDF
This graph or chart is linked to excel, and changes automatically based on data. Just left click on it and select Edit Data. Pitch your topic with ease and precision using this Financial Performance Highlights With Net Profit Margin Ppt Model Ideas PDF. This layout presents information on Net Profit, Accounts Receivable, Accounts Payable. It is also available for immediate download and adjustment. So, changes can be made in the color, design, graphics or any other component to create a unique layout.
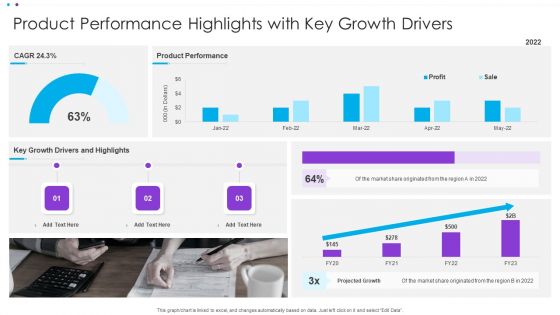
Product Performance Highlights With Key Growth Drivers Ppt Pictures Design Templates PDF
This graph or chart is linked to excel, and changes automatically based on data. Just left click on it and select Edit Data. Pitch your topic with ease and precision using this Product Performance Highlights With Key Growth Drivers Ppt Pictures Design Templates PDF. This layout presents information on Product Performance, Key Growth, Projected Growth. It is also available for immediate download and adjustment. So, changes can be made in the color, design, graphics or any other component to create a unique layout.
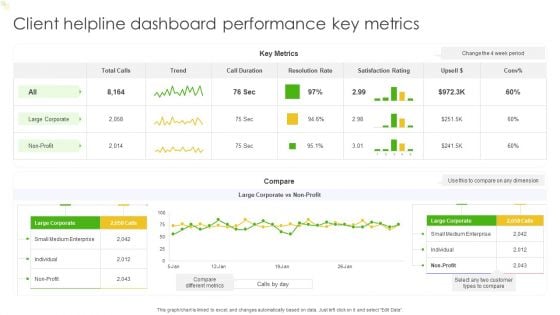
Client Helpline Dashboard Performance Key Metrics Ppt Outline Deck PDF
This graph or chart is linked to excel, and changes automatically based on data. Just left click on it and select Edit Data. Pitch your topic with ease and precision using this Client Helpline Dashboard Performance Key Metrics Ppt Outline Deck PDF. This layout presents information on Key Metrics, Trend, Compare. It is also available for immediate download and adjustment. So, changes can be made in the color, design, graphics or any other component to create a unique layout.
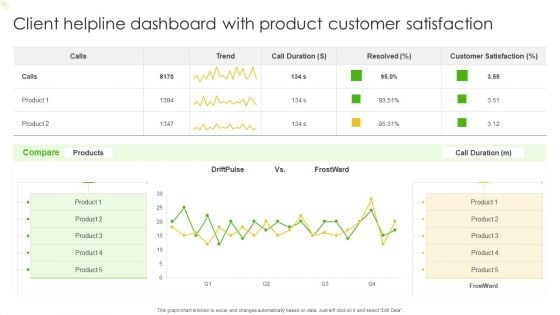
Client Helpline Dashboard With Product Customer Satisfaction Ppt Slides Graphics Template PDF
This graph or chart is linked to excel, and changes automatically based on data. Just left click on it and select Edit Data. Pitch your topic with ease and precision using this Client Helpline Dashboard With Product Customer Satisfaction Ppt Slides Graphics Template PDF. This layout presents information on Customer Satisfaction, Product, Compare. It is also available for immediate download and adjustment. So, changes can be made in the color, design, graphics or any other component to create a unique layout.
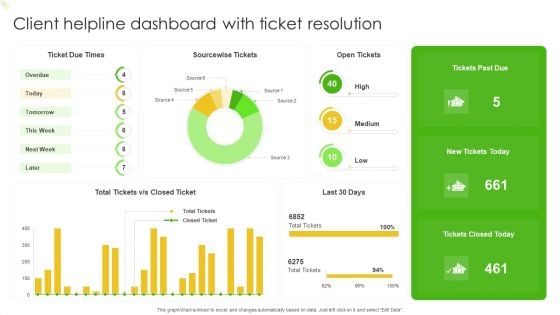
Client Helpline Dashboard With Ticket Resolution Ppt Model Graphics Design PDF
This graph or chart is linked to excel, and changes automatically based on data. Just left click on it and select Edit Data. Pitch your topic with ease and precision using this Client Helpline Dashboard With Ticket Resolution Ppt Model Graphics Design PDF. This layout presents information on Ticket Due Times, Sourcewise Tickets, Open Tickets. It is also available for immediate download and adjustment. So, changes can be made in the color, design, graphics or any other component to create a unique layout.
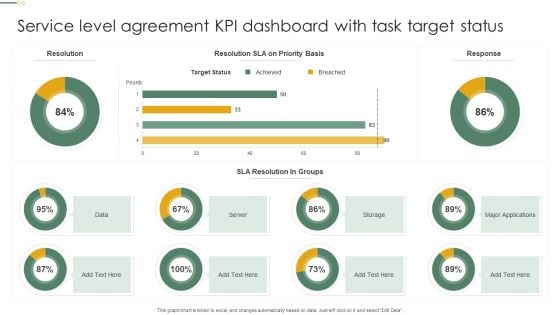
Service Level Agreement KPI Dashboard With Task Target Status Microsoft PDF
This graph or chart is linked to excel, and changes automatically based on data. Just left click on it and select Edit Data. Pitch your topic with ease and precision using this Service Level Agreement KPI Dashboard With Task Target Status Microsoft PDF. This layout presents information on Target Status, Sla Resolution, Groups, Server. It is also available for immediate download and adjustment. So, changes can be made in the color, design, graphics or any other component to create a unique layout.
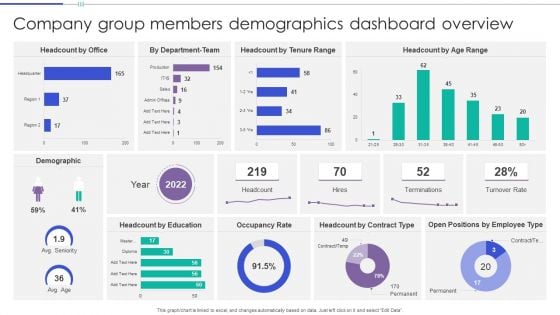
Company Group Members Demographics Dashboard Overview Clipart PDF
This graph or chart is linked to excel, and changes automatically based on data. Just left click on it and select Edit Data. Pitch your topic with ease and precision using this Company Group Members Demographics Dashboard Overview Clipart PDF. This layout presents information on Headcount Office, Headcount Tenure Range, Headcount Age Range. It is also available for immediate download and adjustment. So, changes can be made in the color, design, graphics or any other component to create a unique layout.
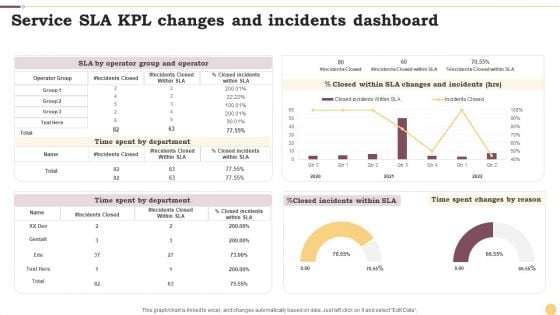
Service SLA KPL Changes And Incidents Dashboard Ppt Inspiration Infographics PDF
This graph or chart is linked to excel, and changes automatically based on data. Just left click on it and select Edit Data. Pitch your topic with ease and precision using this Service SLA KPL Changes And Incidents Dashboard Ppt Inspiration Infographics PDF. This layout presents information on Time Spent Department, Incidents Closed, Operator Group. It is also available for immediate download and adjustment. So, changes can be made in the color, design, graphics or any other component to create a unique layout.
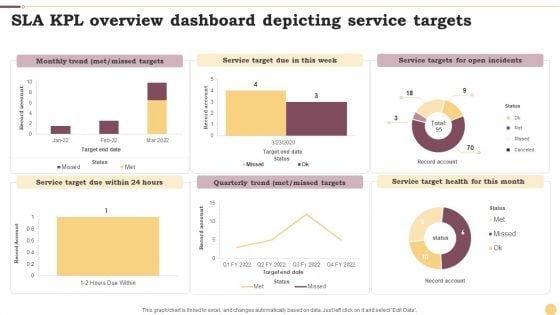
SLA KPL Overview Dashboard Depicting Service Targets Ppt Slides Maker PDF
This graph or chart is linked to excel, and changes automatically based on data. Just left click on it and select Edit Data. Pitch your topic with ease and precision using this SLA KPL Overview Dashboard Depicting Service Targets Ppt Slides Maker PDF. This layout presents information on Monthly Trend, Service Target, Quarterly Trend. It is also available for immediate download and adjustment. So, changes can be made in the color, design, graphics or any other component to create a unique layout.
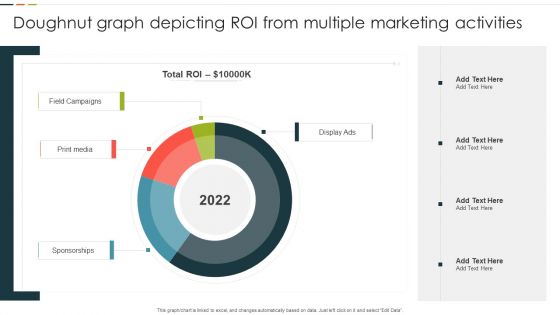
Doughnut Graph Depicting ROI From Multiple Marketing Activities Rules PDF
This graph or chart is linked to excel, and changes automatically based on data. Just left click on it and select Edit Data. Pitch your topic with ease and precision using this Doughnut Graph Depicting ROI From Multiple Marketing Activities Rules PDF. This layout presents information on Total ROI, Field Campaigns, Print Media, Display Ads. It is also available for immediate download and adjustment. So, changes can be made in the color, design, graphics or any other component to create a unique layout.
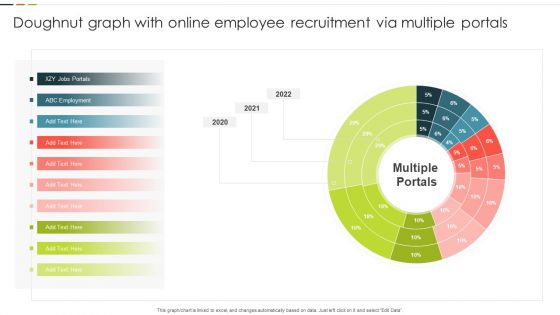
Doughnut Graph With Online Employee Recruitment Via Multiple Portals Mockup PDF
This graph or chart is linked to excel, and changes automatically based on data. Just left click on it and select Edit Data. Pitch your topic with ease and precision using this Doughnut Graph With Online Employee Recruitment Via Multiple Portals Mockup PDF. This layout presents information on ABC Employment, Multiple Portals, 2020 To 2022. It is also available for immediate download and adjustment. So, changes can be made in the color, design, graphics or any other component to create a unique layout.
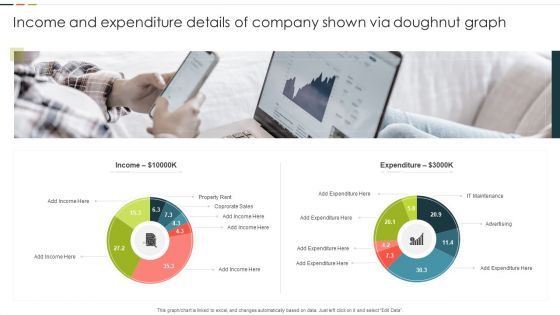
Income And Expenditure Details Of Company Shown Via Doughnut Graph Graphics PDF
This graph or chart is linked to excel, and changes automatically based on data. Just left click on it and select Edit Data. Pitch your topic with ease and precision using this Income And Expenditure Details Of Company Shown Via Doughnut Graph Graphics PDF. This layout presents information on Property Rent, Corporate Sales, Expenditure. It is also available for immediate download and adjustment. So, changes can be made in the color, design, graphics or any other component to create a unique layout.
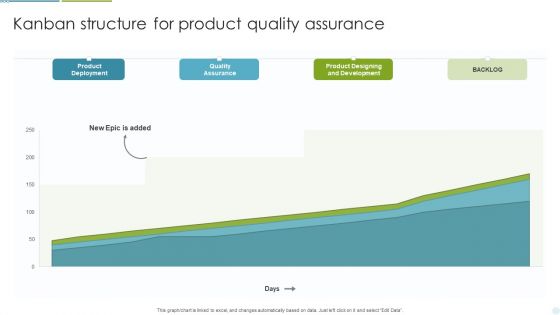
Kanban Structure For Product Quality Assurance Ppt Portfolio Deck PDF
This graph or chart is linked to excel, and changes automatically based on data. Just left click on it and select Edit Data. Pitch your topic with ease and precision using this Kanban Structure For Product Quality Assurance Ppt Portfolio Deck PDF. This layout presents information on Product Deployment, Quality Assurance, Product, Designing And Development. It is also available for immediate download and adjustment. So, changes can be made in the color, design, graphics or any other component to create a unique layout.
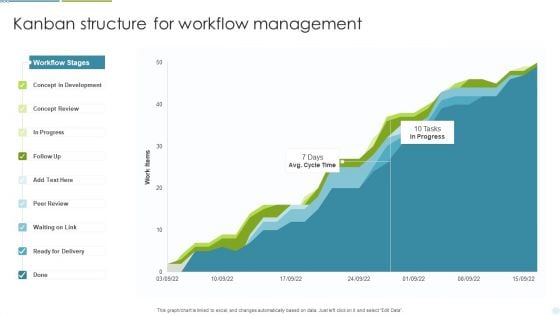
Kanban Structure For Workflow Management Ppt Inspiration Template PDF
This graph or chart is linked to excel, and changes automatically based on data. Just left click on it and select Edit Data. Pitch your topic with ease and precision using this Kanban Structure For Workflow Management Ppt Inspiration Template PDF. This layout presents information on Concept Development, Concept Review, Ready For Delivery. It is also available for immediate download and adjustment. So, changes can be made in the color, design, graphics or any other component to create a unique layout.
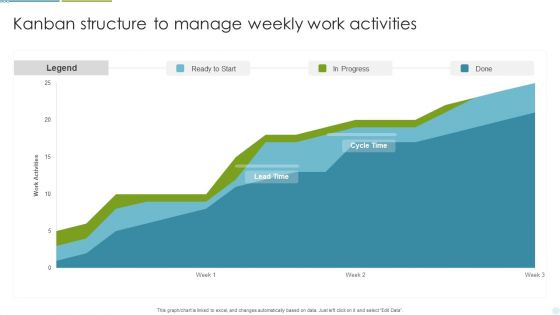
Kanban Structure To Manage Weekly Work Activities Ppt Professional Aids PDF
This graph or chart is linked to excel, and changes automatically based on data. Just left click on it and select Edit Data. Pitch your topic with ease and precision using this Kanban Structure To Manage Weekly Work Activities Ppt Professional Aids PDF. This layout presents information on Legend, Ready To Start, In Progress. It is also available for immediate download and adjustment. So, changes can be made in the color, design, graphics or any other component to create a unique layout.
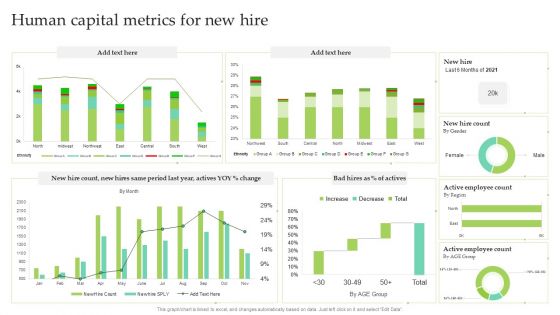
Human Capital Metrics For New Hire Ppt Pictures Brochure PDF
This graph or chart is linked to excel, and changes automatically based on data. Just left click on it and select Edit Data. Pitch your topic with ease and precision using this Human Capital Metrics For New Hire Ppt Pictures Brochure PDF. This layout presents information on Active Employee Count, New Hire Count, New Hire. It is also available for immediate download and adjustment. So, changes can be made in the color, design, graphics or any other component to create a unique layout.
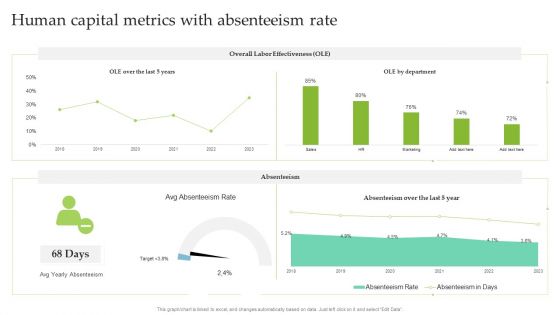
Human Capital Metrics With Absenteeism Rate Ppt Infographic Template Ideas PDF
This graph or chart is linked to excel, and changes automatically based on data. Just left click on it and select Edit Data. Pitch your topic with ease and precision using this Human Capital Metrics With Absenteeism Rate Ppt Infographic Template Ideas PDF. This layout presents information on Overall Labor Effectiveness, OLE Department, Absenteeism. It is also available for immediate download and adjustment. So, changes can be made in the color, design, graphics or any other component to create a unique layout.
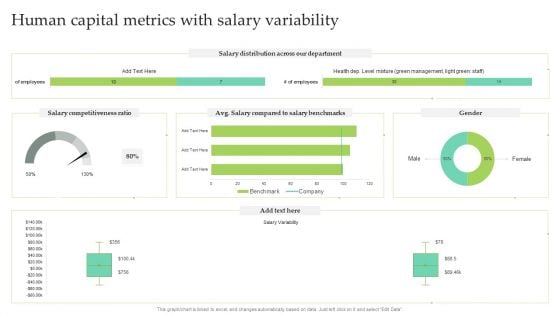
Human Capital Metrics With Salary Variability Ppt Infographic Template Designs PDF
This graph or chart is linked to excel, and changes automatically based on data. Just left click on it and select Edit Data. Pitch your topic with ease and precision using this Human Capital Metrics With Salary Variability Ppt Infographic Template Designs PDF. This layout presents information on Salary Distribution, Salary Competitiveness Ratio, Male. It is also available for immediate download and adjustment. So, changes can be made in the color, design, graphics or any other component to create a unique layout.
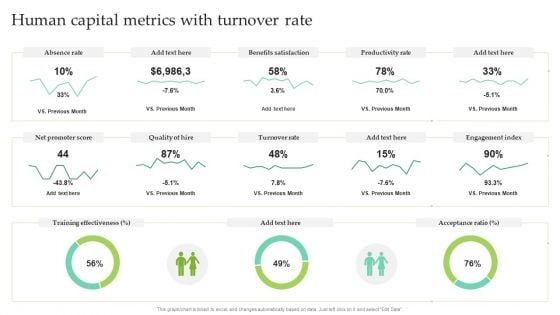
Human Capital Metrics With Turnover Rate Ppt Pictures Outline PDF
This graph or chart is linked to excel, and changes automatically based on data. Just left click on it and select Edit Data. Pitch your topic with ease and precision using this Human Capital Metrics With Turnover Rate Ppt Pictures Outline PDF. This layout presents information on Absence Rate, Benefits Satisfaction, Productivity Rate. It is also available for immediate download and adjustment. So, changes can be made in the color, design, graphics or any other component to create a unique layout.
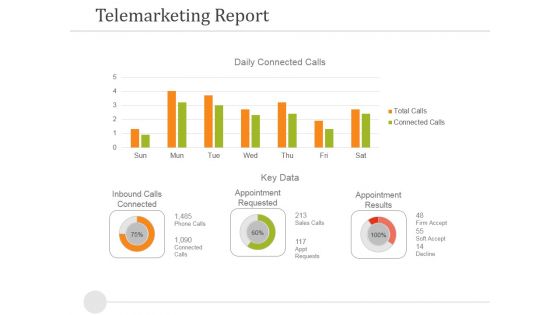
Telemarketing Report Template 1 Ppt PowerPoint Presentation Model Model
This is a telemarketing report template 1 ppt powerpoint presentation model model. This is a two stage process. The stages in this process are inbound calls connected, appointment requested, appointment results, key data.
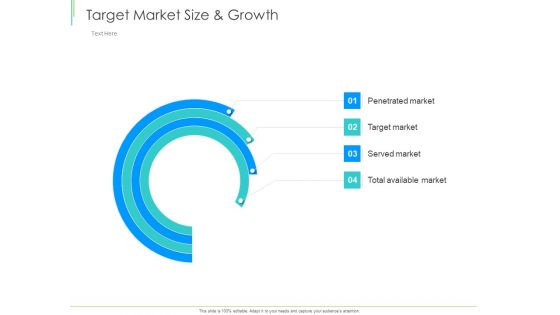
Marketing Plan Implementation Target Market Size And Growth Ppt File Model PDF
This graph or chart is linked to excel, and changes automatically based on data. Just left click on it and select Edit Data. Deliver an awe-inspiring pitch with this creative marketing plan implementation target market size and growth ppt file model pdf bundle. Topics like target market size and growth can be discussed with this completely editable template. It is available for immediate download depending on the needs and requirements of the user.
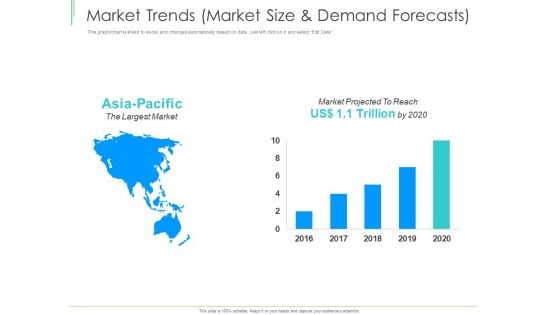
Marketing Plan Implementation Market Trends Market Size And Demand Forecasts Topics PDF
This graph or chart is linked to excel, and changes automatically based on data. Just left click on it and select Edit Data. Deliver an awe-inspiring pitch with this creative marketing plan implementation market trends market size and demand forecasts topics pdf bundle. Topics like market trends, market size and demand forecasts can be discussed with this completely editable template. It is available for immediate download depending on the needs and requirements of the user.
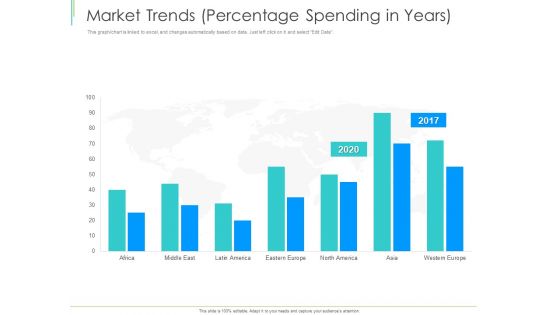
Marketing Plan Implementation Market Trends Percentage Spending In Years Demonstration PDF
This graph or chart is linked to excel, and changes automatically based on data. Just left click on it and select Edit Data. Deliver an awe-inspiring pitch with this creative marketing plan implementation market trends percentage spending in years demonstration pdf bundle. Topics like market trends, percentage spending in years can be discussed with this completely editable template. It is available for immediate download depending on the needs and requirements of the user.
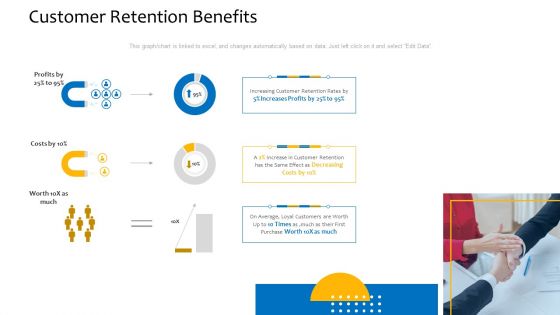
Customer Relationship Management Procedure Customer Retention Benefits Introduction PDF
This graph chart is linked to excel, and changes automatically based on data. Just left click on it and select Edit Data. Deliver an awe inspiring pitch with this creative customer relationship management procedure customer retention benefits introduction pdf bundle. Topics like customer retention benefits, profits, costs can be discussed with this completely editable template. It is available for immediate download depending on the needs and requirements of the user.
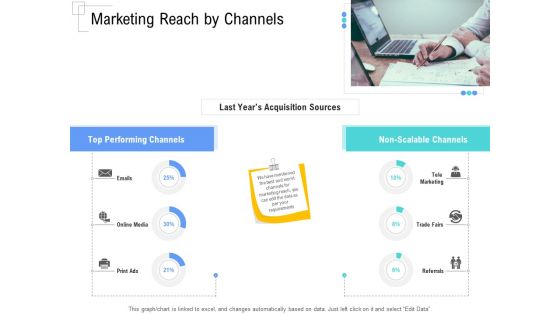
Managing Customer Experience Marketing Reach By Channels Elements PDF
This graph or chart is linked to excel, and changes automatically based on data. Just left click on it and select Edit Data.Deliver and pitch your topic in the best possible manner with this managing customer experience marketing reach by channels elements pdf. Use them to share invaluable insights on last years acquisition sources, top performing channels, non scalable channels and impress your audience. This template can be altered and modified as per your expectations. So, grab it now.
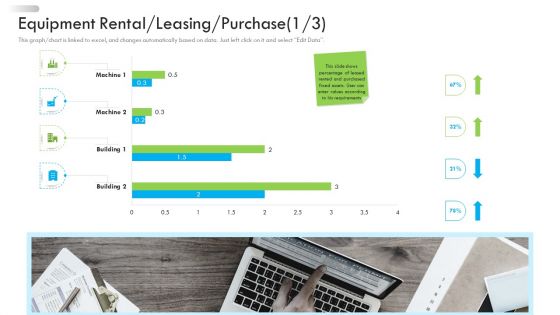
Enterprise Tactical Planning Equipment Rental Leasing Purchase Machine Brochure PDF
This graph or chart is linked to excel, and changes automatically based on data. Just left click on it and select Edit Data. Deliver an awe-inspiring pitch with this creative enterprise tactical planning equipment rental leasing purchase machine brochure pdf bundle. Topics like equipment rental, leasing, purchase can be discussed with this completely editable template. It is available for immediate download depending on the needs and requirements of the user.
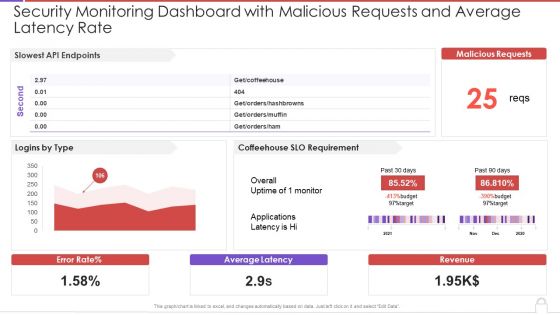
Security Monitoring Dashboard With Malicious Requests And Average Latency Rate Topics PDF
This graph or chart is linked to excel, and changes automatically based on data. Just left click on it and select Edit Data. Deliver an awe inspiring pitch with this creative security monitoring dashboard with malicious requests and average latency rate topics pdf bundle. Topics like slowest api endpoints, malicious requests, coffeehouse slo can be discussed with this completely editable template. It is available for immediate download depending on the needs and requirements of the user.
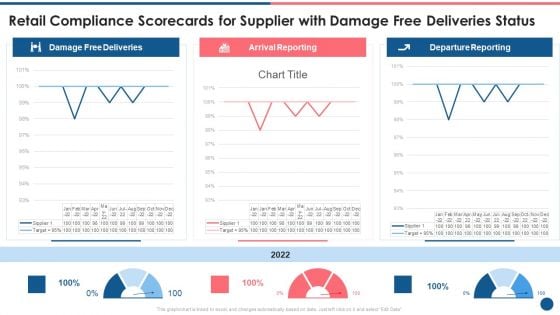
Supplier Scorecard Retail Compliance Scorecards For Supplier With Damage Free Deliveries Status Sample PDF
This graph or chart is linked to excel, and changes automatically based on data. Just left click on it and select Edit Data. Deliver and pitch your topic in the best possible manner with this supplier scorecard retail compliance scorecards for supplier with damage free deliveries status sample pdf. Use them to share invaluable insights on damage free deliveries, arrival reporting, departure reporting and impress your audience. This template can be altered and modified as per your expectations. So, grab it now.
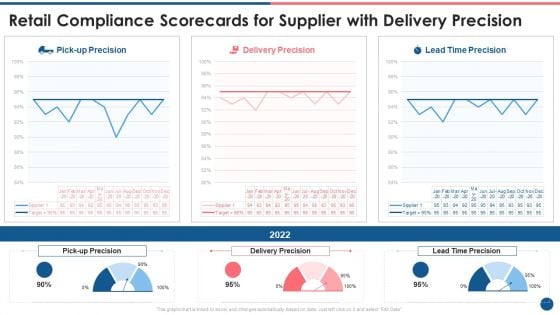
Supplier Scorecard Retail Compliance Scorecards For Supplier With Delivery Precision Clipart PDF
This graph or chart is linked to excel, and changes automatically based on data. Just left click on it and select Edit Data. Deliver an awe inspiring pitch with this creative supplier scorecard retail compliance scorecards for supplier with delivery precision clipart pdf bundle. Topics like pick up precision, delivery precision, lead time precision can be discussed with this completely editable template. It is available for immediate download depending on the needs and requirements of the user.
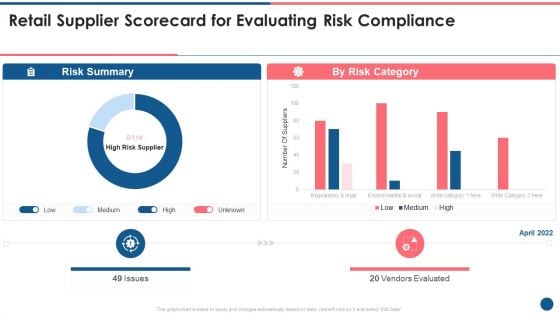
Supplier Scorecard Retail Supplier Scorecard For Evaluating Risk Compliance Clipart PDF
This graph or chart is linked to excel, and changes automatically based on data. Just left click on it and select Edit Data. Deliver and pitch your topic in the best possible manner with this supplier scorecard retail supplier scorecard for evaluating risk compliance clipart pdf. Use them to share invaluable insights on risk summary, risk category, vendors evaluated, low, medium, high and impress your audience. This template can be altered and modified as per your expectations. So, grab it now.
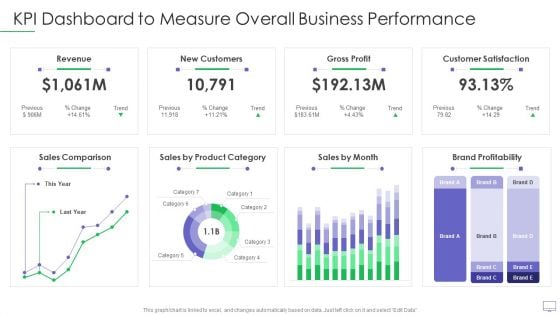
Guide For Software Developers KPI Dashboard To Measure Overall Business Performance Elements PDF
This graph or chart is linked to excel, and changes automatically based on data. Just left click on it and select Edit Data. Deliver an awe inspiring pitch with this creative guide for software developers kpi dashboard to measure overall business performance elements pdf bundle. Topics like revenue new customers, gross profit, customer satisfaction, sales comparison, brand profitability can be discussed with this completely editable template. It is available for immediate download depending on the needs and requirements of the user.
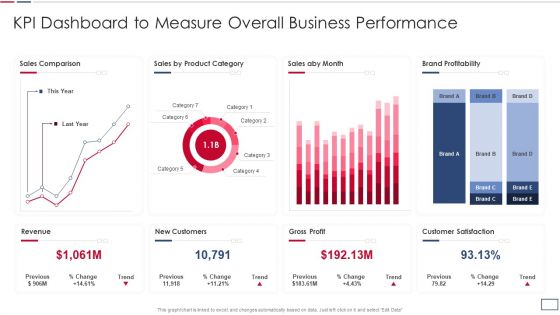
Software Developer Playbook Kpi Dashboard To Measure Overall Business Performance Topics PDF
This graph or chart is linked to excel, and changes automatically based on data. Just left click on it and select Edit Data. Deliver and pitch your topic in the best possible manner with this software developer playbook kpi dashboard to measure overall business performance topics pdf. Use them to share invaluable insights on revenue new customers, gross profit, customer satisfaction, sales comparison and impress your audience. This template can be altered and modified as per your expectations. So, grab it now.
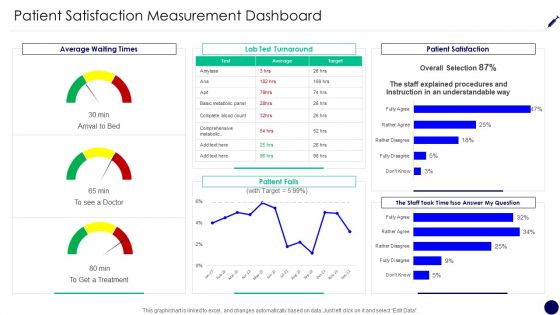
Consumer Retention Techniques Patient Satisfaction Measurement Dashboard Rules PDF
This graph or chart is linked to excel, and changes automatically based on data. Just left click on it and select Edit Data. Deliver and pitch your topic in the best possible manner with this consumer retention techniques patient satisfaction measurement dashboard rules pdf. Use them to share invaluable insights on average waiting times, lab test turnaround, patient satisfaction, patient falls and impress your audience. This template can be altered and modified as per your expectations. So, grab it now.
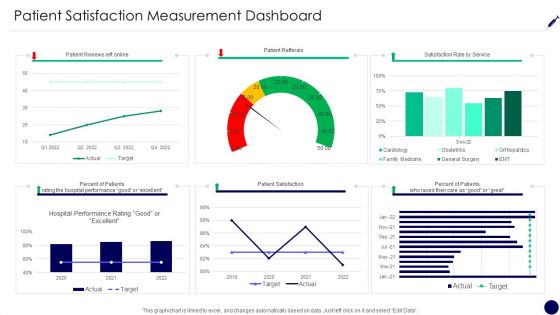
Patient Satisfaction Measurement Dashboard Consumer Retention Techniques Summary PDF
This graph or chart is linked to excel, and changes automatically based on data. Just left click on it and select Edit Data. Deliver and pitch your topic in the best possible manner with this patient satisfaction measurement dashboard consumer retention techniques summary pdf. Use them to share invaluable insights on patient reviews left online, patient refferals, satisfaction rate service, percent patients and impress your audience. This template can be altered and modified as per your expectations. So, grab it now.
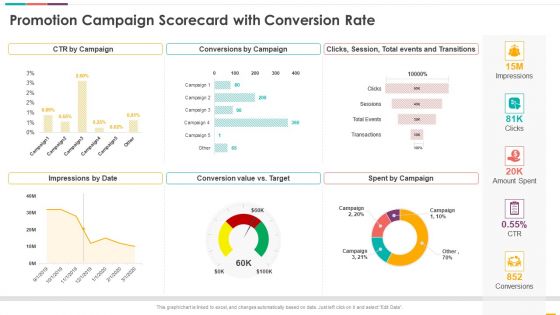
Promotion Campaign Scorecard With Conversion Rate Ppt Inspiration Graphics PDF
This graph or chart is linked to excel, and changes automatically based on data. Just left click on it and select Edit Data. Deliver an awe inspiring pitch with this creative promotion campaign scorecard with conversion rate ppt inspiration graphics pdf bundle. Topics like ctr by campaign, conversions by campaign, impressions by date, conversion value vs target, spent by campaign can be discussed with this completely editable template. It is available for immediate download depending on the needs and requirements of the user.
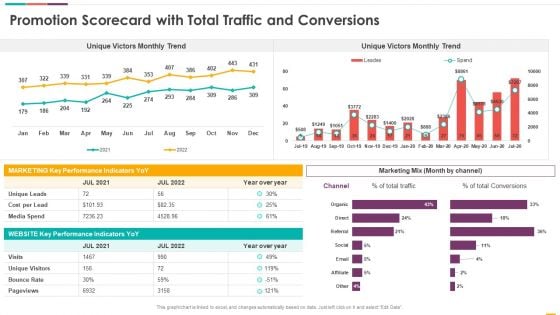
Promotion Scorecard With Total Traffic And Conversions Ppt Pictures Clipart Images PDF
This graph or chart is linked to excel, and changes automatically based on data. Just left click on it and select Edit Data. Deliver an awe inspiring pitch with this creative promotion scorecard with total traffic and conversions ppt pictures clipart images pdf bundle. Topics likeunique victors monthly trend, unique victors monthly trend, marketing mix can be discussed with this completely editable template. It is available for immediate download depending on the needs and requirements of the user.
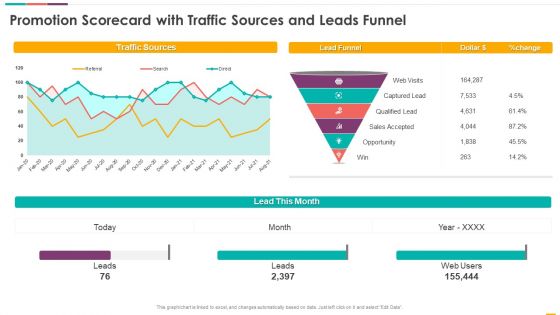
Promotion Scorecard With Traffic Sources And Leads Funnel Ppt Layouts Background PDF
This graph or chart is linked to excel, and changes automatically based on data. Just left click on it and select Edit Data. Deliver and pitch your topic in the best possible manner with this promotion scorecard with traffic sources and leads funnel ppt layouts background pdf. Use them to share invaluable insights on lead month, lead funnel, dollar, traffic sources and impress your audience. This template can be altered and modified as per your expectations. So, grab it now.
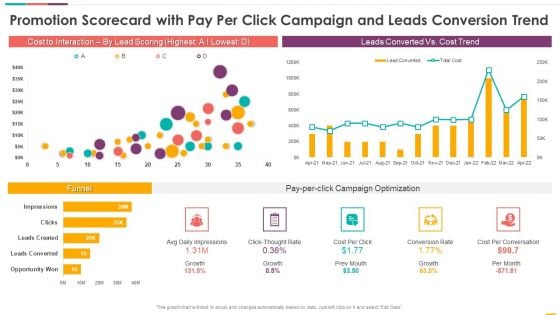
Promotion Scorecard With Pay Per Click Campaign And Leads Conversion Trend Topics PDF
This graph or chart is linked to excel, and changes automatically based on data. Just left click on it and select Edit Data. Deliver an awe inspiring pitch with this creative promotion scorecard with pay per click campaign and leads conversion trend topics pdf bundle. Topics like cost to interaction, by lead scoring, leads converted vs cost trend, funnel can be discussed with this completely editable template. It is available for immediate download depending on the needs and requirements of the user.
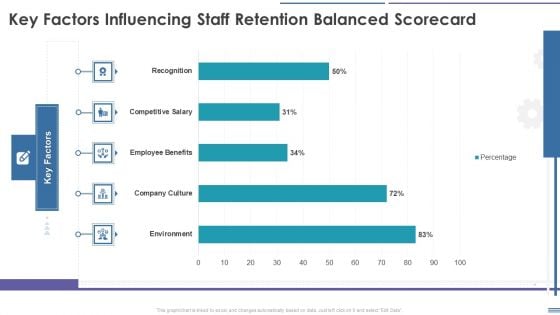
Staff Retention Balanced Scorecard Key Factors Influencing Staff Retention Balanced Scorecard Download PDF
This graph or chart is linked to excel, and changes automatically based on data. Just left click on it and select Edit Data. Deliver an awe inspiring pitch with this creative Staff Retention Balanced Scorecard Key Factors Influencing Staff Retention Balanced Scorecard Download PDF bundle. Topics like Environment, Company Culture, Employee Benefits, Competitive Salary can be discussed with this completely editable template. It is available for immediate download depending on the needs and requirements of the user.
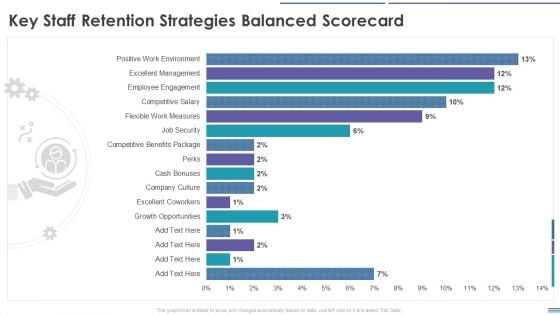
Staff Retention Balanced Scorecard Key Staff Retention Strategies Balanced Scorecard Rules PDF
This graph or chart is linked to excel, and changes automatically based on data. Just left click on it and select Edit Data. Deliver and pitch your topic in the best possible manner with this Staff Retention Balanced Scorecard Key Staff Retention Strategies Balanced Scorecard Rules PDF. Use them to share invaluable insights on Growth Opportunities, Excellent Coworkers, Company Culture, Excellent Management and impress your audience. This template can be altered and modified as per your expectations. So, grab it now.
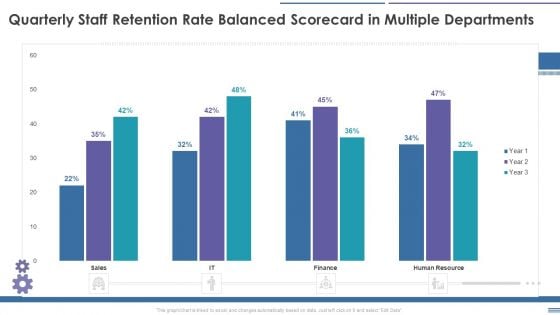
Staff Retention Balanced Scorecard Quarterly Staff Retention Rate Balanced Scorecard In Multiple Formats PDF
This graph or chart is linked to excel, and changes automatically based on data. Just left click on it and select Edit Data. Deliver an awe inspiring pitch with this creative Staff Retention Balanced Scorecard Quarterly Staff Retention Rate Balanced Scorecard In Multiple Formats PDF bundle. Topics like Staff Retention, Balanced Scorecard, Quarterly Staff Retention, Rate Balanced Scorecard can be discussed with this completely editable template. It is available for immediate download depending on the needs and requirements of the user.
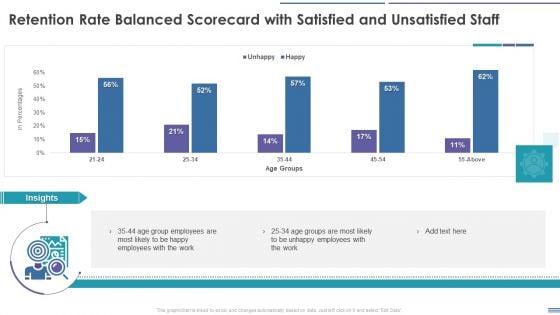
Staff Retention Balanced Scorecard Retention Rate Balanced Scorecard With Satisfied And Unsatisfied Summary PDF
This graph or chart is linked to excel, and changes automatically based on data. Just left click on it and select Edit Data. Deliver an awe inspiring pitch with this creative Staff Retention Balanced Scorecard Retention Rate Balanced Scorecard With Satisfied And Unsatisfied Summary PDF bundle. Topics like Employee, Retention Rate Balanced Scorecard, Satisfied And Unsatisfied Staff can be discussed with this completely editable template. It is available for immediate download depending on the needs and requirements of the user.
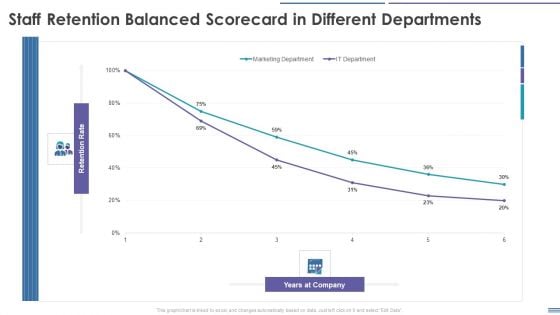
Staff Retention Balanced Scorecard Staff Retention Balanced Scorecard In Different Departments Template PDF
This graph or chart is linked to excel, and changes automatically based on data. Just left click on it and select Edit Data. Deliver and pitch your topic in the best possible manner with this Staff Retention Balanced Scorecard Staff Retention Balanced Scorecard In Different Departments Template PDF. Use them to share invaluable insights on Marketing Department, IT Department and impress your audience. This template can be altered and modified as per your expectations. So, grab it now.
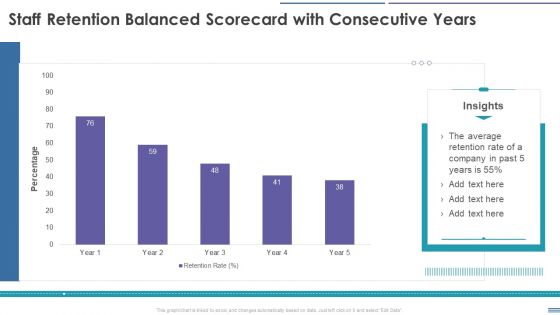
Staff Retention Balanced Scorecard Staff Retention Balanced Scorecard With Consecutive Years Download PDF
This graph or chart is linked to excel, and changes automatically based on data. Just left click on it and select Edit Data. Deliver an awe inspiring pitch with this creative Staff Retention Balanced Scorecard Staff Retention Balanced Scorecard With Consecutive Years Download PDF bundle. Topics like Retention Rate, Percentage can be discussed with this completely editable template. It is available for immediate download depending on the needs and requirements of the user.
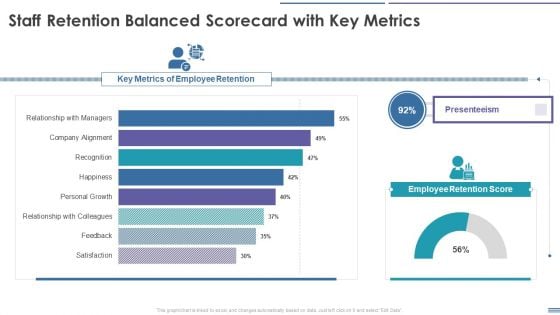
Staff Retention Balanced Scorecard Staff Retention Balanced Scorecard With Key Metrics Demonstration PDF
This graph or chart is linked to excel, and changes automatically based on data. Just left click on it and select Edit Data. Deliver and pitch your topic in the best possible manner with this Staff Retention Balanced Scorecard Staff Retention Balanced Scorecard With Key Metrics Demonstration PDF. Use them to share invaluable insights on Key Metrics Of Employee Retention, Presenteeism, Employee Retention Score and impress your audience. This template can be altered and modified as per your expectations. So, grab it now.

Auto Sales Profit Scorecard For Two And Four Wheeler Vehicles Inspiration PDF
This graph or chart is linked to excel, and changes automatically based on data. Just left click on it and select Edit Data. Deliver an awe inspiring pitch with this creative Auto Sales Profit Scorecard For Two And Four Wheeler Vehicles Inspiration PDF bundle. Topics like Two Wheeler Vehicles, Four Wheeler Vehicles, Six Wheeler Vehicles can be discussed with this completely editable template. It is available for immediate download depending on the needs and requirements of the user.
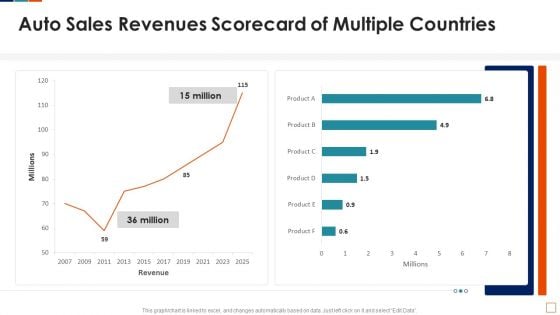
Auto Sales Revenues Scorecard Of Multiple Countries Inspiration PDF
This graph or chart is linked to excel, and changes automatically based on data. Just left click on it and select Edit Data. Deliver an awe inspiring pitch with this creative Auto Sales Revenues Scorecard Of Multiple Countries Inspiration PDF bundle. Topics like Auto Sales Revenues, Scorecard Multiple Countries can be discussed with this completely editable template. It is available for immediate download depending on the needs and requirements of the user.
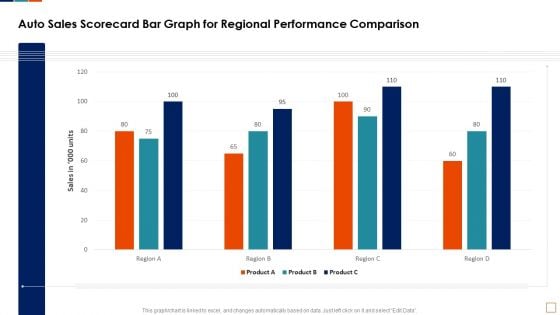
Auto Sales Scorecard Bar Graph For Regional Performance Comparison Infographics PDF
This graph or chart is linked to excel, and changes automatically based on data. Just left click on it and select Edit Data. Deliver an awe inspiring pitch with this creative Auto Sales Scorecard Bar Graph For Regional Performance Comparison Infographics PDF bundle. Topics like Auto Sales Scorecard, Bar Graph Regional, Performance Comparison Product can be discussed with this completely editable template. It is available for immediate download depending on the needs and requirements of the user.
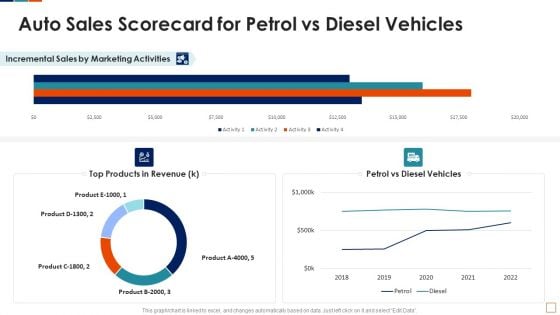
Auto Sales Scorecard For Petrol Vs Diesel Vehicles Template PDF
This graph or chart is linked to excel, and changes automatically based on data. Just left click on it and select Edit Data. Deliver an awe inspiring pitch with this creative Auto Sales Scorecard For Petrol Vs Diesel Vehicles Template PDF bundle. Topics like Top Products Revenue, Petrol Vs Diesel, Vehicles Incremental Sales, Marketing Activities Product can be discussed with this completely editable template. It is available for immediate download depending on the needs and requirements of the user.
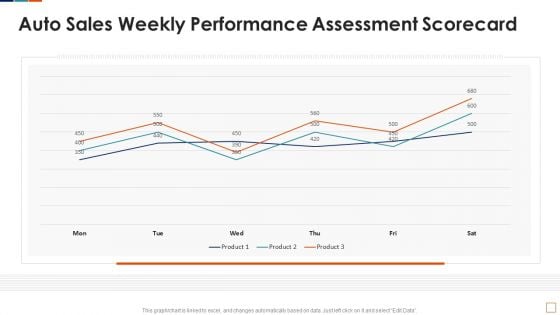
Auto Sales Weekly Performance Assessment Scorecard Background PDF
This graph or chart is linked to excel, and changes automatically based on data. Just left click on it and select Edit Data. Deliver and pitch your topic in the best possible manner with this Auto Sales Weekly Performance Assessment Scorecard Background PDF. Use them to share invaluable insights on Auto Sales Weekly, Performance Assessment Scorecard and impress your audience. This template can be altered and modified as per your expectations. So, grab it now.
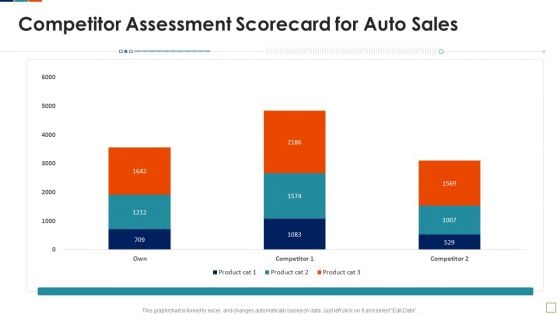
Automobile Sales Scorecard Competitor Assessment Scorecard For Auto Sales Demonstration PDF
This graph or chart is linked to excel, and changes automatically based on data. Just left click on it and select Edit Data. Deliver an awe inspiring pitch with this creative Automobile Sales Scorecard Competitor Assessment Scorecard For Auto Sales Demonstration PDF bundle. Topics like Competitor Assessment Scorecard, Auto Sales Product can be discussed with this completely editable template. It is available for immediate download depending on the needs and requirements of the user.
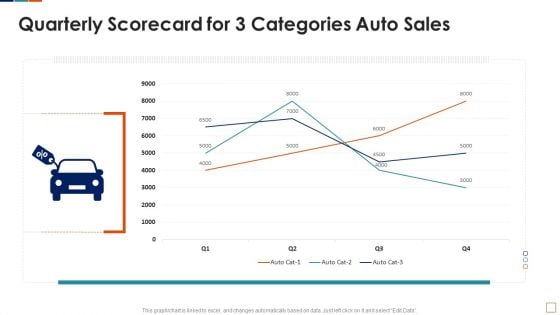
Automobile Sales Scorecard Quarterly Scorecard For 3 Categories Auto Sales Microsoft PDF
This graph or chart is linked to excel, and changes automatically based on data. Just left click on it and select Edit Data. Deliver an awe inspiring pitch with this creative Automobile Sales Scorecard Quarterly Scorecard For 3 Categories Auto Sales Microsoft PDF bundle. Topics like Quarterly Scorecard Three, Categories Auto Sales can be discussed with this completely editable template. It is available for immediate download depending on the needs and requirements of the user.
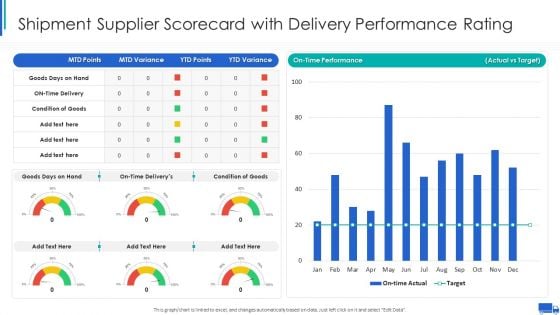
Shipment Supplier Scorecard With Delivery Performance Rating Ppt Ideas Graphic Tips PDF
This graph or chart is linked to excel, and changes automatically based on data. Just left click on it and select Edit Data. Deliver an awe inspiring pitch with this creative Shipment Supplier Scorecard With Delivery Performance Rating Ppt Ideas Graphic Tips PDF bundle. Topics like On Time Performance, Actual Vs Target, Goods Days Hand can be discussed with this completely editable template. It is available for immediate download depending on the needs and requirements of the user.
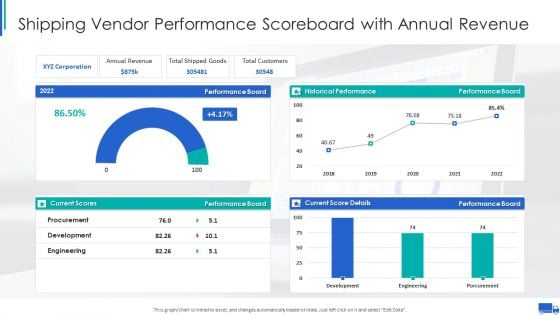
Shipping Vendor Performance Scoreboard With Annual Revenue Ppt Infographics Graphics PDF
This graph or chart is linked to excel, and changes automatically based on data. Just left click on it and select Edit Data. Deliver an awe inspiring pitch with this creative Shipping Vendor Performance Scoreboard With Annual Revenue Ppt Infographics Graphics PDF bundle. Topics like Annual Revenue Board, Total Shipped Goods, Total Customers Performance can be discussed with this completely editable template. It is available for immediate download depending on the needs and requirements of the user.
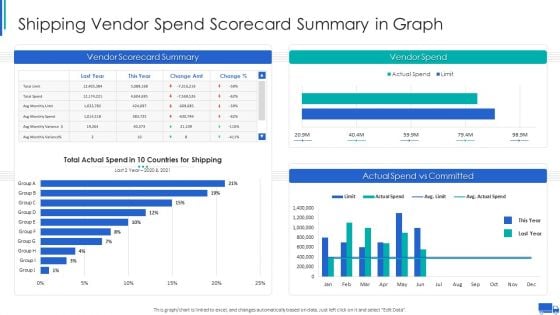
Shipping Vendor Spend Scorecard Summary In Graph Ppt Pictures Introduction PDF
This graph or chart is linked to excel, and changes automatically based on data. Just left click on it and select Edit Data. Deliver and pitch your topic in the best possible manner with this Shipping Vendor Spend Scorecard Summary In Graph Ppt Pictures Introduction PDF. Use them to share invaluable insights on Vendor Scorecard Summary, Vendor Spend Shipping, Actual Spend Vs and impress your audience. This template can be altered and modified as per your expectations. So, grab it now.
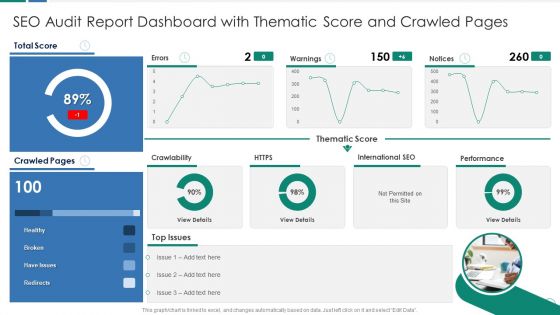
SEO Audit Report Dashboard With Thematic Score And Crawled Pages Download PDF
This graph or chart is linked to excel, and changes automatically based on data. Just left click on it and select Edit Data. Deliver and pitch your topic in the best possible manner with this SEO Audit Report Dashboard With Thematic Score And Crawled Pages Download PDF. Use them to share invaluable insights on Thematic Score Warnings, International SEO Performance, Total Score Healthy and impress your audience. This template can be altered and modified as per your expectations. So, grab it now.
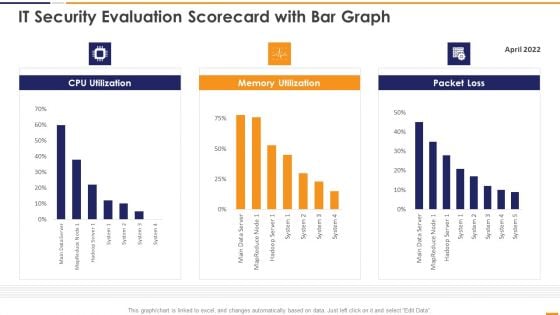
IT Security Evaluation Scorecard With Bar Graph Ppt Gallery Design Templates PDF
This graph or chart is linked to excel, and changes automatically based on data. Just left click on it and select Edit Data. Deliver and pitch your topic in the best possible manner with this IT Security Evaluation Scorecard With Bar Graph Ppt Gallery Design Templates PDF. Use them to share invaluable insights on CPU Utilization Memory, Utilization Packet Loss and impress your audience. This template can be altered and modified as per your expectations. So, grab it now.
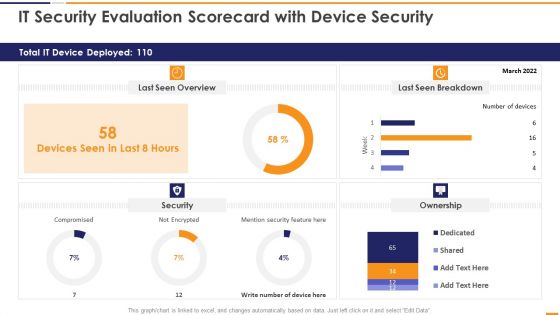
IT Security Evaluation Scorecard With Device Security Ppt Slides Good PDF
This graph or chart is linked to excel, and changes automatically based on data. Just left click on it and select Edit Data. Deliver an awe inspiring pitch with this creative IT Security Evaluation Scorecard With Device Security Ppt Slides Good PDF bundle. Topics like Total IT Device, Last Seen Overview, Last Seen Breakdown, Mention Security Feature can be discussed with this completely editable template. It is available for immediate download depending on the needs and requirements of the user.

 Home
Home