Data Icon
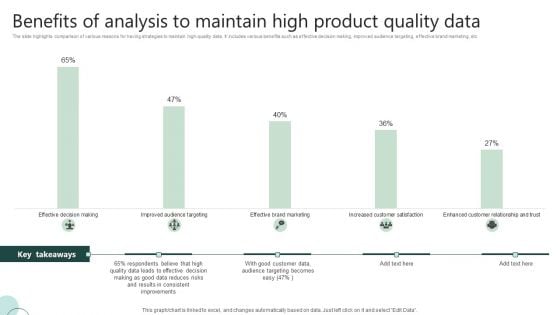
Benefits Of Analysis To Maintain High Product Quality Data Ppt Portfolio Gallery PDF
The slide highlights comparison of various reasons for having strategies to maintain high-quality data. It includes various benefits such as effective decision making, improved audience targeting, effective brand marketing, etc. Showcasing this set of slides titled Benefits Of Analysis To Maintain High Product Quality Data Ppt Portfolio Gallery PDF. The topics addressed in these templates are Effective Decision, Quality Data Leads, Good Customer Data. All the content presented in this PPT design is completely editable. Download it and make adjustments in color, background, font etc. as per your unique business setting.
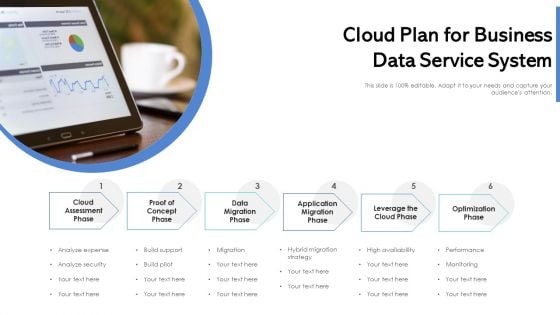
Cloud Plan For Business Data Service System Ppt Infographics Portfolio PDF
Presenting cloud plan for business data service system ppt infographics portfolio pdf to dispense important information. This template comprises six stages. It also presents valuable insights into the topics including data migration phase, application migration phase, cloud assessment phase. This is a completely customizable PowerPoint theme that can be put to use immediately. So, download it and address the topic impactfully.
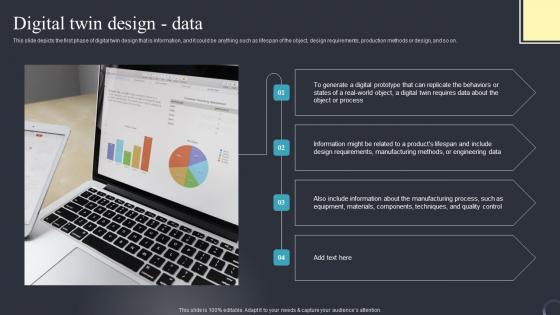
Digital Twin Design Data Industrial Transformation Using Digital Twin Download Pdf
This slide depicts the first phase of digital twin design that is information, and it could be anything such as lifespan of the object, design requirements, production methods or design, and so on. If your project calls for a presentation, then Slidegeeks is your go to partner because we have professionally designed, easy to edit templates that are perfect for any presentation. After downloading, you can easily edit Digital Twin Design Data Industrial Transformation Using Digital Twin Download Pdf and make the changes accordingly. You can rearrange slides or fill them with different images. Check out all the handy templates This slide depicts the first phase of digital twin design that is information, and it could be anything such as lifespan of the object, design requirements, production methods or design, and so on.
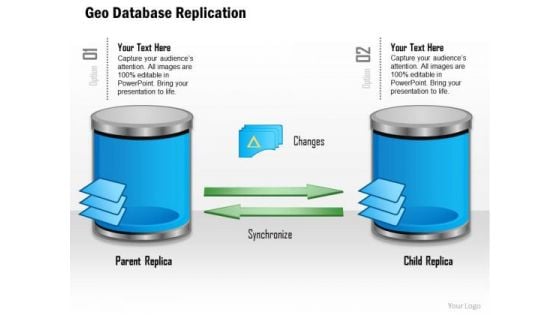
1 Replication Of Data From Primary To Replica With Changes Being Sent Over Network Ppt Slides
Explain the concept of parent and child replica in data replication theory with this Powerpoint image slide. This PPT slide contains the graphic of data replication in network. Display this concept in network technology related presentation by using this PPT slide.
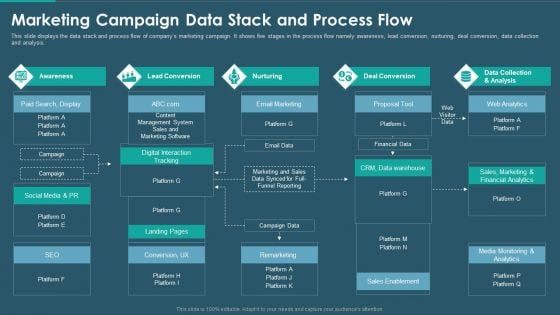
Sales And Promotion Playbook Marketing Campaign Data Stack And Process Flow Diagrams PDF
This slide displays the data stack and process flow of companys marketing campaign. It shows five stages in the process flow namely awareness, lead conversion, nurturing, deal conversion, data collection and analysis. Deliver and pitch your topic in the best possible manner with this sales and promotion playbook marketing campaign data stack and process flow diagrams pdf. Use them to share invaluable insights on deal conversion, data collection, lead conversion, awareness and impress your audience. This template can be altered and modified as per your expectations. So, grab it now.
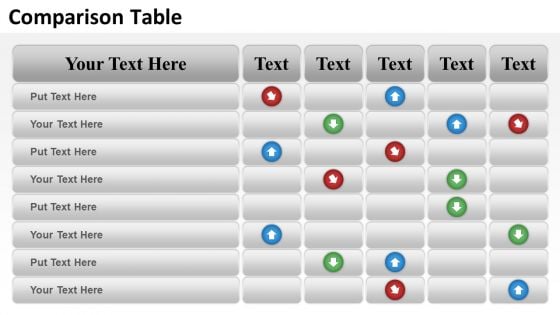
Mba Models And Frameworks Comparison Table Of Business Data Business Diagram
Be A Donor Of Great Ideas. Display Your Charity On Our MBA Models And Frameworks Comparison Table Of Business Data Business Diagram Powerpoint Templates.

Cloud Security Assessment Cloud Security Checklist Backup And Data Recovery Diagrams PDF
This slide represents the importance of data backup and data recovery in cloud security. It also shows how organizations should know about the data backup policies of service providers before investing in them. Presenting Cloud Security Assessment Cloud Security Checklist Backup And Data Recovery Diagrams PDF to provide visual cues and insights. Share and navigate important information on three stages that need your due attention. This template can be used to pitch topics like Service Provider, Effective Plans, Natural Disasters In addtion, this PPT design contains high resolution images, graphics, etc, that are easily editable and available for immediate download.
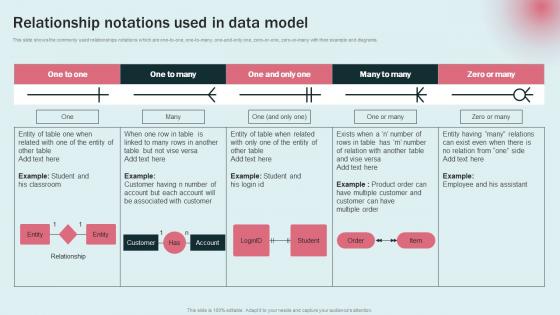
Relationship Notations Used Data Modeling Approaches For Modern Analytics Pictures Pdf
This slide shows the commonly used relationships notations which are one to one, one to many, one and only one, zero or one, zero or many with their example and diagrams. The Relationship Notations Used Data Modeling Approaches For Modern Analytics Pictures Pdf is a compilation of the most recent design trends as a series of slides. It is suitable for any subject or industry presentation, containing attractive visuals and photo spots for businesses to clearly express their messages. This template contains a variety of slides for the user to input data, such as structures to contrast two elements, bullet points, and slides for written information. Slidegeeks is prepared to create an impression. This slide shows the commonly used relationships notations which are one to one, one to many, one and only one, zero or one, zero or many with their example and diagrams.
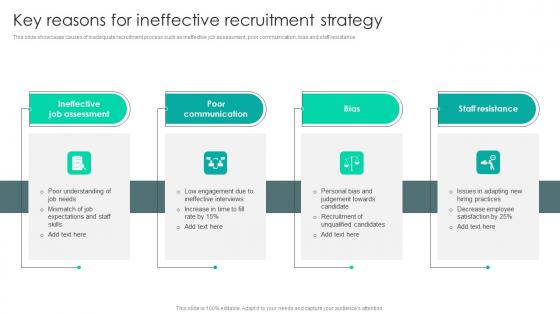
Strategic Staffing Using Data Key Reasons For Ineffective Recruitment Strategy CRP DK SS V
This slide showcases causes of inadequate recruitment process such as ineffective job assessment, poor communication, bias and staff resistance. Are you searching for a Strategic Staffing Using Data Key Reasons For Ineffective Recruitment Strategy CRP DK SS V that is uncluttered, straightforward, and original Its easy to edit, and you can change the colors to suit your personal or business branding. For a presentation that expresses how much effort you have put in, this template is ideal With all of its features, including tables, diagrams, statistics, and lists, its perfect for a business plan presentation. Make your ideas more appealing with these professional slides. Download Strategic Staffing Using Data Key Reasons For Ineffective Recruitment Strategy CRP DK SS V from Slidegeeks today. This slide showcases causes of inadequate recruitment process such as ineffective job assessment, poor communication, bias and staff resistance.
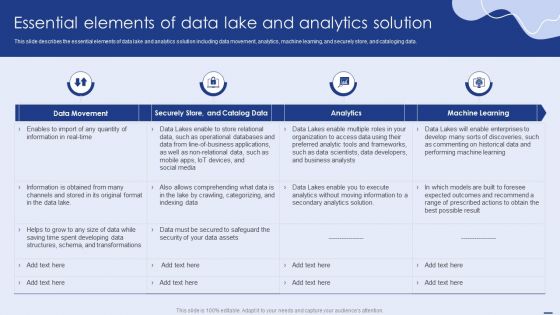
Essential Elements Of Data Lake And Analytics Solution Ppt PowerPoint Presentation File Diagrams PDF
This slide describes the essential elements of data lake and analytics solution including data movement, analytics, machine learning, and securely store, and cataloging data. This Essential Elements Of Data Lake And Analytics Solution Ppt PowerPoint Presentation File Diagrams PDF is perfect for any presentation, be it in front of clients or colleagues. It is a versatile and stylish solution for organizing your meetings. The product features a modern design for your presentation meetings. The adjustable and customizable slides provide unlimited possibilities for acing up your presentation. Slidegeeks has done all the homework before launching the product for you. So, do not wait, grab the presentation templates today.
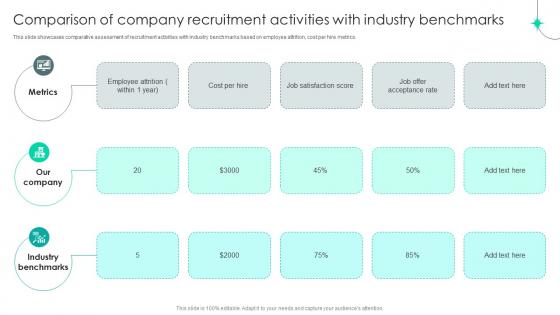
Strategic Staffing Using Data Comparison Of Company Recruitment Activities CRP DK SS V
This slide showcases comparative assessment of recruitment activities with industry benchmarks based on employee attrition, cost per hire metrics. If you are looking for a format to display your unique thoughts, then the professionally designed Strategic Staffing Using Data Comparison Of Company Recruitment Activities CRP DK SS V is the one for you. You can use it as a Google Slides template or a PowerPoint template. Incorporate impressive visuals, symbols, images, and other charts. Modify or reorganize the text boxes as you desire. Experiment with shade schemes and font pairings. Alter, share or cooperate with other people on your work. Download Strategic Staffing Using Data Comparison Of Company Recruitment Activities CRP DK SS V and find out how to give a successful presentation. Present a perfect display to your team and make your presentation unforgettable. This slide showcases comparative assessment of recruitment activities with industry benchmarks based on employee attrition, cost per hire metrics.
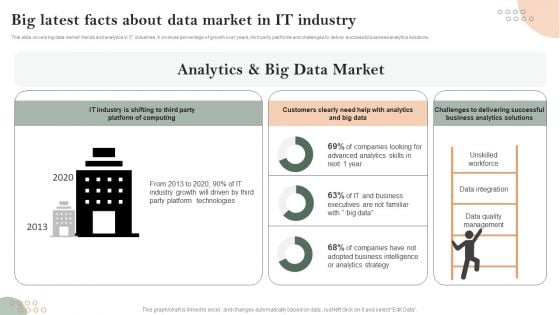
Big Latest Facts About Data Market In IT Industry Pictures PDF
This slide covers big data market trends and analytics in IT industries. It involves percentage of growth over years, third party platforms and challenges to deliver successful business analytics solutions. Showcasing this set of slides titled Big Latest Facts About Data Market In IT Industry Pictures PDF. The topics addressed in these templates are Unskilled Workforce, Data Integration, Data Quality Management. All the content presented in this PPT design is completely editable. Download it and make adjustments in color, background, font etc. as per your unique business setting.
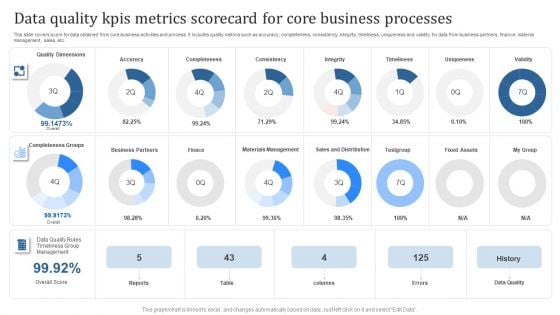
Data Quality Kpis Metrics Scorecard For Core Business Processes Topics PDF
This slide covers score for data obtained from core business activities and process. It includes quality metrics such as accuracy, completeness, consistency, integrity, timeliness, uniqueness and validity for data from business partners, finance, material management, sales, etc. Showcasing this set of slides titled Data Quality Kpis Metrics Scorecard For Core Business Processes Topics PDF. The topics addressed in these templates are Data Quality, Errors, Reports. All the content presented in this PPT design is completely editable. Download it and make adjustments in color, background, font etc. as per your unique business setting.
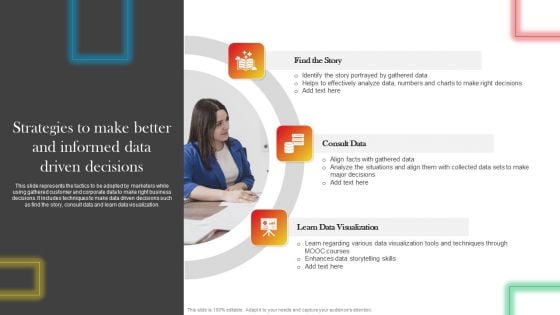
Strategies To Make Better And Informed Data Driven Decisions Introduction PDF
This slide represents the tactics to be adopted by marketers while using gathered customer and corporate data to make right business decisions. It includes techniques to make data driven decisions such as find the story, consult data and learn data visualization. Are you searching for a Strategies To Make Better And Informed Data Driven Decisions Introduction PDF that is uncluttered, straightforward, and original Its easy to edit, and you can change the colors to suit your personal or business branding. For a presentation that expresses how much effort you have put in, this template is ideal With all of its features, including tables, diagrams, statistics, and lists, its perfect for a business plan presentation. Make your ideas more appealing with these professional slides. Download Strategies To Make Better And Informed Data Driven Decisions Introduction PDF from Slidegeeks today.
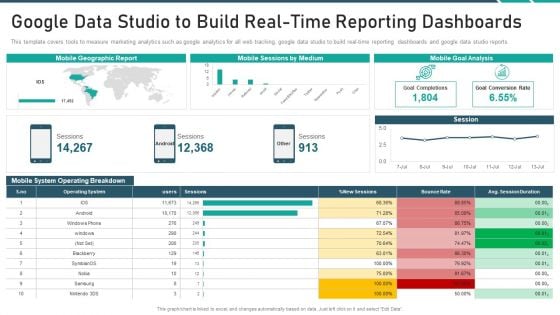
Online Promotion Playbook Google Data Studio To Build Real Time Reporting Dashboards Topics PDF
This template covers tools to measure marketing analytics such as google analytics for all web tracking, google data studio to build real time reporting dashboards and google data studio reports. Deliver and pitch your topic in the best possible manner with this online promotion playbook google data studio to build real time reporting dashboards topics pdf. Use them to share invaluable insights on google data studio to build real time reporting dashboards and impress your audience. This template can be altered and modified as per your expectations. So, grab it now.
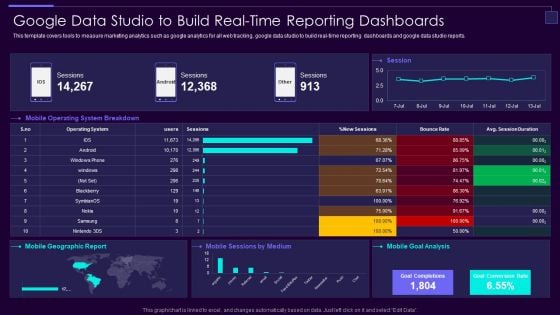
Social Media Brand Promotion Instructions Playbook Google Data Studio To Build Real Time Formats PDF
This template covers tools to measure marketing analytics such as google analytics for all web tracking, google data studio to build real-time reporting dashboards and google data studio reports.Deliver and pitch your topic in the best possible manner with this Social Media Brand Promotion Instructions Playbook Google Data Studio To Build Real Time Formats PDF Use them to share invaluable insights on Data Studio, Build Real Time, Reporting Dashboards and impress your audience. This template can be altered and modified as per your expectations. So, grab it now.

Impact Of Hr Analysis On Organizational Cost Analysing Hr Data For Effective Decision Making
This slide graphically provides information about the impact of HR analysis on the cost that helps organizations to increase profits and improve competitiveness. It includes four quarters and a cost comparison of two years. Here you can discover an assortment of the finest PowerPoint and Google Slides templates. With these templates, you can create presentations for a variety of purposes while simultaneously providing your audience with an eye-catching visual experience. Download Impact Of Hr Analysis On Organizational Cost Analysing Hr Data For Effective Decision Making to deliver an impeccable presentation. These templates will make your job of preparing presentations much quicker, yet still, maintain a high level of quality. Slidegeeks has experienced researchers who prepare these templates and write high-quality content for you. Later on, you can personalize the content by editing the Impact Of Hr Analysis On Organizational Cost Analysing Hr Data For Effective Decision Making. This slide graphically provides information about the impact of HR analysis on the cost that helps organizations to increase profits and improve competitiveness. It includes four quarters and a cost comparison of two years.
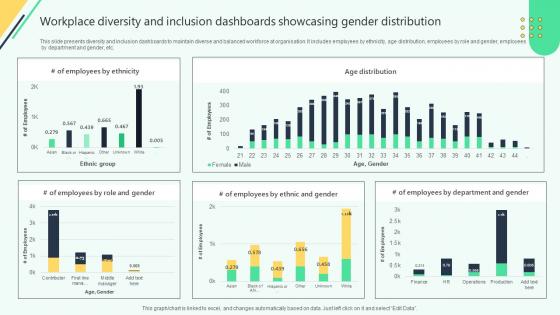
Workplace Diversity And Inclusion Dashboards Analysing Hr Data For Effective Decision Making
This slide presents diversity and inclusion dashboards to maintain diverse and balanced workforce at organisation. It includes employees by ethnicity, age distribution, employees by role and gender, employees by department and gender, etc. Whether you have daily or monthly meetings, a brilliant presentation is necessary. Workplace Diversity And Inclusion Dashboards Analysing Hr Data For Effective Decision Making can be your best option for delivering a presentation. Represent everything in detail using Workplace Diversity And Inclusion Dashboards Analysing Hr Data For Effective Decision Making and make yourself stand out in meetings. The template is versatile and follows a structure that will cater to your requirements. All the templates prepared by Slidegeeks are easy to download and edit. Our research experts have taken care of the corporate themes as well. So, give it a try and see the results. This slide presents diversity and inclusion dashboards to maintain diverse and balanced workforce at organisation. It includes employees by ethnicity, age distribution, employees by role and gender, employees by department and gender, etc.
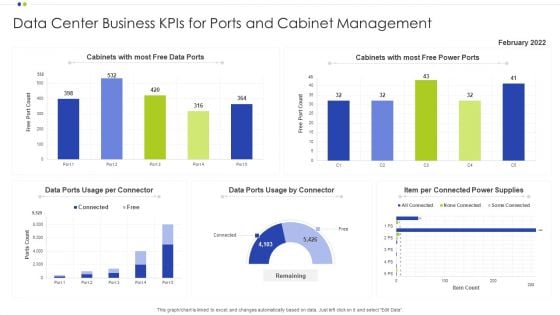
Data Center Business Kpis For Ports And Cabinet Management Ppt Diagram Ppt PDF
Showcasing this set of slides titled Data Center Business Kpis For Ports And Cabinet Management Ppt Diagram Ppt PDF. The topics addressed in these templates are Cabinet Management, Data Center Business, Power Supplies. All the content presented in this PPT design is completely editable. Download it and make adjustments in color, background, font etc. as per your unique business setting.
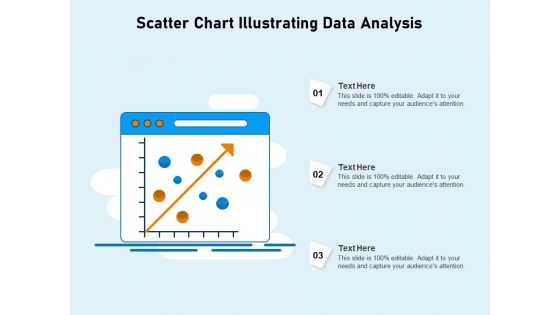
Scatter Chart Illustrating Data Analysis Ppt PowerPoint Presentation Show Graphic Tips PDF
Presenting scatter chart illustrating data analysis ppt powerpoint presentation show graphic tips pdf to dispense important information. This template comprises three stages. It also presents valuable insights into the topics including scatter chart illustrating data analysis. This is a completely customizable PowerPoint theme that can be put to use immediately. So, download it and address the topic impactfully.
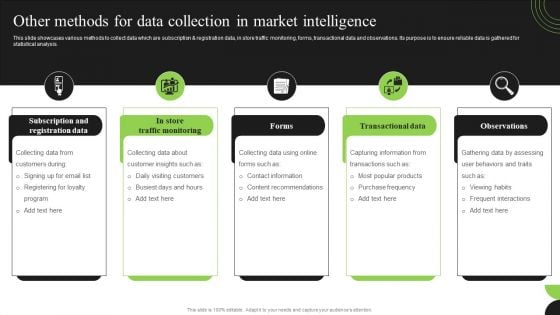
Guidebook For Executing Business Market Intelligence Other Methods For Data Collection Demonstration PDF
This slide showcases various methods to collect data which are subscription and registration data, in store traffic monitoring, forms, transactional data and observations. Its purpose is to ensure reliable data is gathered for statistical analysis. Are you searching for a Guidebook For Executing Business Market Intelligence Other Methods For Data Collection Demonstration PDF that is uncluttered, straightforward, and original Its easy to edit, and you can change the colors to suit your personal or business branding. For a presentation that expresses how much effort you have put in, this template is ideal With all of its features, including tables, diagrams, statistics, and lists, its perfect for a business plan presentation. Make your ideas more appealing with these professional slides. Download Guidebook For Executing Business Market Intelligence Other Methods For Data Collection Demonstration PDF from Slidegeeks today.
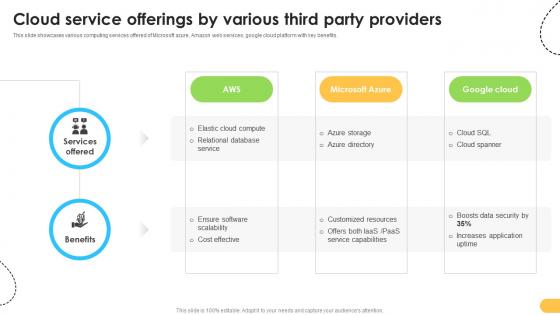
Cloud Service Offerings By Various Third Party Providers Data Migration From On Premises
This slide showcases various computing services offered of Microsoft azure, Amazon web services, google cloud platform with key benefits. Whether you have daily or monthly meetings, a brilliant presentation is necessary. Cloud Service Offerings By Various Third Party Providers Data Migration From On Premises can be your best option for delivering a presentation. Represent everything in detail using Cloud Service Offerings By Various Third Party Providers Data Migration From On Premises and make yourself stand out in meetings. The template is versatile and follows a structure that will cater to your requirements. All the templates prepared by Slidegeeks are easy to download and edit. Our research experts have taken care of the corporate themes as well. So, give it a try and see the results. This slide showcases various computing services offered of Microsoft azure, Amazon web services, google cloud platform with key benefits.
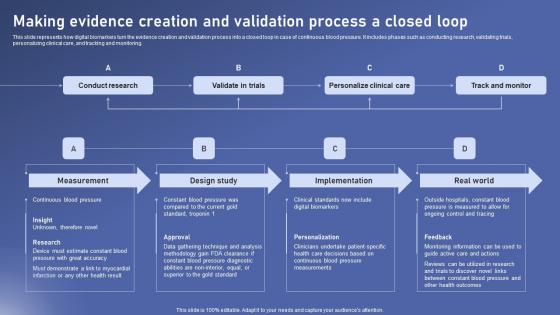
Making Evidence Creation Biomedical Data Science And Health Informatics Professional Pdf
This slide represents how digital biomarkers turn the evidence creation and validation process into a closed loop in case of continuous blood pressure. It includes phases such as conducting research, validating trials, personalizing clinical care, and tracking and monitoring. Take your projects to the next level with our ultimate collection of Making Evidence Creation Biomedical Data Science And Health Informatics Professional Pdf. Slidegeeks has designed a range of layouts that are perfect for representing task or activity duration, keeping track of all your deadlines at a glance. Tailor these designs to your exact needs and give them a truly corporate look with your own brand colors they will make your projects stand out from the rest This slide represents how digital biomarkers turn the evidence creation and validation process into a closed loop in case of continuous blood pressure. It includes phases such as conducting research, validating trials, personalizing clinical care, and tracking and monitoring.
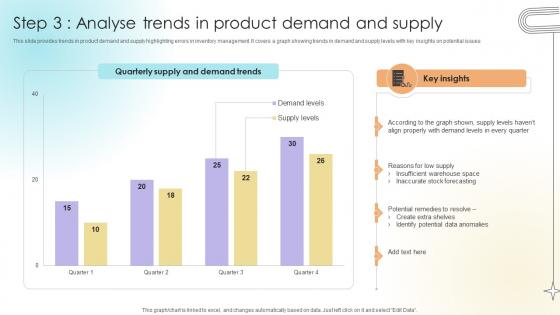
Step 3 Analyse Trends In Product Demand And Supply Data Analytics SS V
This slide provides trends in product demand and supply highlighting errors in inventory management. It covers a graph showing trends in demand and supply levels with key insights on potential issues.Formulating a presentation can take up a lot of effort and time, so the content and message should always be the primary focus. The visuals of the PowerPoint can enhance the presenters message, so our Step 3 Analyse Trends In Product Demand And Supply Data Analytics SS V was created to help save time. Instead of worrying about the design, the presenter can concentrate on the message while our designers work on creating the ideal templates for whatever situation is needed. Slidegeeks has experts for everything from amazing designs to valuable content, we have put everything into Step 3 Analyse Trends In Product Demand And Supply Data Analytics SS V. This slide provides trends in product demand and supply highlighting errors in inventory management. It covers a graph showing trends in demand and supply levels with key insights on potential issues.
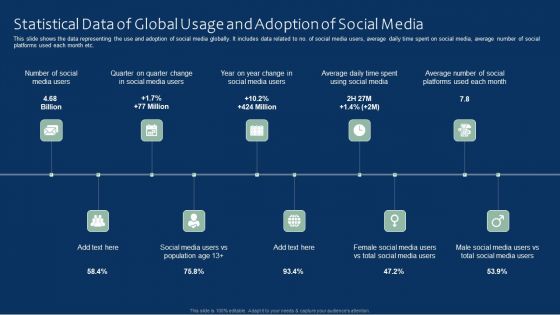
Statistical Data Of Global Usage And Adoption Of Social Media Microsoft PDF
This slide shows the data representing the use and adoption of social media globally. It includes data related to no. of social media users, average daily time spent on social media, average number of social platforms used each month etc. Presenting Statistical Data Of Global Usage And Adoption Of Social Media Microsoft PDF to dispense important information. This template comprises ten stages. It also presents valuable insights into the topics including Social Media, Average, Statistical Data Of Global. This is a completely customizable PowerPoint theme that can be put to use immediately. So, download it and address the topic impactfully.
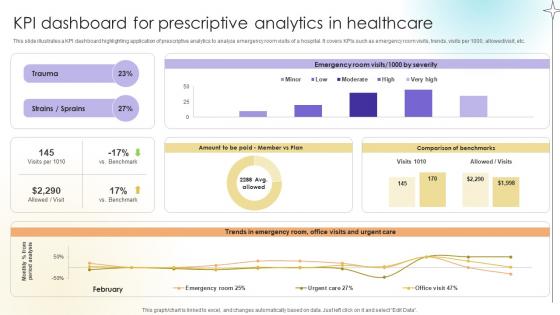
KPI Dashboard For Prescriptive Analytics In Healthcare Data Analytics SS V
This slide illustrates a KPI dashboard highlighting application of prescriptive analytics to analyze emergency room visits of a hospital. It covers KPIs such as emergency room visits, trends, visits per 1000, allowed or visit, etc. Find highly impressive KPI Dashboard For Prescriptive Analytics In Healthcare Data Analytics SS V on Slidegeeks to deliver a meaningful presentation. You can save an ample amount of time using these presentation templates. No need to worry to prepare everything from scratch because Slidegeeks experts have already done a huge research and work for you. You need to download KPI Dashboard For Prescriptive Analytics In Healthcare Data Analytics SS V for your upcoming presentation. All the presentation templates are 100 percent editable and you can change the color and personalize the content accordingly. Download now This slide illustrates a KPI dashboard highlighting application of prescriptive analytics to analyze emergency room visits of a hospital. It covers KPIs such as emergency room visits, trends, visits per 1000, allowed or visit, etc.
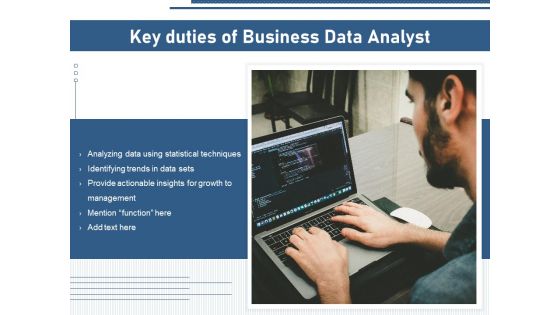
Key Duties Of Business Data Analyst Ppt PowerPoint Presentation Gallery Rules PDF
Presenting key duties of business data analyst ppt powerpoint presentation gallery rules pdf to dispense important information. This template comprises one stages. It also presents valuable insights into the topics including analyzing data using statistical techniques, identifying trends in data sets, provide actionable insights for growth to management, mention function. This is a completely customizable PowerPoint theme that can be put to use immediately. So, download it and address the topic impactfully.
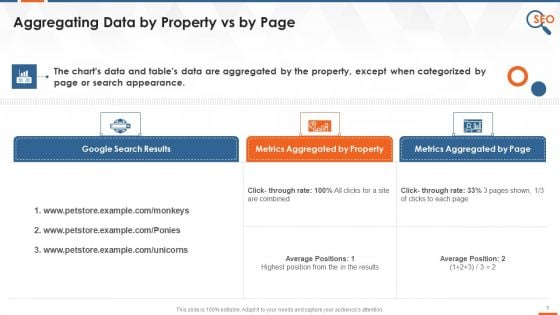
Aggregating Data By Property Vs By Page In Google Search Console Training Ppt
This slide covers details about how The charts and tables data are aggregated by the property, except when categorized by page or search appearance.
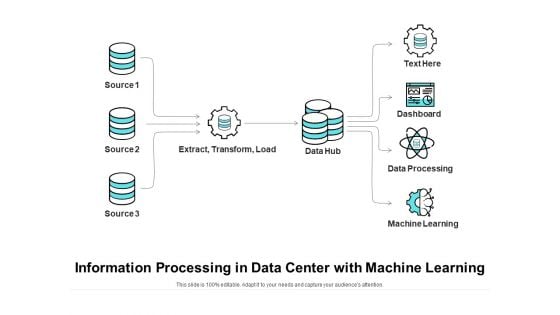
Information Processing In Data Center With Machine Learning Ppt PowerPoint Presentation File Infographic Template PDF
Presenting information processing in data center with machine learning ppt powerpoint presentation file infographic template pdf. to dispense important information. This template comprises three stages. It also presents valuable insights into the topics including extract, transform, load, data processing, dashboard, machine learning, data hub. This is a completely customizable PowerPoint theme that can be put to use immediately. So, download it and address the topic impactfully.
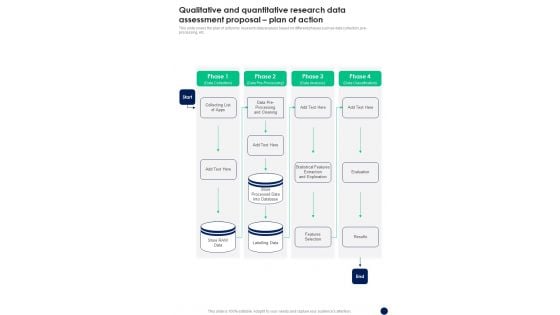
Qualitative And Quantitative Research Data Assessment Proposal Plan Of Action One Pager Sample Example Document
This slide covers the plan of action for research data analysis based on different phases such as data collection, pre- processing, etc. Presenting you an exemplary Qualitative And Quantitative Research Data Assessment Proposal Plan Of Action One Pager Sample Example Document. Our one pager comprises all the must have essentials of an inclusive document. You can edit it with ease, as its layout is completely editable. With such freedom, you can tweak its design and other elements to your requirements. Download this Qualitative And Quantitative Research Data Assessment Proposal Plan Of Action One Pager Sample Example Document brilliant piece now.
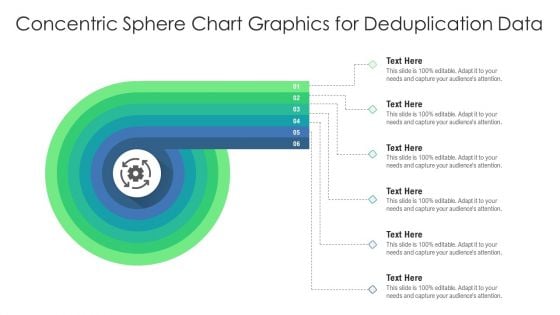
Concentric Sphere Chart Graphics For Deduplication Data Ppt Portfolio Inspiration PDF
Presenting concentric sphere chart graphics for deduplication data ppt portfolio inspiration pdf to dispense important information. This template comprises six stages. It also presents valuable insights into the topics including concentric sphere chart graphics for deduplication data. This is a completely customizable PowerPoint theme that can be put to use immediately. So, download it and address the topic impactfully.
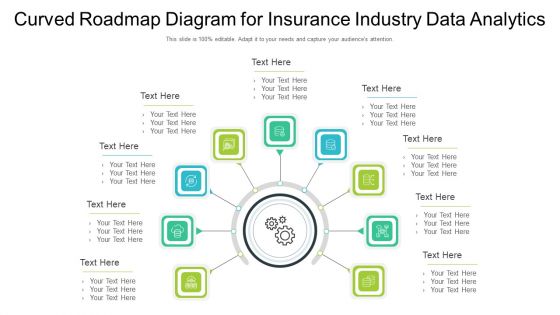
Curved Roadmap Diagram For Insurance Industry Data Analytics Ppt PowerPoint Presentation File Diagrams PDF
Presenting curved roadmap diagram for insurance industry data analytics ppt powerpoint presentation file diagrams pdf to dispense important information. This template comprises nine stages. It also presents valuable insights into the topics including curved roadmap diagram for insurance industry data analytics. This is a completely customizable PowerPoint theme that can be put to use immediately. So, download it and address the topic impactfully.
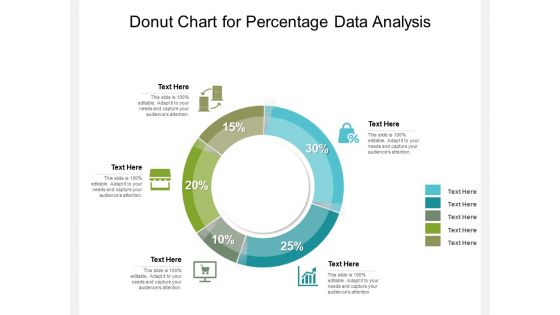
Donut Chart For Percentage Data Analysis Ppt PowerPoint Presentation Gallery Slides PDF
Showcasing this set of slides titled donut chart for percentage data analysis ppt powerpoint presentation gallery slides pdf. The topics addressed in these templates are donut chart for percentage data analysis. All the content presented in this PPT design is completely editable. Download it and make adjustments in color, background, font etc. as per your unique business setting.
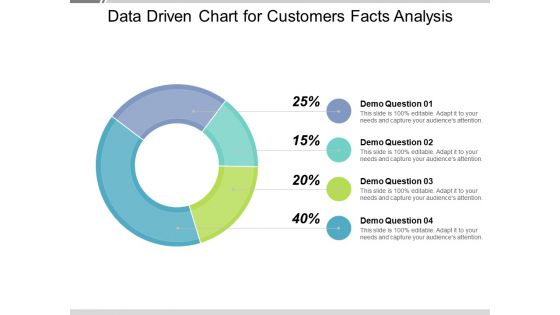
Data Driven Chart For Customers Facts Analysis Ppt PowerPoint Presentation Outline Ideas PDF
Presenting this set of slides with name data driven chart for customers facts analysis ppt powerpoint presentation outline ideas pdf. The topics discussed in these slide is data driven chart for customers facts analysis. This is a completely editable PowerPoint presentation and is available for immediate download. Download now and impress your audience.
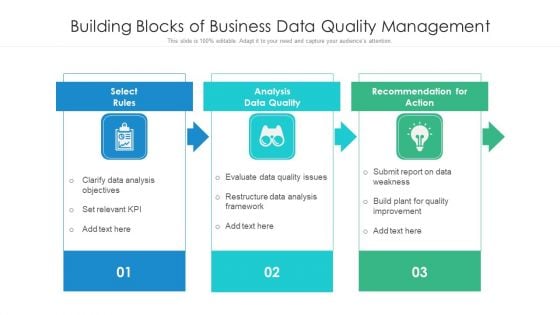
Building Blocks Of Business Data Quality Management Ppt PowerPoint Presentation Outline Samples PDF
Presenting building blocks of business data quality management ppt powerpoint presentation outline samples pdf to dispense important information. This template comprises three stages. It also presents valuable insights into the topics including data analysis objectives, analysis data quality, build plant for quality improvement. This is a completely customizable PowerPoint theme that can be put to use immediately. So, download it and address the topic impactfully.
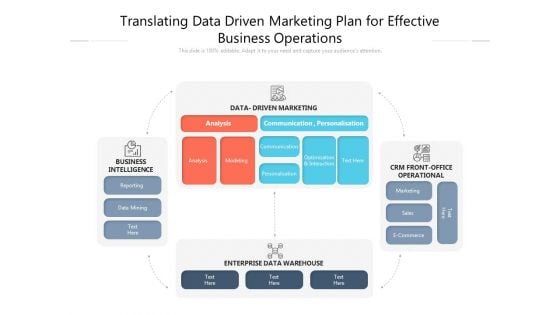
Translating Data Driven Marketing Plan For Effective Business Operations Ppt PowerPoint Presentation Ideas Visuals PDF
Presenting translating data driven marketing plan for effective business operations ppt powerpoint presentation ideas visuals pdf to dispense important information. This template comprises four stages. It also presents valuable insights into the topics including data driven marketing, crm front office operational, analysis, modeling, business intelligence, enterprise data warehouse. This is a completely customizable PowerPoint theme that can be put to use immediately. So, download it and address the topic impactfully.
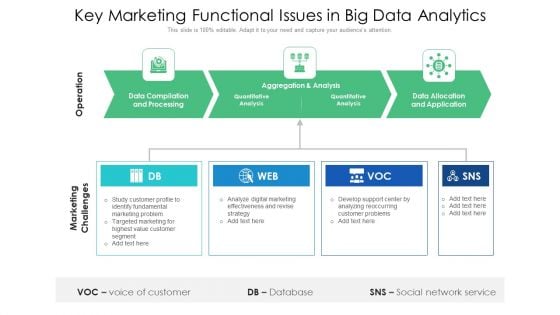
Key Marketing Functional Issues In Big Data Analytics Ppt PowerPoint Presentation Show Aids PDF
Presenting key marketing functional issues in big data analytics ppt powerpoint presentation show aids pdf to dispense important information. This template comprises three stages. It also presents valuable insights into the topics including data compilation and processing, aggregation and analysis, data allocation and application. This is a completely customizable PowerPoint theme that can be put to use immediately. So, download it and address the topic impactfully.
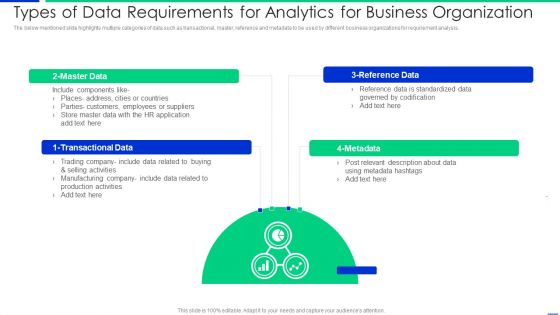
Types Of Data Requirements For Analytics For Business Organization Microsoft PDF
The below mentioned slide highlights multiple categories of data such as transactional, master, reference and metadata to be used by different business organizations for requirement analysis. Presenting types of data requirements for analytics for business organization microsoft pdf to dispense important information. This template comprises four stages. It also presents valuable insights into the topics including data, suppliers, application. This is a completely customizable PowerPoint theme that can be put to use immediately. So, download it and address the topic impactfully.
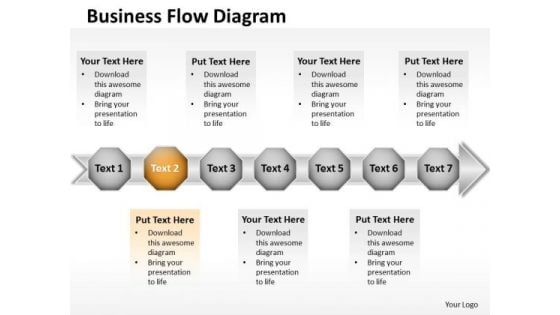
Ppt 7 Beeline Power Point Stage Business PowerPoint Theme Data Flow Diagram Templates
PPT 7 beeline power point stage business PowerPoint theme data flow diagram Templates-This PowerPoint Diagram shows Horizontal Demonstration through seven hexagonal boxes on the arrow pointing towards east direction signifying his completion of the process and leading towards success. This image has been conceived to enable you to emphatically communicate your ideas in your Business PPT presentations-PPT 7 beeline power point stage business PowerPoint theme data flow diagram Templates-arrow, art, assess, blue, business, chart, chevron, clip, clipart, colorful, compliance, corporate, design, development, diagram, flow, glossy, graphic, hierarchy, icon, illustration, implement, info graphic, levels, marketing, modern, plan, process, shape, shiny, square, stages, vector Influence decision makers with our Ppt 7 Beeline Power Point Stage Business PowerPoint Theme Data Flow Diagram Templates. Make sure your presentation gets the attention it deserves.
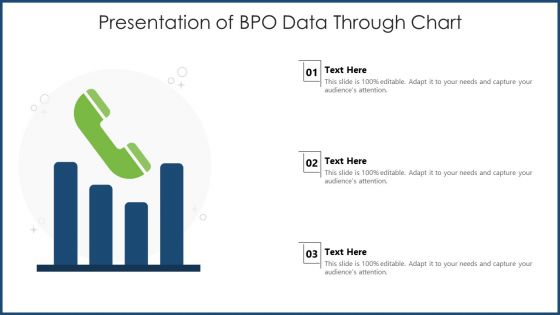
Presentation Of BPO Data Through Chart Ppt Pictures Design Inspiration PDF
Pitch your topic with ease and precision using this presentation of bpo data through chart ppt pictures design inspiration pdf. This layout presents information on presentation of bpo data through chart. It is also available for immediate download and adjustment. So, changes can be made in the color, design, graphics or any other component to create a unique layout.
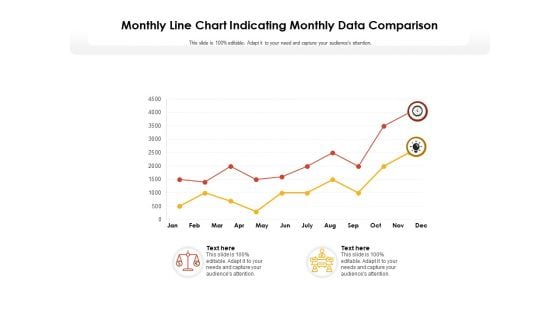
Monthly Line Chart Indicating Monthly Data Comparison Ppt PowerPoint Presentation Model Slide Portrait
Showcasing this set of slides titled monthly line chart indicating monthly data comparison ppt powerpoint presentation model slide portrait. The topics addressed in these templates are monthly line chart indicating monthly data comparison. All the content presented in this PPT design is completely editable. Download it and make adjustments in color, background, font etc. as per your unique business setting.
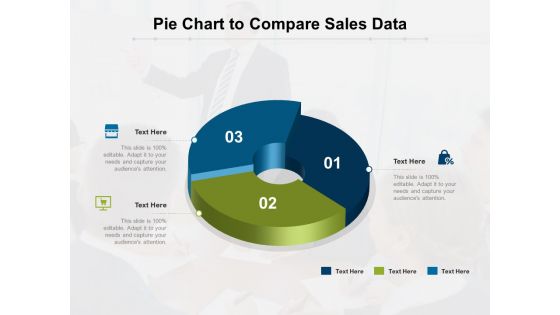
Pie Chart To Compare Sales Data Ppt PowerPoint Presentation Gallery Design Templates PDF
Showcasing this set of slides titled pie chart to compare sales data ppt powerpoint presentation gallery design templates pdf. The topics addressed in these templates are pie chart to compare sales data. All the content presented in this PPT design is completely editable. Download it and make adjustments in color, background, font etc. as per your unique business setting.
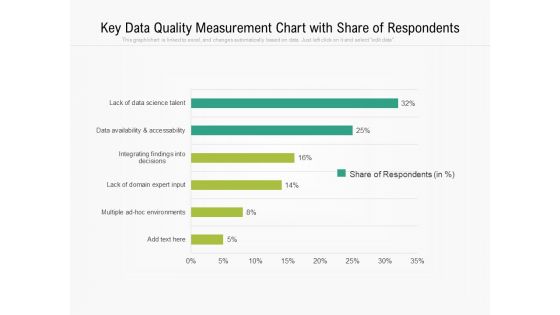
Key Data Quality Measurement Chart With Share Of Respondents Ppt PowerPoint Presentation Model Good PDF
Showcasing this set of slides titled key data quality measurement chart with share of respondents ppt powerpoint presentation model good pdf. The topics addressed in these templates are key data quality measurement chart with share of respondents. All the content presented in this PPT design is completely editable. Download it and make adjustments in color, background, font etc. as per your unique business setting.
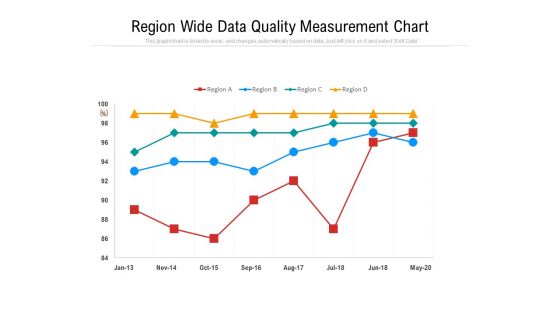
Region Wide Data Quality Measurement Chart Ppt PowerPoint Presentation Layouts Background Image PDF
Showcasing this set of slides titled region wide data quality measurement chart ppt powerpoint presentation layouts background image pdf. The topics addressed in these templates are region wide data quality measurement chart. All the content presented in this PPT design is completely editable. Download it and make adjustments in color, background, font etc. as per your unique business setting.
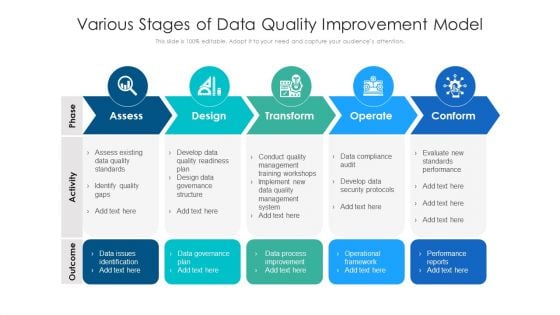
Various Stages Of Data Quality Improvement Model Ppt PowerPoint Presentation Infographic Template Graphics Download PDF
Presenting various stages of data quality improvement model ppt powerpoint presentation infographic template graphics download pdf to dispense important information. This template comprises five stages. It also presents valuable insights into the topics including data process improvement, develop data security, conduct quality management. This is a completely customizable PowerPoint theme that can be put to use immediately. So, download it and address the topic impactfully.
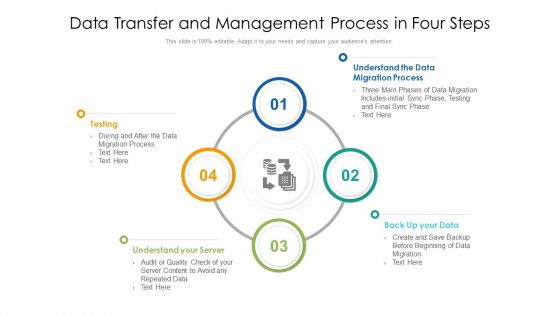
Data Transfer And Management Process In Four Steps Ppt PowerPoint Presentation Show Graphics PDF
Presenting data transfer and management process in four steps ppt powerpoint presentation show graphics pdf to dispense important information. This template comprises four stages. It also presents valuable insights into the topics including understand your server, back up your data, understand the data migration process. This is a completely customizable PowerPoint theme that can be put to use immediately. So, download it and address the topic impactfully.
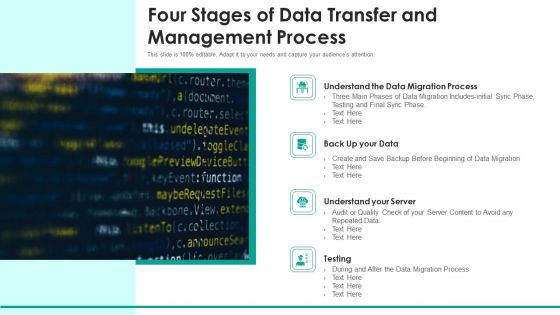
Four Stages Of Data Transfer And Management Process Ppt PowerPoint Presentation Outline Gallery PDF
Presenting four stages of data transfer and management process ppt powerpoint presentation outline gallery pdf to dispense important information. This template comprises four stages. It also presents valuable insights into the topics including understand the data migration process, back up your data, understand your server. This is a completely customizable PowerPoint theme that can be put to use immediately. So, download it and address the topic impactfully.
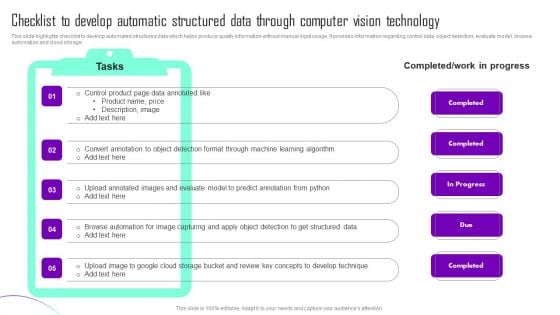
Checklist To Develop Automatic Structured Data Through Computer Vision Technology Graphics PDF
This slide highlights checklist to develop automated structured data which helps produce quality information without manual input usage. It provides information regarding control data, object detection, evaluate model, browse automation and cloud storage. Presenting Checklist To Develop Automatic Structured Data Through Computer Vision Technology Graphics PDF to dispense important information. This template comprises one stages. It also presents valuable insights into the topics including Control Product, Data Annotated Like, Convert Annotation Object Detection. This is a completely customizable PowerPoint theme that can be put to use immediately. So, download it and address the topic impactfully.
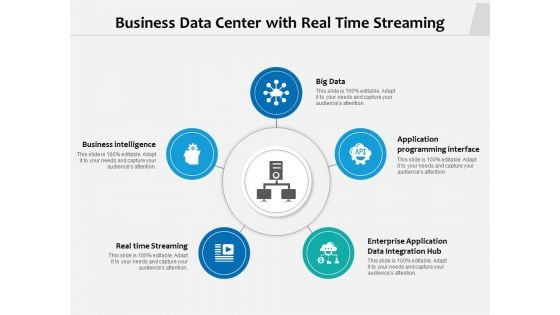
Business Data Center With Real Time Streaming Ppt PowerPoint Presentation Summary Tips PDF
Presenting business data center with real time streaming ppt powerpoint presentation summary tips pdf to dispense important information. This template comprises five stages. It also presents valuable insights into the topics including business intelligence, real time streaming, enterprise application data integration hub, application, big data. This is a completely customizable PowerPoint theme that can be put to use immediately. So, download it and address the topic impactfully.
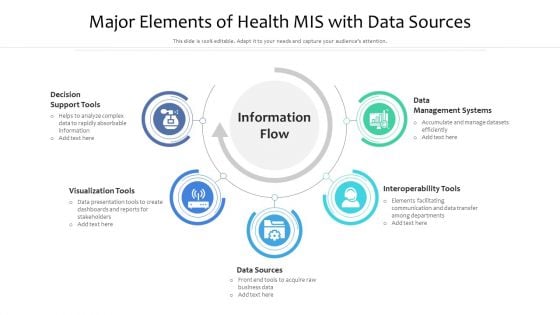
Major Elements Of Health MIS With Data Sources Ppt Summary Graphics Tutorials PDF
Presenting major elements of health mis with data sources ppt summary graphics tutorials pdf to dispense important information. This template comprises five stages. It also presents valuable insights into the topics including visualization tools, data sources, interoperability tools, data management systems, decision support tools. This is a completely customizable PowerPoint theme that can be put to use immediately. So, download it and address the topic impactfully.
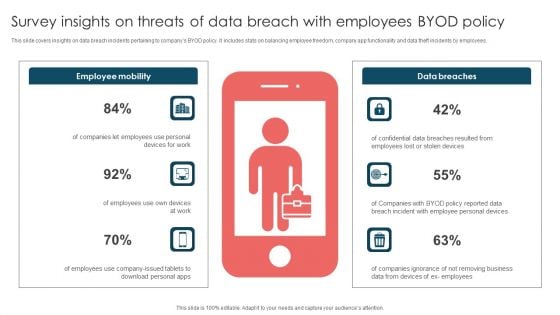
Survey Insights On Threats Of Data Breach With Employees Byod Policy Brochure PDF
This slide covers insights on data breach incidents pertaining to companys BYOD policy. It includes stats on balancing employee freedom, company app functionality and data theft incidents by employees. Presenting Survey Insights On Threats Of Data Breach With Employees Byod Policy Brochure PDF to dispense important information. This template comprises six stages. It also presents valuable insights into the topics including Employee Mobility, Data Breaches, Employees Use. This is a completely customizable PowerPoint theme that can be put to use immediately. So, download it and address the topic impactfully.
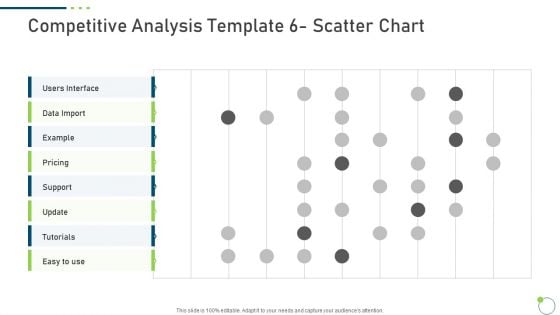
Investor Pitch Deck New Venture Capital Raising Competitive Analysis Template 6 Scatter Chart Data Sample PDF
Deliver and pitch your topic in the best possible manner with this investor pitch deck new venture capital raising competitive analysis template 6 scatter chart data sample pdf. Use them to share invaluable insights on pricing, tutorials, data import, support and impress your audience. This template can be altered and modified as per your expectations. So, grab it now.
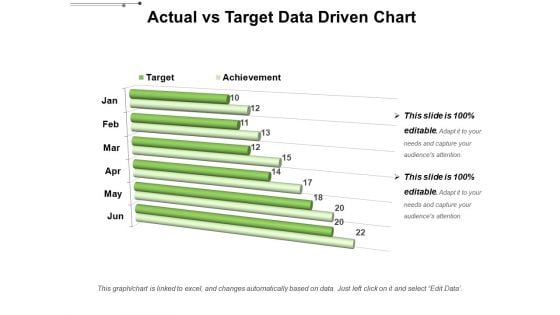
Actual Vs Target Data Driven Chart Ppt PowerPoint Presentation File Graphics PDF
Presenting this set of slides with name actual vs target data driven chart ppt powerpoint presentation file graphics pdf. The topics discussed in these slide is actual vs target data driven chart. This is a completely editable PowerPoint presentation and is available for immediate download. Download now and impress your audience.

Ppt Edit Data PowerPoint Chart Processing Cycle Diagram 4 State Templates
PPT edit data powerpoint chart processing cycle diagram 4 state Templates-The above template has the theme of circular process Diagram. This image refers the concept of Act Cycle. Adjust the above image in your PPT presentations to visually support your content in your business meetings. This PPT images is so perfectly designed that it make your clients understand the business idea quickly and visually.-PPT edit data powerpoint chart processing cycle diagram 4 state Templates-Arrow, Chart, Circular, Color, Colorful, Connect, Connection, Design, Diagram, Finance, Graphic, Group, Growth, Icon, Illustration, Marketing, Pieces, Process, Recycle, Recycling, Round, Set, Strategy, Symbol, Wheel Audience approval is always sought after. Our Ppt Edit Data PowerPoint Chart Processing Cycle Diagram 4 State Templates will fetch it for you.
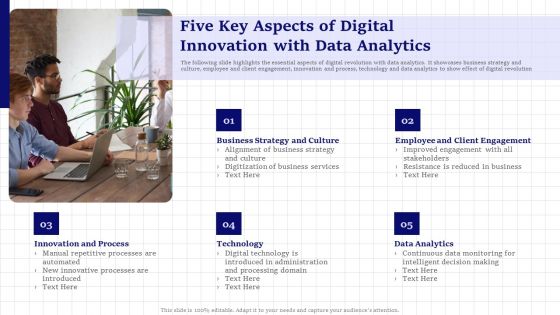
Five Key Aspects Of Digital Innovation With Data Analytics Brochure PDF
The following slide highlights the essential aspects of digital revolution with data analytics. It showcases business strategy and culture, employee and client engagement, innovation and process, technology and data analytics to show effect of digital revolution. Presenting Five Key Aspects Of Digital Innovation With Data Analytics Brochure PDF to dispense important information. This template comprises five stages. It also presents valuable insights into the topics including Innovation And Process, Technology, Data Analytics. This is a completely customizable PowerPoint theme that can be put to use immediately. So, download it and address the topic impactfully.
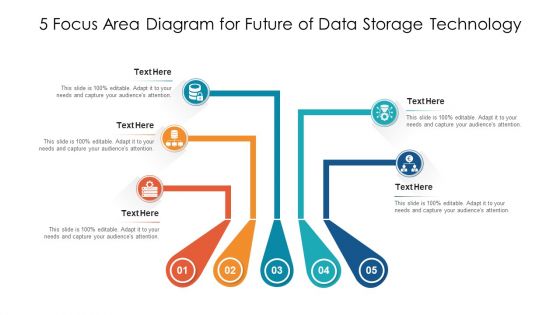
5 Focus Area Diagram For Future Of Data Storage Technology Ppt Deck PDF
Presenting 5 focus area diagram for future of data storage technology ppt deck pdf to dispense important information. This template comprises five stages. It also presents valuable insights into the topics including 5 focus area diagram for future of data storage technology. This is a completely customizable PowerPoint theme that can be put to use immediately. So, download it and address the topic impactfully.
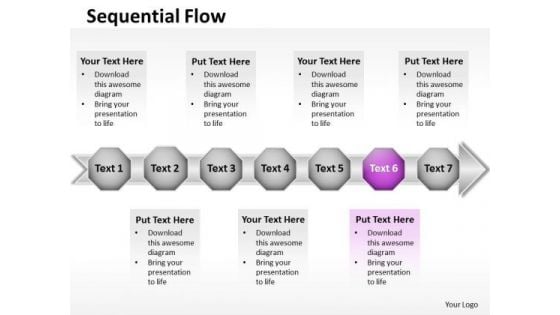
Ppt Pink Stage Business Data Flow Free Fishbone Diagram PowerPoint Template Templates
PPT pink stage business data flow free fishbone diagram PowerPoint template Templates-Arrows PowerPoint Diagram is nice for financial PowerPoint Diagram presentations as well as other analysis or business PowerPoint diagram needs. This image has been conceived to enable you to emphatically communicate your ideas in your Business PPT presentations.-PPT pink stage business data flow free fishbone diagram PowerPoint template Templates-arrow, art, assess, blue, business, chart, chevron, clip, clipart, colorful, compliance, corporate, design, development, diagram, flow, glossy, graphic, hierarchy, icon, illustration, implement, info graphic, levels, marketing, modern, plan, process, shape, shiny, square, stages, vector Add to your armoury with our Ppt Pink Stage Business Data Flow Free Fishbone Diagram PowerPoint Template Templates. Take up the contest with your thoughts.
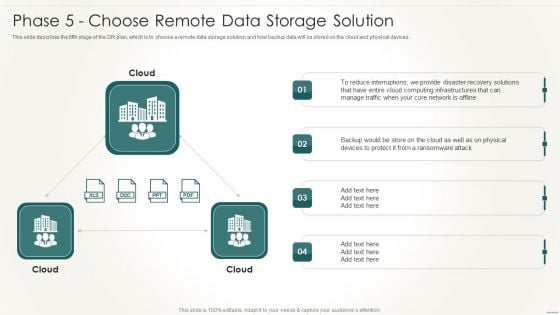
Information Technology Disaster Resilience Plan Phase 5 Choose Remote Data Storage Solution Slides PDF
This slide describes the fifth stage of the DR plan, which is to choose a remote data storage solution and how backup data will be stored on the cloud and physical devices.Deliver an awe inspiring pitch with this creative Information Technology Disaster Resilience Plan Phase 5 Choose Remote Data Storage Solution Slides PDF bundle. Topics like Reduce Interruptions, Computing Infrastructures, Ransomware Attack can be discussed with this completely editable template. It is available for immediate download depending on the needs and requirements of the user.
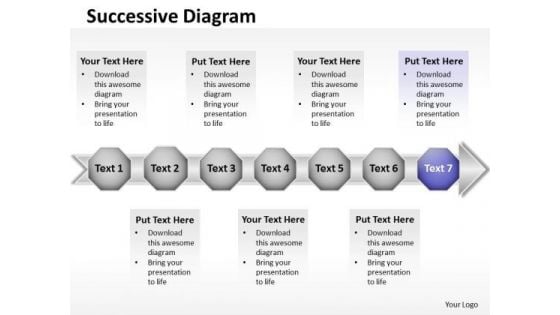
Ppt Purple Stage New Business PowerPoint Presentation Data Flow Diagram Templates
PPT purple stage new business PowerPoint presentation data flow diagram Templates-Develop competitive advantage with our above Diagram which contains a picture of seven hexagonal boxes on the arrow pointing towards the east direction. This image has been professionally designed to emphasize the concept of continuous process. Adjust the above image in your PPT presentations to visually support your content in your Business PPT slideshows.-PPT purple stage new business PowerPoint presentation data flow diagram Templates-arrow, art, assess, blue, business, chart, chevron, clip, clipart, colorful, compliance, corporate, design, development, diagram, flow, glossy, graphic, hierarchy, icon, illustration, implement, info graphic, levels, marketing, modern, plan, process, shape, shiny, square, stages, vector Subscribe to our Ppt Purple Stage New Business PowerPoint Presentation Data Flow Diagram Templates and receive success. Be assured of finding the best projection to highlight your words.
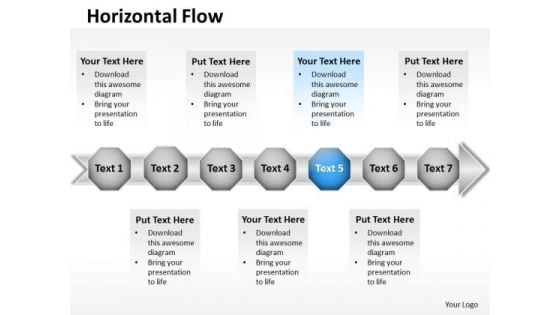
Ppt Blue Stage Business PowerPoint Templates Free Download Data Flow Diagram
PPT blue stage business PowerPoint templates free download data flow diagram-Use this sequentially based PowerPoint Diagram to represent seven different approaches combined to form a Linear Process. It portrays the concept of convert, reclaim, recondition, recover, recycle , redeem, regenerate, remodel, reoccupy, repossess, rescue, restore, retake, salvage etc.-PPT blue stage business PowerPoint templates free download data flow diagram-arrow, art, assess, blue, business, chart, chevron, clip, clipart, colorful, compliance, corporate, design, development, diagram, flow, glossy, graphic, hierarchy, icon, illustration, implement, info graphic, levels, marketing, modern, plan, process, shape, shiny, square, stages, vector Our content is a reliable partner. Team up with our Ppt Blue Stage Business PowerPoint Templates Free Download Data Flow Diagram. You'll always stay ahead of the game.


 Continue with Email

 Home
Home


