Data Icon
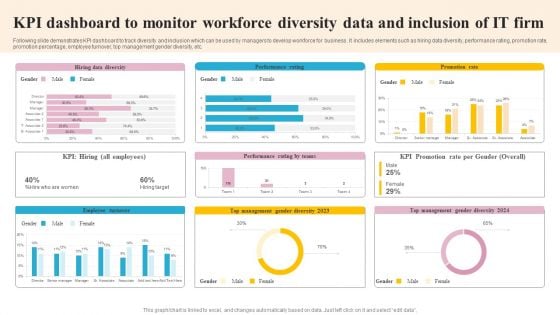
KPI Dashboard To Monitor Workforce Diversity Data And Inclusion Of IT Firm Slides PDF
Following slide demonstrates KPI dashboard to track diversity and inclusion which can be used by managers to develop workforce for business . It includes elements such as hiring data diversity, performance rating, promotion rate, promotion percentage, employee turnover, top management gender diversity, etc. Showcasing this set of slides titled KPI Dashboard To Monitor Workforce Diversity Data And Inclusion Of IT Firm Slides PDF. The topics addressed in these templates are Employee Turnover, Management, Promotion Rate. All the content presented in this PPT design is completely editable. Download it and make adjustments in color, background, font etc. as per your unique business setting.
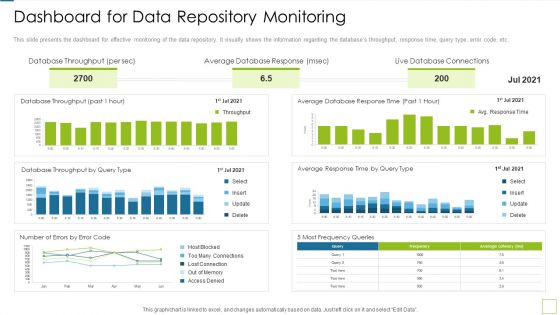
Database Expansion And Optimization Dashboard For Data Repository Monitoring Ppt Model Infographic Template
This slide presents the dashboard for effective monitoring of the data repository. It visually shows the information regarding the databases throughput, response time, query type, error code, etc. Deliver and pitch your topic in the best possible manner with this database expansion and optimization dashboard for data repository monitoring ppt model infographic template. Use them to share invaluable insights on database throughput, average database response, live database connections and impress your audience. This template can be altered and modified as per your expectations. So, grab it now.
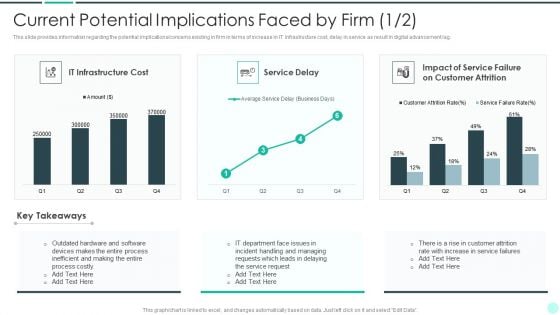
Executing Advance Data Analytics At Workspace Current Potential Implications Demonstration PDF
This slide provides information regarding the potential implications concerns existing in firm in terms of increase in issues related to employees such as lack of expertise, ineffectiveness in handling issues, reported financial losses due to financial threats and data breaches with records exposed. Deliver an awe inspiring pitch with this creative executing advance data analytics at workspace current potential implications demonstration pdf bundle. Topics like current potential implications faced by firm can be discussed with this completely editable template. It is available for immediate download depending on the needs and requirements of the user.
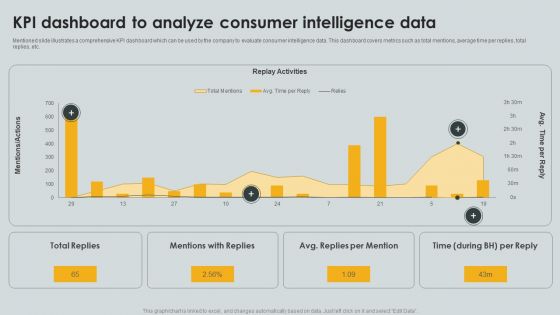
KPI Dashboard To Analyze Consumer Intelligence Data Ppt PowerPoint Presentation File Portfolio PDF
Mentioned slide illustrates a comprehensive KPI dashboard which can be used by the company to evaluate consumer intelligence data. This dashboard covers metrics such as total mentions, average time per replies, total replies, etc. Pitch your topic with ease and precision using this KPI Dashboard To Analyze Consumer Intelligence Data Ppt PowerPoint Presentation File Portfolio PDF. This layout presents information on Replay Activities, Total Replies, Mentions Replies. It is also available for immediate download and adjustment. So, changes can be made in the color, design, graphics or any other component to create a unique layout.
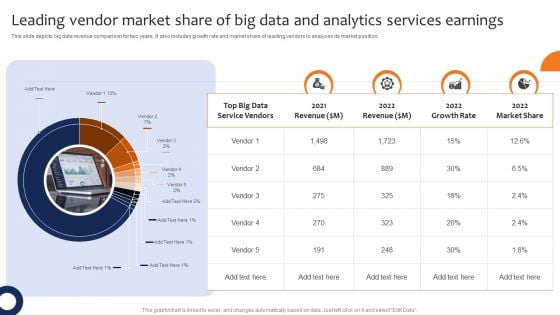
Leading Vendor Market Share Of Big Data And Analytics Services Earnings Professional PDF
This slide depicts big data revenue comparison for two years. It also includes growth rate and market share of leading vendors to analyses its market position. Pitch your topic with ease and precision using this Leading Vendor Market Share Of Big Data And Analytics Services Earnings Professional PDF. This layout presents information on Revenue, Growth Rate, Market Share. It is also available for immediate download and adjustment. So, changes can be made in the color, design, graphics or any other component to create a unique layout.
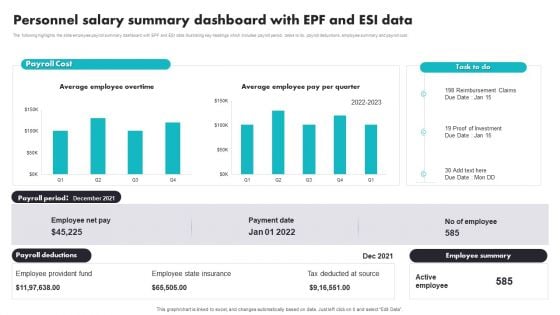
Personnel Salary Summary Dashboard With EPF And ESI Data Brochure PDF
The following highlights the slide employee payroll summary dashboard with EPF and ESI data illustrating key headings which includes payroll period, tasks to do, payroll deductions, employee summary and payroll cost. Pitch your topic with ease and precision using this Personnel Salary Summary Dashboard With EPF And ESI Data Brochure PDF. This layout presents information on Employee Provident Fund, Employee State Insurance, Tax Deducted At Source. It is also available for immediate download and adjustment. So, changes can be made in the color, design, graphics or any other component to create a unique layout.
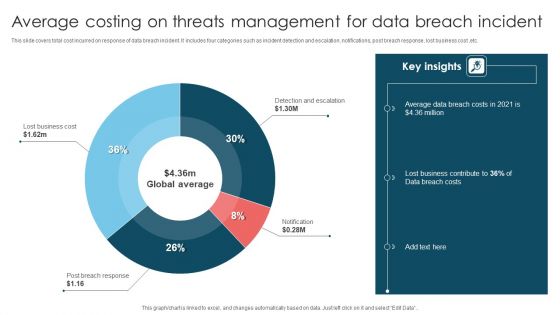
Average Costing On Threats Management For Data Breach Incident Demonstration PDF
This slide covers total cost incurred on response of data breach incident. It includes four categories such as incident detection and escalation, notifications, post breach response, lost business cost ,etc. Pitch your topic with ease and precision using this Average Costing On Threats Management For Data Breach Incident Demonstration PDF. This layout presents information on Lost Business Cost, Detection And Escalation, Notification. It is also available for immediate download and adjustment. So, changes can be made in the color, design, graphics or any other component to create a unique layout.
Cognitive Analytics Strategy And Techniques Tracking Customer Data Insights Dashboard Demonstration PDF
This slide provides information regarding customer data insights dashboard in terms of average churn risk, segments, high earner, highly engaged customers, etc. Take your projects to the next level with our ultimate collection of Cognitive Analytics Strategy And Techniques Tracking Customer Data Insights Dashboard Demonstration PDF. Slidegeeks has designed a range of layouts that are perfect for representing task or activity duration, keeping track of all your deadlines at a glance. Tailor these designs to your exact needs and give them a truly corporate look with your own brand colors they will make your projects stand out from the rest.
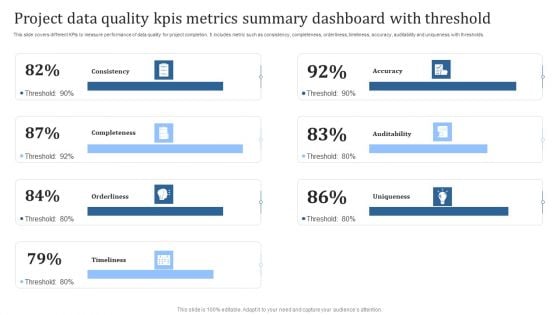
Project Data Quality Kpis Metrics Summary Dashboard With Threshold Guidelines PDF
This slide covers different KPIs to measure performance of data quality for project completion. It includes metric such as consistency, completeness, orderliness, timeliness, accuracy, auditability and uniqueness with thresholds. Pitch your topic with ease and precision using this Project Data Quality Kpis Metrics Summary Dashboard With Threshold Guidelines PDF. This layout presents information on Consistency, Completeness, Orderliness. It is also available for immediate download and adjustment. So, changes can be made in the color, design, graphics or any other component to create a unique layout.
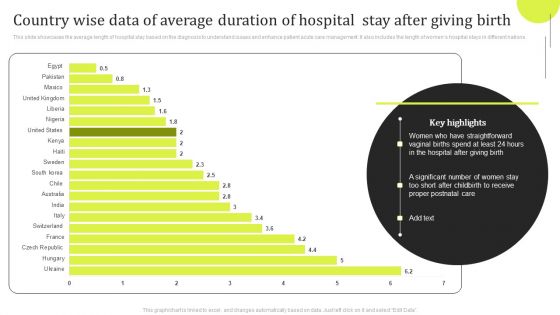
Country Wise Data Of Average Duration Of Hospital Stay After Giving Birth Designs PDF
This slide showcases the average length of hospital stay based on the diagnosis to understand issues and enhance patient acute care management. It also includes the length of womens hospital stays in different nations. Pitch your topic with ease and precision using this Country Wise Data Of Average Duration Of Hospital Stay After Giving Birth Designs PDF. This layout presents information on Country Wise Data, Average Duration. It is also available for immediate download and adjustment. So, changes can be made in the color, design, graphics or any other component to create a unique layout.
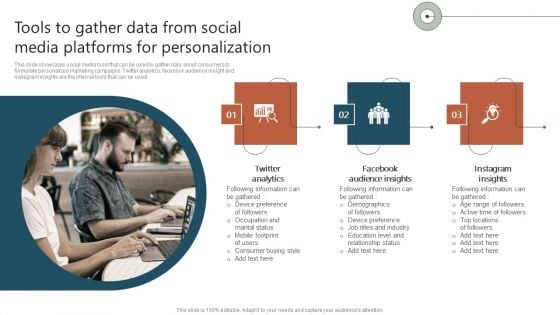
Tools To Gather Data From Social Media Platforms For Personalization Ppt Infographic Template Information PDF
This slide showcases social media tools that can be used to gather data about consumers to formulate personalized marketing campaigns. Twitter analytics, facebook audience insight and instagram insights are the internal tools that can be used. If you are looking for a format to display your unique thoughts, then the professionally designed Tools To Gather Data From Social Media Platforms For Personalization Ppt Infographic Template Information PDF is the one for you. You can use it as a Google Slides template or a PowerPoint template. Incorporate impressive visuals, symbols, images, and other charts. Modify or reorganize the text boxes as you desire. Experiment with shade schemes and font pairings. Alter, share or cooperate with other people on your work. Download Tools To Gather Data From Social Media Platforms For Personalization Ppt Infographic Template Information PDF and find out how to give a successful presentation. Present a perfect display to your team and make your presentation unforgettable.
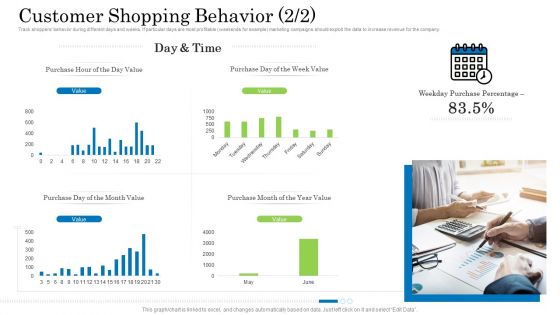
Customer Behavioral Data And Analytics Customer Shopping Behavior Week Inspiration PDF
Track shoppers behavior during different days and weeks. If particular days are most profitable weekends for example marketing campaigns should exploit the data to increase revenue for the company. Deliver and pitch your topic in the best possible manner with this customer behavioral data and analytics customer shopping behavior week inspiration pdf. Use them to share invaluable insights on purchase hour of the day value, purchase day of the week value, purchase day of the month value, purchase month of the year value and impress your audience. This template can be altered and modified as per your expectations. So, grab it now.

Iot And Digital Twin To Reduce Costs Post Covid Healthcare Dashboard Showing Analytical Data Elements PDF
This slide shows the healthcare dashboard that presents analytical data such as occupancy, patient turnover, efficiency and costs, satisfaction and service indicators. Deliver and pitch your topic in the best possible manner with this iot and digital twin to reduce costs post covid healthcare dashboard showing analytical data elements pdf. Use them to share invaluable insights on occupancy, patient turnover, efficiency and costs, satisfaction and service indicators and impress your audience. This template can be altered and modified as per your expectations. So, grab it now.
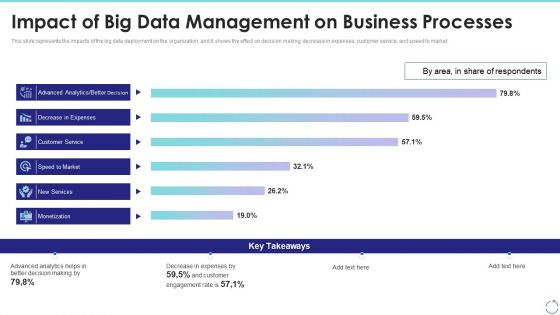
Impact Of Big Data Management On Business Processes Ppt Inspiration Gallery PDF
This slide represents the impacts of the big data deployment on the organization, and it shows the effect on decision making, decrease in expenses, customer service, and speed to market. Deliver and pitch your topic in the best possible manner with this impact of big data management on business processes ppt inspiration gallery pdf. Use them to share invaluable insights on analytics, customer, expenses, services and impress your audience. This template can be altered and modified as per your expectations. So, grab it now.
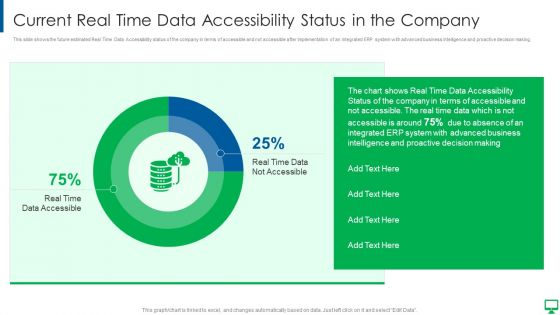
Execution Of ERP System To Enhance Business Effectiveness Current Real Time Data Infographics PDF
This slide shows the future estimated Real Time Data Accessibility status of the company in terms of accessible and not accessible after implementation of an integrated ERP system with advanced business intelligence and proactive decision making.Deliver and pitch your topic in the best possible manner with this Execution of erp system to enhance business effectiveness current real time data infographics pdf Use them to share invaluable insights on status of the company, intelligence and proactive, advanced business and impress your audience. This template can be altered and modified as per your expectations. So, grab it now.
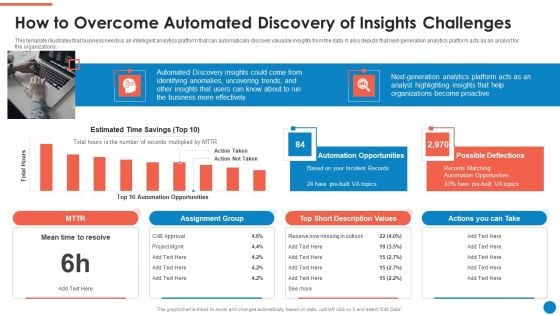
Data And Analytics Playbook How To Overcome Automated Discovery Of Insights Background PDF
This template illustrates that business needs is an intelligent analytics platform that can automatically discover valuable insights from the data. It also depicts that next-generation analytics platform acts as an analyst for the organizations. Deliver an awe inspiring pitch with this creative Data And Analytics Playbook How To Overcome Automated Discovery Of Insights Background PDF bundle. Topics like Estimated Time Savings, Automation Opportunities, Possible Deflections, Assignment Group can be discussed with this completely editable template. It is available for immediate download depending on the needs and requirements of the user.
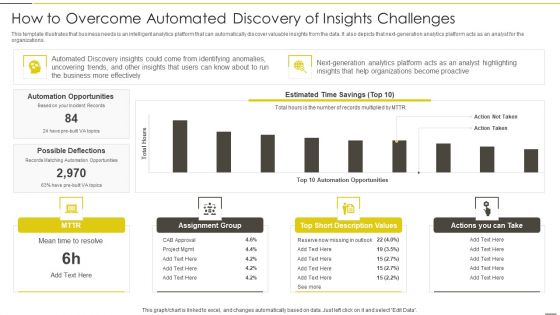
Administered Data And Analytic Quality Playbook How To Overcome Automated Discovery Mockup PDF
This template illustrates that business needs is an intelligent analytics platform that can automatically discover valuable insights from the data. It also depicts that next generation analytics platform acts as an analyst for the organizations.Deliver an awe inspiring pitch with this creative Administered Data And Analytic Quality Playbook How To Overcome Automated Discovery Mockup PDF bundle. Topics like Automation Opportunities, Possible Deflections, Estimated Savings can be discussed with this completely editable template. It is available for immediate download depending on the needs and requirements of the user.
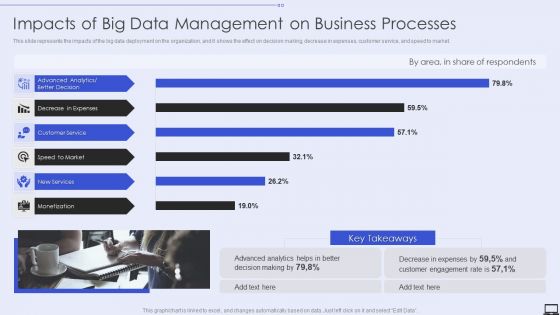
Impacts Of Big Data Management On Business Processes Ppt PowerPoint Presentation File Infographics PDF
This slide represents the impacts of the big data deployment on the organization, and it shows the effect on decision making, decrease in expenses, customer service, and speed to market. Deliver and pitch your topic in the best possible manner with this Impacts Of Big Data Management On Business Processes Ppt PowerPoint Presentation File Infographics PDF. Use them to share invaluable insights on Decision Making, Expenses, Customer Engagement Rate and impress your audience. This template can be altered and modified as per your expectations. So, grab it now.
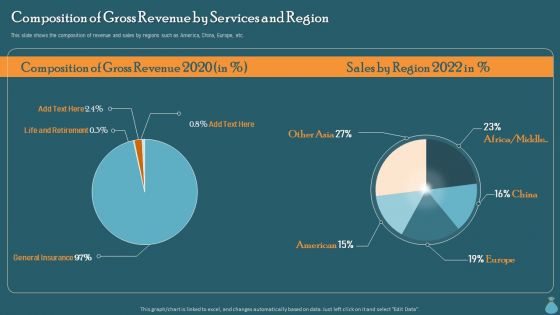
Financial Data Revelation To Varied Stakeholders Composition Of Gross Revenue By Services And Region Slides PDF
This slide shows the composition of revenue and sales by regions such as America, China, Europe, etc. Create an editable Financial Data Revelation To Varied Stakeholders Composition Of Gross Revenue By Services And Region Slides PDF that communicates your idea and engages your audience. Whether you are presenting a business or an educational presentation, pre designed presentation templates help save time. Financial Data Revelation To Varied Stakeholders Composition Of Gross Revenue By Services And Region Slides PDF is highly customizable and very easy to edit, covering many different styles from creative to business presentations. Slidegeeks has creative team members who have crafted amazing templates. So, go and get them without any delay.
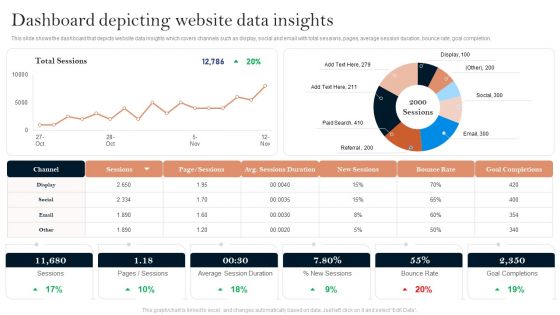
Successful Branding Technique For Electronic Commerce Corporation Dashboard Depicting Website Data Insights Microsoft PDF
Do you have to make sure that everyone on your team knows about any specific topic. I yes, then you should give Successful Branding Technique For Electronic Commerce Corporation Dashboard Depicting Website Data Insights Microsoft PDF a try. Our experts have put a lot of knowledge and effort into creating this impeccable Successful Branding Technique For Electronic Commerce Corporation Dashboard Depicting Website Data Insights Microsoft PDF. You can use this template for your upcoming presentations, as the slides are perfect to represent even the tiniest detail. You can download these templates from the Slidegeeks website and these are easy to edit. So grab these today.
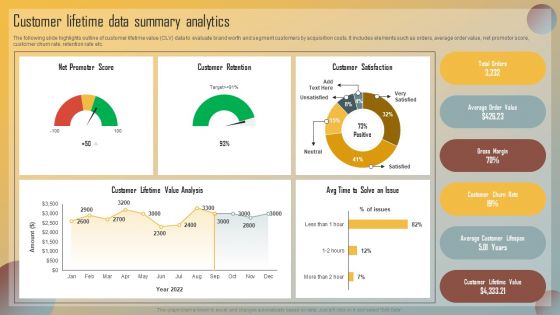
Guide For Marketing Analytics To Improve Decisions Customer Lifetime Data Summary Analytics Structure PDF
The following slide highlights outline of customer lifetime value CLV data to evaluate brand worth and segment customers by acquisition costs. It includes elements such as orders, average order value, net promotor score, customer churn rate, retention rate etc. Find a pre designed and impeccable Guide For Marketing Analytics To Improve Decisions Customer Lifetime Data Summary Analytics Structure PDF. The templates can ace your presentation without additional effort. You can download these easy to edit presentation templates to make your presentation stand out from others. So, what are you waiting for Download the template from Slidegeeks today and give a unique touch to your presentation.
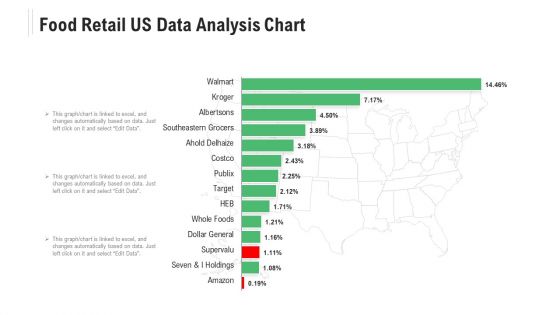
Food Retail US Data Analysis Chart Ppt Powerpoint Presentation Ideas Microsoft Pdf
Pitch your topic with ease and precision using this food retail us data analysis chart ppt powerpoint presentation ideas microsoft pdf. This layout presents information on seven and i holdings, amazon, southeastern grocers, albertsons, target. It is also available for immediate download and adjustment. So, changes can be made in the color, design, graphics or any other component to create a unique layout.

Healthcare Data Mining System Approaches Ppt PowerPoint Presentation Ideas Gridlines PDF
This slide mentions data mining system approaches applicable in medical and healthcare industry. It includes Analytics system, Content system, Deployment system. Persuade your audience using this Healthcare Data Mining System Approaches Ppt PowerPoint Presentation Ideas Gridlines PDF. This PPT design covers three stages, thus making it a great tool to use. It also caters to a variety of topics including Content System, Deployment System, Analytics System. Download this PPT design now to present a convincing pitch that not only emphasizes the topic but also showcases your presentation skills.
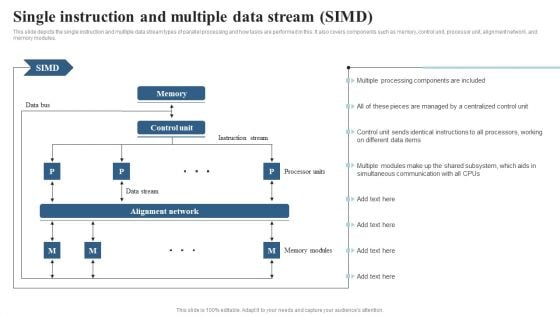
Integrating Parallel Processor System Single Instruction And Multiple Data Stream Simd Ideas PDF
This slide depicts the single instruction and multiple data stream types of parallel processing and how tasks are performed in this. It also covers components such as memory, control unit, processor unit, alignment network, and memory modules. Explore a selection of the finest Integrating Parallel Processor System Single Instruction And Multiple Data Stream Simd Ideas PDF here. With a plethora of professionally designed and pre-made slide templates, you can quickly and easily find the right one for your upcoming presentation. You can use our Integrating Parallel Processor System Single Instruction And Multiple Data Stream Simd Ideas PDF to effectively convey your message to a wider audience. Slidegeeks has done a lot of research before preparing these presentation templates. The content can be personalized and the slides are highly editable. Grab templates today from Slidegeeks.
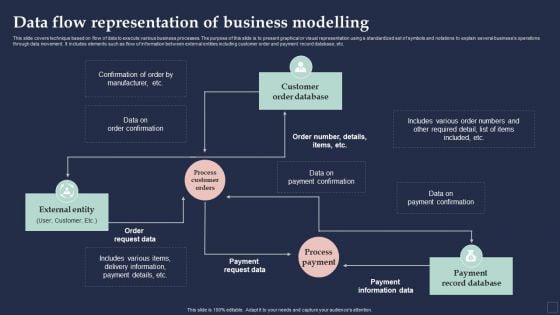
BPM System Methodology Data Flow Representation Of Business Modelling Pictures PDF
This slide covers technique based on flow of data to execute various business processes. The purpose of this slide is to present graphical or visual representation using a standardized set of symbols and notations to explain several businesss operations through data movement. It includes elements such as flow of information between external entities including customer order and payment record database, etc. This modern and well-arranged BPM System Methodology Data Flow Representation Of Business Modelling Pictures PDF provides lots of creative possibilities. It is very simple to customize and edit with the Powerpoint Software. Just drag and drop your pictures into the shapes. All facets of this template can be edited with Powerpoint, no extra software is necessary. Add your own material, put your images in the places assigned for them, adjust the colors, and then you can show your slides to the world, with an animated slide included.
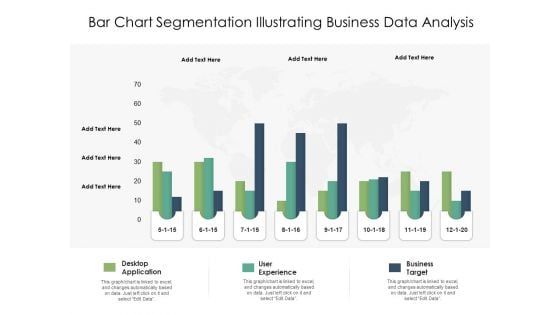
Bar Chart Segmentation Illustrating Business Data Analysis Ppt PowerPoint Presentation Outline File Formats
Presenting this set of slides with name bar chart segmentation illustrating business data analysis ppt powerpoint presentation outline file formats. The topics discussed in these slides are desktop application, user experience, business target. This is a completely editable PowerPoint presentation and is available for immediate download. Download now and impress your audience.
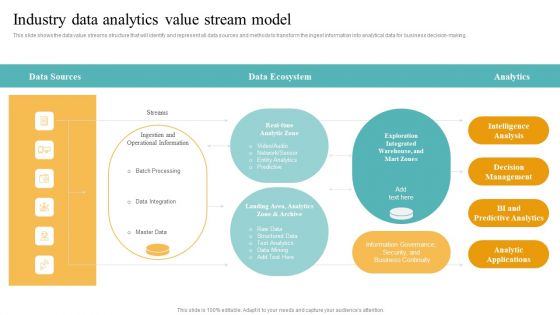
Transformation Toolkit Competitive Intelligence Information Analysis Industry Data Analytics Value Stream Model Raw Mockup PDF
This slide illustrates the workflow related to performing the data analytics project along with key responsible owners to accomplish the activities. If you are looking for a format to display your unique thoughts, then the professionally designed Transformation Toolkit Competitive Intelligence Information Analysis Industry Data Analytics Value Stream Model Raw Mockup PDF is the one for you. You can use it as a Google Slides template or a PowerPoint template. Incorporate impressive visuals, symbols, images, and other charts. Modify or reorganize the text boxes as you desire. Experiment with shade schemes and font pairings. Alter, share or cooperate with other people on your work. Download Transformation Toolkit Competitive Intelligence Information Analysis Industry Data Analytics Value Stream Model Raw Mockup PDF and find out how to give a successful presentation. Present a perfect display to your team and make your presentation unforgettable.
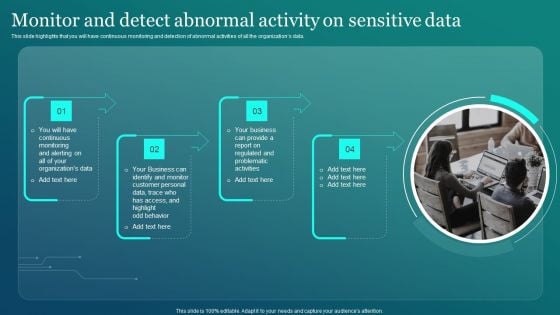
Information Security Monitor And Detect Abnormal Activity On Sensitive Data Elements PDF
This slide highlights that you will have continuous monitoring and detection of abnormal activities of all the organizations data. Are you searching for a Information Security Monitor And Detect Abnormal Activity On Sensitive Data Elements PDF that is uncluttered, straightforward, and original Its easy to edit, and you can change the colors to suit your personal or business branding. For a presentation that expresses how much effort you have put in, this template is ideal With all of its features, including tables, diagrams, statistics, and lists, its perfect for a business plan presentation. Make your ideas more appealing with these professional slides. Download Information Security Monitor And Detect Abnormal Activity On Sensitive Data Elements PDF from Slidegeeks today.
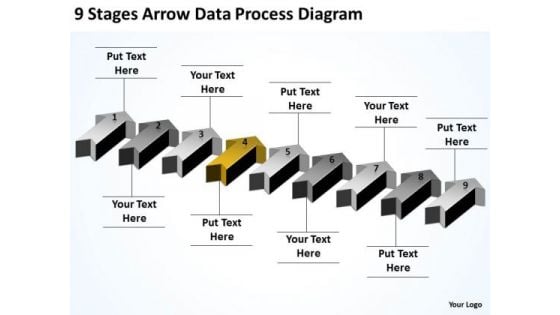
Levels Of Parallel Processing 9 Stages Arrow Data Diagram PowerPoint Slides
We present our levels of parallel processing 9 stages arrow data diagram PowerPoint Slides.Download our Flow Charts PowerPoint Templates because Our PowerPoint Templates and Slides are like the strings of a tennis racquet. Well strung to help you serve aces. Download our Business PowerPoint Templates because Our PowerPoint Templates and Slides are created by a hardworking bunch of busybees. Always flitting around with solutions gauranteed to please. Download our Arrows PowerPoint Templates because Our PowerPoint Templates and Slides will bullet point your ideas. See them fall into place one by one. Download and present our Flow Charts PowerPoint Templates because You are an avid believer in ethical practices. Highlight the benefits that accrue with our PowerPoint Templates and Slides. Present our Shapes PowerPoint Templates because Our PowerPoint Templates and Slides help you pinpoint your timelines. Highlight the reasons for your deadlines with their use.Use these PowerPoint slides for presentations relating to Arrows, background, blue, color, computer, development, down, illustration, shape, sign, upload, white, design, dynamic, element, glowing, graphic, ideas, layout, lines, modern, progress, style, texture, vector, white. The prominent colors used in the PowerPoint template are Yellow, Gray, Black. PowerPoint presentation experts tell us our levels of parallel processing 9 stages arrow data diagram PowerPoint Slides are designed by professionals People tell us our illustration PowerPoint templates and PPT Slides look good visually. Use our levels of parallel processing 9 stages arrow data diagram PowerPoint Slides are topically designed to provide an attractive backdrop to any subject. You can be sure our illustration PowerPoint templates and PPT Slides are designed to make your presentations professional. The feedback we get is that our levels of parallel processing 9 stages arrow data diagram PowerPoint Slides are visually appealing. You can be sure our illustration PowerPoint templates and PPT Slides are designed by professionals Impress your organization with our Levels Of Parallel Processing 9 Stages Arrow Data Diagram PowerPoint Slides. Make sure your presentation gets the attention it deserves.
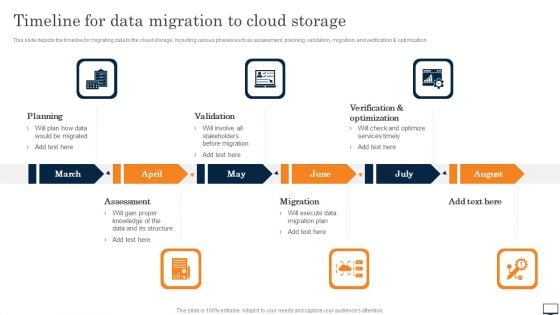
Timeline For Data Migration To Cloud Storage Ppt PowerPoint Presentation File Deck PDF
This slide depicts the timeline for migrating data to the cloud storage, including various phases such as assessment, planning, validation, migration, and verification and optimization. Do you have an important presentation coming up Are you looking for something that will make your presentation stand out from the rest Look no further than Timeline For Data Migration To Cloud Storage Ppt PowerPoint Presentation File Deck PDF. With our professional designs, you can trust that your presentation will pop and make delivering it a smooth process. And with Slidegeeks, you can trust that your presentation will be unique and memorable. So why wait Grab Timeline For Data Migration To Cloud Storage Ppt PowerPoint Presentation File Deck PDF today and make your presentation stand out from the rest.
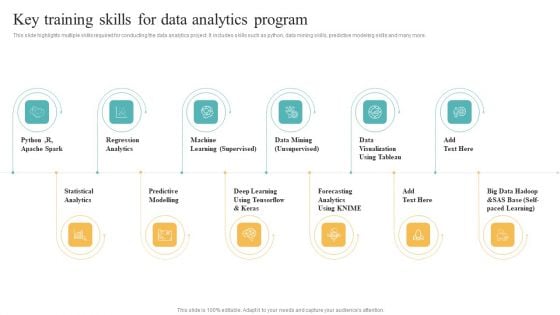
Transformation Toolkit Competitive Intelligence Information Analysis Key Training Skills For Data Analytics Program Structure PDF
This slide highlights multiple skills required for conducting the data analytics project. It includes skills such as python, data mining skills, predictive modeling skills and many more. Retrieve professionally designed Transformation Toolkit Competitive Intelligence Information Analysis Key Training Skills For Data Analytics Program Structure PDF to effectively convey your message and captivate your listeners. Save time by selecting pre made slideshows that are appropriate for various topics, from business to educational purposes. These themes come in many different styles, from creative to corporate, and all of them are easily adjustable and can be edited quickly. Access them as PowerPoint templates or as Google Slides themes. You do not have to go on a hunt for the perfect presentation because Slidegeeks got you covered from everywhere.

Data Center Infrastructure Technologies Ppt PowerPoint Presentation Complete Deck With Slides
This Data Center Infrastructure Technologies Ppt PowerPoint Presentation Complete Deck With Slides is designed to help you retain your audiences attention. This content-ready PowerPoint Template enables you to take your audience on a journey and share information in a way that is easier to recall. It helps you highlight the crucial parts of your work so that the audience does not get saddled with information download. This sixteen slide PPT Deck comes prepared with the graphs and charts you could need to showcase your information through visuals. You only need to enter your own data in them. Download this editable PowerPoint Theme and walk into that meeting with confidence.
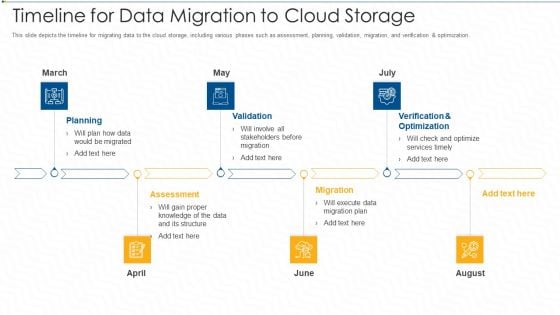
Timeline For Data Migration To Cloud Storage Ppt Pictures Portfolio PDF
This slide depicts the timeline for migrating data to the cloud storage, including various phases such as assessment, planning, validation, migration, and verification and optimization. This is a timeline for data migration to cloud storage ppt pictures portfolio pdf template with various stages. Focus and dispense information on six stages using this creative set, that comes with editable features. It contains large content boxes to add your information on topics like planning, validation, assessment, migration, verification and optimization. You can also showcase facts, figures, and other relevant content using this PPT layout. Grab it now.
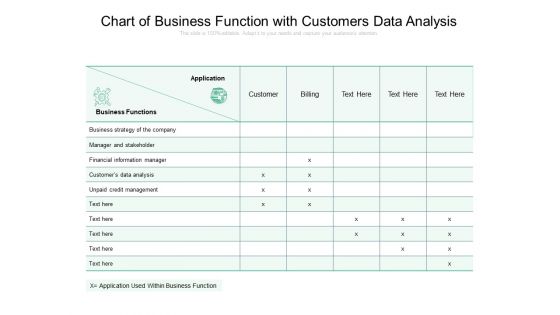
Chart Of Business Function With Customers Data Analysis Ppt PowerPoint Presentation File Slides PDF
Pitch your topic with ease and precision using this chart of business function with customers data analysis ppt powerpoint presentation file slides pdf. This layout presents information on financial, business, strategy. It is also available for immediate download and adjustment. So, changes can be made in the color, design, graphics or any other component to create a unique layout.
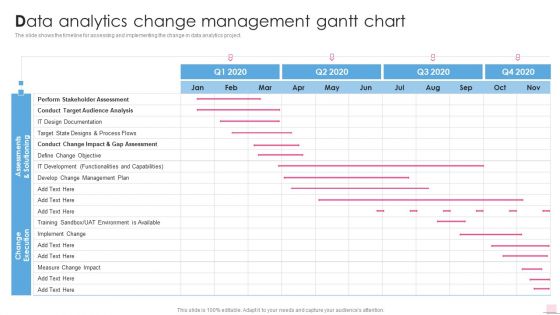
Data Analytics Change Management Gantt Chart Business Analysis Modification Toolkit Portrait PDF
Deliver an awe inspiring pitch with this creative Data Analytics Change Management Gantt Chart Business Analysis Modification Toolkit Portrait PDF bundle. Topics like Functionalities Capabilities, Environment Available, Implement Change can be discussed with this completely editable template. It is available for immediate download depending on the needs and requirements of the user.
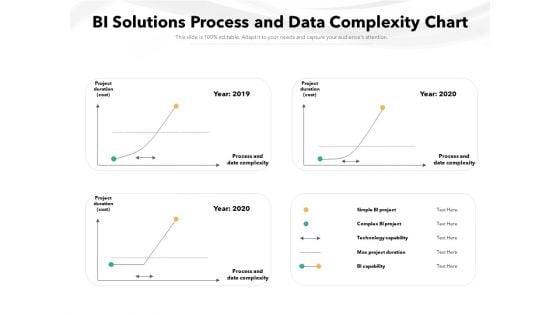
BI Solutions Process And Data Complexity Chart Ppt PowerPoint Presentation File Professional PDF
Showcasing this set of slides titled bi solutions process and data complexity chart ppt powerpoint presentation file professional pdf. The topics addressed in these templates are process, project duration, date complexity. All the content presented in this PPT design is completely editable. Download it and make ajustments in color, background, font etc. as per your unique business setting.
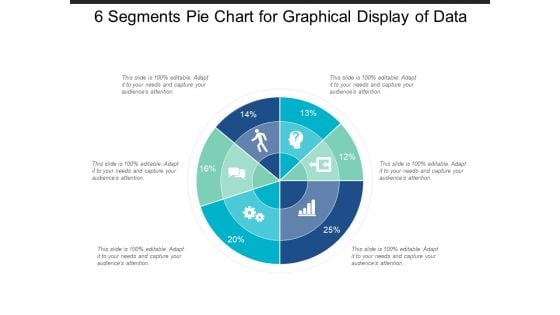
6 Segments Pie Chart For Graphical Display Of Data Ppt PowerPoint Presentation Portfolio Rules
This is a 6 segments pie chart for graphical display of data ppt powerpoint presentation portfolio rules. This is a six stage process. The stages in this process are 6 piece pie chart, 6 segment pie chart, 6 parts pie chart.

7 Segments Pie Chart For Graphical Display Of Data Ppt PowerPoint Presentation Model Elements
This is a 7 segments pie chart for graphical display of data ppt powerpoint presentation model elements. This is a seven stage process. The stages in this process are 6 piece pie chart, 6 segment pie chart, 6 parts pie chart.
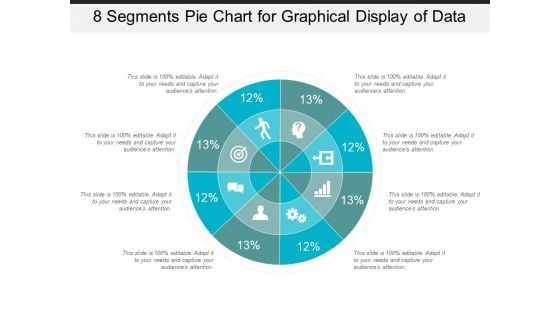
8 Segments Pie Chart For Graphical Display Of Data Ppt PowerPoint Presentation Infographic Template Templates
This is a 8 segments pie chart for graphical display of data ppt powerpoint presentation infographic template templates. This is a eight stage process. The stages in this process are 6 piece pie chart, 6 segment pie chart, 6 parts pie chart.
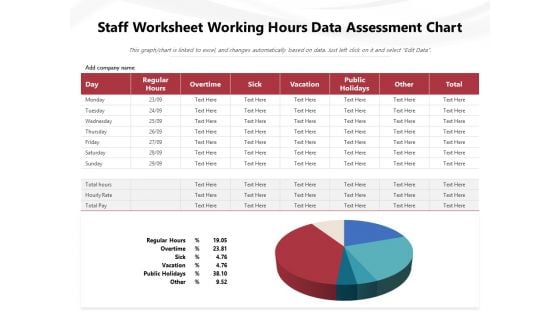
Staff Worksheet Working Hours Data Assessment Chart Ppt PowerPoint Presentation Show Deck PDF
Presenting this set of slides with name staff worksheet working hours data assessment chart ppt powerpoint presentation show deck pdf. The topics discussed in these slides are public holidays, vacation, sick, regular, overtime. This is a completely editable PowerPoint presentation and is available for immediate download. Download now and impress your audience.
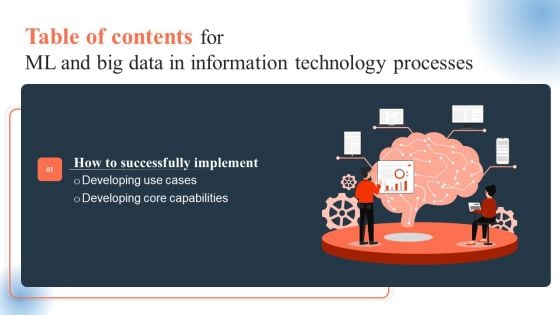
Ml And Big Data In Information Technology Processes Table Of Contents Ideas PDF
Whether you have daily or monthly meetings, a brilliant presentation is necessary. Ml And Big Data In Information Technology Processes Table Of Contents Ideas PDF can be your best option for delivering a presentation. Represent everything in detail using Ml And Big Data In Information Technology Processes Table Of Contents Ideas PDF and make yourself stand out in meetings. The template is versatile and follows a structure that will cater to your requirements. All the templates prepared by Slidegeeks are easy to download and edit. Our research experts have taken care of the corporate themes as well. So, give it a try and see the results.
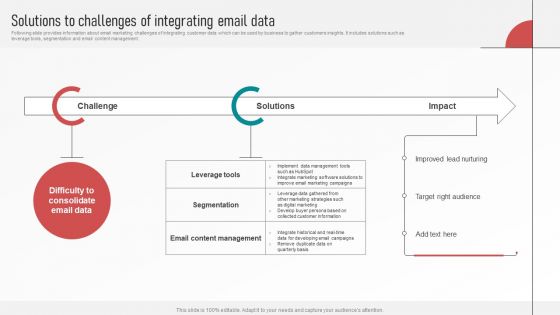
Customer Retention With Email Advertising Campaign Plan Solutions To Challenges Of Integrating Email Data Clipart PDF
Following slide provides information about email marketing challenges of integrating customer data which can be used by business to gather customers insights. It includes solutions such as leverage tools, segmentation and email content management. Are you searching for a Customer Retention With Email Advertising Campaign Plan Solutions To Challenges Of Integrating Email Data Clipart PDF that is uncluttered, straightforward, and original Its easy to edit, and you can change the colors to suit your personal or business branding. For a presentation that expresses how much effort you have put in, this template is ideal. With all of its features, including tables, diagrams, statistics, and lists, its perfect for a business plan presentation. Make your ideas more appealing with these professional slides. Download Customer Retention With Email Advertising Campaign Plan Solutions To Challenges Of Integrating Email Data Clipart PDF from Slidegeeks today.
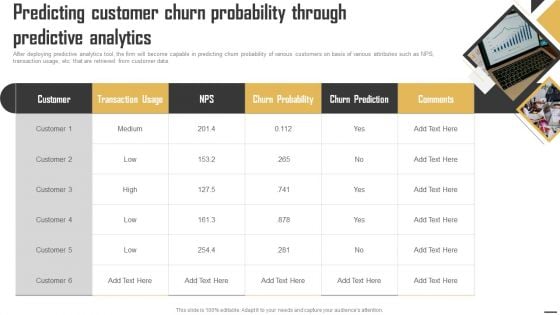
Data Monetization And Management Predicting Customer Churn Probability Through Formats PDF
After deploying predictive analytics tool, the firm will become capable in predicting churn probability of various customers on basis of various attributes such as NPS, transaction usage, etc. that are retrieved from customer data. Are you searching for a Data Monetization And Management Predicting Customer Churn Probability Through Formats PDF that is uncluttered, straightforward, and original Its easy to edit, and you can change the colors to suit your personal or business branding. For a presentation that expresses how much effort youve put in, this template is ideal With all of its features, including tables, diagrams, statistics, and lists, its perfect for a business plan presentation. Make your ideas more appealing with these professional slides. Download Data Monetization And Management Predicting Customer Churn Probability Through Formats PDF from Slidegeeks today.
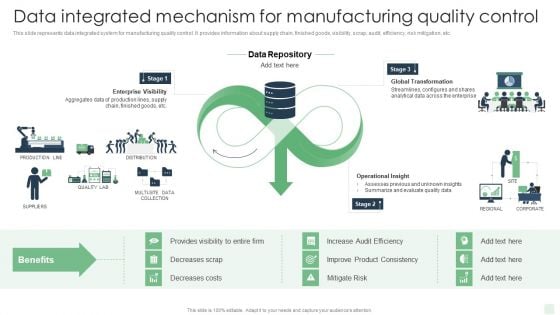
Data Integrated Mechanism For Manufacturing Quality Control Automated Manufacturing Process Deployment Mockup PDF
This slide represents data integrated system for manufacturing quality control. It provides information about supply chain, finished goods, visibility, scrap, audit, efficiency, risk mitigation, etc.If you are looking for a format to display your unique thoughts, then the professionally designed Data Integrated Mechanism For Manufacturing Quality Control Automated Manufacturing Process Deployment Mockup PDF is the one for you. You can use it as a Google Slides template or a PowerPoint template. Incorporate impressive visuals, symbols, images, and other charts. Modify or reorganize the text boxes as you desire. Experiment with shade schemes and font pairings. Alter, share or cooperate with other people on your work. Download Data Integrated Mechanism For Manufacturing Quality Control Automated Manufacturing Process Deployment Mockup PDF and find out how to give a successful presentation. Present a perfect display to your team and make your presentation unforgettable.
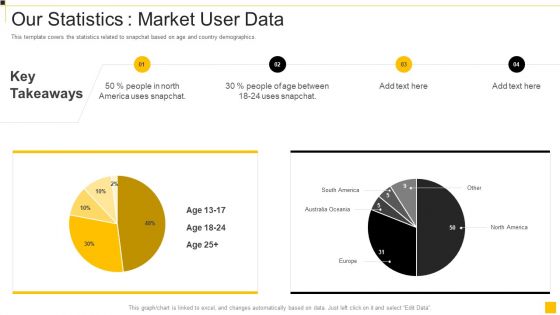
Snapchat Capital Investment Elevator Pitch Deck Our Statistics Market User Data Summary Pdf
This template covers the statistics related to snapchat based on age and country demographics. Deliver an awe inspiring pitch with this creative snapchat capital investment elevator pitch deck our statistics market user data summary pdf bundle. Topics like statistics, demographics, market can be discussed with this completely editable template. It is available for immediate download depending on the needs and requirements of the user.
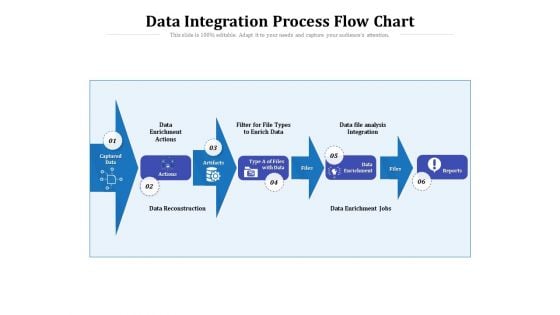
Data Integration Process Flow Chart Ppt PowerPoint Presentation File Templates PDF
Presenting this set of slides with name data integration process flow chart ppt powerpoint presentation file templates pdf. This is a six stage process. The stages in this process are actions, integration, analysis. This is a completely editable PowerPoint presentation and is available for immediate download. Download now and impress your audience.
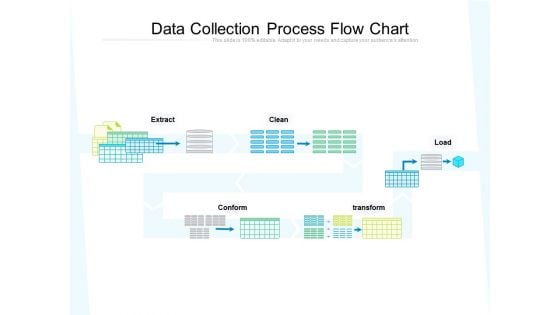
Data Collection Process Flow Chart Ppt PowerPoint Presentation File Summary PDF
Showcasing this set of slides titled data collection process flow chart ppt powerpoint presentation file summary pdf. The topics addressed in these templates are extract, conform, transform. All the content presented in this PPT design is completely editable. Download it and make adjustments in color, background, font etc. as per your unique business setting.
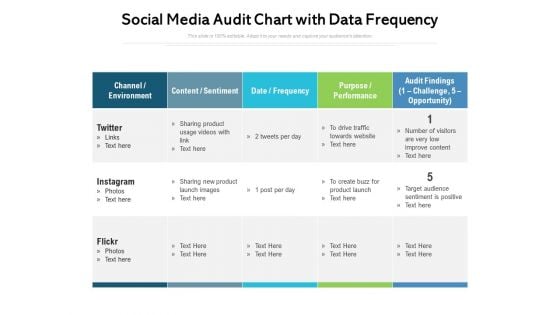
Social Media Audit Chart With Data Frequency Ppt PowerPoint Presentation File Background Designs PDF
Showcasing this set of slides titled social media audit chart with data frequency ppt powerpoint presentation file background designs pdf. The topics addressed in these templates are target audience, sentiment is positive, sharing product usage, environment. All the content presented in this PPT design is completely editable. Download it and make adjustments in color, background, font etc. as per your unique business setting.
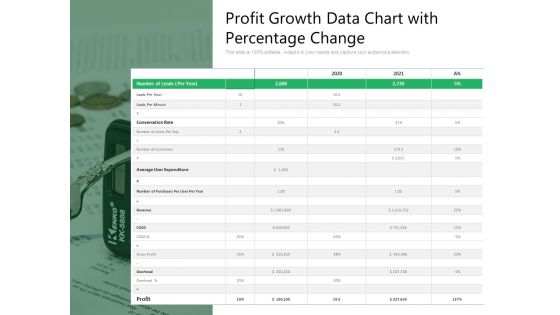
Profit Growth Data Chart With Percentage Change Ppt PowerPoint Presentation Summary Background PDF
Showcasing this set of slides titled profit growth data chart with percentage change ppt powerpoint presentation summary background pdf. The topics addressed in these templates are conversation rate, average user expenditure, profit. All the content presented in this PPT design is completely editable. Download it and make adjustments in color, background, font etc. as per your unique business setting.
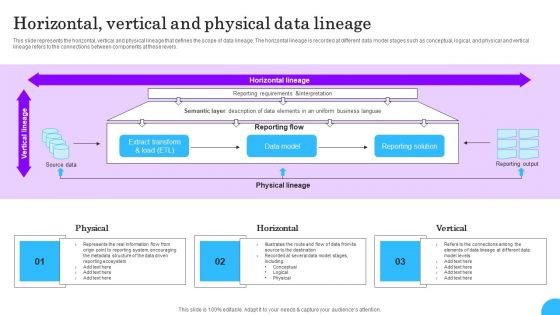
Comprehensive Analysis Of Different Data Lineage Classification Horizontal Vertical And Physical Demonstration PDF
This slide represents the horizontal, vertical and physical lineage that defines the scope of data lineage. The horizontal lineage is recorded at different data model stages such as conceptual, logical, and physical and vertical lineage refers to the connections between components at these levels. Retrieve professionally designed Comprehensive Analysis Of Different Data Lineage Classification Horizontal Vertical And Physical Demonstration PDF to effectively convey your message and captivate your listeners. Save time by selecting pre-made slideshows that are appropriate for various topics, from business to educational purposes. These themes come in many different styles, from creative to corporate, and all of them are easily adjustable and can be edited quickly. Access them as PowerPoint templates or as Google Slides themes. You do not have to go on a hunt for the perfect presentation because Slidegeeks got you covered from everywhere.
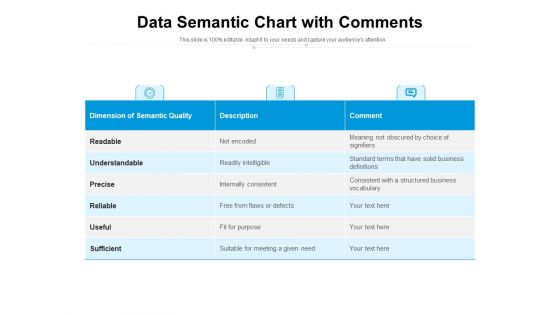
Data Semantic Chart With Comments Ppt PowerPoint Presentation Gallery Aids PDF
Pitch your topic with ease and precision using this data semantic chart with comments ppt powerpoint presentation gallery aids pdf. This layout presents information on readable, understandable, precise, reliable, useful, sufficient. It is also available for immediate download and adjustment. So, changes can be made in the color, design, graphics or any other component to create a unique layout.
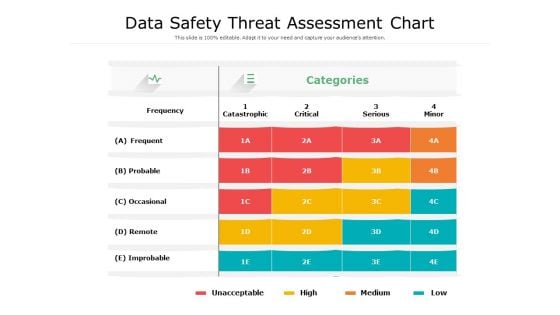
Data Safety Threat Assessment Chart Ppt PowerPoint Presentation File Summary PDF
Pitch your topic with ease and precision using this data safety threat assessment chart ppt powerpoint presentation file summary pdf. This layout presents information on improbable, probable, occasional, serious, catastrophic. It is also available for immediate download and adjustment. So, changes can be made in the color, design, graphics or any other component to create a unique layout.
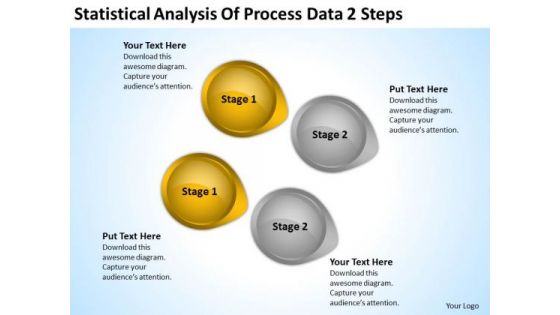
Levels Of Parallel Processing Data 2 Steps Ppt PowerPoint Templates Backgrounds For Slides
We present our levels of parallel processing data 2 steps ppt PowerPoint templates backgrounds for slides.Download and present our Business PowerPoint Templates because Our PowerPoint Templates and Slides will embellish your thoughts. See them provide the desired motivation to your team. Present our Circle Charts PowerPoint Templates because Our PowerPoint Templates and Slides offer you the needful to organise your thoughts. Use them to list out your views in a logical sequence. Download and present our Arrows PowerPoint Templates because Our PowerPoint Templates and Slides provide you with a vast range of viable options. Select the appropriate ones and just fill in your text. Present our Shapes PowerPoint Templates because Our PowerPoint Templates and Slides team portray an attitude of elegance. Personify this quality by using them regularly. Use our Signs PowerPoint Templates because Our PowerPoint Templates and Slides offer you the needful to organise your thoughts. Use them to list out your views in a logical sequence.Use these PowerPoint slides for presentations relating to 3d, abstract, analysis, arrow, background, business, button, chart, circle, circular, color, concept, conservation, cycle, development, diagram, direction, eco, ecology, energy, environment, flow, flowchart, globe, graphic, growing, growth, icon, internet, isolated, object, power, process, protection, recyclable, recycle, recycling, render, resource, saving, sign, solution, sphere, statistic, sustainable, symbol, technology, white. The prominent colors used in the PowerPoint template are Brown, Gray, Black. You can be sure our levels of parallel processing data 2 steps ppt PowerPoint templates backgrounds for slides look good visually. People tell us our analysis PowerPoint templates and PPT Slides are specially created by a professional team with vast experience. They diligently strive to come up with the right vehicle for your brilliant Ideas. You can be sure our levels of parallel processing data 2 steps ppt PowerPoint templates backgrounds for slides will impress their bosses and teams. Use our chart PowerPoint templates and PPT Slides are the best it can get when it comes to presenting. Presenters tell us our levels of parallel processing data 2 steps ppt PowerPoint templates backgrounds for slides look good visually. We assure you our chart PowerPoint templates and PPT Slides are topically designed to provide an attractive backdrop to any subject. Our Levels Of Parallel Processing Data 2 Steps Ppt PowerPoint Templates Backgrounds For Slides put your thoughts in a capsule. Deliver it to them in the correct doses.
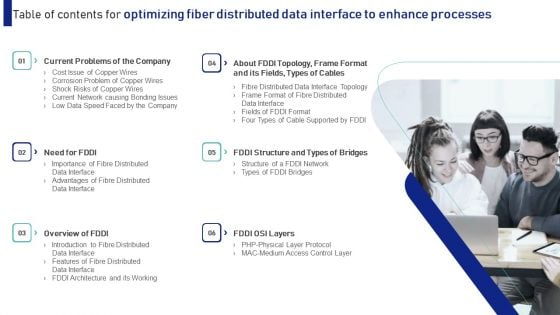
Table Of Contents For Optimizing Fiber Distributed Data Interface To Enhance Processes Mockup PDF
Are you searching for a Table Of Contents For Optimizing Fiber Distributed Data Interface To Enhance Processes Mockup PDF that is uncluttered, straightforward, and original Its easy to edit, and you can change the colors to suit your personal or business branding. For a presentation that expresses how much effort you have put in, this template is ideal With all of its features, including tables, diagrams, statistics, and lists, its perfect for a business plan presentation. Make your ideas more appealing with these professional slides. Download Table Of Contents For Optimizing Fiber Distributed Data Interface To Enhance Processes Mockup PDF from Slidegeeks today.
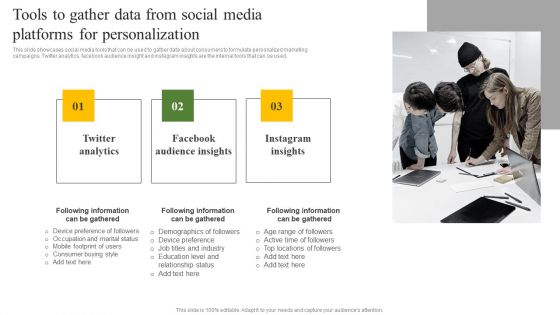
Tools To Gather Data From Social Media Platforms For Personalization Ppt Summary Microsoft PDF
This slide showcases social media tools that can be used to gather data about consumers to formulate personalized marketing campaigns. Twitter analytics, facebook audience insight and instagram insights are the internal tools that can be used. If you are looking for a format to display your unique thoughts, then the professionally designed Tools To Gather Data From Social Media Platforms For Personalization Ppt Summary Microsoft PDF is the one for you. You can use it as a Google Slides template or a PowerPoint template. Incorporate impressive visuals, symbols, images, and other charts. Modify or reorganize the text boxes as you desire. Experiment with shade schemes and font pairings. Alter, share or cooperate with other people on your work. Download Tools To Gather Data From Social Media Platforms For Personalization Ppt Summary Microsoft PDF and find out how to give a successful presentation. Present a perfect display to your team and make your presentation unforgettable.
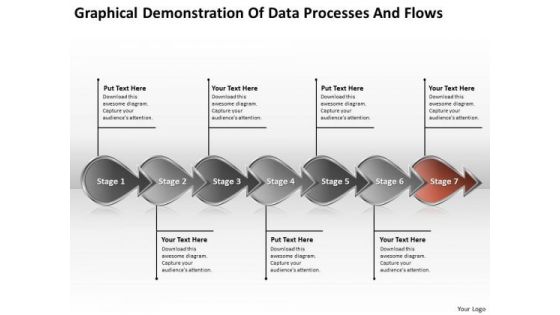
Of Data Processes And Flows Chart What Are Business Requirements PowerPoint Templates
We present our of data processes and flows chart what are business requirements PowerPoint templates.Use our Success PowerPoint Templates because the success of your venture depends on the performance of every team member. Download our Process and Flow PowerPoint Templates because you can blaze a brilliant trail from point to point. Use our Business PowerPoint Templates because you have had a great year or so business wise. It is time to celebrate the efforts of your team. Use our Arrows PowerPoint Templates because you will be able to Highlight these individual targets and the paths to their achievement. Present our Shapes PowerPoint Templates because the foundation stones of many a life.Use these PowerPoint slides for presentations relating to Arrow, Arrows, Block, Business, Chart, Design, Development, Diagram, Direction, Element, Flow, Flowchart, Graph, Linear, Management, Organization, Process, Program, Section, Sign, Solution, Symbol. The prominent colors used in the PowerPoint template are Brown, Gray, Black. PowerPoint presentation experts tell us our of data processes and flows chart what are business requirements PowerPoint templates are Second to none. Customers tell us our Business PowerPoint templates and PPT Slides will help you be quick off the draw. Just enter your specific text and see your points hit home. Use our of data processes and flows chart what are business requirements PowerPoint templates help you meet deadlines which are an element of today's workplace. Just browse and pick the slides that appeal to your intuitive senses. Use our Design PowerPoint templates and PPT Slides are designed to make your presentations professional. We assure you our of data processes and flows chart what are business requirements PowerPoint templates are Wonderful. People tell us our Diagram PowerPoint templates and PPT Slides are Sparkling. Achieve any feat you desire to. Our Of Data Processes And Flows Chart What Are Business Requirements PowerPoint Templates are extremely facilitating.
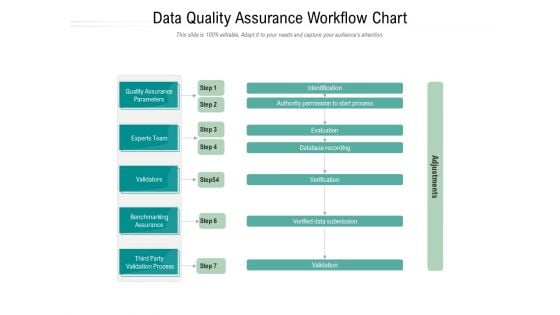
Data Quality Assurance Workflow Chart Ppt PowerPoint Presentation Slides Layout Ideas PDF
Presenting this set of slides with name data quality assurance workflow chart ppt powerpoint presentation slides layout ideas pdf. This is a five stage process. The stages in this process are quality assurance parameters, experts team, validators, benchmarking assurance, party validation process, adjustments. This is a completely editable PowerPoint presentation and is available for immediate download. Download now and impress your audience.

Product Data Chart With Salesperson Details Ppt PowerPoint Presentation Styles Outline PDF
Presenting this set of slides with name product data chart with salesperson details ppt powerpoint presentation styles outline pdf. The topics discussed in these slides are sales person, parent table, product id, sales. This is a completely editable PowerPoint presentation and is available for immediate download. Download now and impress your audience.
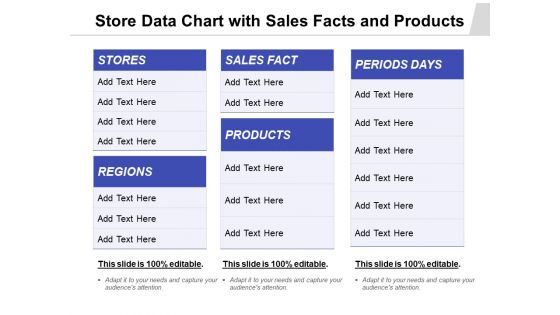
Store Data Chart With Sales Facts And Products Ppt PowerPoint Presentation Pictures Shapes PDF
Presenting this set of slides with name store data chart with sales facts and products ppt powerpoint presentation pictures shapes pdf. The topics discussed in these slides are stores, sales fact, periods days, regions, products. This is a completely editable PowerPoint presentation and is available for immediate download. Download now and impress your audience.
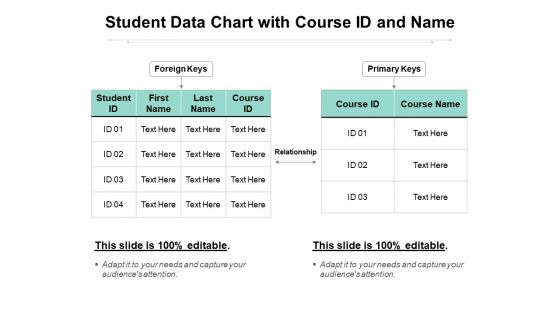
Student Data Chart With Course ID And Name Ppt PowerPoint Presentation Styles Example PDF
Presenting this set of slides with name student data chart with course id and name ppt powerpoint presentation styles example pdf. The topics discussed in these slides are foreign keys, primary keys, relationship. This is a completely editable PowerPoint presentation and is available for immediate download. Download now and impress your audience.


 Continue with Email

 Home
Home


