Data Icon

Operational Changes Done By The Restaurants For Their Survival Diagrams PDF
Mentioned slide provides information on the operational changes done by the restaurant operators in order to survive during the pandemic. Here the graph shows that 51 percentage of the restaurants re trained their staff to ensure food safety. Deliver an awe inspiring pitch with this creative operational changes done by the restaurants for their survival diagrams pdf bundle. Topics like business, services, key takeaways can be discussed with this completely editable template. It is available for immediate download depending on the needs and requirements of the user.
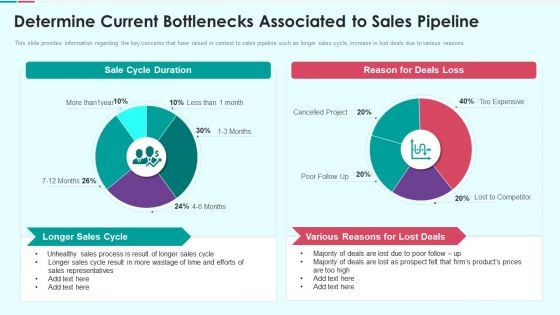
Sales Funnel Management For Revenue Generation Determine Current Bottlenecks Diagrams PDF
This slide provides information regarding the key concerns that have raised in context to sales pipeline such as longer sales cycle, increase in lost deals due to various reasons. Deliver and pitch your topic in the best possible manner with this sales funnel management for revenue generation determine current bottlenecks diagrams pdf Use them to share invaluable insights on longer sales cycle, various reasons for lost deals, sales representatives and impress your audience. This template can be altered and modified as per your expectations. So, grab it now.
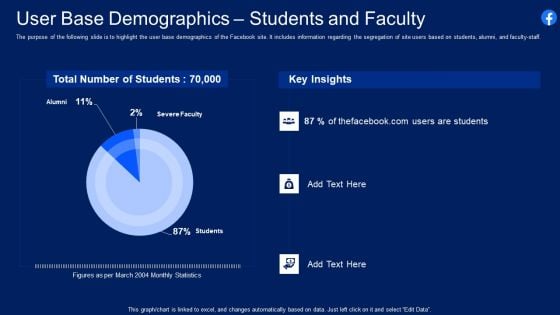
Facebook Original Capital Funding User Base Demographics Students And Faculty Diagrams PDF
The purpose of the following slide is to highlight the user base demographics of the Facebook site. It includes information regarding the segregation of site users based on students, alumni, and faculty staff. Deliver an awe inspiring pitch with this creative facebook original capital funding user base demographics students and faculty diagrams pdf bundle. Topics like user base demographics students and faculty can be discussed with this completely editable template. It is available for immediate download depending on the needs and requirements of the user.
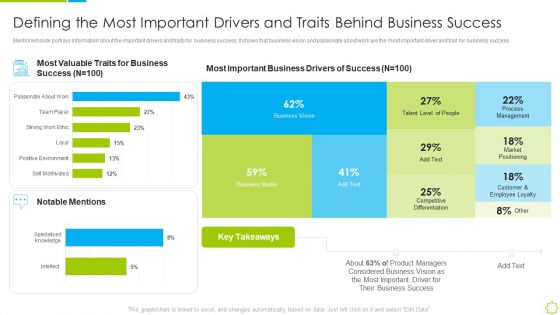
Launch New Sales Enablement Program Lead Generation Defining The Most Important Drivers Diagrams PDF
Mentioned slide portrays information about the important drivers and traits for business success. It shows that business vision and passionate about work are the most important driver and trait for business success. Deliver an awe inspiring pitch with this creative launch new sales enablement program lead generation defining the most important drivers diagrams pdf bundle. Topics like defining the most important drivers and traits behind business success can be discussed with this completely editable template. It is available for immediate download depending on the needs and requirements of the user.
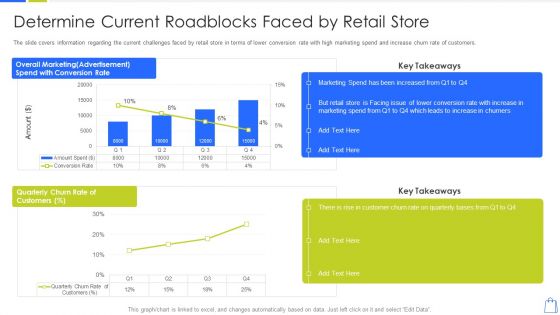
Redefining Experiential Retail Marketing Determine Current Roadblocks Faced By Retail Store Diagrams PDF
The slide covers information regarding the current challenges faced by retail store in terms of lower conversion rate with high marketing spend and increase churn rate of customers. Deliver and pitch your topic in the best possible manner with this redefining experiential retail marketing determine current roadblocks faced by retail store diagrams pdf. Use them to share invaluable insights on determine current roadblocks faced by retail store and impress your audience. This template can be altered and modified as per your expectations. So, grab it now.

Analyzing The Impact Of Russia Ukraine Conflict On Gas Sector Russian Invasion Impact Diagrams PDF
The following slide represents impact of Russian Ukrainian gas war tensions on USA. It provides information about gasoline prices, gas production, demands, sanctions, ban, etc. Deliver and pitch your topic in the best possible manner with this analyzing the impact of russia ukraine conflict on gas sector russian invasion impact diagrams pdf. Use them to share invaluable insights on russian invasion impact on united states of america and impress your audience. This template can be altered and modified as per your expectations. So, grab it now.
Retail Trading Platform Dashboard Tracking Essential Kpis For Ecommerce Performance Diagrams PDF
This slide provides information regarding essential KPIs for ecommerce performance dashboard tracking average bounce rate, new vs. old customers, channel revenue vs. channel acquisitions costs, channel revenue vs. sales, average conversion rate, etc. Deliver an awe inspiring pitch with this creative retail trading platform dashboard tracking essential kpis for ecommerce performance diagrams pdf bundle. Topics like average bounce rate, average conversion rate, bounce rate, channel revenue sales can be discussed with this completely editable template. It is available for immediate download depending on the needs and requirements of the user.
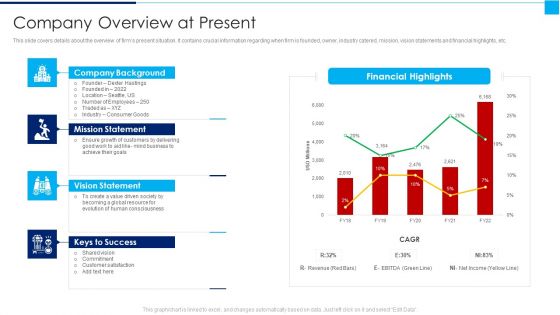
Ways To Enhance Organizations Profitability Company Overview At Present Diagrams PDF
This slide covers details about the overview of firms present situation. It contains crucial information regarding when firm is founded, owner, industry catered, mission, vision statements and financial highlights, etc. Deliver and pitch your topic in the best possible manner with this ways to enhance organizations profitability company overview at present diagrams pdf Use them to share invaluable insights on mission statement, vision statement, keys to success and impress your audience. This template can be altered and modified as per your expectations. So, grab it now.
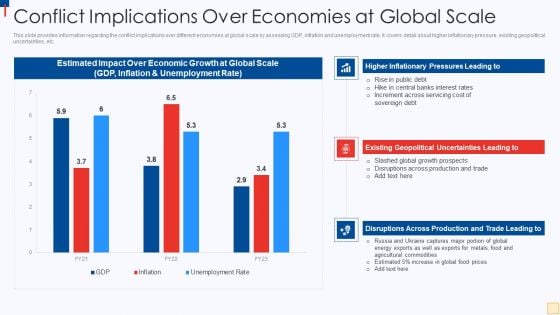
Ukraine Vs Russia Examining Conflict Implications Over Economies At Global Scale Diagrams PDF
This slide provides information regarding the conflict implications over different economies at global scale by assessing GDP, inflation and unemployment rate. It covers detail about higher inflationary pressure, existing geopolitical uncertainties, etc. Deliver and pitch your topic in the best possible manner with this Ukraine Vs Russia Examining Conflict Implications Over Economies At Global Scale Diagrams PDF. Use them to share invaluable insights on Estimated Impact Over, Economic Growth, Global Scale, GDP, Inflation And Unemployment Rate and impress your audience. This template can be altered and modified as per your expectations. So, grab it now.

Insurance Company Business Plan Addressing Market Assessment For Insurance Business Diagrams PDF
This slide covers information regarding market assessment of insurance business with high competition existing. It covers details about key players and market share associated to top players. Deliver and pitch your topic in the best possible manner with this Insurance Company Business Plan Addressing Market Assessment For Insurance Business Diagrams PDF Use them to share invaluable insights on America Insurance, General Insurance, Local Competition Includes and impress your audience. This template can be altered and modified as per your expectations. So, grab it now.
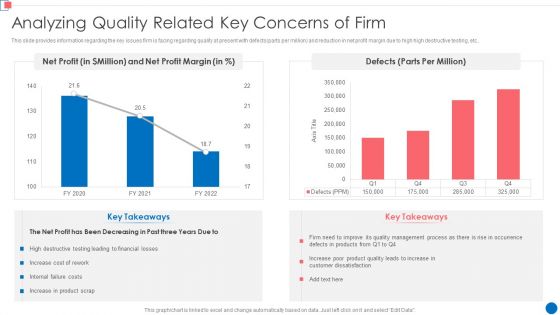
Optimize Enterprise Core Analyzing Quality Related Key Concerns Of Firm Diagrams PDF
This slide provides information regarding the key issues firm is facing regarding quality at present with defects parts per million and reduction in net profit margin due to high high destructive testing, etc. Deliver an awe inspiring pitch with this creative Optimize Enterprise Core Analyzing Quality Related Key Concerns Of Firm Diagrams PDF bundle. Topics like Net Profit, Net Profit Margin, 2020 To 2022 can be discussed with this completely editable template. It is available for immediate download depending on the needs and requirements of the user.
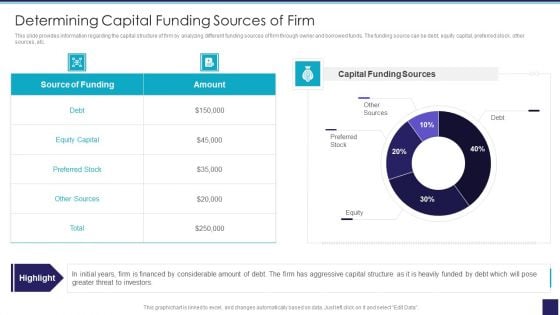
Organizational Issue Resolution Tool Determining Capital Funding Sources Of Firm Diagrams PDF
This slide provides information regarding the capital structure of firm by analyzing different funding sources of firm through owner and borrowed funds. The funding source can be debt, equity capital, preferred stock, other sources, etc. Deliver and pitch your topic in the best possible manner with this Organizational Issue Resolution Tool Determining Capital Funding Sources Of Firm Diagrams PDF. Use them to share invaluable insights on Capital Funding Sources, Preferred Stock, Equity Capital and impress your audience. This template can be altered and modified as per your expectations. So, grab it now.
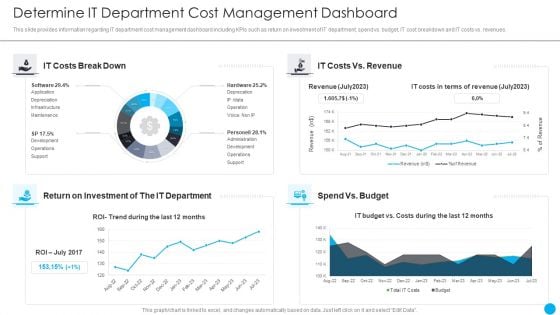
Cios Methodologies To Improve IT Spending Determine It Department Cost Management Dashboard Diagrams PDF
This slide provides information regarding IT department cost management dashboard including KPIs such as return on investment of IT department, spend vs. budget, IT cost breakdown and IT costs vs. revenues. Deliver and pitch your topic in the best possible manner with this Cios Methodologies To Improve IT Spending Determine It Department Cost Management Dashboard Diagrams PDF Use them to share invaluable insights on Extent Organizational, Reprioritization Cancellation, Investment Required and impress your audience. This template can be altered and modified as per your expectations. So, grab it now.
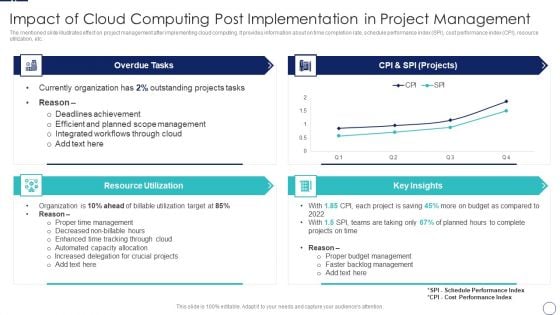
How To Implement Cloud Collaboration Impact Of Cloud Computing Post Implementation Diagrams PDF
The mentioned slide illustrates effect on project management after implementing cloud computing. It provides information about on time completion rate, schedule performance index SPI, cost performance index CPI, resource utilization, etc. Deliver an awe inspiring pitch with this creative How To Implement Cloud Collaboration Impact Of Cloud Computing Post Implementation Diagrams PDF bundle. Topics like Overdue Tasks, Resource Utilization, CPI And SPI can be discussed with this completely editable template. It is available for immediate download depending on the needs and requirements of the user.
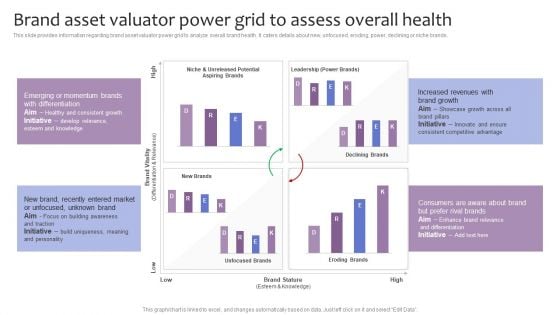
Strategic Brand Management Brand Asset Valuator Power Grid To Assess Overall Health Diagrams PDF
This slide provides information regarding brand asset valuator power grid to analyze overall brand health. It caters details about new, unfocused, eroding, power, declining or niche brands. Deliver and pitch your topic in the best possible manner with this Strategic Brand Management Brand Asset Valuator Power Grid To Assess Overall Health Diagrams PDF. Use them to share invaluable insights on Brand Vitality, Brand Stature, Declining Brands, Eroding Brands and impress your audience. This template can be altered and modified as per your expectations. So, grab it now.
B2B Sales Techniques Playbook Sales Management Activities Tracking Dashboard Diagrams PDF
This slide provides information regarding sales management activities tracking dashboard to measure closed business, sales pipeline, sales activity by sales rep, month over month growth, forecast by month, etc. Deliver and pitch your topic in the best possible manner with this B2B Sales Techniques Playbook Sales Management Activities Tracking Dashboard Diagrams PDF. Use them to share invaluable insights on Sales Pipeline, Sales Activity, Sales Pipeline and impress your audience. This template can be altered and modified as per your expectations. So, grab it now.
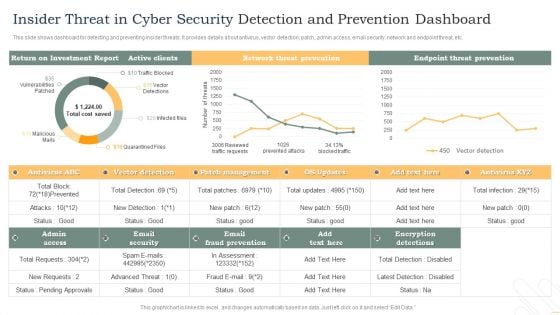
Insider Threat In Cyber Security Detection And Prevention Dashboard Diagrams PDF
This slide shows dashboard for detecting and preventing insider threats. It provides details about antivirus, vector detection, patch, admin access, email security, network and endpoint threat, etc. Pitch your topic with ease and precision using this Insider Threat In Cyber Security Detection And Prevention Dashboard Diagrams PDF. This layout presents information on Active Clients, Network Threat Prevention, Endpoint Threat Prevention. It is also available for immediate download and adjustment. So, changes can be made in the color, design, graphics or any other component to create a unique layout.
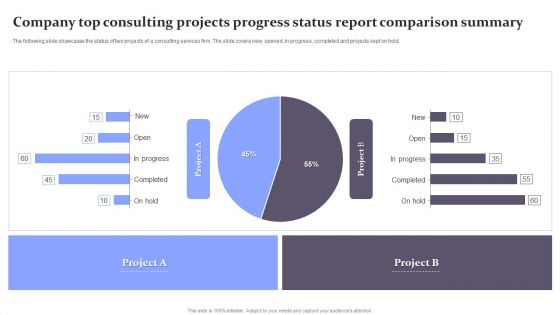
Company Top Consulting Projects Progress Status Report Comparison Summary Diagrams PDF
The following slide showcases the status of two projects of a consulting services firm. The slide covers new, opened, in progress, completed and projects kept on hold. Pitch your topic with ease and precision using this Company Top Consulting Projects Progress Status Report Comparison Summary Diagrams PDF. This layout presents information on Company Top Consulting Projects Progress, Status Report Comparison Summary. It is also available for immediate download and adjustment. So, changes can be made in the color, design, graphics or any other component to create a unique layout.
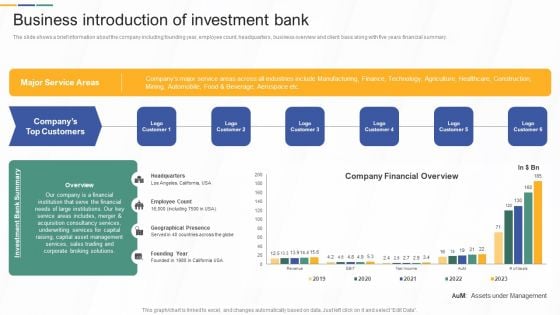
Business Introduction Of Investment Bank Investment Banking And Deal Pitchbook Diagrams PDF
The slide shows a brief information about the company including founding year, employee count, headquarters, business overview and client base along with five years financial summary. If your project calls for a presentation, then Slidegeeks is your go-to partner because we have professionally designed, easy-to-edit templates that are perfect for any presentation. After downloading, you can easily edit Business Introduction Of Investment Bank Investment Banking And Deal Pitchbook Diagrams PDF and make the changes accordingly. You can rearrange slides or fill them with different images. Check out all the handy templates.
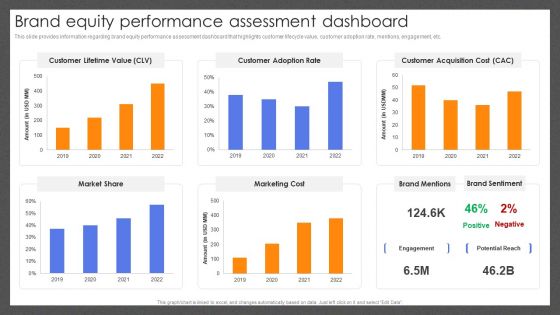
Guide For Effective Brand Brand Equity Performance Assessment Dashboard Diagrams PDF
This slide provides information regarding brand equity performance assessment dashboard that highlights customer lifecycle value, customer adoption rate, mentions, engagement, etc. Present like a pro with Guide For Effective Brand Brand Equity Performance Assessment Dashboard Diagrams PDF Create beautiful presentations together with your team, using our easy-to-use presentation slides. Share your ideas in real-time and make changes on the fly by downloading our templates. So whether youre in the office, on the go, or in a remote location, you can stay in sync with your team and present your ideas with confidence. With Slidegeeks presentation got a whole lot easier. Grab these presentations today.
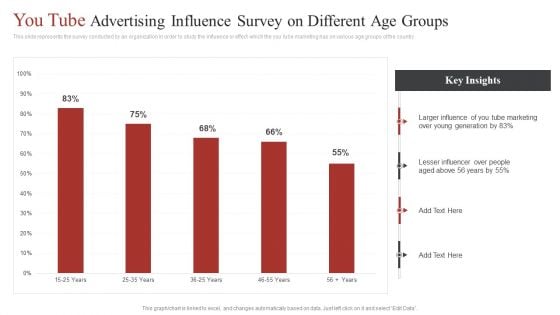
You Tube Advertising Influence Survey On Different Age Groups Ppt Diagram Ppt PDF
This slide represents the survey conducted by an organization in order to study the influence or effect which the you tube marketing has on various age groups of the country. Pitch your topic with ease and precision using this You Tube Advertising Influence Survey On Different Age Groups Ppt Diagram Ppt PDF. This layout presents information on Larger Influence, You Tube Marketing, Young Generation. It is also available for immediate download and adjustment. So, changes can be made in the color, design, graphics or any other component to create a unique layout.

Comprehensive Market Research Guide Growth Opportunities In Market Research Industry Diagrams PDF
The following slide outlines market size of global market research industry. Information covered in this slide is related to projected revenue from 2022 to 2030 and compound annual growth rate CAGR. Make sure to capture your audiences attention in your business displays with our gratis customizable Comprehensive Market Research Guide Growth Opportunities In Market Research Industry Diagrams PDF. These are great for business strategies, office conferences, capital raising or task suggestions. If you desire to acquire more customers for your tech business and ensure they stay satisfied, create your own sales presentation with these plain slides.
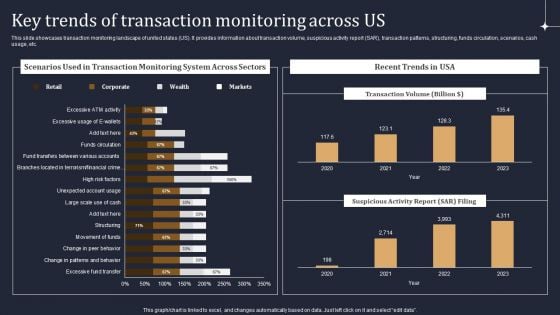
KYC Transaction Monitoring System Business Security Key Trends Of Transaction Monitoring Across Us Diagrams PDF
This slide showcases transaction monitoring landscape of united states US. It provides information about transaction volume, suspicious activity report SAR, transaction patterns, structuring, funds circulation, scenarios, cash usage, etc. There are so many reasons you need a KYC Transaction Monitoring System Business Security Key Trends Of Transaction Monitoring Across Us Diagrams PDF. The first reason is you can not spend time making everything from scratch, Thus, Slidegeeks has made presentation templates for you too. You can easily download these templates from our website easily.
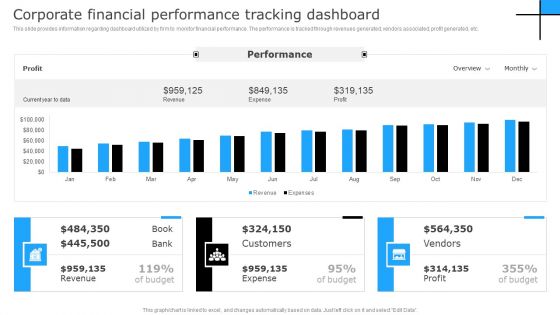
Successful Corporate Technique Enhancing Firms Performance Corporate Financial Performance Diagrams PDF
This slide provides information regarding dashboard utilized by firm to monitor financial performance. The performance is tracked through revenues generated, vendors associated, profit generated, etc. Find a pre designed and impeccable Successful Corporate Technique Enhancing Firms Performance Corporate Financial Performance Diagrams PDF. The templates can ace your presentation without additional effort. You can download these easy to edit presentation templates to make your presentation stand out from others. So, what are you waiting for Download the template from Slidegeeks today and give a unique touch to your presentation.
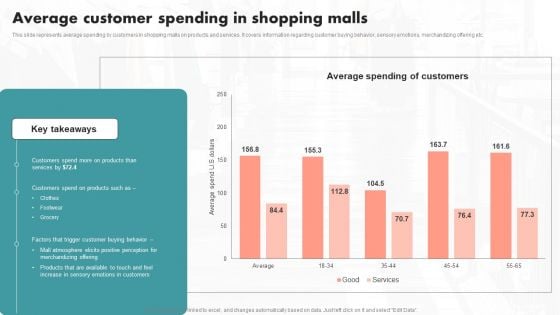
Average Customer Spending In Shopping Malls Ppt PowerPoint Presentation Diagram Images PDF
This slide represents average spending by customers in shopping malls on products and services. It covers information regarding customer buying behavior, sensory emotions, merchandizing offering etc. qIf your project calls for a presentation, then Slidegeeks is your go to partner because we have professionally designed, easy to edit templates that are perfect for any presentation. After downloading, you can easily edit Average Customer Spending In Shopping Malls Ppt PowerPoint Presentation Diagram Images PDF and make the changes accordingly. You can rearrange slides or fill them with different images. Check out all the handy templates
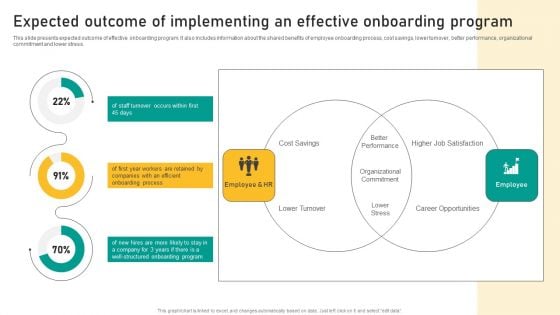
Talent Retention Initiatives For New Hire Onboarding Expected Outcome Of Implementing Diagrams PDF
This slide presents expected outcome of effective onboarding program. It also includes information about the shared benefits of employee onboarding process, cost savings, lower turnover, better performance, organizational commitment and lower stress. Want to ace your presentation in front of a live audience Our Talent Retention Initiatives For New Hire Onboarding Expected Outcome Of Implementing Diagrams PDF can help you do that by engaging all the users towards you. Slidegeeks experts have put their efforts and expertise into creating these impeccable powerpoint presentations so that you can communicate your ideas clearly. Moreover, all the templates are customizable, and easy to edit and downloadable. Use these for both personal and commercial use.
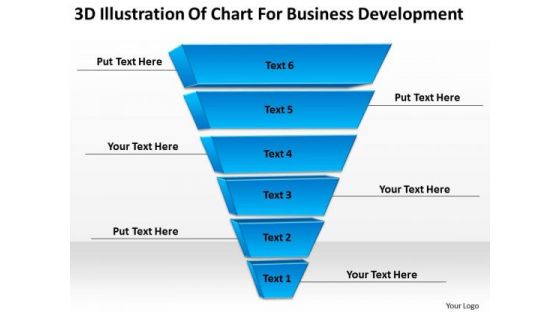
Illustration Of Chart For Business Development Ppt Plan PowerPoint Slides
We present our illustration of chart for business development ppt plan PowerPoint Slides.Download and present our Business PowerPoint Templates because Our PowerPoint Templates and Slides will generate and maintain the level of interest you desire. They will create the impression you want to imprint on your audience. Download our Process and Flows PowerPoint Templates because Our PowerPoint Templates and Slides has conjured up a web of all you need with the help of our great team. Use them to string together your glistening ideas. Use our Shapes PowerPoint Templates because Our PowerPoint Templates and Slides are effectively colour coded to prioritise your plans They automatically highlight the sequence of events you desire. Present our Success PowerPoint Templates because Our PowerPoint Templates and Slides will let you meet your Deadlines. Present our Marketing PowerPoint Templates because Our PowerPoint Templates and Slides provide you with a vast range of viable options. Select the appropriate ones and just fill in your text. Use these PowerPoint slides for presentations relating to Chart, website, form, special, corporate, order, business, concept, vector, bright, symbol, template, graphic, process, different, idea, shape, abstract, cycle, creative, illustration, piece, connection, strategy, solution, design, group, color, blue, part, background, conceptual. The prominent colors used in the PowerPoint template are Blue, Black, White. Equip your thoughts with all accessories. Add on our Illustration Of Chart For Business Development Ppt Plan PowerPoint Slides for good measure.

E Commerce Grocery Odyssey Charting The Digital Terrain Ppt Sample
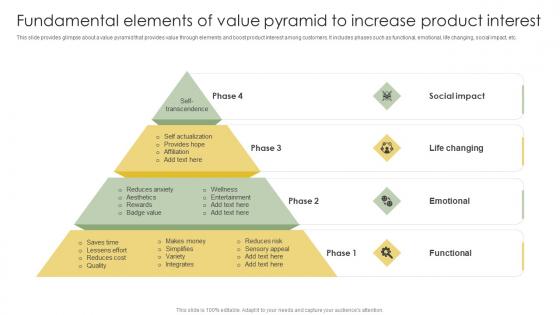
Fundamental Elements Of Value Pyramid To Increase Analyzing Customer Adoption Journey Graphics Pdf
This slide provides glimpse about a value pyramid that provides value through elements and boost product interest among customers. It includes phases such as functional, emotional, life changing, social impact, etc. Do you have an important presentation coming up Are you looking for something that will make your presentation stand out from the rest Look no further than Fundamental Elements Of Value Pyramid To Increase Analyzing Customer Adoption Journey Graphics Pdf. With our professional designs, you can trust that your presentation will pop and make delivering it a smooth process. And with Slidegeeks, you can trust that your presentation will be unique and memorable. So why wait Grab Fundamental Elements Of Value Pyramid To Increase Analyzing Customer Adoption Journey Graphics Pdf today and make your presentation stand out from the rest. This slide provides glimpse about a value pyramid that provides value through elements and boost product interest among customers. It includes phases such as functional, emotional, life changing, social impact, etc.
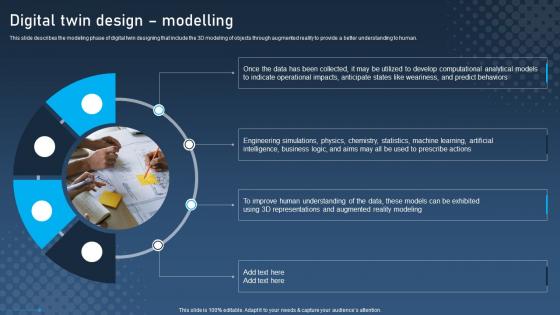
Digital Twin Design Modelling Digital Twins For Enhanced Industrial Elements Pdf
This slide describes the modeling phase of digital twin designing that include the 3D modeling of objects through augmented reality to provide a better understanding to human. Crafting an eye-catching presentation has never been more straightforward. Let your presentation shine with this tasteful yet straightforward Digital Twin Design Modelling Digital Twins For Enhanced Industrial Elements Pdf template. It offers a minimalistic and classy look that is great for making a statement. The colors have been employed intelligently to add a bit of playfulness while still remaining professional. Construct the ideal Digital Twin Design Modelling Digital Twins For Enhanced Industrial Elements Pdf that effortlessly grabs the attention of your audience. Begin now and be certain to wow your customers. This slide describes the modeling phase of digital twin designing that include the 3D modeling of objects through augmented reality to provide a better understanding to human.
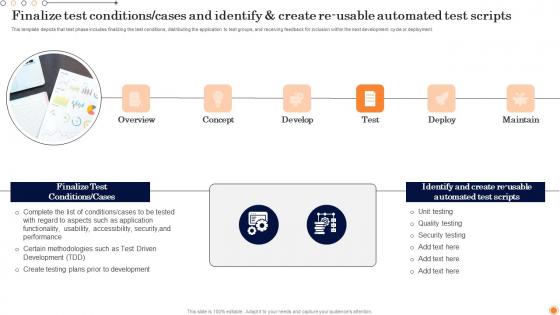
Finalize Test Conditions Cases Design And Develop Customized Software Guides Elements Pdf
This template depicts that test phase includes finalizing the test conditions, distributing the application to test groups, and receiving feedback for inclusion within the next development cycle or deployment. Crafting an eye catching presentation has never been more straightforward. Let your presentation shine with this tasteful yet straightforward Finalize Test Conditions Cases Design And Develop Customized Software Guides Elements Pdf template. It offers a minimalistic and classy look that is great for making a statement. The colors have been employed intelligently to add a bit of playfulness while still remaining professional. Construct the ideal Finalize Test Conditions Cases Design And Develop Customized Software Guides Elements Pdf that effortlessly grabs the attention of your audience Begin now and be certain to wow your customers This template depicts that test phase includes finalizing the test conditions, distributing the application to test groups, and receiving feedback for inclusion within the next development cycle or deployment.
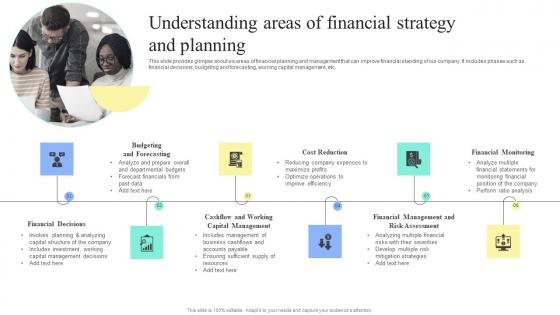
Strategic Financial Planning And Administration Understanding Areas Financial Strategy Planning Brochure PDF
This slide provides glimpse about six areas of financial planning and management that can improve financial standing of our company. It includes phases such as financial decisions, budgeting and forecasting, working capital management, etc. Want to ace your presentation in front of a live audience Our Strategic Financial Planning And Administration Understanding Areas Financial Strategy Planning Brochure PDF can help you do that by engaging all the users towards you. Slidegeeks experts have put their efforts and expertise into creating these impeccable powerpoint presentations so that you can communicate your ideas clearly. Moreover, all the templates are customizable, and easy-to-edit and downloadable. Use these for both personal and commercial use. This slide provides glimpse about six areas of financial planning and management that can improve financial standing of our company. It includes phases such as financial decisions, budgeting and forecasting, working capital management, etc.
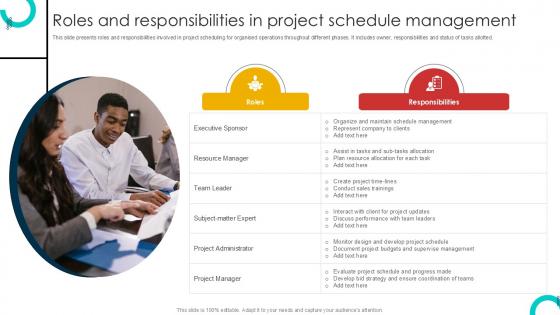
Roles And Responsibilities In Project Schedule Management Techniques PPT Template
This slide presents roles and responsibilities involved in project scheduling for organised operations throughout different phases. It includes owner, responsibilities and status of tasks allotted. Take your projects to the next level with our ultimate collection of Roles And Responsibilities In Project Schedule Management Techniques PPT Template. Slidegeeks has designed a range of layouts that are perfect for representing task or activity duration, keeping track of all your deadlines at a glance. Tailor these designs to your exact needs and give them a truly corporate look with your own brand colors they will make your projects stand out from the rest This slide presents roles and responsibilities involved in project scheduling for organised operations throughout different phases. It includes owner, responsibilities and status of tasks allotted.
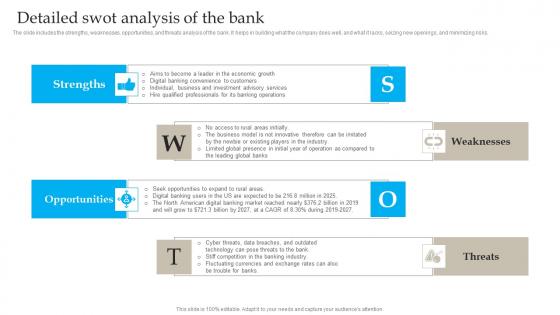
Detailed Swot Analysis Of The Bank Banking Industry Business Plan Go To Market Strategy Clipart Pdf
The slide includes the strengths, weaknesses, opportunities, and threats analysis of the bank. It helps in building what the company does well, and what it lacks, seizing new openings, and minimizing risks. Whether you have daily or monthly meetings, a brilliant presentation is necessary. Detailed Swot Analysis Of The Bank Banking Industry Business Plan Go To Market Strategy Clipart Pdf can be your best option for delivering a presentation. Represent everything in detail using Detailed Swot Analysis Of The Bank Banking Industry Business Plan Go To Market Strategy Clipart Pdf and make yourself stand out in meetings. The template is versatile and follows a structure that will cater to your requirements. All the templates prepared by Slidegeeks are easy to download and edit. Our research experts have taken care of the corporate themes as well. So, give it a try and see the results. The slide includes the strengths, weaknesses, opportunities, and threats analysis of the bank. It helps in building what the company does well, and what it lacks, seizing new openings, and minimizing risks.
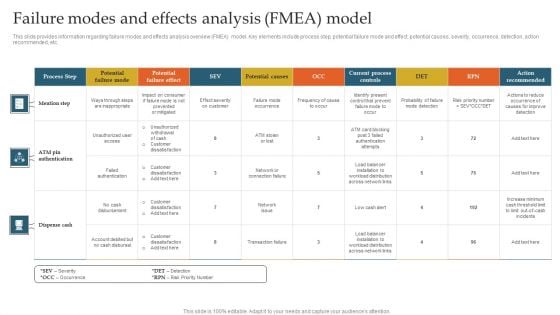
Failure Modes And Effects Analysis FMEA Model Ppt Summary Graphics Example PDF
This slide provides information regarding failure modes and effects analysis overview FMEA model. Key elements include process step, potential failure mode and effect, potential causes, severity, occurrence, detection, action recommended, etc. If you are looking for a format to display your unique thoughts, then the professionally designed Failure Modes And Effects Analysis FMEA Model Ppt Summary Graphics Example PDF is the one for you. You can use it as a Google Slides template or a PowerPoint template. Incorporate impressive visuals, symbols, images, and other charts. Modify or reorganize the text boxes as you desire. Experiment with shade schemes and font pairings. Alter, share or cooperate with other people on your work. Download Failure Modes And Effects Analysis FMEA Model Ppt Summary Graphics Example PDF and find out how to give a successful presentation. Present a perfect display to your team and make your presentation unforgettable.
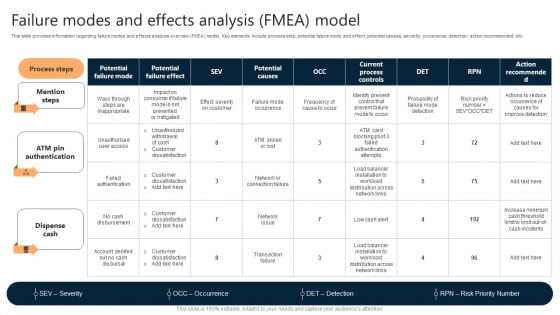
Failure Modes And Effects Analysis FMEA Model Ppt Layouts Graphics Example PDF
This slide provides information regarding failure modes and effects analysis overview FMEA model. Key elements include process step, potential failure mode and effect, potential causes, severity, occurrence, detection, action recommended, etc. If you are looking for a format to display your unique thoughts, then the professionally designed Failure Modes And Effects Analysis FMEA Model Ppt Layouts Graphics Example PDF is the one for you. You can use it as a Google Slides template or a PowerPoint template. Incorporate impressive visuals, symbols, images, and other charts. Modify or reorganize the text boxes as you desire. Experiment with shade schemes and font pairings. Alter, share or cooperate with other people on your work. Download Failure Modes And Effects Analysis FMEA Model Ppt Layouts Graphics Example PDF and find out how to give a successful presentation. Present a perfect display to your team and make your presentation unforgettable.
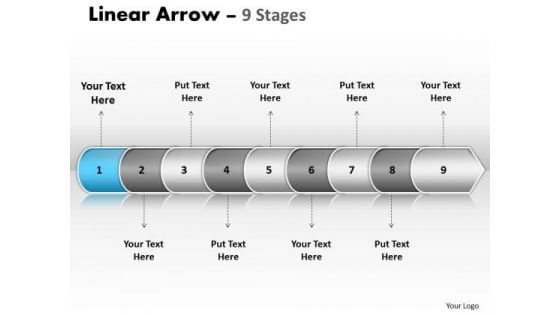
Flow Ppt Theme Linear Arrow 9 Power Point Stage Business Strategy PowerPoint 2 Image
We present our flow PPT Theme linear arrow 9 power point stage business strategy PowerPoint 2 Image. Use our Arrows PowerPoint Templates because, creating a winner is your passion and dream. Use our Layers PowerPoint Templates because, Start the gears of youthful minds and set them in motion. Use our Shapes PowerPoint Templates because, you understand the ailment and how to fight it. Use our Business PowerPoint Templates because, Marketing Strategy Business Template: - Maximizing sales of your product is the intended destination. Use our Process and Flows PowerPoint Templates because, illustrate the means to prevent or control them using our imaginative templates. Use these PowerPoint slides for presentations relating to abstract, algorithm, arrow, block diagram, business, chart, color, connection, design, development, diagram, direction, element, flow, graph, linear, linear diagram, management, organization, plan, process, section, segment, set, sign, solution, strategy, symbol, technology, vector. The prominent colors used in the PowerPoint template are Blue, Gray, and White Bid farewell to ifs and buts. With our Flow Ppt Theme Linear Arrow 9 Power Point Stage Business Strategy PowerPoint 2 Image you will be assured and decisive.
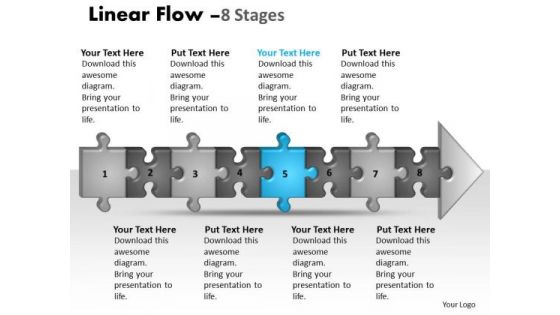
Strategy Ppt Theme Linear Flow 8 Stages Style1 Business PowerPoint 6 Image
We present our strategy PPT Theme linear Flow 8 stages style1 business Powerpoint 6 Image. Use our Puzzles or Jigsaws PowerPoint Templates because, Churn the mixture to the right degree and pound home your views and expectations in a spectacularly grand and virtuoso fluid performance. Use our Game Pieces PowerPoint Templates because; enlighten others on the process with this innovative graphic to authenticate your plan of achieving the goal of added value/profit. Use our Finance PowerPoint Templates because, are the seeds of many of our successes. Use our Shapes PowerPoint Templates because, Corporate Ladder:- The graphic is a symbol of growth and success. Use our Business PowerPoint Templates because, Amplify your views, ideas and thoughts from very basic aspects to the highly technical and complicated issues using this template as a tool. Use these PowerPoint slides for presentations relating to abstract, algorithm, arrow, block diagram, business, chart, color, connection, design, development, diagram, direction, element, flow, graph, linear, linear diagram, management, organization, plan, process, section, segment, set, sign, solution, strategy, symbol, technology, vector. The prominent colors used in the PowerPoint template are Blue, Gray, and Black Don't leave your career to chance. Let our Strategy Ppt Theme Linear Flow 8 Stages Style1 Business PowerPoint 6 Image help you take charge.
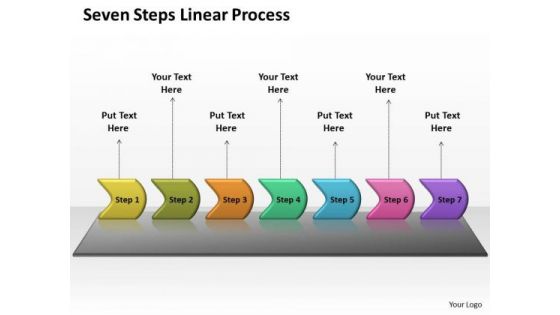
Strategy Ppt Theme Seven Steps Working With Slide Numbers Linear Process 1 Design
We present our strategy PPT Theme seven steps working with slide numbers linear process 1 design. Use our Arrows PowerPoint Templates because, You understand the illness and its causes. Use our Layers PowerPoint Templates because, unravel the process layer by layer and expose their relevance to the core issue. Use our Shapes PowerPoint Templates because, Visual appeal is a priority for us. Use our Business PowerPoint Templates because; demonstrate how they all combine to form the final product. Use our Process and Flows PowerPoint Templates because, Heighten the anticipation of your audience with this slide listing .Use these PowerPoint slides for presentations relating to abstract, algorithm, arrow, block diagram, business, chart, color, connection, design, development, diagram, direction, element, flow, graph, linear, linear diagram, management, organization, plan, process, section, segment, set, sign, solution, strategy, symbol, technology, vector. The prominent colors used in the PowerPoint template are Purple, Pink, and Blue Succeed admirably with our Strategy Ppt Theme Seven Steps Working With Slide Numbers Linear Process 1 Design. Download without worries with our money back guaranteee.
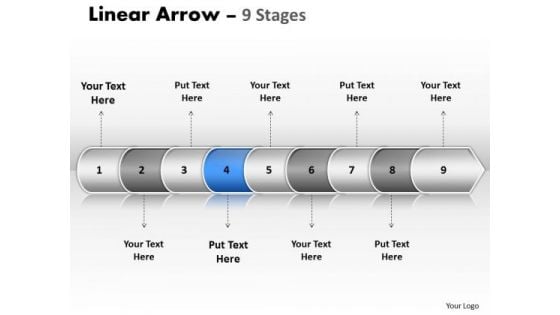
Success Ppt Theme Linear Arrow 9 Power Point Stage Time Management PowerPoint 5 Graphic
We present our success PPT Theme linear arrow 9 power point stage time management Powerpoint 5 Graphic. Use our Arrows PowerPoint Templates because, your brain is always churning out ideas like cogs in a wheel. Use our Layers PowerPoint Templates because, Bullet-point your thoughts and ideas to profitably accomplish every step of every stage along the way. Use our Shapes PowerPoint Templates because; Draw on its universal impact to highlight the similarities with your organizational structure and plans. Use our Business PowerPoint Templates because, Master them all and you have it made. Use our Process and Flows PowerPoint Templates because, our ready backdrops leave a lasting impression. Use these PowerPoint slides for presentations relating to abstract, algorithm, arrow, block diagram, business, chart, color, connection, design, development, diagram, direction, element, flow, graph, linear, linear diagram, management, organization, plan, process, section, segment, set, sign, solution, strategy, symbol, technology, vector. The prominent colors used in the PowerPoint template are Blue, Gray, and White Mentor teams with our Success Ppt Theme Linear Arrow 9 Power Point Stage Time Management PowerPoint 5 Graphic. Download without worries with our money back guaranteee.
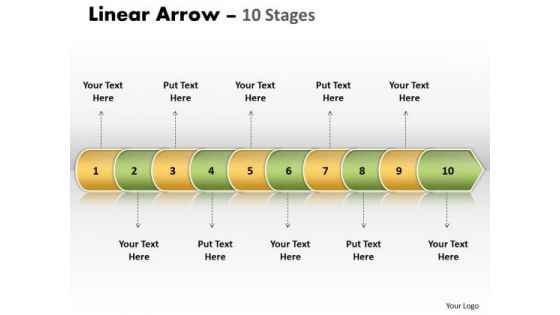
Success Ppt Theme Linear Arrow 10 Stages Business Plan PowerPoint Graphic
We present our success PPT Theme linear arrow 10 stages business plan Powerpoint Graphic. Use our Arrows PowerPoint Templates because, are the triggers of our growth. Use our Layers PowerPoint Templates because, However there is a key aspect to be emphasized. Use our Shapes PowerPoint Templates because; heighten the anticipation of your audience with this slide listing. Use our Business PowerPoint Templates because, Marketing Strategy Business Template:- Maximizing sales of your product is the intended destination. Use our Process and Flows PowerPoint Templates because, Bullet-point your thoughts and ideas to profitably accomplish every step of every stage along the way. Use these PowerPoint slides for presentations relating to abstract, algorithm, arrow, block diagram, business, chart, color, connection, design, development, diagram, direction, element, flow, graph, linear, linear diagram, management, organization, plan, process, section, segment, set, sign, solution, strategy, symbol, technology, vector. The prominent colors used in the PowerPoint template are Green, Yellow, and White Maintain the continuity of your thoughts. Our Success Ppt Theme Linear Arrow 10 Stages Business Plan PowerPoint Graphic will be the fillers.
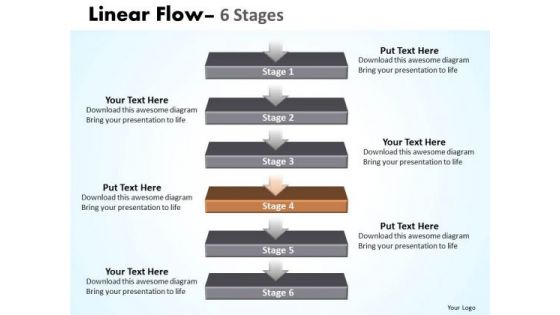
Success Ppt Theme Linear Flow 6 Stages1 Business Management PowerPoint 5 Image
We present our success PPT Theme linear flow 6 stages1 business management Powerpoint 5 Image. Use our Arrows PowerPoint Templates because, explain the relevance of the different layers and stages in getting down to your core competence, ability and desired result. Use our Layers PowerPoint Templates because, Weak Links & Chains:- Chain reactions and the element of teamwork add value to your efforts. Use our Shapes PowerPoint Templates because, you know your business and have a vision for it. Use our Business PowerPoint Templates because, they help to focus the thoughts of your listeners. Use our Process and Flows PowerPoint Templates because, Vision Ave Future St Template:- There was a vision of a desired destination and the best road to take to reach that goal. Use these PowerPoint slides for presentations relating to abstract, algorithm, arrow, block diagram, business, chart, color, connection, design, development, diagram, direction, element, flow, graph, linear, linear diagram, management, organization, plan, process, section, segment, set, sign, solution, strategy, symbol, technology, vector. The prominent colors used in the PowerPoint template are Brown, Gray, and Black Fix problems with our Success Ppt Theme Linear Flow 6 Stages1 Business Management PowerPoint 5 Image. Try us out and see what a difference our templates make.
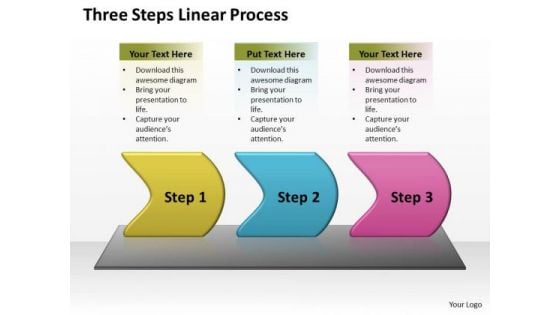
Success Ppt Theme Three Create PowerPoint Macro Working With Slide Numbers Linear Process 1 Design
We present our success PPT Theme three create Powerpoint macro working with slide numbers linear process 1 design. Use our Arrows PowerPoint Templates because; Break it all down to Key Result Areas. Use our Layers PowerPoint Templates because, coincidentally it always points to the top. Use our Shapes PowerPoint Templates because, Start with the fundamental basic activities and slowly but surely hone them down to the top of the pyramid, the ultimate goal. Use our Business PowerPoint Templates because; Employ the right colors for your brilliant ideas. Use our Process and Flows PowerPoint Templates because, Gears interconnected: - The Gear Train is a basic element of living and daily business. Use these PowerPoint slides for presentations relating to abstract, algorithm, arrow, block diagram, business, chart, color, connection, design, development, diagram, direction, element, flow, graph, linear, linear diagram, management, organization, plan, process, section, segment, set, sign, solution, strategy, symbol, technology, vector. The prominent colors used in the PowerPoint template are Green, Blue, and Pink Expectations escalate with our Success Ppt Theme Three Create PowerPoint Macro Working With Slide Numbers Linear Process 1 Design. They do their best to cater to them.
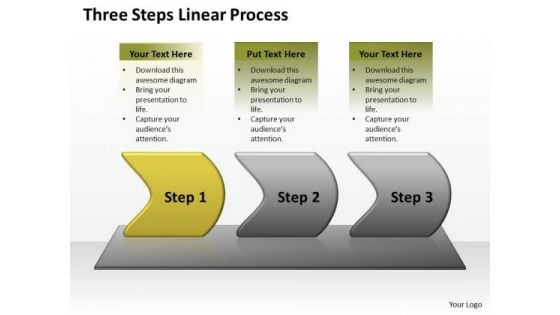
Success Ppt Theme Three Create PowerPoint Macro Working With Slide Numbers Linear Process 2 Design
We present our success PPT Theme three create Powerpoint macro working with slide numbers linear process 2 designs. Use our Arrows PowerPoint Templates because, you have analyzed the illness and know the need. Use our Layers PowerPoint Templates because, Original thinking is the need of the hour. Use our Shapes PowerPoint Templates because; demonstrate how you think out of the box. Use our Business PowerPoint Templates because, Will surely see the all making the grade. Use our Process and Flows PowerPoint Templates because, Health of the determines the quality of our lives. Use these PowerPoint slides for presentations relating to abstract, algorithm, arrow, block diagram, business, chart, color, connection, design, development, diagram, direction, element, flow, graph, linear, linear diagram, management, organization, plan, process, section, segment, set, sign, solution, strategy, symbol, technology, vector. The prominent colors used in the PowerPoint template are Green, Gray, and Black Our Success Ppt Theme Three Create PowerPoint Macro Working With Slide Numbers Linear Process 2 Design will never fight shy. They are confident of addressing any and every issue.
Diagram For 7 Different Schematic Representations Ppt Business Plan Models PowerPoint Slides
We present our diagram for 7 different schematic representations ppt business plan models PowerPoint Slides.Download and present our Education PowerPoint Templates because You can Stir your ideas in the cauldron of our PowerPoint Templates and Slides. Cast a magic spell on your audience. Download our Process and Flows PowerPoint Templates because You have gained great respect for your brilliant ideas. Use our PowerPoint Templates and Slides to strengthen and enhance your reputation. Download our Arrows PowerPoint Templates because It can Leverage your style with our PowerPoint Templates and Slides. Charm your audience with your ability. Use our Shapes PowerPoint Templates because you can Break through with our PowerPoint Templates and Slides. Bring down the mental barriers of your audience. Download our Shapes PowerPoint Templates because You can Connect the dots. Fan expectations as the whole picture emerges.Use these PowerPoint slides for presentations relating to Mark, corporate, business, plan, concept, bright, symbol, diagram, crayon, stack, graphic, finance, stock,analysis, drawing, paint, calculation, accounting, creative, economic, creativity, chart, forecast, design, color, objects, stationary, pencil, education,profit, information, background, investment, figures, business, business process. The prominent colors used in the PowerPoint template are Green, Black, Gray. Amity assists in cementing bonds. Advocate it with our Diagram For 7 Different Schematic Representations Ppt Business Plan Models PowerPoint Slides.
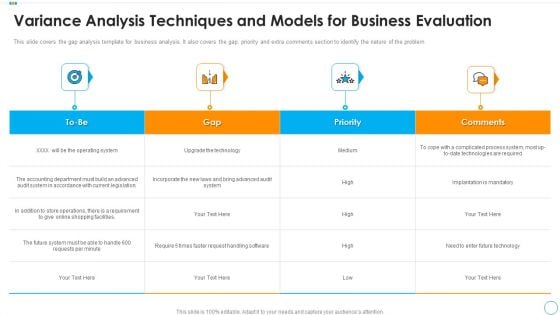
Variance Analysis Techniques And Models For Business Evaluation Formats PDF
This slide covers the gap analysis template for business analysis. It also covers the gap, priority and extra comments section to identify the nature of the problem. Presenting variance analysis techniques and models for business evaluation formats pdf to dispense important information. This template comprises four stages. It also presents valuable insights into the topics including medium, high, low. This is a completely customizable PowerPoint theme that can be put to use immediately. So, download it and address the topic impactfully.
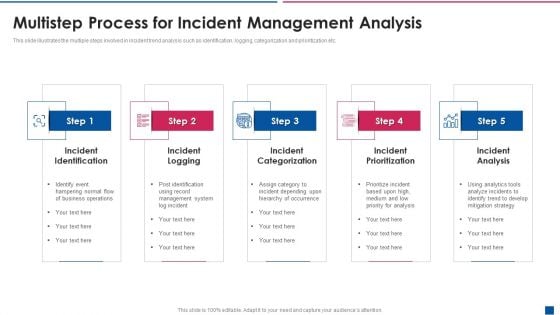
Multistep Process For Incident Management Analysis Portrait PDF
This slide illustrates the multiple steps involved in incident trend analysis such as identification, logging, categorization and prioritization etc. Presenting multistep process for incident management analysis portrait pdf to dispense important information. This template comprises five stages. It also presents valuable insights into the topics including incident prioritization, incident analysis, incident categorization. This is a completely customizable PowerPoint theme that can be put to use immediately. So, download it and address the topic impactfully.
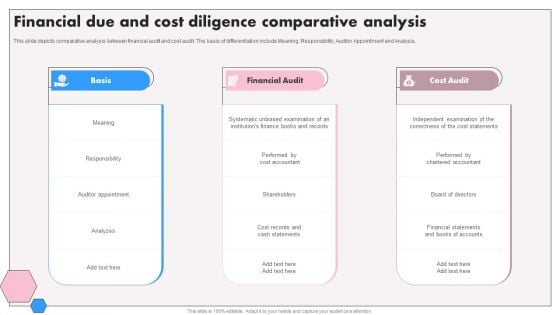
Financial Due And Cost Diligence Comparative Analysis Portrait PDF
This slide depicts comparative analysis between financial audit and cost audit. The basis of differentiation include Meaning, Responsibility, Auditor Appointment and Analysis. Presenting Financial Due And Cost Diligence Comparative Analysis Portrait PDF to dispense important information. This template comprises three stages. It also presents valuable insights into the topics including Basis, Financial Audit, Cost Audit. This is a completely customizable PowerPoint theme that can be put to use immediately. So, download it and address the topic impactfully.
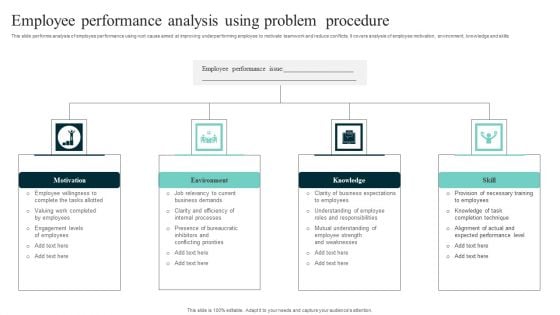
Employee Performance Analysis Using Problem Procedure Slides PDF
This slide performs analysis of employee performance using root cause aimed at improving underperforming employee to motivate teamwork and reduce conflicts. It covers analysis of employee motivation, environment, knowledge and skills. Presenting Employee Performance Analysis Using Problem Procedure Slides PDF to dispense important information. This template comprises four stages. It also presents valuable insights into the topics including Environment, Motivation, Skill. This is a completely customizable PowerPoint theme that can be put to use immediately. So, download it and address the topic impactfully.
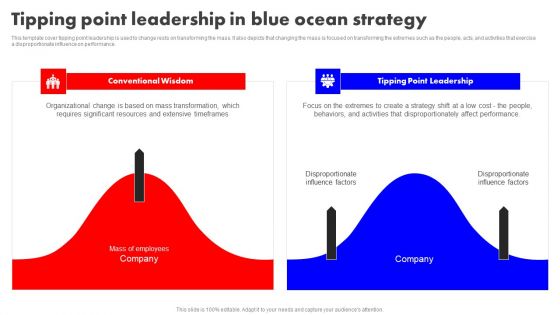
Detailed Analysis Of Red Ocean Vs Blue Ocean Approach Tipping Point Leadership In Blue Ocean Strategy Diagrams PDF
This template cover tipping point leadership is used to change rests on transforming the mass. It also depicts that changing the mass is focused on transforming the extremes such as the people, acts, and activities that exercise a disproportionate influence on performance. Want to ace your presentation in front of a live audience Our Detailed Analysis Of Red Ocean Vs Blue Ocean Approach Tipping Point Leadership In Blue Ocean Strategy Diagrams PDF can help you do that by engaging all the users towards you. Slidegeeks experts have put their efforts and expertise into creating these impeccable powerpoint presentations so that you can communicate your ideas clearly. Moreover, all the templates are customizable, and easy to edit and downloadable. Use these for both personal and commercial use.

Organization Chart Customer Retention And Engagement Strategy Inspiration PDF
Presenting organization chart customer retention and engagement strategy inspiration pdf to provide visual cues and insights. Share and navigate important information on five stages that need your due attention. This template can be used to pitch topics like director, developer, designer, editor. In addtion, this PPT design contains high resolution images, graphics, etc, that are easily editable and available for immediate download.
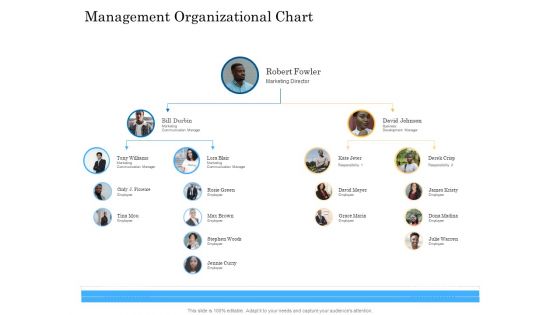
Deal Assessment Audit Process Management Organizational Chart Professional PDF
Presenting deal assessment audit process management organizational chart professional pdf to provide visual cues and insights. Share and navigate important information on seven stages that need your due attention. This template can be used to pitch topics like marketing communication, employee, business development manager. In addition, this PPT design contains high-resolution images, graphics, etc, that are easily editable and available for immediate download.
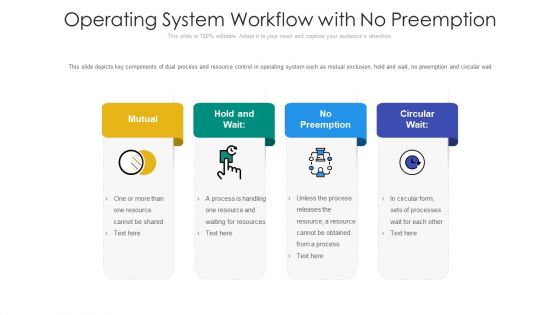
Operating System Workflow With No Preemption Ppt PowerPoint Presentation Gallery Diagrams PDF
This slide depicts key components of dual process and resource control in operating system such as mutual exclusion, hold and wait, no preemption and circular wait. Presenting operating system workflow with no preemption ppt powerpoint presentation gallery diagrams pdf to dispense important information. This template comprises four stages. It also presents valuable insights into the topics including mutual, no preemption, circular wait. This is a completely customizable PowerPoint theme that can be put to use immediately. So, download it and address the topic impactfully.
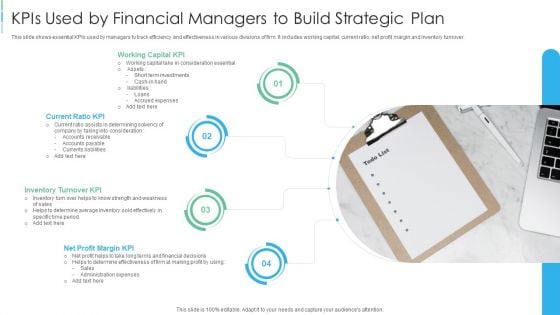
Kpis Used By Financial Managers To Build Strategic Plan Diagrams PDF
This slide shows essential KPIs used by managers to track efficiency and effectiveness in various divisions of firm. It includes working capital, current ratio, net profit margin and inventory turnover.Presenting Kpis Used By Financial Managers To Build Strategic Plan Diagrams PDF to dispense important information. This template comprises four stages. It also presents valuable insights into the topics including Working Capital KPI, Current Ratio KPI, Inventory Turnover KPI. This is a completely customizable PowerPoint theme that can be put to use immediately. So, download it and address the topic impactfully.
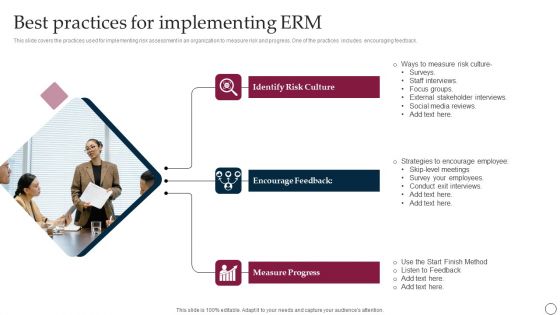
Best Practices For Implementing ERM Ppt PowerPoint Presentation File Diagrams PDF
This slide covers the practices used for implementing risk assessment in an organization to measure risk and progress. One of the practices includes encouraging feedback. Presenting Best Practices For Implementing ERM Ppt PowerPoint Presentation File Diagrams PDF to dispense important information. This template comprises three stages. It also presents valuable insights into the topics including Encourage Feedback, Identify Risk Culture, Measure Progress. This is a completely customizable PowerPoint theme that can be put to use immediately. So, download it and address the topic impactfully.
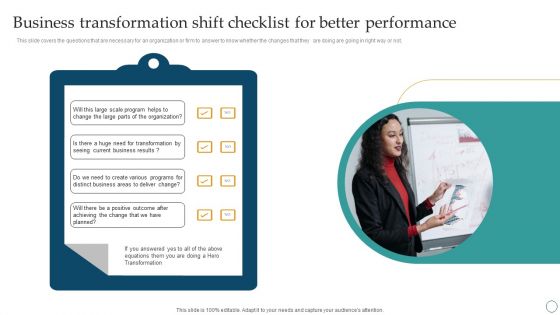
Business Transformation Shift Checklist For Better Performance Ppt PowerPoint Presentation Diagram PDF
This slide covers the questions that are necessary for an organization or firm to answer to know whether the changes that they are doing are going in right way or not. Presenting Business Transformation Shift Checklist For Better Performance Ppt PowerPoint Presentation Diagram PDF to dispense important information. This template comprises one stages. It also presents valuable insights into the topics including Business, Organization, Transformation. This is a completely customizable PowerPoint theme that can be put to use immediately. So, download it and address the topic impactfully.
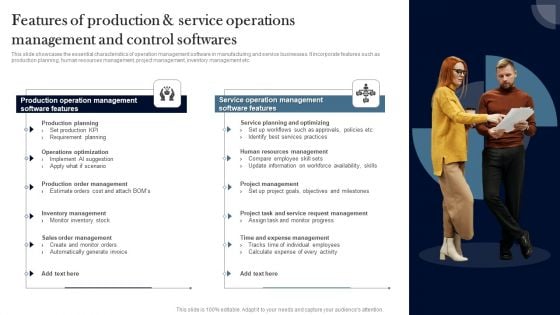
Features Of Production And Service Operations Management And Control Softwares Diagrams PDF
This slide showcases the essential characteristics of operation management software in manufacturing and service businesses. It incorporate features such as production planning, human resources management, project management, inventory management etc. Presenting Features Of Production And Service Operations Management And Control Softwares Diagrams PDF to dispense important information. This template comprises two stages. It also presents valuable insights into the topics including Production Planning, Operations Optimization, Production Order Management. This is a completely customizable PowerPoint theme that can be put to use immediately. So, download it and address the topic impactfully.
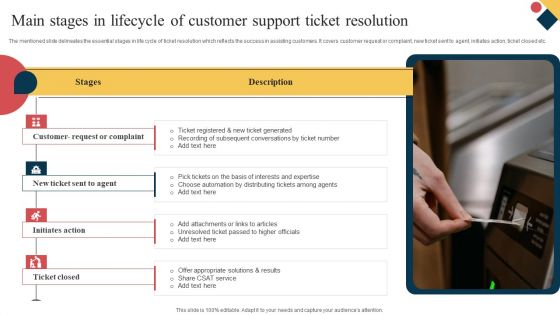
Main Stages In Lifecycle Of Customer Support Ticket Resolution Diagrams PDF
The mentioned slide delineates the essential stages in life cycle of ticket resolution which reflects the success in assisting customers. It covers customer request or complaint, new ticket sent to agent, initiates action, ticket closed etc. Presenting Main Stages In Lifecycle Of Customer Support Ticket Resolution Diagrams PDF to dispense important information. This template comprises four stages. It also presents valuable insights into the topics including Customer Request Complaint, Initiates Action, Ticket Closed. This is a completely customizable PowerPoint theme that can be put to use immediately. So, download it and address the topic impactfully.
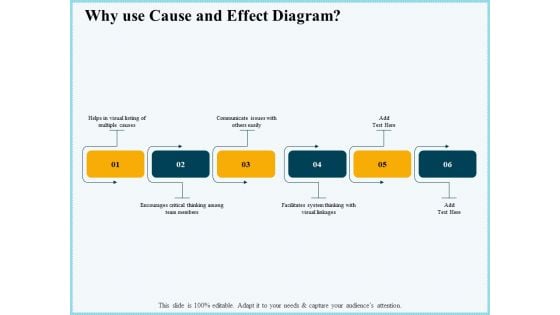
Vicious Circle Effect On Quality Assurance Why Use Cause And Effect Diagram Ppt Portfolio Example Topics PDF
This is a vicious circle effect on quality assurance why use cause and effect diagram ppt portfolio example topics pdf template with various stages. Focus and dispense information on six stages using this creative set, that comes with editable features. It contains large content boxes to add your information on topics like Helps visual listing multiple causes, Communicate issues others easily, Encourages critical thinking among team members, Facilitates system thinking visual linkages. You can also showcase facts, figures, and other relevant content using this PPT layout. Grab it now.
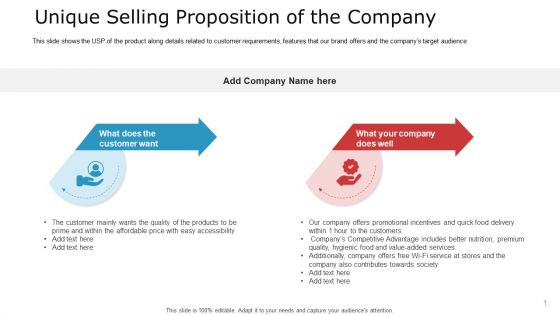
Pitch Deck To Raise Capital From Commercial Financial Institution Using Bonds Unique Selling Proposition Of The Company Diagrams PDF
This slide shows the USP of the product along details related to customer requirements, features that our brand offers and the companys target audience This is a pitch deck to raise capital from commercial financial institution using bonds unique selling proposition of the company diagrams pdf template with various stages. Focus and dispense information on two stages using this creative set, that comes with editable features. It contains large content boxes to add your information on topics like unique selling proposition of the company. You can also showcase facts, figures, and other relevant content using this PPT layout. Grab it now.

 Home
Home