Data Lifecycle
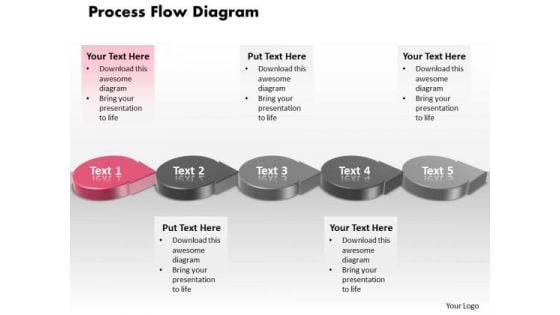
Ppt Pink Circle Arrow Process Flow Network Diagram PowerPoint Template Templates
PPT pink circle arrow process flow network diagram powerpoint template Templates-This 3D PowerPoint Diagram shows the five interconnected stages represented by first Pink Circular Arrow. It signifies the concept of aspect, attribute, bearing, complexion, component, differentia, disposition, distinction, earmark, essence, essential etc.-PPT pink circle arrow process flow network diagram powerpoint template Templates-3d, Advertisement, Advertising, Arrow, Border, Business, Circles, Collection, Customer, Design, Element, Icon, Idea, Illustration, Info, Information, Isolated, Label, Light, Location, Needle, New, Notification, Notify, Point, Pointer, Promotion, Role, Rounded Our Ppt Pink Circle Arrow Process Flow Network Diagram PowerPoint Template Templates will leave your audience truly enraptured. They will definitely take a fancy to you.

Devops Process Flow Ppt PowerPoint Presentation File Styles PDF
This slide provides the glimpse about the DevOps process flow which covers stages such as plan, code, create, test, release, deploy and operate. Get a simple yet stunning designed Devops Process Flow Ppt PowerPoint Presentation File Styles PDF. It is the best one to establish the tone in your meetings. It is an excellent way to make your presentations highly effective. So, download this PPT today from Slidegeeks and see the positive impacts. Our easy to edit Devops Process Flow Ppt PowerPoint Presentation File Styles PDF can be your go to option for all upcoming conferences and meetings. So, what are you waiting for Grab this template today.

Integrating AI With IoT Key Statistics Associated With AIoT IoT SS V
The purpose of this slide is to showcase major statistics that are associated with Artificial Intelligence of Things AIoT market. It covers detailed information about AIoT market size, total number of IoT devices, growth of smart cities market, market size of wearable device market, etc. The Integrating AI With IoT Key Statistics Associated With AIoT IoT SS V is a compilation of the most recent design trends as a series of slides. It is suitable for any subject or industry presentation, containing attractive visuals and photo spots for businesses to clearly express their messages. This template contains a variety of slides for the user to input data, such as structures to contrast two elements, bullet points, and slides for written information. Slidegeeks is prepared to create an impression. The purpose of this slide is to showcase major statistics that are associated with Artificial Intelligence of Things AIoT market. It covers detailed information about AIoT market size, total number of IoT devices, growth of smart cities market, market size of wearable device market, etc.
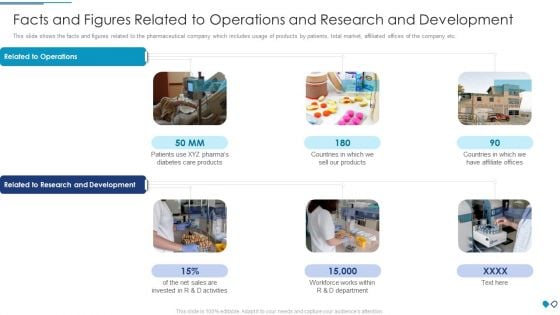
Facts And Figures Related To Operations And Research And Development Structure PDF
This slide shows the facts and figures related to the pharmaceutical company which includes usage of products by patients, total market, affiliated offices of the company etc.Deliver an awe inspiring pitch with this creative facts and figures related to operations and research and development structure pdf bundle. Topics like invested in r and d activities, affiliate offices, research and development can be discussed with this completely editable template. It is available for immediate download depending on the needs and requirements of the user.
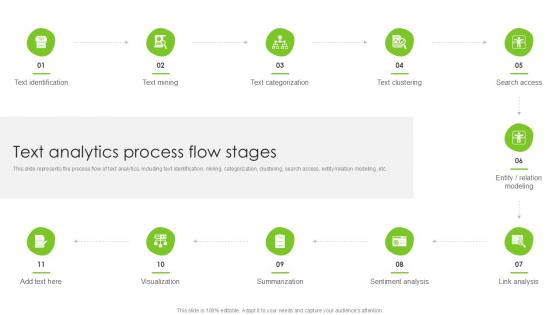
Text Analytics Process Flow Stages PPT Sample SS
This slide represents the process flow of text analytics, including text identification, mining, categorization, clustering, search access, entity relation modeling, etc. Do you know about Slidesgeeks Text Analytics Process Flow Stages PPT Sample SS These are perfect for delivering any kind od presentation. Using it, create PowerPoint presentations that communicate your ideas and engage audiences. Save time and effort by using our pre-designed presentation templates that are perfect for a wide range of topic. Our vast selection of designs covers a range of styles, from creative to business, and are all highly customizable and easy to edit. Download as a PowerPoint template or use them as Google Slides themes. This slide represents the process flow of text analytics, including text identification, mining, categorization, clustering, search access, entity relation modeling, etc.
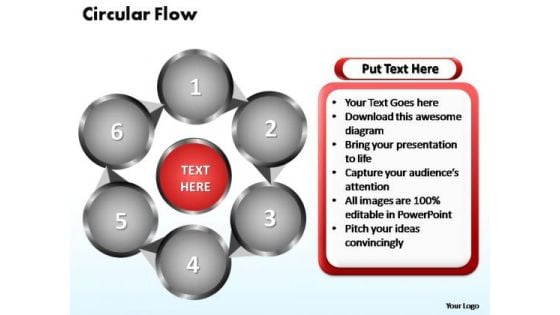
PowerPoint Themes Circular Flow Chart Ppt Layouts
PowerPoint Themes Circular Flow Chart PPT Layouts-Flowchart is a simple mapping tool that shows the sequence of actions within a process. Flowchart is widely used in business, education and economic presentations to help the audience visualize the content better, or to find flaws in a process.-PowerPoint Themes Circular Flow Chart PPT Layouts Our PowerPoint Themes Circular Flow Chart Ppt Layouts have no failings. They have been designed with attention to detail.
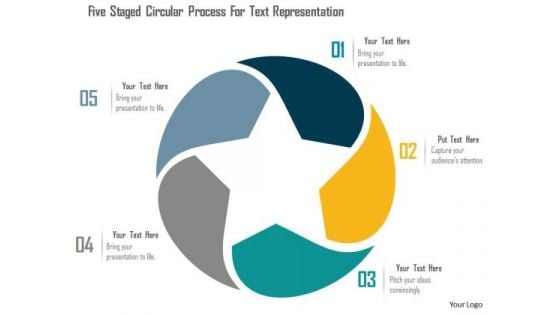
Business Diagram Five Staged Circular Process For Text Representation Presentation Template
Five staged circular process diagram in used in this business slide. Download our above diagram to express information in a visual way. This diagram offers a way for your audience to visually conceptualize the process.

Merry Christmas With Tree Flow Chart Making PowerPoint Slides
We present our merry christmas with tree flow chart making PowerPoint Slides.Use our Events PowerPoint Templates because,The ideas and plans are on your finger tips. Use our Festival PowerPoint Templates because, It helps your team to align their arrows to consistently be accurate. Use our Religion PowerPoint Templates because, It unravels the process layer by layer and exposes their relevance to the core issue. Use our Symbol PowerPoint Templates because,You can Show them the way, be Captain of the ship and lead them to new shores. Use our Design PowerPoint Templates because,It helps you to Inform your team of your innovative ideas.Use these PowerPoint slides for presentations relating to Background, Business, Celebration, Christmas, Conceptual, Congratulation, Design, Element, Events, Graphic, Greeting, Holidays, Inscription, Invitation, Merry, Mistletoe, Phrase, Sign, Style, Wishes. The prominent colors used in the PowerPoint template are Blue , Red, Pink Sprint to success with our Merry Christmas With Tree Flow Chart Making PowerPoint Slides. You will come out on top.

Busines Diagram Five Staged Test Tubes For Science Based Values Representation Ppt Template
Five staged test tubes are used to design this business diagram. This business slide contains the concept of value representation based on scientific data. Ideas are best expressed easily with the help of this diagram slide
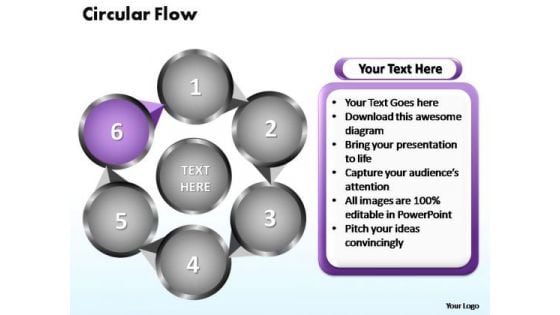
PowerPoint Themes Circular Flow Chart Ppt Slide
PowerPoint Themes Circular Flow Chart PPT Slide-Flowchart is a simple mapping tool that shows the sequence of actions within a process. Flowchart is widely used in business, education and economic presentations to help the audience visualize the content better, or to find flaws in a process.-PowerPoint Themes Circular Flow Chart PPT Slide Intensify growth with our PowerPoint Themes Circular Flow Chart Ppt Slide. Download without worries with our money back guaranteee.
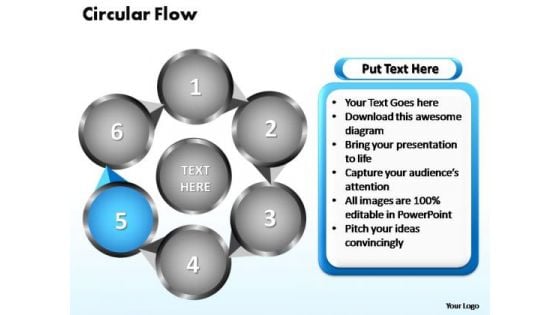
PowerPoint Themes Circular Flow Chart Ppt Slides
PowerPoint Themes Circular Flow Chart PPT Slides-Flowchart is a simple mapping tool that shows the sequence of actions within a process. Flowchart is widely used in business, education and economic presentations to help the audience visualize the content better, or to find flaws in a process.-PowerPoint Themes Circular Flow Chart PPT Slides Our PowerPoint Themes Circular Flow Chart Ppt Slides are cent per cent adaptable. They conform to all conditions.
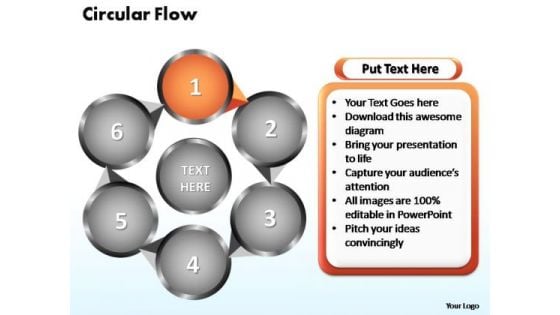
PowerPoint Themes Circular Flow Chart Ppt Template
PowerPoint Themes Circular Flow Chart PPT Template-Flowchart is a simple mapping tool that shows the sequence of actions within a process. Flowchart is widely used in business, education and economic presentations to help the audience visualize the content better, or to find flaws in a process.-PowerPoint Themes Circular Flow Chart PPT Template Our PowerPoint Themes Circular Flow Chart Ppt Template will ensure you make an impressive presentation You will be glad you tried us out.
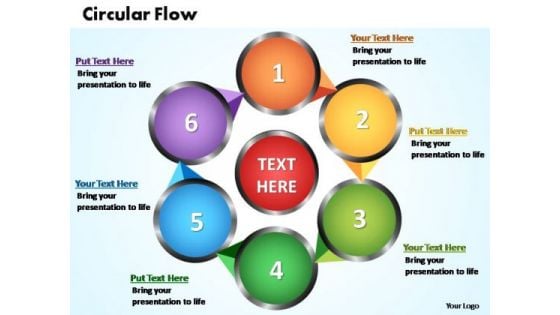
PowerPoint Themes Circular Flow Chart Ppt Templates
PowerPoint Themes Circular Flow Chart PPT Templates-Flowchart is a simple mapping tool that shows the sequence of actions within a process. Flowchart is widely used in business, education and economic presentations to help the audience visualize the content better, or to find flaws in a process.-PowerPoint Themes Circular Flow Chart PPT Templates Your thoughts and our PowerPoint Themes Circular Flow Chart Ppt Templates will make an excellent ensemble. They will capture all awards.
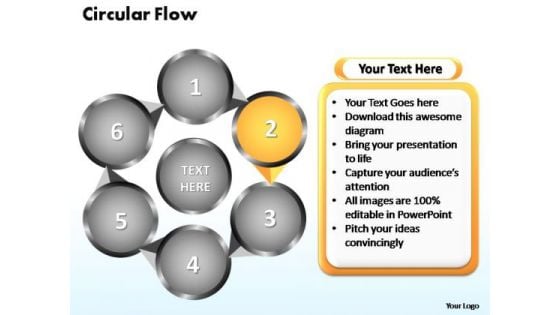
PowerPoint Themes Circular Flow Chart Ppt Theme
PowerPoint Themes Circular Flow Chart PPT Theme-Flowchart is a simple mapping tool that shows the sequence of actions within a process. Flowchart is widely used in business, education and economic presentations to help the audience visualize the content better, or to find flaws in a process.-PowerPoint Themes Circular Flow Chart PPT Theme Become a brand with our PowerPoint Themes Circular Flow Chart Ppt Theme. Build on your expertise with their assistance.
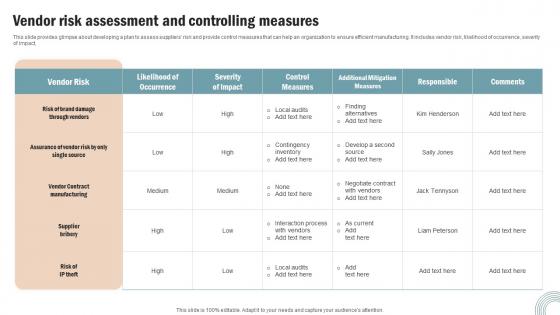
Vendor Risk Assessment Controlling Operations Strategy Improve Business Productivity Inspiration Pdf
This slide provides glimpse about developing a plan to assess suppliers risk and provide control measures that can help an organization to ensure efficient manufacturing. It includes vendor risk, likelihood of occurrence, severity of impact, Find highly impressive Vendor Risk Assessment Controlling Operations Strategy Improve Business Productivity Inspiration Pdf on Slidegeeks to deliver a meaningful presentation. You can save an ample amount of time using these presentation templates. No need to worry to prepare everything from scratch because Slidegeeks experts have already done a huge research and work for you. You need to download Vendor Risk Assessment Controlling Operations Strategy Improve Business Productivity Inspiration Pdf for your upcoming presentation. All the presentation templates are 100 percent editable and you can change the color and personalize the content accordingly. Download now This slide provides glimpse about developing a plan to assess suppliers risk and provide control measures that can help an organization to ensure efficient manufacturing. It includes vendor risk, likelihood of occurrence, severity of impact
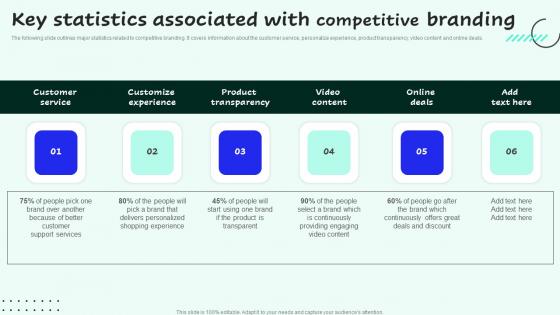
Key Statistics Associated With Competitive Branding Strategies For Enhancing Sales And Sample Pdf
The following slide outlines major statistics related to competitive branding. It covers information about the customer service, personalize experience, product transparency, video content and online deals. Formulating a presentation can take up a lot of effort and time, so the content and message should always be the primary focus. The visuals of the PowerPoint can enhance the presenters message, so our Key Statistics Associated With Competitive Branding Strategies For Enhancing Sales And Sample Pdf was created to help save time. Instead of worrying about the design, the presenter can concentrate on the message while our designers work on creating the ideal templates for whatever situation is needed. Slidegeeks has experts for everything from amazing designs to valuable content, we have put everything into Key Statistics Associated With Competitive Branding Strategies For Enhancing Sales And Sample Pdf The following slide outlines major statistics related to competitive branding. It covers information about the customer service, personalize experience, product transparency, video content and online deals.
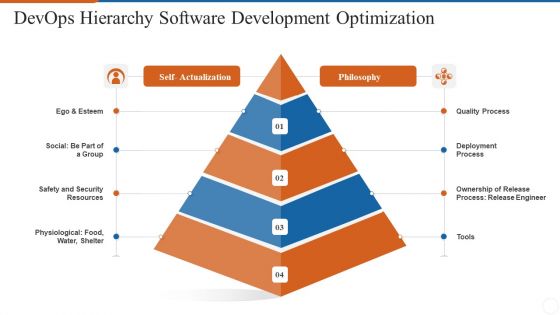
Operations Management Skills Devops Hierarchy Software Development Optimization Diagrams PDF
This is a operations management skills devops hierarchy software development optimization diagrams pdf template with various stages. Focus and dispense information on four stages using this creative set, that comes with editable features. It contains large content boxes to add your information on topics like deployment process, quality process, safety and security resources, philosophy, self actualization. You can also showcase facts, figures, and other relevant content using this PPT layout. Grab it now.
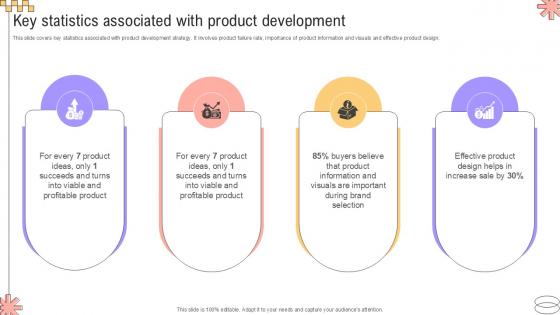
Key Statistics Associated With Product Implementing Geographic Extension PPT PowerPoint Strategy SS V
This slide covers key statistics associated with product development strategy. It involves product failure rate, importance of product information and visuals and effective product design. Formulating a presentation can take up a lot of effort and time, so the content and message should always be the primary focus. The visuals of the PowerPoint can enhance the presenters message, so our Key Statistics Associated With Product Implementing Geographic Extension PPT PowerPoint Strategy SS V was created to help save time. Instead of worrying about the design, the presenter can concentrate on the message while our designers work on creating the ideal templates for whatever situation is needed. Slidegeeks has experts for everything from amazing designs to valuable content, we have put everything into Key Statistics Associated With Product Implementing Geographic Extension PPT PowerPoint Strategy SS V This slide covers key statistics associated with product development strategy. It involves product failure rate, importance of product information and visuals and effective product design.
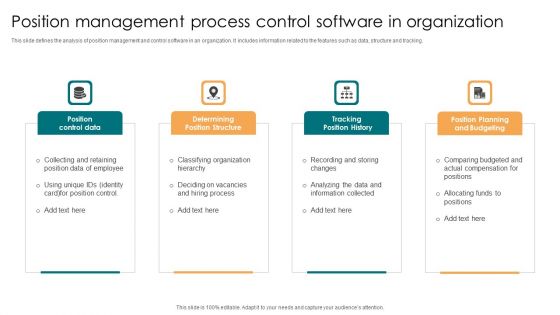
Position Management Process Control Software In Organization Microsoft PDF
This slide defines the analysis of position management and control software in an organization. It includes information related to the features such as data, structure and tracking. Persuade your audience using this Position Management Process Control Software In Organization Microsoft PDF. This PPT design covers four stages, thus making it a great tool to use. It also caters to a variety of topics including Position Control Data, Determining Position Structure, Tracking Position History. Download this PPT design now to present a convincing pitch that not only emphasizes the topic but also showcases your presentation skills.
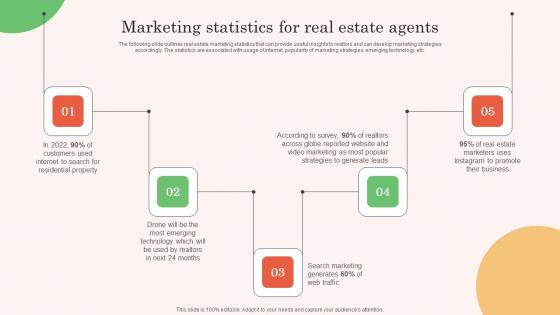
Marketing Statistics For Real Estate Agents Real Estate Property Marketing Portrait Pdf
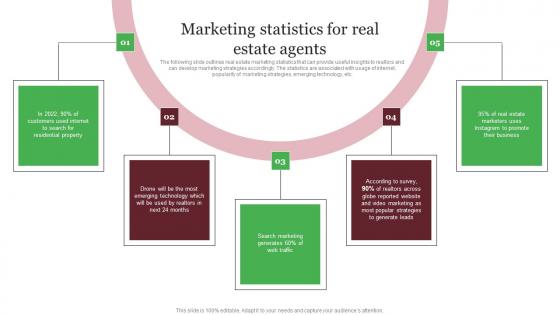
The following slide outlines real estate marketing statistics that can provide useful insights to realtors and can develop marketing strategies accordingly. The statistics are associated with usage of internet, popularity of marketing strategies, emerging technology, etc.Create an editable Marketing Statistics For Real Estate Agents Real Estate Property Marketing Portrait Pdf that communicates your idea and engages your audience. Whether you are presenting a business or an educational presentation, pre-designed presentation templates help save time. Marketing Statistics For Real Estate Agents Real Estate Property Marketing Portrait Pdf is highly customizable and very easy to edit, covering many different styles from creative to business presentations. Slidegeeks has creative team members who have crafted amazing templates. So, go and get them without any delay. The following slide outlines real estate marketing statistics that can provide useful insights to realtors and can develop marketing strategies accordingly. The statistics are associated with usage of internet, popularity of marketing strategies, emerging technology, etc.
Marketing Statistics For Real Estate Agents Out Of The Box Real Topics Pdf
The following slide outlines real estate marketing statistics that can provide useful insights to realtors and can develop marketing strategies accordingly. The statistics are associated with usage of internet, popularity of marketing strategies, emerging technology, etc. Create an editable Marketing Statistics For Real Estate Agents Out Of The Box Real Topics Pdf that communicates your idea and engages your audience. Whether you are presenting a business or an educational presentation, pre-designed presentation templates help save time. Marketing Statistics For Real Estate Agents Out Of The Box Real Topics Pdf is highly customizable and very easy to edit, covering many different styles from creative to business presentations. Slidegeeks has creative team members who have crafted amazing templates. So, go and get them without any delay. The following slide outlines real estate marketing statistics that can provide useful insights to realtors and can develop marketing strategies accordingly. The statistics are associated with usage of internet, popularity of marketing strategies, emerging technology, etc.
Ethical Operating System OS Overview About Duration Guide For Ethical Technology Pictures Pdf
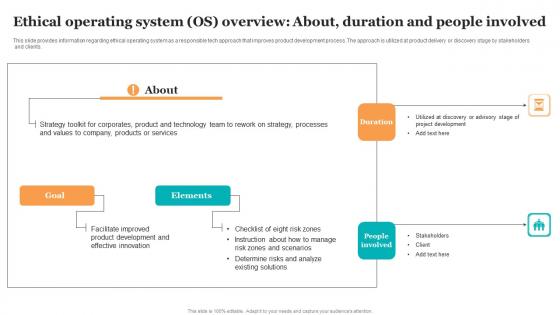
This slide provides information regarding ethical operating system as a responsible tech approach that improves product development process. The approach is utilized at product delivery or discovery stage by stakeholders and clients. Find highly impressive Ethical Operating System OS Overview About Duration Guide For Ethical Technology Pictures Pdf on Slidegeeks to deliver a meaningful presentation. You can save an ample amount of time using these presentation templates. No need to worry to prepare everything from scratch because Slidegeeks experts have already done a huge research and work for you. You need to download Ethical Operating System OS Overview About Duration Guide For Ethical Technology Pictures Pdf for your upcoming presentation. All the presentation templates are 100 percent editable and you can change the color and personalize the content accordingly. Download now. This slide provides information regarding ethical operating system as a responsible tech approach that improves product development process. The approach is utilized at product delivery or discovery stage by stakeholders and clients.
Smart Action Plan Ppt PowerPoint Presentation Inspiration Background
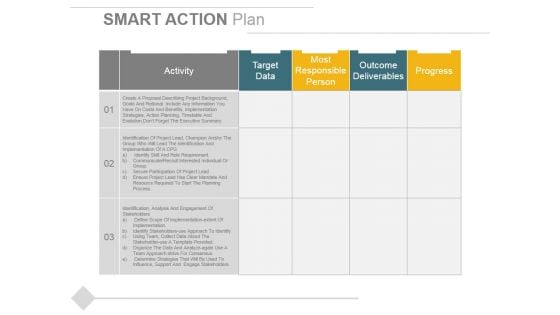
This is a smart action plan ppt powerpoint presentation inspiration background. This is a three stage process. The stages in this process are activity, target data, most responsible person, outcome deliverables, progress.
Business Intelligence Financial Reporting Ppt PowerPoint Presentation Layouts Model
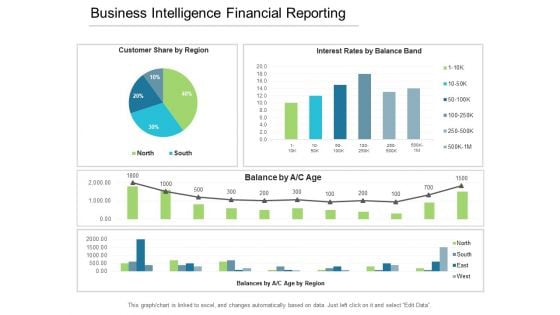
This is a business intelligence financial reporting ppt powerpoint presentation layouts model. This is a four stage process. The stages in this process are business analytics, ba, organizations data.
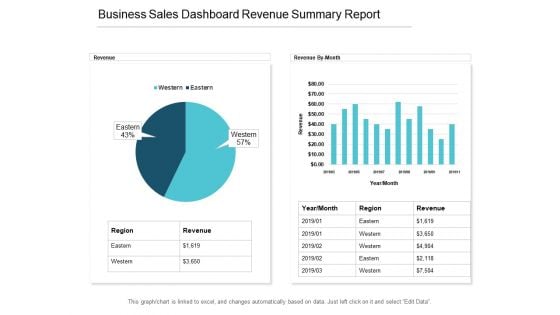
Business Sales Dashboard Revenue Summary Report Ppt PowerPoint Presentation Pictures Structure
This is a business sales dashboard revenue summary report ppt powerpoint presentation pictures structure. This is a two stage process. The stages in this process are business analytics, ba, organizations data.
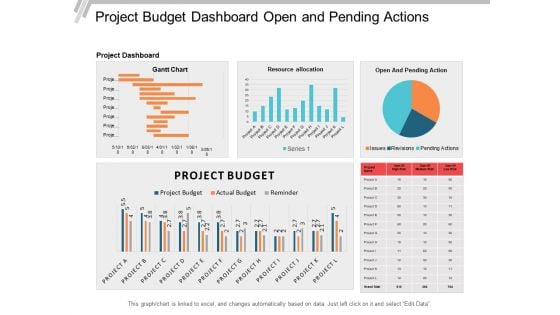
Project Budget Dashboard Open And Pending Actions Ppt PowerPoint Presentation File Templates
This is a project budget dashboard open and pending actions ppt powerpoint presentation file templates. This is a three stage process. The stages in this process are business analytics, ba, organizations data.
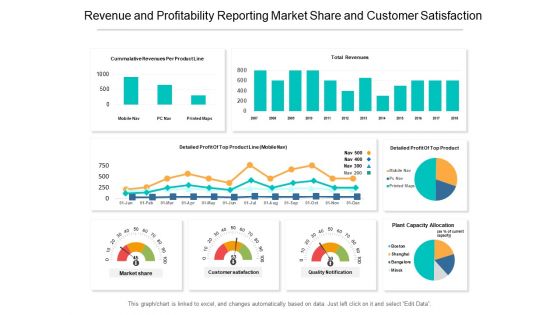
Revenue And Profitability Reporting Market Share And Customer Satisfaction Ppt PowerPoint Presentation Styles Format Ideas
This is a revenue and profitability reporting market share and customer satisfaction ppt powerpoint presentation styles format ideas. This is a four stage process. The stages in this process are business analytics, ba, organizations data.
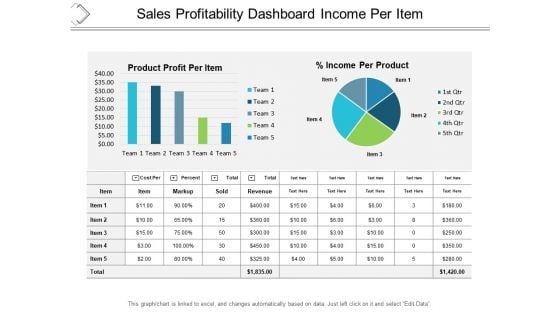
Sales Profitability Dashboard Income Per Item Ppt PowerPoint Presentation Professional Graphic Images
This is a sales profitability dashboard income per item ppt powerpoint presentation professional graphic images. This is a five stage process. The stages in this process are business analytics, ba, organizations data.
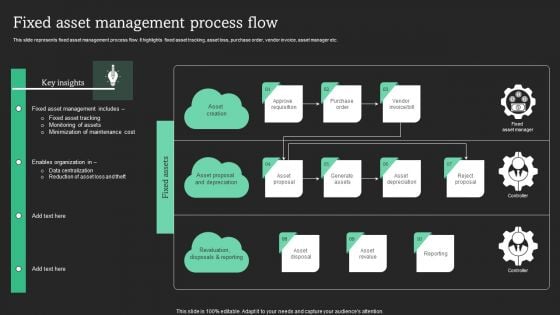
Fixed Asset Management Process Flow Designs PDF
This slide represents fixed asset management process flow. It highlights fixed asset tracking, asset loss, purchase order, vendor invoice, asset manager etc. Do you have to make sure that everyone on your team knows about any specific topic I yes, then you should give Fixed Asset Management Process Flow Designs PDF a try. Our experts have put a lot of knowledge and effort into creating this impeccable Fixed Asset Management Process Flow Designs PDF. You can use this template for your upcoming presentations, as the slides are perfect to represent even the tiniest detail. You can download these templates from the Slidegeeks website and these are easy to edit. So grab these today.
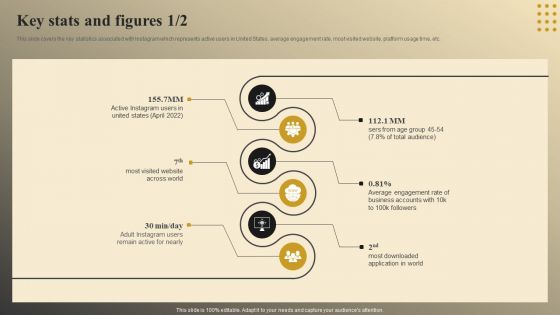
Online Video Model Company Profile Key Stats And Figures Portrait PDF
This slide covers the key statistics associated with Instagram which represents active users in United States, average engagement rate, most visited website, platform usage time, etc. Slidegeeks is here to make your presentations a breeze with Online Video Model Company Profile Key Stats And Figures Portrait PDF With our easy to use and customizable templates, you can focus on delivering your ideas rather than worrying about formatting. With a variety of designs to choose from, you are sure to find one that suits your needs. And with animations and unique photos, illustrations, and fonts, you can make your presentation pop. So whether you are giving a sales pitch or presenting to the board, make sure to check out Slidegeeks first.
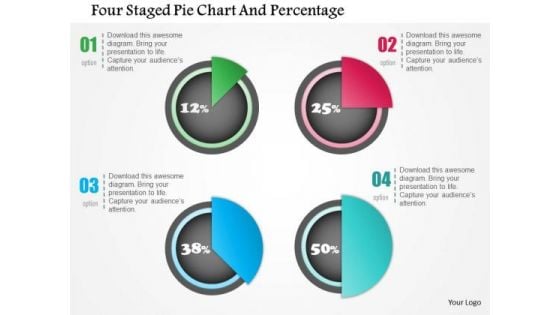
Business Diagram Four Staged Pie Chart And Percentage Presentation Template
Four staged pie chart and percentage values has been used to design this power point template. This PPT contains the concept of financial result analysis. Use this PPT for business and marketing related presentations.

Global Digital Education Key Statistics Of The Edtech Industry In Asia Pacific IR SS V
This slide showcases the EdTech industry analysis of Asia-Pacific region which includes key statistics such as percentage of share contributed to edtech industry, largest market, etc. This Global Digital Education Key Statistics Of The Edtech Industry In Asia Pacific IR SS V from Slidegeeks makes it easy to present information on your topic with precision. It provides customization options, so you can make changes to the colors, design, graphics, or any other component to create a unique layout. It is also available for immediate download, so you can begin using it right away. Slidegeeks has done good research to ensure that you have everything you need to make your presentation stand out. Make a name out there for a brilliant performance. This slide showcases the EdTech industry analysis of Asia-Pacific region which includes key statistics such as percentage of share contributed to edtech industry, largest market, etc.
Vape Explosion Statistics In Powerpoint And Google Slides Cpb
Introducing our well designed Vape Explosion Statistics In Powerpoint And Google Slides Cpb This PowerPoint design presents information on topics like Vape Explosion Statistics As it is predesigned it helps boost your confidence level. It also makes you a better presenter because of its high quality content and graphics. This PPT layout can be downloaded and used in different formats like PDF, PNG, and JPG. Not only this, it is available in both Standard Screen and Widescreen aspect ratios for your convenience. Therefore, click on the download button now to persuade and impress your audience. Our Vape Explosion Statistics In Powerpoint And Google Slides Cpb are topically designed to provide an attractive backdrop to any subject. Use them to look like a presentation pro.
Genital Herpes Statistics In Powerpoint And Google Slides Cpb
Introducing our well-designed Genital Herpes Statistics In Powerpoint And Google Slides Cpb. This PowerPoint design presents information on topics like Genital Herpes Statistics. As it is predesigned it helps boost your confidence level. It also makes you a better presenter because of its high-quality content and graphics. This PPT layout can be downloaded and used in different formats like PDF, PNG, and JPG. Not only this, it is available in both Standard Screen and Widescreen aspect ratios for your convenience. Therefore, click on the download button now to persuade and impress your audience. Our Genital Herpes Statistics In Powerpoint And Google Slides Cpb are topically designed to provide an attractive backdrop to any subject. Use them to look like a presentation pro.
Vaccine Success Statistics In Powerpoint And Google Slides Cpb
Introducing our well designed Vaccine Success Statistics In Powerpoint And Google Slides Cpb. This PowerPoint design presents information on topics like Vaccine Success Statistics. As it is predesigned it helps boost your confidence level. It also makes you a better presenter because of its high quality content and graphics. This PPT layout can be downloaded and used in different formats like PDF, PNG, and JPG. Not only this, it is available in both Standard Screen and Widescreen aspect ratios for your convenience. Therefore, click on the download button now to persuade and impress your audience. Our Vaccine Success Statistics In Powerpoint And Google Slides Cpb are topically designed to provide an attractive backdrop to any subject. Use them to look like a presentation pro.
Police Brutality Statistics In Powerpoint And Google Slides Cpb
Introducing our well designed Police Brutality Statistics In Powerpoint And Google Slides Cpb This PowerPoint design presents information on topics like Police Brutality Statistics As it is predesigned it helps boost your confidence level. It also makes you a better presenter because of its high quality content and graphics. This PPT layout can be downloaded and used in different formats like PDF, PNG, and JPG. Not only this, it is available in both Standard Screen and Widescreen aspect ratios for your convenience. Therefore, click on the download button now to persuade and impress your audience. Our Police Brutality Statistics In Powerpoint And Google Slides Cpb are topically designed to provide an attractive backdrop to any subject. Use them to look like a presentation pro.
Spatial Statistics In Powerpoint And Google Slides Cpb
Introducing our well designed Spatial Statistics In Powerpoint And Google Slides Cpb. This PowerPoint design presents information on topics like Spatial Statistics. As it is predesigned it helps boost your confidence level. It also makes you a better presenter because of its high quality content and graphics. This PPT layout can be downloaded and used in different formats like PDF, PNG, and JPG. Not only this, it is available in both Standard Screen and Widescreen aspect ratios for your convenience. Therefore, click on the download button now to persuade and impress your audience. Our Spatial Statistics In Powerpoint And Google Slides Cpb are topically designed to provide an attractive backdrop to any subject. Use them to look like a presentation pro.
Environmental Statistics In Powerpoint And Google Slides Cpb
Introducing our well-designed Environmental Statistics In Powerpoint And Google Slides Cpb. This PowerPoint design presents information on topics like Environmental Statistics. As it is predesigned it helps boost your confidence level. It also makes you a better presenter because of its high-quality content and graphics. This PPT layout can be downloaded and used in different formats like PDF, PNG, and JPG. Not only this, it is available in both Standard Screen and Widescreen aspect ratios for your convenience. Therefore, click on the download button now to persuade and impress your audience. Our Environmental Statistics In Powerpoint And Google Slides Cpb are topically designed to provide an attractive backdrop to any subject. Use them to look like a presentation pro.

Robust Statistics In Powerpoint And Google Slides Cpb
Introducing our well-designed Robust Statistics In Powerpoint And Google Slides Cpb. This PowerPoint design presents information on topics like Robust Statistics. As it is predesigned it helps boost your confidence level. It also makes you a better presenter because of its high-quality content and graphics. This PPT layout can be downloaded and used in different formats like PDF, PNG, and JPG. Not only this, it is available in both Standard Screen and Widescreen aspect ratios for your convenience. Therefore, click on the download button now to persuade and impress your audience. Our Robust Statistics In Powerpoint And Google Slides Cpb are topically designed to provide an attractive backdrop to any subject. Use them to look like a presentation pro.
Statistics Mental Health Stigma In Powerpoint And Google Slides Cpb
Introducing our well-designed Statistics Mental Health Stigma In Powerpoint And Google Slides Cpb. This PowerPoint design presents information on topics like Statistics Mental Health Stigma. As it is predesigned it helps boost your confidence level. It also makes you a better presenter because of its high-quality content and graphics. This PPT layout can be downloaded and used in different formats like PDF, PNG, and JPG. Not only this, it is available in both Standard Screen and Widescreen aspect ratios for your convenience. Therefore, click on the download button now to persuade and impress your audience. Our Statistics Mental Health Stigma In Powerpoint And Google Slides Cpb are topically designed to provide an attractive backdrop to any subject. Use them to look like a presentation pro.
Variance Statistics In Powerpoint And Google Slides Cpb
Introducing our well designed Variance Statistics In Powerpoint And Google Slides Cpb. This PowerPoint design presents information on topics like Variance Statistics. As it is predesigned it helps boost your confidence level. It also makes you a better presenter because of its high quality content and graphics. This PPT layout can be downloaded and used in different formats like PDF, PNG, and JPG. Not only this, it is available in both Standard Screen and Widescreen aspect ratios for your convenience. Therefore, click on the download button now to persuade and impress your audience. Our Variance Statistics In Powerpoint And Google Slides Cpb are topically designed to provide an attractive backdrop to any subject. Use them to look like a presentation pro.
Bayesian Statistics Risk Assessment In Powerpoint And Google Slides Cpb
Introducing our well designed Bayesian Statistics Risk Assessment In Powerpoint And Google Slides Cpb. This PowerPoint design presents information on topics like Bayesian Statistics Risk Assessment. As it is predesigned it helps boost your confidence level. It also makes you a better presenter because of its high quality content and graphics. This PPT layout can be downloaded and used in different formats like PDF, PNG, and JPG. Not only this, it is available in both Standard Screen and Widescreen aspect ratios for your convenience. Therefore, click on the download button now to persuade and impress your audience. Our Bayesian Statistics Risk Assessment In Powerpoint And Google Slides Cpb are topically designed to provide an attractive backdrop to any subject. Use them to look like a presentation pro.
Christmas Depression Statistics In Powerpoint And Google Slides Cpb
Introducing our well designed Christmas Depression Statistics In Powerpoint And Google Slides Cpb. This PowerPoint design presents information on topics like Christmas Depression Statistics. As it is predesigned it helps boost your confidence level. It also makes you a better presenter because of its high quality content and graphics. This PPT layout can be downloaded and used in different formats like PDF, PNG, and JPG. Not only this, it is available in both Standard Screen and Widescreen aspect ratios for your convenience. Therefore, click on the download button now to persuade and impress your audience. Our Christmas Depression Statistics In Powerpoint And Google Slides Cpb are topically designed to provide an attractive backdrop to any subject. Use them to look like a presentation pro.

Consumption Statistics In Powerpoint And Google Slides Cpb
Introducing our well designed Consumption Statistics In Powerpoint And Google Slides Cpb. This PowerPoint design presents information on topics like Consumption Statistics. As it is predesigned it helps boost your confidence level. It also makes you a better presenter because of its high quality content and graphics. This PPT layout can be downloaded and used in different formats like PDF, PNG, and JPG. Not only this, it is available in both Standard Screen and Widescreen aspect ratios for your convenience. Therefore, click on the download button now to persuade and impress your audience. Our Consumption Statistics In Powerpoint And Google Slides Cpb are topically designed to provide an attractive backdrop to any subject. Use them to look like a presentation pro.
Discord Statistics Servers In Powerpoint And Google Slides Cpb
Introducing our well-designed Discord Statistics Servers In Powerpoint And Google Slides Cpb. This PowerPoint design presents information on topics like Discord Statistics Servers. As it is predesigned it helps boost your confidence level. It also makes you a better presenter because of its high-quality content and graphics. This PPT layout can be downloaded and used in different formats like PDF, PNG, and JPG. Not only this, it is available in both Standard Screen and Widescreen aspect ratios for your convenience. Therefore, click on the download button now to persuade and impress your audience. Our Discord Statistics Servers In Powerpoint And Google Slides Cpb are topically designed to provide an attractive backdrop to any subject. Use them to look like a presentation pro.

Depression Statistics Worldwide In Powerpoint And Google Slides Cpb
Introducing our well-designed Depression Statistics Worldwide In Powerpoint And Google Slides Cpb. This PowerPoint design presents information on topics like Depression Statistics Worldwide. As it is predesigned it helps boost your confidence level. It also makes you a better presenter because of its high-quality content and graphics. This PPT layout can be downloaded and used in different formats like PDF, PNG, and JPG. Not only this, it is available in both Standard Screen and Widescreen aspect ratios for your convenience. Therefore, click on the download button now to persuade and impress your audience. Our Depression Statistics Worldwide In Powerpoint And Google Slides Cpb are topically designed to provide an attractive backdrop to any subject. Use them to look like a presentation pro.
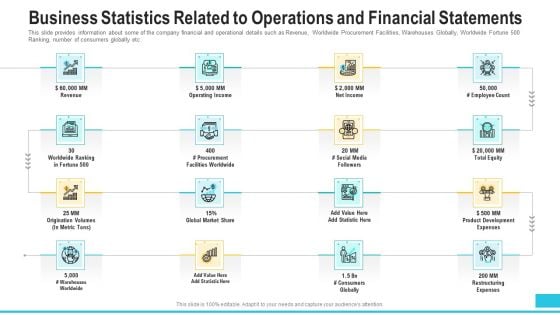
Business Statistics Related To Operations And Financial Statements Ideas PDF
This slide provides information about some of the company financial and operational details such as Revenue, Worldwide Procurement Facilities, Warehouses Globally, Worldwide Fortune 500 Ranking, number of consumers globally etc. This is a business statistics related to operations and financial statements ideas pdf template with various stages. Focus and dispense information on tweleve stages using this creative set, that comes with editable features. It contains large content boxes to add your information on topics like revenue, operating income, net income, employee count, social media. You can also showcase facts, figures, and other relevant content using this PPT layout. Grab it now.
PowerPoint Process Process Lego Blocks Ppt Theme
PowerPoint_Process_Process_Lego_Blocks_PPT_Theme Business Power Point-These amazing PowerPoint pre-designed slides and PowerPoint templates have been carefully created by our team of experts to help you impress your audience. Our stunning collection of Powerpoint slides are 100% editable and can easily fit in any PowerPoint presentations. By using these animations and graphics in PowerPoint and you can easily make professional presentations. Any text can be entered at any point in the PowerPoint template or slide. Just DOWNLOAD our awesome PowerPoint templates and you are ready to go. Coast along with our PowerPoint Process Process Lego Blocks Ppt Theme. Your thoughts will begin to flow.
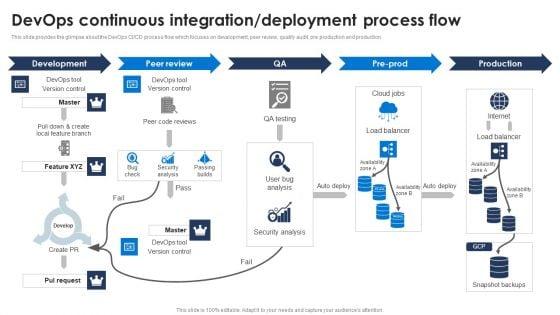
Devops Continuous Integration Deployment Process Flow Download PDF
This slide provides the glimpse about the DevOps CI or CD process flow which focuses on development, peer review, quality audit, pre production and production. Coming up with a presentation necessitates that the majority of the effort goes into the content and the message you intend to convey. The visuals of a PowerPoint presentation can only be effective if it supplements and supports the story that is being told. Keeping this in mind our experts created Devops Continuous Integration Deployment Process Flow Download PDF to reduce the time that goes into designing the presentation. This way, you can concentrate on the message while our designers take care of providing you with the right template for the situation.
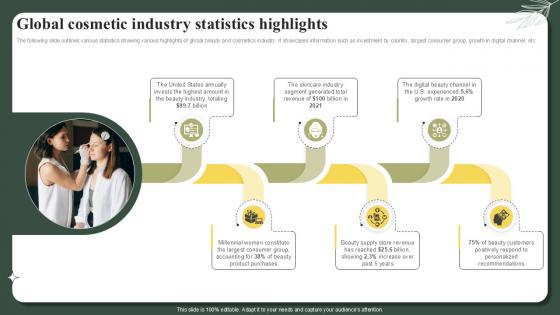
Global Cosmetic Industry Statistics Highlights Successful Launch Ppt Sample
The following slide outlines various statistics showing various highlights of global beauty and cosmetics industry. It showcases information such as investment by country, largest consumer group, growth in digital channel, etc. Formulating a presentation can take up a lot of effort and time, so the content and message should always be the primary focus. The visuals of the PowerPoint can enhance the presenters message, so our Global Cosmetic Industry Statistics Highlights Successful Launch Ppt Sample was created to help save time. Instead of worrying about the design, the presenter can concentrate on the message while our designers work on creating the ideal templates for whatever situation is needed. Slidegeeks has experts for everything from amazing designs to valuable content, we have put everything into Global Cosmetic Industry Statistics Highlights Successful Launch Ppt Sample The following slide outlines various statistics showing various highlights of global beauty and cosmetics industry. It showcases information such as investment by country, largest consumer group, growth in digital channel, etc.
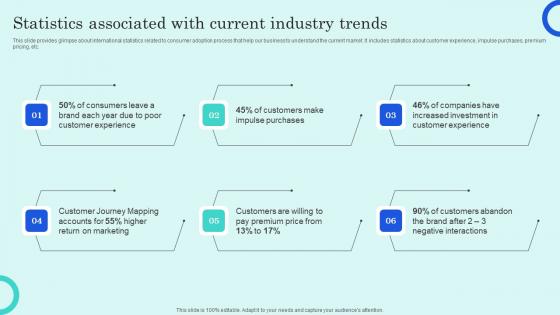
Statistics Associated With Current Industry Trends Overview Of Customer Adoption Process Inspiration Pdf
This slide provides glimpse about international statistics related to consumer adoption process that help our business to understand the current market. It includes statistics about customer experience, impulse purchases, premium pricing, etc. Explore a selection of the finest Statistics Associated With Current Industry Trends Overview Of Customer Adoption Process Inspiration Pdf here. With a plethora of professionally designed and pre made slide templates, you can quickly and easily find the right one for your upcoming presentation. You can use our Statistics Associated With Current Industry Trends Overview Of Customer Adoption Process Inspiration Pdf to effectively convey your message to a wider audience. Slidegeeks has done a lot of research before preparing these presentation templates. The content can be personalized and the slides are highly editable. Grab templates today from Slidegeeks. This slide provides glimpse about international statistics related to consumer adoption process that help our business to understand the current market. It includes statistics about customer experience, impulse purchases, premium pricing, etc.
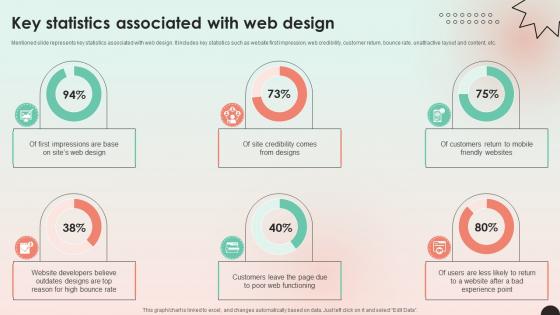
Web Consulting Business Performance Key Statistics Associated With Web Design
Mentioned slide represents key statistics associated with web design. It includes key statistics such as website first impression, web credibility, customer return, bounce rate, unattractive layout and content, etc. Do you have an important presentation coming up Are you looking for something that will make your presentation stand out from the rest Look no further than Web Consulting Business Performance Key Statistics Associated With Web Design. With our professional designs, you can trust that your presentation will pop and make delivering it a smooth process. And with Slidegeeks, you can trust that your presentation will be unique and memorable. So why wait Grab Web Consulting Business Performance Key Statistics Associated With Web Design today and make your presentation stand out from the rest Mentioned slide represents key statistics associated with web design. It includes key statistics such as website first impression, web credibility, customer return, bounce rate, unattractive layout and content, etc.
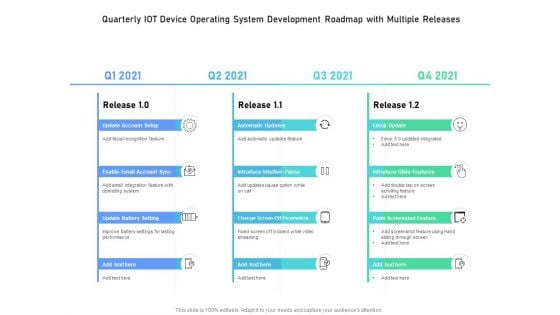
Quarterly IOT Device Operating System Development Roadmap With Multiple Releases Guidelines
Presenting the quarterly iot device operating system development roadmap with multiple releases guidelines. The template includes a roadmap that can be used to initiate a strategic plan. Not only this, the PowerPoint slideshow is completely editable and you can effortlessly modify the font size, font type, and shapes according to your needs. This PPT slide can be easily reached in standard screen and widescreen aspect ratios. The set is also available in various formats like PDF, PNG, and JPG. So download and use it multiple times as per your knowledge.
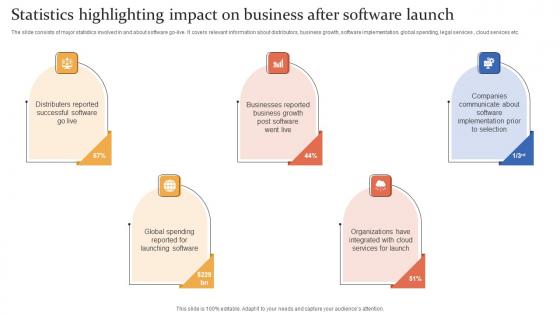
Statistics Highlighting Impact On Business After Software Launch Introduction Pdf
The slide consists of major statistics involved in and about software go live. It covers relevant information about distributors, business growth, software implementation, global spending, legal services , cloud services etc.Showcasing this set of slides titled Statistics Highlighting Impact On Business After Software Launch Introduction Pdf The topics addressed in these templates are Distributers Reported, Businesses Reported, Launching Software All the content presented in this PPT design is completely editable. Download it and make adjustments in color, background, font etc. as per your unique business setting. The slide consists of major statistics involved in and about software go live. It covers relevant information about distributors, business growth, software implementation, global spending, legal services , cloud services etc.
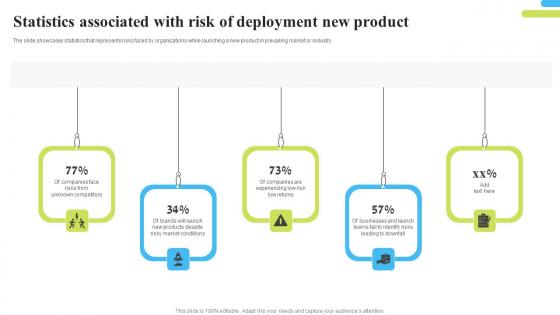
Statistics Associated With Risk Of Deployment New Product Structure Pdf
The slide showcases statistics that represents risks faced by organizations while launching a new product in prevailing market or industry. Showcasing this set of slides titled Statistics Associated With Risk Of Deployment New Product Structure Pdf. The topics addressed in these templates are Statistics Associated, Risk Of Deployment, Prevailing Market Or Industry. All the content presented in this PPT design is completely editable. Download it and make adjustments in color, background, font etc. as per your unique business setting. The slide showcases statistics that represents risks faced by organizations while launching a new product in prevailing market or industry.
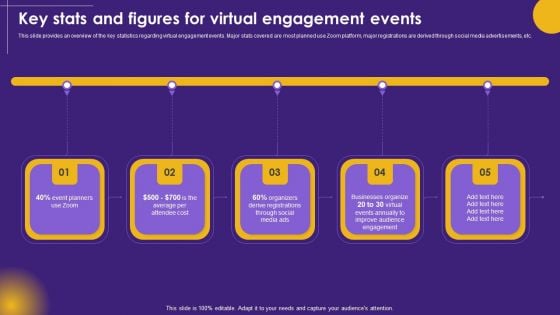
Virtual Communication Key Stats And Figures For Virtual Engagement Rules PDF
This slide provides an overview of the key statistics regarding virtual engagement events. Major stats covered are most planned use Zoom platform, major registrations are derived through social media advertisements, etc. Get a simple yet stunning designed Virtual Communication Key Stats And Figures For Virtual Engagement Rules PDF. It is the best one to establish the tone in your meetings. It is an excellent way to make your presentations highly effective. So, download this PPT today from Slidegeeks and see the positive impacts. Our easy to edit Virtual Communication Key Stats And Figures For Virtual Engagement Rules PDF can be your go to option for all upcoming conferences and meetings. So, what are you waiting for Grab this template today.
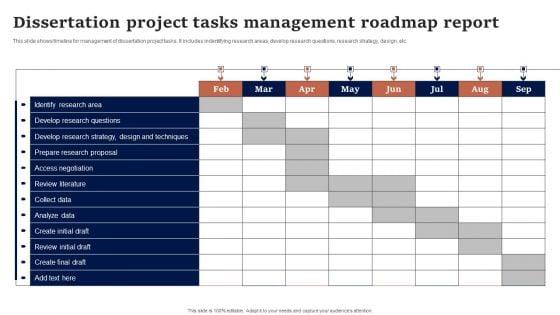
Dissertation Project Tasks Management Roadmap Report Mockup PDF
This slide shows timeline for management of dissertation project tasks. It includes indentifying research areas, develop research questions, research strategy, design, etc. Pitch your topic with ease and precision using this Dissertation Project Tasks Management Roadmap Report Mockup PDF. This layout presents information on Access Negotiation, Analyze Data, Collect Data. It is also available for immediate download and adjustment. So, changes can be made in the color, design, graphics or any other component to create a unique layout.

Statistically Significant In Powerpoint And Google Slides Cpb
Presenting our innovatively-designed set of slides titled Statistically Significant In Powerpoint And Google Slides Cpb. This completely editable PowerPoint graphic exhibits Statistically Significant that will help you convey the message impactfully. It can be accessed with Google Slides and is available in both standard screen and widescreen aspect ratios. Apart from this, you can download this well-structured PowerPoint template design in different formats like PDF, JPG, and PNG. So, click the download button now to gain full access to this PPT design. Our Statistically Significant In Powerpoint And Google Slides Cpb are topically designed to provide an attractive backdrop to any subject. Use them to look like a presentation pro.
Statistical Multiplexing In Powerpoint And Google Slides Cpb
Presenting our innovatively designed set of slides titled Statistical Multiplexing In Powerpoint And Google Slides Cpb. This completely editable PowerPoint graphic exhibits Statistical Multiplexing that will help you convey the message impactfully. It can be accessed with Google Slides and is available in both standard screen and widescreen aspect ratios. Apart from this, you can download this well structured PowerPoint template design in different formats like PDF, JPG, and PNG. So, click the download button now to gain full access to this PPT design. Our Statistical Multiplexing In Powerpoint And Google Slides Cpb are topically designed to provide an attractive backdrop to any subject. Use them to look like a presentation pro.
Descriptive Statistics Financial In Powerpoint And Google Slides Cpb
Presenting our innovatively-designed set of slides titled Descriptive Statistics Financial In Powerpoint And Google Slides Cpb. This completely editable PowerPoint graphic exhibits Descriptive Statistics Financial that will help you convey the message impactfully. It can be accessed with Google Slides and is available in both standard screen and widescreen aspect ratios. Apart from this, you can download this well-structured PowerPoint template design in different formats like PDF, JPG, and PNG. So, click the download button now to gain full access to this PPT design. Our Descriptive Statistics Financial In Powerpoint And Google Slides Cpb are topically designed to provide an attractive backdrop to any subject. Use them to look like a presentation pro.


 Continue with Email

 Home
Home


