Data Lifecycle
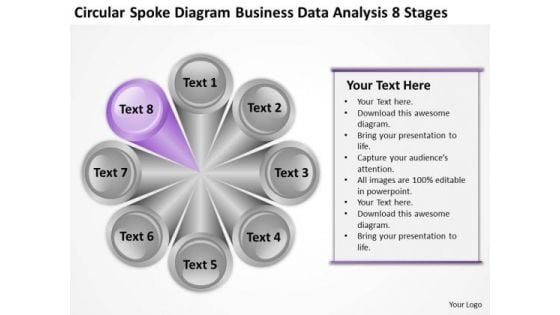
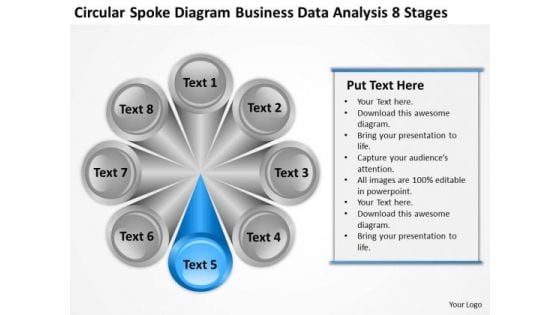
Circular Spoke Diagram Business Data Analysis 8 Stages Ppt Film Plan PowerPoint Slides
We present our circular spoke diagram business data analysis 8 stages ppt film plan PowerPoint Slides.Download and present our Process and Flows PowerPoint Templates because Our PowerPoint Templates and Slides are aesthetically designed to attract attention. We gaurantee that they will grab all the eyeballs you need. Download and present our Spheres PowerPoint Templates because Our PowerPoint Templates and Slides will let Your superior ideas hit the target always and everytime. Download our Business PowerPoint Templates because They will Put your wonderful verbal artistry on display. Our PowerPoint Templates and Slides will provide you the necessary glam and glitter. Download and present our Shapes PowerPoint Templates because It will get your audience in sync. Download our Circle Charts PowerPoint Templates because Our PowerPoint Templates and Slides will generate and maintain the level of interest you desire. They will create the impression you want to imprint on your audience.Use these PowerPoint slides for presentations relating to Design, isolated, statistics, model, statement, interface, business, vector, presentation, glossy, internet, diagram, circle,brochure, description, report, marketing, level, abstract, steps, illustration, pie, chart, sphere, registry, catalog, section, futuristic, web, text,information,eight space, demonstration, navigation, pattern, structure, multiple. The prominent colors used in the PowerPoint template are Purple, Gray, White. Let your thoughts exert some pressure. Our Circular Spoke Diagram Business Data Analysis 8 Stages Ppt Film Plan PowerPoint Slides will do the deed.
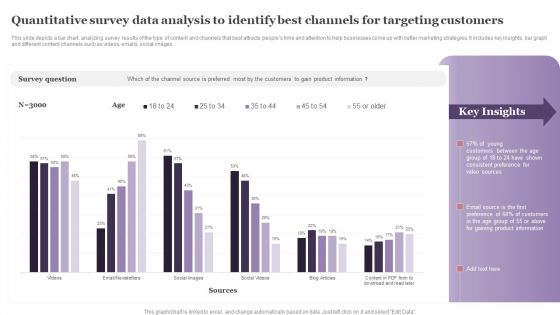
Quantitative Survey Data Analysis To Identify Best Channels For Targeting Customers Formats PDF
This slide depicts a bar chart, analyzing survey results of the type of content and channels that best attracts peoples time and attention to help businesses come up with better marketing strategies. It includes key insights, bar graph and different content channels such as videos, emails, social images. Pitch your topic with ease and precision using this Quantitative Survey Data Analysis To Identify Best Channels For Targeting Customers Formats PDF. This layout presents information on Survey Question, Young Customers, Consistent Preference. It is also available for immediate download and adjustment. So, changes can be made in the color, design, graphics or any other component to create a unique layout.
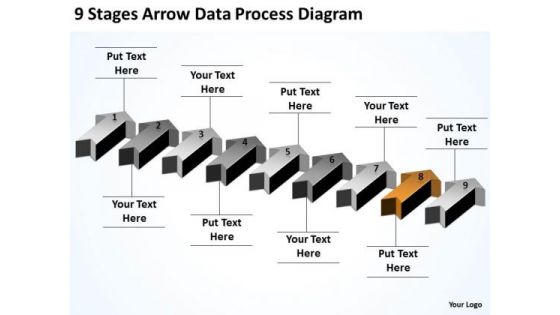
Flowchart Parallel Process 9 Stages Arrow Data Diagram Ppt PowerPoint Slides
We present our flowchart parallel process 9 stages arrow data diagram ppt PowerPoint Slides.Download and present our Business PowerPoint Templates because They will Put the wind in your sails. Skim smoothly over the choppy waters of the market. Download our Arrows PowerPoint Templates because Our PowerPoint Templates and Slides will let your ideas bloom. Create a bed of roses for your audience. Download and present our Shapes PowerPoint Templates because Our PowerPoint Templates and Slides offer you the widest possible range of options. Download our Success PowerPoint Templates because They will Put the wind in your sails. Skim smoothly over the choppy waters of the market. Download and present our Signs PowerPoint Templates because our PowerPoint Templates and Slides are the string of your bow. Fire of your ideas and conquer the podium.Use these PowerPoint slides for presentations relating to 3d, achievement, aim, arrows, business, career, chart, competition,development, direction, education, financial, forecast, forward, glossy, graph,group, growth, higher, icon, increase, investment, leader, leadership, moving,onwards, outlook, path, plan, prediction, price, profit, progress, property, race,sales, series, success, target, team, teamwork, turn, up, upwards, vector, win,winner. The prominent colors used in the PowerPoint template are Brown, Black, Gray. We assure you our flowchart parallel process 9 stages arrow data diagram ppt PowerPoint Slides are the best it can get when it comes to presenting. PowerPoint presentation experts tell us our business PowerPoint templates and PPT Slides are designed by professionals The feedback we get is that our flowchart parallel process 9 stages arrow data diagram ppt PowerPoint Slides will get their audience's attention. We assure you our aim PowerPoint templates and PPT Slides will help them to explain complicated concepts. PowerPoint presentation experts tell us our flowchart parallel process 9 stages arrow data diagram ppt PowerPoint Slides will save the presenter time. We assure you our aim PowerPoint templates and PPT Slides will impress their bosses and teams. Put your ideas out to flower. Our Flowchart Parallel Process 9 Stages Arrow Data Diagram Ppt PowerPoint Slides will get them to bloom.
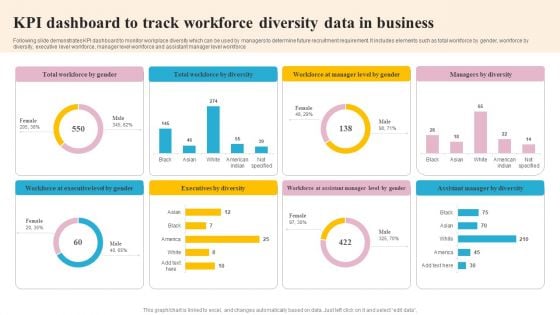
KPI Dashboard To Track Workforce Diversity Data In Business Mockup PDF
Following slide demonstrates KPI dashboard to monitor workplace diversity which can be used by managers to determine future recruitment requirement. It includes elements such as total workforce by gender, workforce by diversity, executive level workforce, manager level workforce and assistant manager level workforce. Pitch your topic with ease and precision using this KPI Dashboard To Track Workforce Diversity Data In Business Mockup PDF. This layout presents information on Executives By Diversity, Workforce By Diversity, Executive Level By Gender. It is also available for immediate download and adjustment. So, changes can be made in the color, design, graphics or any other component to create a unique layout.

Data And Information Visualization Visual Analytics Branch Of Visualization Research Designs PDF
This slide shows visual analytics, the last branch of visualization research, which emerged from the advancements in the other two branches and mainly focused on analytical reasoning. Make sure to capture your audiences attention in your business displays with our gratis customizable Data And Information Visualization Visual Analytics Branch Of Visualization Research Designs PDF. These are great for business strategies, office conferences, capital raising or task suggestions. If you desire to acquire more customers for your tech business and ensure they stay satisfied, create your own sales presentation with these plain slides.
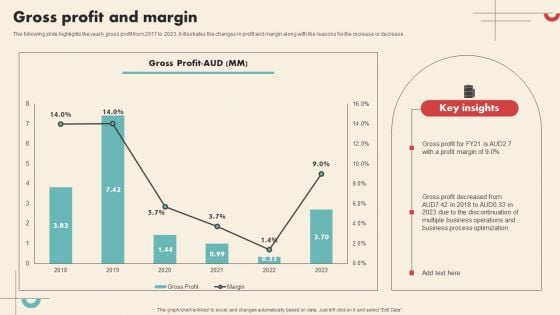
Data Driven Marketing Solutions Firm Company Profile Gross Profit And Margin Information PDF
The following slide highlights the yearly gross profit from 2017 to 2023. it illustrates the changes in profit and margin along with the reasons for the increase or decrease Make sure to capture your audiences attention in your business displays with our gratis customizable Data Driven Marketing Solutions Firm Company Profile Gross Profit And Margin Information PDF. These are great for business strategies, office conferences, capital raising or task suggestions. If you desire to acquire more customers for your tech business and ensure they stay satisfied, create your own sales presentation with these plain slides.
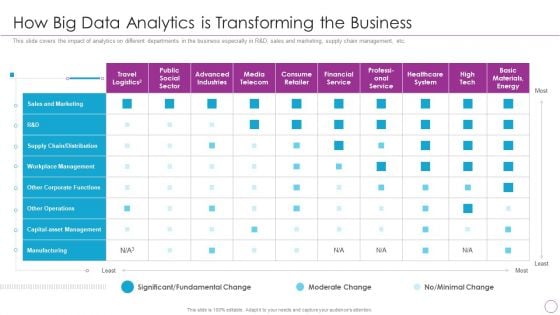
Integration Of Digital Technology In Organization How Big Data Analytics Is Transforming The Business Infographics PDF
This slide covers the impact of analytics on different departments in the business especially in R and D, sales and marketing, supply chain management, etc.Deliver and pitch your topic in the best possible manner with this Integration Of Digital Technology In Organization How Big Data Analytics Is Transforming The Business Infographics PDF Use them to share invaluable insights on Advanced Industries, Consume Retailer, Healthcare System and impress your audience. This template can be altered and modified as per your expectations. So, grab it now.
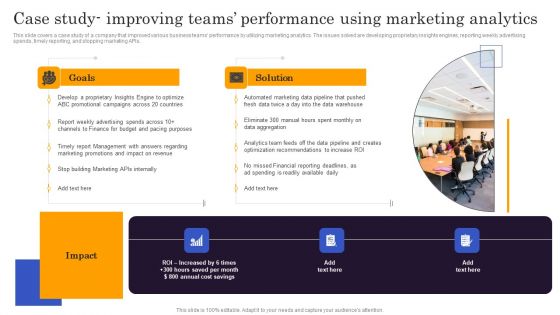
Marketers Guide To Data Analysis Optimization Case Study Improving Teams Performance Using Marketing Professional PDF
This slide covers a case study of a company that improved various business teams performance by utilizing marketing analytics. The issues solved are developing proprietary insights engines, reporting weekly advertising spends, timely reporting, and stopping marketing APIs. Make sure to capture your audiences attention in your business displays with our gratis customizable Marketers Guide To Data Analysis Optimization Case Study Improving Teams Performance Using Marketing Professional PDF. These are great for business strategies, office conferences, capital raising or task suggestions. If you desire to acquire more customers for your tech business and ensure they stay satisfied, create your own sales presentation with these plain slides.
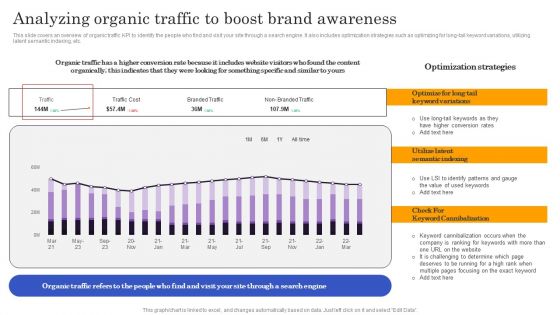
Marketers Guide To Data Analysis Optimization Analyzing Organic Traffic To Boost Brand Awareness Download PDF
This slide covers an overview of organic traffic KPI to identify the people who find and visit your site through a search engine. It also includes optimization strategies such as optimizing for long-tail keyword variations, utilizing latent semantic indexing, etc. If your project calls for a presentation, then Slidegeeks is your go to partner because we have professionally designed, easy to edit templates that are perfect for any presentation. After downloading, you can easily edit Marketers Guide To Data Analysis Optimization Analyzing Organic Traffic To Boost Brand Awareness Download PDF and make the changes accordingly. You can rearrange slides or fill them with different images. Check out all the handy templates
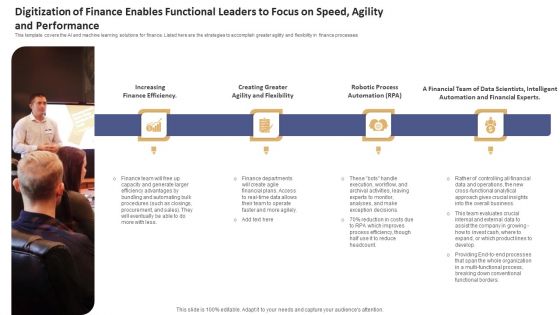
Data Processing Services Delivery Digitization Of Finance Enables Functional Leaders To Focus Guidelines PDF
This template covers the AI and machine learning solutions for finance. Listed here are the strategies to accomplish greater agility and flexibility in finance processes. This is a Data Processing Services Delivery Digitization Of Finance Enables Functional Leaders To Focus Guidelines PDF template with various stages. Focus and dispense information on four stages using this creative set, that comes with editable features. It contains large content boxes to add your information on topics like Increasing Finance Efficiency, Creating Greater, Agility And Flexibility. You can also showcase facts, figures, and other relevant content using this PPT layout. Grab it now.
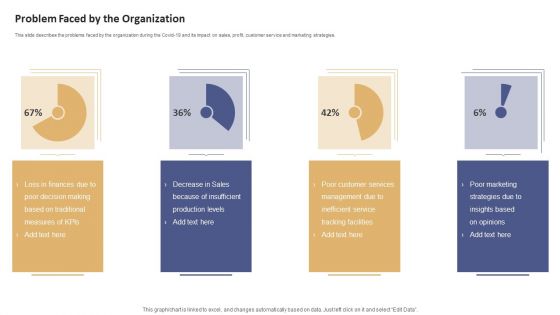
Data Processing Services Delivery Problem Faced By The Organization Sample PDF
This slide describes the problems faced by the organization during the Covid-19 and its impact on sales, profit, customer service and marketing strategies. This is a Data Processing Services Delivery Problem Faced By The Organization Sample PDF template with various stages. Focus and dispense information on four stages using this creative set, that comes with editable features. It contains large content boxes to add your information on topics like Loss Finances, Poor Decision Making, Measures KPIs, Production Levels. You can also showcase facts, figures, and other relevant content using this PPT layout. Grab it now.
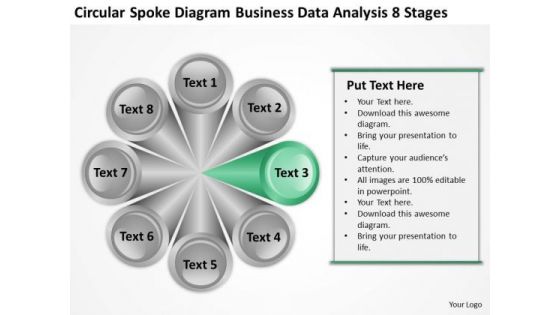
Data Analysis 8 Stages Ppt Business Plans For Non Profit Organizations PowerPoint Templates
We present our data analysis 8 stages ppt business plans for non profit organizations PowerPoint templates.Present our Process and Flows PowerPoint Templates because Our PowerPoint Templates and Slides will definately Enhance the stature of your presentation. Adorn the beauty of your thoughts with their colourful backgrounds. Present our Circle Charts PowerPoint Templates because you can Set pulses racing with our PowerPoint Templates and Slides. They will raise the expectations of your team. Download our Business PowerPoint Templates because Our PowerPoint Templates and Slides will let you Leave a lasting impression to your audiences. They possess an inherent longstanding recall factor. Use our Spheres PowerPoint Templates because our PowerPoint Templates and Slides are the string of your bow. Fire of your ideas and conquer the podium. Use our Shapes PowerPoint Templates because Our PowerPoint Templates and Slides are effectively colour coded to prioritise your plans They automatically highlight the sequence of events you desire.Use these PowerPoint slides for presentations relating to Design, isolated, statistics, model, statement, interface, business, vector, presentation, glossy, internet, diagram, circle,brochure, description, report, marketing, level, abstract, steps, illustration, pie, chart, sphere, registry, catalog, section, futuristic, web, text,information,eight space, demonstration, navigation, pattern, structure, multiple. The prominent colors used in the PowerPoint template are Green, Gray, Black. Display your faith in your team with our Data Analysis 8 Stages Ppt Business Plans For Non Profit Organizations PowerPoint Templates. Demonstrate your strong belief in them.
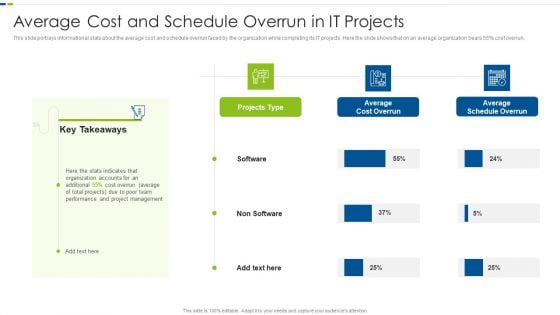
Utilizing Agile Methodology In Data Transformation Project IT Average Cost And Schedule Sample PDF
This slide portrays informational stats about the average cost and schedule overrun faced by the organization while completing its IT projects. Here the slide shows that on an average organization bears 55 percentage cost overrun. Deliver and pitch your topic in the best possible manner with this utilizing agile methodology in data transformation project it average cost and schedule sample pdf. Use them to share invaluable insights on organization, average, team, management, project and impress your audience. This template can be altered and modified as per your expectations. So, grab it now.
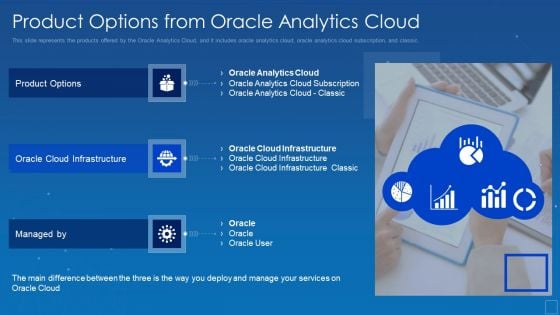
Oracle Cloud Data Analytics Administration IT Product Options From Oracle Analytics Cloud Professional PDF
This slide represents the products offered by the Oracle Analytics Cloud, and it includes oracle analytics cloud, oracle analytics cloud subscription, and classic. Presenting oracle cloud data analytics administration it product options from oracle analytics cloud professional pdf to provide visual cues and insights. Share and navigate important information on three stages that need your due attention. This template can be used to pitch topics like subscription, analytics infrastructure, managed. In addtion, this PPT design contains high resolution images, graphics, etc, that are easily editable and available for immediate download.
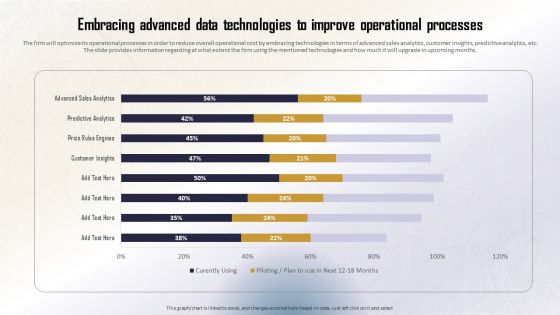
Identifying Direct And Indirect Embracing Advanced Data Technologies To Improve Guidelines PDF
The firm will optimize its operational processes in order to reduce overall operational cost by embracing technologies in terms of advanced sales analytics, customer insights, predictive analytics, etc. The slide provides information regarding at what extent the firm using the mentioned technologies and how much it will upgrade in upcoming months. Formulating a presentation can take up a lot of effort and time, so the content and message should always be the primary focus. The visuals of the PowerPoint can enhance the presenters message, so our Identifying Direct And Indirect Embracing Advanced Data Technologies To Improve Guidelines PDF was created to help save time. Instead of worrying about the design, the presenter can concentrate on the message while our designers work on creating the ideal templates for whatever situation is needed. Slidegeeks has experts for everything from amazing designs to valuable content, we have put everything into Identifying Direct And Indirect Embracing Advanced Data Technologies To Improve Guidelines PDF
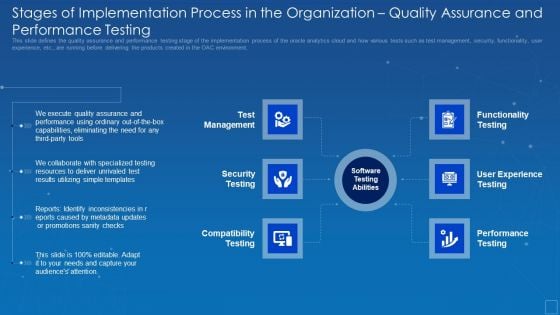
Oracle Cloud Data Analytics Administration IT Stages Implementation Organization Sample PDF
This slide defines the quality assurance and performance testing stage of the implementation process of the oracle analytics cloud and how various tests such as test management, security, functionality, user experience, etc., are running before delivering the products created in the OAC environment. This is a oracle cloud data analytics administration it stages implementation organization sample pdf template with various stages. Focus and dispense information on six stages using this creative set, that comes with editable features. It contains large content boxes to add your information on topics like eliminating, quality, assurance, performance, capabilities. You can also showcase facts, figures, and other relevant content using this PPT layout. Grab it now.
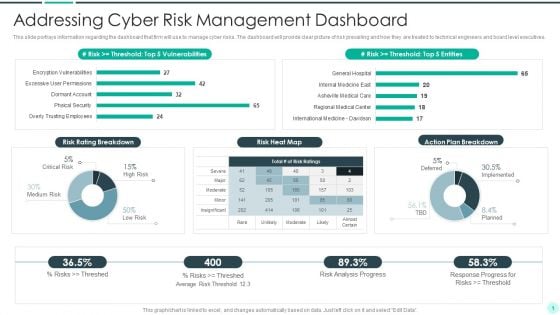
Executing Advance Data Analytics At Workspace Addressing Cyber Risk Guidelines PDF
This slide portrays information regarding the dashboard that firm will use to manage cyber risks. The dashboard will provide clear picture of risk prevailing and how they are treated to technical engineers and board level executives.Deliver an awe inspiring pitch with this creative executing advance data analytics at workspace addressing cyber risk guidelines pdf bundle. Topics like addressing cyber risk management dashboard can be discussed with this completely editable template. It is available for immediate download depending on the needs and requirements of the user.

Modern Security Observation Plan To Eradicate Cybersecurity Risk And Data Breach Cybersecurity Monitoring Structure PDF
This slide provides information about some of the best security monitoring tools that are available with the security monitoring manager and what tool is selected by the security monitoring manager based on tool implementation costs, tool implementation time etc. Deliver and pitch your topic in the best possible manner with this modern security observation plan to eradicate cybersecurity risk and data breach cybersecurity monitoring structure pdf. Use them to share invaluable insights on cybersecurity monitoring tools to be implemented and impress your audience. This template can be altered and modified as per your expectations. So, grab it now.
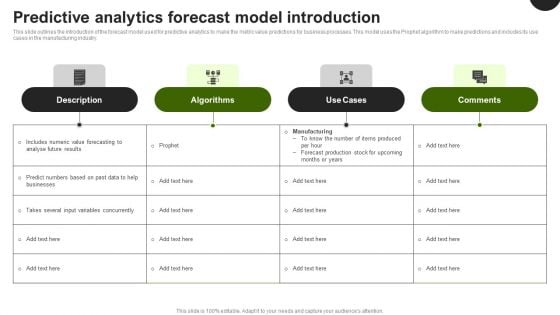
Predictive Analytics In The Age Of Big Data Predictive Analytics Forecast Model Introduction Information PDF
This slide outlines the introduction of the forecast model used for predictive analytics to make the metric value predictions for business processes. This model uses the Prophet algorithm to make predictions and includes its use cases in the manufacturing industry. Formulating a presentation can take up a lot of effort and time, so the content and message should always be the primary focus. The visuals of the PowerPoint can enhance the presenters message, so our Predictive Analytics In The Age Of Big Data Predictive Analytics Forecast Model Introduction Information PDF was created to help save time. Instead of worrying about the design, the presenter can concentrate on the message while our designers work on creating the ideal templates for whatever situation is needed. Slidegeeks has experts for everything from amazing designs to valuable content, we have put everything into Predictive Analytics In The Age Of Big Data Predictive Analytics Forecast Model Introduction Information PDF

Benefits Of Implementing Artificial Intelligence In Analytics Data Analytics SS V
This slide outlines key advantages of leveraging artificial intelligence in analytics aimed at helping businesses objectively predict results of the actions before implementation in real world . It covers the benefits such as enhanced speed, better predictive capabilities, improved customer experience and reduced costs.Make sure to capture your audiences attention in your business displays with our gratis customizable Benefits Of Implementing Artificial Intelligence In Analytics Data Analytics SS V. These are great for business strategies, office conferences, capital raising or task suggestions. If you desire to acquire more customers for your tech business and ensure they stay satisfied, create your own sales presentation with these plain slides. This slide outlines key advantages of leveraging artificial intelligence in analytics aimed at helping businesses objectively predict results of the actions before implementation in real world . It covers the benefits such as enhanced speed, better predictive capabilities, improved customer experience and reduced costs.
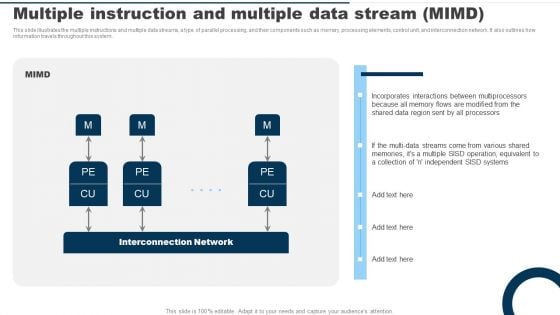
Multiple Instruction And Multiple Data Stream MIMD Ppt PowerPoint Presentation File Deck PDF
This slide illustrates the multiple instructions and multiple data streams, a type of parallel processing, and their components such as memory, processing elements, control unit, and interconnection network. It also outlines how information travels throughout this system. Welcome to our selection of the Multiple Instruction And Multiple Data Stream MIMD Ppt PowerPoint Presentation File Deck PDF. These are designed to help you showcase your creativity and bring your sphere to life. Planning and Innovation are essential for any business that is just starting out. This collection contains the designs that you need for your everyday presentations. All of our PowerPoints are 100 percent editable, so you can customize them to suit your needs. This multi purpose template can be used in various situations. Grab these presentation templates today.
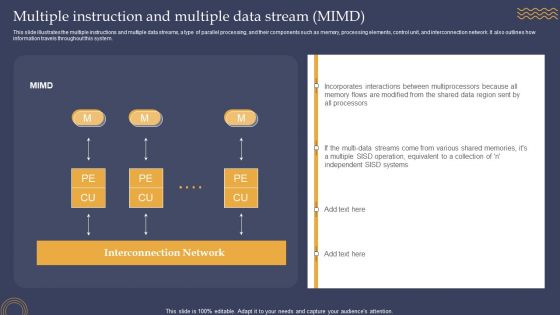
Multiple Instruction And Multiple Data Stream MIMD Ppt PowerPoint Presentation File Outline PDF
This slide illustrates the multiple instructions and multiple data streams, a type of parallel processing, and their components such as memory, processing elements, control unit, and interconnection network. It also outlines how information travels throughout this system. Welcome to our selection of the Multiple Instruction And Multiple Data Stream MIMD Ppt PowerPoint Presentation File Outline PDF. These are designed to help you showcase your creativity and bring your sphere to life. Planning and Innovation are essential for any business that is just starting out. This collection contains the designs that you need for your everyday presentations. All of our PowerPoints are 100 percent editable, so you can customize them to suit your needs. This multi purpose template can be used in various situations. Grab these presentation templates today.
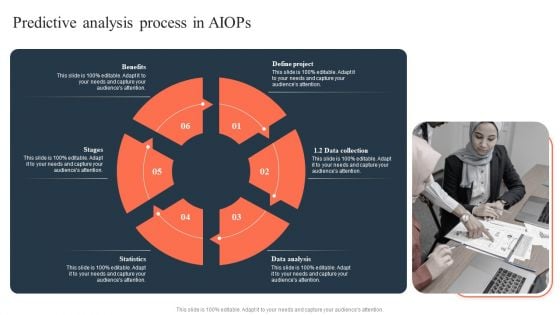
Ml And Big Data In Information Technology Processes Predictive Analysis Process In Aiops Download PDF
Slidegeeks is here to make your presentations a breeze with Ml And Big Data In Information Technology Processes Predictive Analysis Process In Aiops Download PDF With our easy to use and customizable templates, you can focus on delivering your ideas rather than worrying about formatting. With a variety of designs to choose from, you are sure to find one that suits your needs. And with animations and unique photos, illustrations, and fonts, you can make your presentation pop. So whether you are giving a sales pitch or presenting to the board, make sure to check out Slidegeeks first.

Steps To Build Attribution Strategy For Businesses Product Analytics Implementation Data Analytics V
This slide outlines phases to develop attribution strategy aimed at tracking, aligning and prioritizing experiences. It covers steps such as determine objectives, store information, focus on behavior, analyze interactions, choose right model and optimize attribution window This modern and well-arranged Steps To Build Attribution Strategy For Businesses Product Analytics Implementation Data Analytics V provides lots of creative possibilities. It is very simple to customize and edit with the Powerpoint Software. Just drag and drop your pictures into the shapes. All facets of this template can be edited with Powerpoint, no extra software is necessary. Add your own material, put your images in the places assigned for them, adjust the colors, and then you can show your slides to the world, with an animated slide included. This slide outlines phases to develop attribution strategy aimed at tracking, aligning and prioritizing experiences. It covers steps such as determine objectives, store information, focus on behavior, analyze interactions, choose right model and optimize attribution window
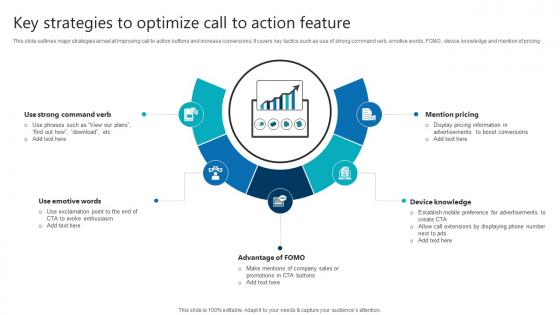
Key Strategies To Optimize Call To Action Feature Product Analytics Implementation Data Analytics V
This slide outlines major strategies aimed at improving call to action buttons and increase conversions. It covers key tactics such as use of strong command verb, emotive words, FOMO, device knowledge and mention of pricing Boost your pitch with our creative Key Strategies To Optimize Call To Action Feature Product Analytics Implementation Data Analytics V. Deliver an awe-inspiring pitch that will mesmerize everyone. Using these presentation templates you will surely catch everyones attention. You can browse the ppts collection on our website. We have researchers who are experts at creating the right content for the templates. So you do not have to invest time in any additional work. Just grab the template now and use them. This slide outlines major strategies aimed at improving call to action buttons and increase conversions. It covers key tactics such as use of strong command verb, emotive words, FOMO, device knowledge and mention of pricing
Template For Organizational Chart Of Multidimensional Data 4 Stages PowerPoint Templates
We present our template for organizational chart of multidimensional data 4 stages powerpoint templates.Use our Advertising PowerPoint Templates because You can Rise to the occasion with our PowerPoint Templates and Slides. You will bring your audience on their feet in no time. Present our Leadership PowerPoint Templates because Our PowerPoint Templates and Slides team portray an attitude of elegance. Personify this quality by using them regularly. Download our Arrows PowerPoint Templates because You can Connect the dots. Fan expectations as the whole picture emerges. Download our Org Charts PowerPoint Templates because Our PowerPoint Templates and Slides will let you Clearly mark the path for others to follow. Present our Business PowerPoint Templates because Our PowerPoint Templates and Slides are specially created by a professional team with vast experience. They diligently strive to come up with the right vehicle for your brilliant Ideas. Use these PowerPoint slides for presentations relating to Chart, flow, organization, flowchart, diagram, sitemap, process, box, arrow, graph, business, graphical, data, design, important, rectangle, corporate, plan, president, concept, hierarchy, glossy, teamwork, tier, chain, supervisor, relation, steps, glassy, connection, ladder, administration, group, connect, organize, connectivity, site-map, office, financial, structure, officer, glass. The prominent colors used in the PowerPoint template are Blue, Gray, Black. Be treated as an equal with our Template For Organizational Chart Of Multidimensional Data 4 Stages PowerPoint Templates. Feel the bonhomie of your peers.
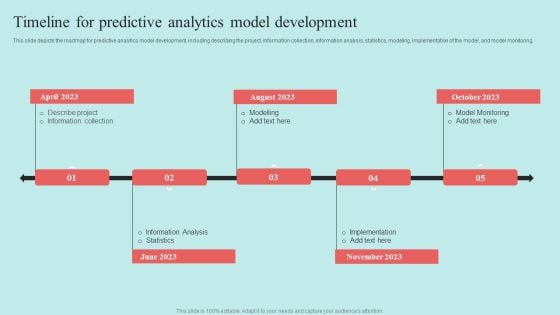
Predictive Data Model Timeline For Predictive Analytics Model Development Elements PDF

Comparative Analysis Of Encryption And Tokenization In Ds Securing Your Data Ppt Presentation
This slide represents the comparison of encryption and tokenization. The purpose of this slide is to highlight different components of comparison such as definition, importance, objective, and so on Do you have an important presentation coming up Are you looking for something that will make your presentation stand out from the rest Look no further than Comparative Analysis Of Encryption And Tokenization In Ds Securing Your Data Ppt Presentation With our professional designs, you can trust that your presentation will pop and make delivering it a smooth process. And with Slidegeeks, you can trust that your presentation will be unique and memorable. So why wait Grab Comparative Analysis Of Encryption And Tokenization In Ds Securing Your Data Ppt Presentation today and make your presentation stand out from the rest This slide represents the comparison of encryption and tokenization. The purpose of this slide is to highlight different components of comparison such as definition, importance, objective, and so on
Spoke Diagram Business Data Analysis 8 Stages Barber Shop Plan PowerPoint Templates
We present our spoke diagram business data analysis 8 stages barber shop plan PowerPoint templates.Use our Finance PowerPoint Templates because Our PowerPoint Templates and Slides are created with admirable insight. Use them and give your group a sense of your logical mind. Present our Leadership PowerPoint Templates because Our PowerPoint Templates and Slides are effectively colour coded to prioritise your plans They automatically highlight the sequence of events you desire. Use our Circle Charts PowerPoint Templates because you should Experience excellence with our PowerPoint Templates and Slides. They will take your breath away. Use our Business PowerPoint Templates because you should once Tap the ingenuity of our PowerPoint Templates and Slides. They are programmed to succeed. Download and present our Process and Flows PowerPoint Templates because You will get more than you ever bargained for. Use these PowerPoint slides for presentations relating to Chart, segmented, pie, hub, wheel, isolated, divided, business, communication, diagram, circle, graphic, process, element, tire, graph, marketing, illustration, icon, circular, round, clipart, design, success, set, spoke, button. The prominent colors used in the PowerPoint template are Blue, Gray, White. Make your audience feel exclusive with our Spoke Diagram Business Data Analysis 8 Stages Barber Shop Plan PowerPoint Templates. Give them special attention with your thoughts.
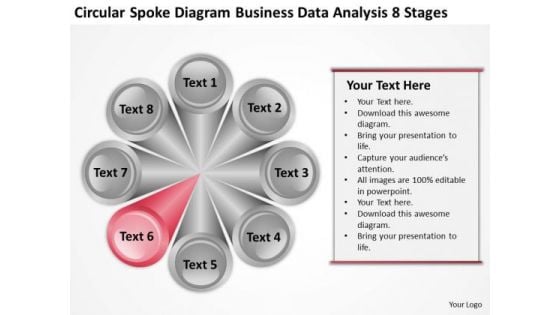
Spoke Diagram Business Data Analysis 8 Stages Plan Help PowerPoint Templates
We present our spoke diagram business data analysis 8 stages plan help PowerPoint templates.Use our Finance PowerPoint Templates because Our PowerPoint Templates and Slides will let you Hit the target. Go the full distance with ease and elan. Use our Leadership PowerPoint Templates because Our PowerPoint Templates and Slides are created with admirable insight. Use them and give your group a sense of your logical mind. Use our Circle Charts PowerPoint Templates because You should Bet on your luck with our PowerPoint Templates and Slides. Be assured that you will hit the jackpot. Download our Business PowerPoint Templates because Timeline crunches are a fact of life. Meet all deadlines using our PowerPoint Templates and Slides. Download our Process and Flows PowerPoint Templates because Our PowerPoint Templates and Slides will let you Hit the right notes. Watch your audience start singing to your tune.Use these PowerPoint slides for presentations relating to Chart, segmented, pie, hub, wheel, isolated, divided, business, communication, diagram, circle, graphic, process, element, tire, graph, marketing, illustration, icon, circular, round, clipart, design, success, set, spoke, button. The prominent colors used in the PowerPoint template are Red, Gray, White. Your audience will love what they are looking at. Impress them with our Spoke Diagram Business Data Analysis 8 Stages Plan Help PowerPoint Templates. You will be at the top of your game.
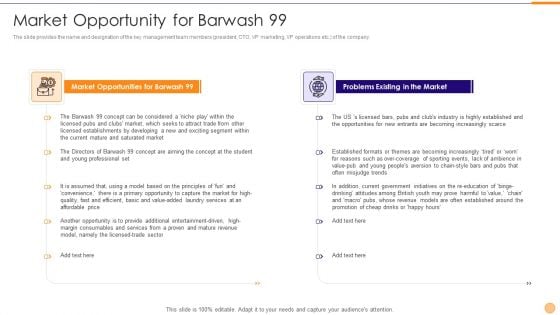
Classified Data Memo Record With Strategic Goals Market Opportunity For Barwash 99 Ideas PDF
The slide provides the name and designation of the key management team members president, CTO, VP marketing, VP operations etc. of the company. Presenting classified data memo record with strategic goals market opportunity for barwash 99 ideas pdf to provide visual cues and insights. Share and navigate important information on two stages that need your due attention. This template can be used to pitch topics like market opportunities for barwash 99, problems existing in the market. In addtion, this PPT design contains high resolution images, graphics, etc, that are easily editable and available for immediate download.
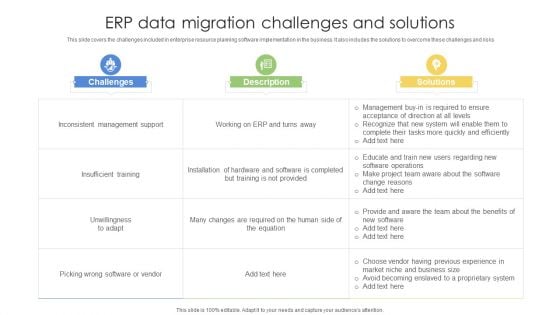
ERP Data Migration Challenges And Solutions Ppt Styles Design Inspiration PDF
This slide covers the challenges included in enterprise resource planning software implementation in the business. It also includes the solutions to overcome these challenges and risks. Pitch your topic with ease and precision using this ERP Data Migration Challenges And Solutions Ppt Styles Design Inspiration PDF. This layout presents information on Challenges, Solutions, Inconsistent Management Support. It is also available for immediate download and adjustment. So, changes can be made in the color, design, graphics or any other component to create a unique layout.
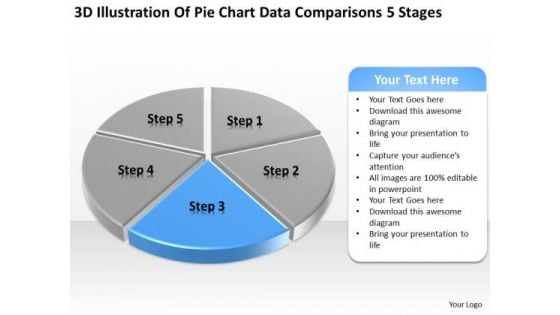
Pie Chart Data Comparisons 5 Stages Business Plan Templates PowerPoint Slides
We present our pie chart data comparisons 5 stages business plan templates PowerPoint Slides.Present our Marketing PowerPoint Templates because Our PowerPoint Templates and Slides are Clear and concise. Use them and dispel any doubts your team may have. Present our Finance PowerPoint Templates because You can Create a matrix with our PowerPoint Templates and Slides. Feel the strength of your ideas click into place. Download our Business PowerPoint Templates because You can Inspire your team with our PowerPoint Templates and Slides. Let the force of your ideas flow into their minds. Present our Sales PowerPoint Templates because Our PowerPoint Templates and Slides are aesthetically designed to attract attention. We gaurantee that they will grab all the eyeballs you need. Present our Success PowerPoint Templates because Our PowerPoint Templates and Slides are specially created by a professional team with vast experience. They diligently strive to come up with the right vehicle for your brilliant Ideas. Use these PowerPoint slides for presentations relating to Analysis, Analyzing, Brands, Business, Chart, Colorful, Commerce, Compare, Comparison, Data, Economical, Finance, Financial, Grow, Growth, Market, Market Share, Marketing, Measure, Pen, Pie, Pie Chart, Presentation, Profit, Revenue, Sales, Sales Chat, Sales Increase, Share, Statistical, Success, Successful. The prominent colors used in the PowerPoint template are Blue, Gray, White. Start a company with our Pie Chart Data Comparisons 5 Stages Business Plan Templates PowerPoint Slides. Just download, type and present.
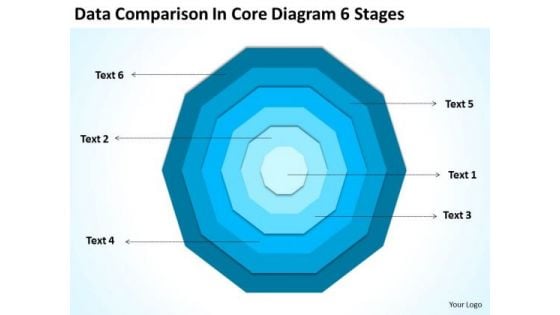
Data Comparison In Core Diagram 6 Stages Bussiness Plan PowerPoint Templates
We present our data comparison in core diagram 6 stages bussiness plan PowerPoint templates.Download our Circle Charts PowerPoint Templates because Our PowerPoint Templates and Slides are aesthetically designed to attract attention. We gaurantee that they will grab all the eyeballs you need. Download our Process and Flows PowerPoint Templates because You can Bait your audience with our PowerPoint Templates and Slides. They will bite the hook of your ideas in large numbers. Present our Business PowerPoint Templates because It will Give impetus to the hopes of your colleagues. Our PowerPoint Templates and Slides will aid you in winning their trust. Download our Marketing PowerPoint Templates because Our PowerPoint Templates and Slides will let your team Walk through your plans. See their energy levels rise as you show them the way. Download and present our Success PowerPoint Templates because Our PowerPoint Templates and Slides are specially created by a professional team with vast experience. They diligently strive to come up with the right vehicle for your brilliant Ideas. Use these PowerPoint slides for presentations relating to Background, abstract, blue, design, vector, line, bright, light, shape, pattern, clean, motion, decoration, white, power, business, blank, concept, circle, element, card, technology, smooth, flowing, modern, illustration, energy, sparse, shiny, backdrop, color, effect, style, space . The prominent colors used in the PowerPoint template are Blue, Blue dark, Blue light. Handle a delicate situation with our Data Comparison In Core Diagram 6 Stages Bussiness Plan PowerPoint Templates. Just download, type and present.
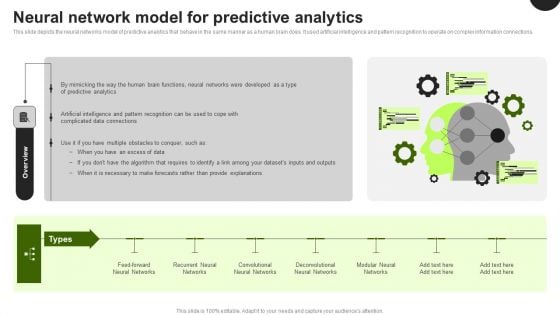
Predictive Analytics In The Age Of Big Data Neural Network Model For Predictive Analytics Demonstration PDF
This slide depicts the neural networks model of predictive analytics that behave in the same manner as a human brain does. It used artificial intelligence and pattern recognition to operate on complex information connections. Do you have an important presentation coming up Are you looking for something that will make your presentation stand out from the rest Look no further than Predictive Analytics In The Age Of Big Data Neural Network Model For Predictive Analytics Demonstration PDF. With our professional designs, you can trust that your presentation will pop and make delivering it a smooth process. And with Slidegeeks, you can trust that your presentation will be unique and memorable. So why wait Grab Predictive Analytics In The Age Of Big Data Neural Network Model For Predictive Analytics Demonstration PDF today and make your presentation stand out from the rest.
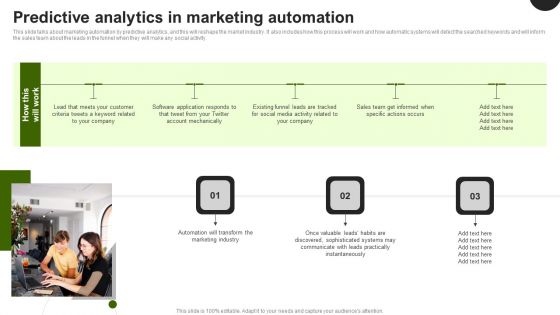
Predictive Analytics In The Age Of Big Data Predictive Analytics In Marketing Automation Ideas PDF
This slide talks about marketing automation by predictive analytics, and this will reshape the market industry. It also includes how this process will work and how automatic systems will detect the searched keywords and will inform the sales team about the leads in the funnel when they will make any social activity. The Predictive Analytics In The Age Of Big Data Predictive Analytics In Marketing Automation Ideas PDF is a compilation of the most recent design trends as a series of slides. It is suitable for any subject or industry presentation, containing attractive visuals and photo spots for businesses to clearly express their messages. This template contains a variety of slides for the user to input data, such as structures to contrast two elements, bullet points, and slides for written information. Slidegeeks is prepared to create an impression.
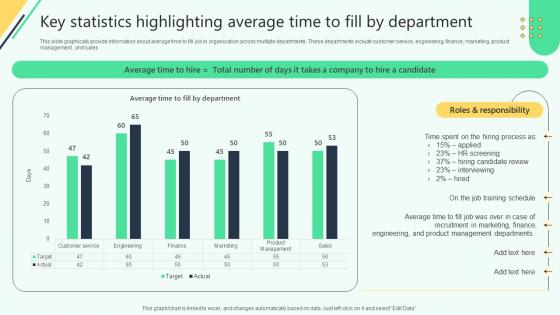
Key Statistics Highlighting Average Time To Fill By Analysing Hr Data For Effective Decision Making
This slide graphically provide information about average time to fill job in organisation across multiple departments. These departments include customer service, engineering, finance, marketing, product management , and sales Do you know about Slidesgeeks Key Statistics Highlighting Average Time To Fill By Analysing Hr Data For Effective Decision Making These are perfect for delivering any kind od presentation. Using it, create PowerPoint presentations that communicate your ideas and engage audiences. Save time and effort by using our pre-designed presentation templates that are perfect for a wide range of topic. Our vast selection of designs covers a range of styles, from creative to business, and are all highly customizable and easy to edit. Download as a PowerPoint template or use them as Google Slides themes. This slide graphically provide information about average time to fill job in organisation across multiple departments. These departments include customer service, engineering, finance, marketing, product management , and sales

Hr Recruitment Dashboard Showcasing Open Positions By Analysing Hr Data For Effective Decision Making
This slide showcases a dashboard that helps organizations track and monitor the hiring process. It includes total applicants, shortlisted candidates, hired candidates, rejected candidates, time to hire, cost to hire, etc. The Hr Recruitment Dashboard Showcasing Open Positions By Analysing Hr Data For Effective Decision Making is a compilation of the most recent design trends as a series of slides. It is suitable for any subject or industry presentation, containing attractive visuals and photo spots for businesses to clearly express their messages. This template contains a variety of slides for the user to input data, such as structures to contrast two elements, bullet points, and slides for written information. Slidegeeks is prepared to create an impression. This slide showcases a dashboard that helps organizations track and monitor the hiring process. It includes total applicants, shortlisted candidates, hired candidates, rejected candidates, time to hire, cost to hire, etc.
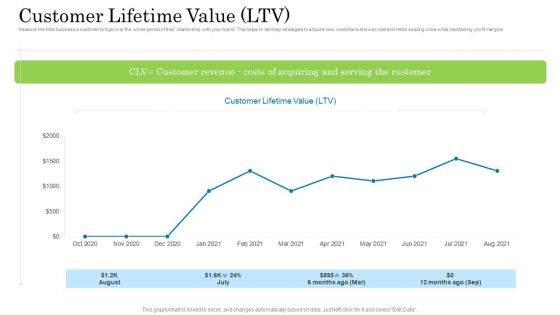
Customer Behavioral Data And Analytics Customer Lifetime Value Ltv Graphics PDF
Measure the total business a customer brings over the whole period of their relationship with your brand. This helps to develop strategies to acquire new customers at lower cost and retain existing ones while maintaining profit margins. Deliver and pitch your topic in the best possible manner with this customer behavioral data and analytics customer lifetime value ltv graphics pdf. Use them to share invaluable insights on customer lifetime value and impress your audience. This template can be altered and modified as per your expectations. So, grab it now.
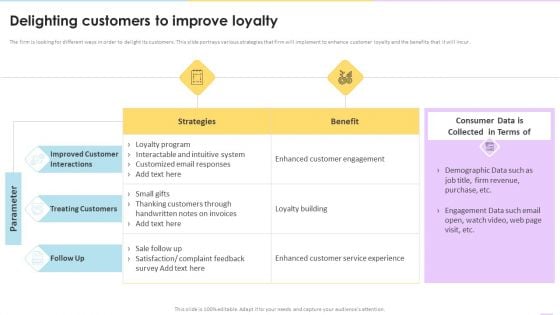
Data Valuation And Monetization Delighting Customers To Improve Loyalty Clipart PDF
The firm is looking for different ways in order to delight its customers. This slide portrays various strategies that firm will implement to enhance customer loyalty and the benefits that it will incur. Deliver and pitch your topic in the best possible manner with this Data Valuation And Monetization Delighting Customers To Improve Loyalty Clipart PDF. Use them to share invaluable insights on Improved Customer, Treating Customers, Customer Engagement and impress your audience. This template can be altered and modified as per your expectations. So, grab it now.
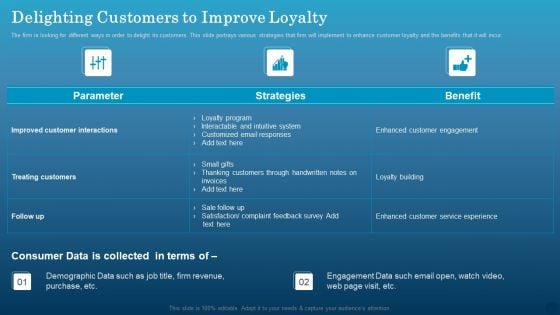
Data Monetization Approach To Drive Business Growth Delighting Customers To Improve Loyalty Inspiration PDF
The firm is looking for different ways in order to delight its customers. This slide portrays various strategies that firm will implement to enhance customer loyalty and the benefits that it will incur. If your project calls for a presentation, then Slidegeeks is your go to partner because we have professionally designed, easy to edit templates that are perfect for any presentation. After downloading, you can easily edit Data Monetization Approach To Drive Business Growth Delighting Customers To Improve Loyalty Inspiration PDF and make the changes accordingly. You can rearrange slides or fill them with different images. Check out all the handy templates.
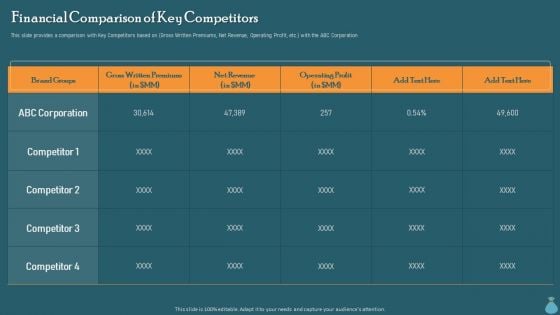
Financial Data Revelation To Varied Stakeholders Financial Comparison Of Key Competitors Microsoft PDF
This slide provides a comparison with Key Competitors based on Gross Written Premiums, Net Revenue, Operating Profit, etc. with the ABC Corporation. Make sure to capture your audiences attention in your business displays with our gratis customizable Financial Data Revelation To Varied Stakeholders Financial Comparison Of Key Competitors Microsoft PDF. These are great for business strategies, office conferences, capital raising or task suggestions. If you desire to acquire more customers for your tech business and ensure they stay satisfied, create your own sales presentation with these plain slides.
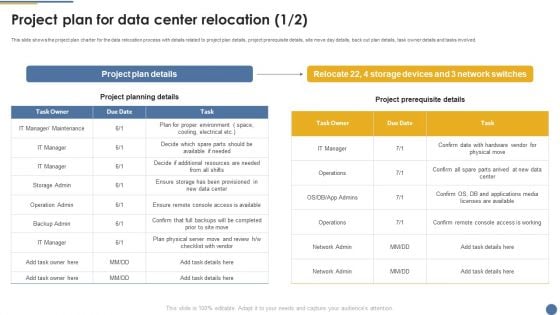
Assessment And Workflow Project Plan For Data Center Relocation Background PDF
This slide shows the project plan charter for the data relocation process with details related to project plan details, project prerequisite details, site move day details, back out plan details, task owner details and tasks involved. Coming up with a presentation necessitates that the majority of the effort goes into the content and the message you intend to convey. The visuals of a PowerPoint presentation can only be effective if it supplements and supports the story that is being told. Keeping this in mind our experts created Assessment And Workflow Project Plan For Data Center Relocation Background PDF to reduce the time that goes into designing the presentation. This way, you can concentrate on the message while our designers take care of providing you with the right template for the situation.

Data Safety Initiatives Scorecard To Check Cybersecurity And Digital Risk Preparedness Rules PDF
Following slide illustrates a scorecard that company will use to check its preparedness against various cyber security and digital risk events. Sections covered here are fraud prevention considerations, score and notes. Deliver an awe inspiring pitch with this creative data safety initiatives scorecard to check cybersecurity and digital risk preparedness rules pdf bundle. Topics like risk prevention considerations, score, standard rating, top management displays can be discussed with this completely editable template. It is available for immediate download depending on the needs and requirements of the user.
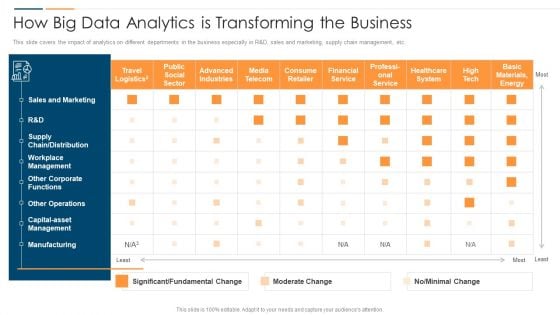
Revolution In Online Business How Big Data Analytics Is Transforming The Business Clipart PDF
This slide covers the impact of analytics on different departments in the business especially in R And D, sales and marketing, supply chain management, etc. Deliver and pitch your topic in the best possible manner with this Revolution In Online Business How Big Data Analytics Is Transforming The Business Clipart PDF. Use them to share invaluable insights on Sales And Marketing, Significant Fundamental Change, Other Corporate Functions and impress your audience. This template can be altered and modified as per your expectations. So, grab it now.
Data Processing Services Delivery Raci Matrix For AI And ML Implementation Icons PDF
This slide depicts the roles and responsibilities of the staff while implementing the artificial intelligence and machine learning systems in the organization and it also includes the management tasks as well. Deliver and pitch your topic in the best possible manner with this Data Processing Services Delivery Raci Matrix For AI And ML Implementation Icons PDF. Use them to share invaluable insights on Responsibilities, Training, Training Planning and impress your audience. This template can be altered and modified as per your expectations. So, grab it now.

Stages Of Pie Chart Data Interpretation Business Plan Template PowerPoint Templates
We present our stages of pie chart data interpretation business plan template PowerPoint templates.Download and present our Circle Charts PowerPoint Templates because You can Stir your ideas in the cauldron of our PowerPoint Templates and Slides. Cast a magic spell on your audience. Download our Marketing PowerPoint Templates because Our PowerPoint Templates and Slides will let you Hit the target. Go the full distance with ease and elan. Use our Business PowerPoint Templates because Our PowerPoint Templates and Slides are truly out of this world. Even the MIB duo has been keeping tabs on our team. Download our Shapes PowerPoint Templates because Watching this your Audience will Grab their eyeballs, they wont even blink. Download our Process and Flows PowerPoint Templates because It will Give impetus to the hopes of your colleagues. Our PowerPoint Templates and Slides will aid you in winning their trust.Use these PowerPoint slides for presentations relating to achievement, analysis, background, bank, banking, business, calculation, chart, circle, commerce, commercial, commission, concept, credit, crisis, debt, deposit, design, detail, diagram, earnings, economics, economy, element, finance, goal, gold, golden, graph, graphic, growth, icon, idea, illustration, income, increase, invest, isolated, level, loss, market, marketing, metal, modern, money, new, object, part, percent, percentage, pie, plot, politics, profit, progress, ratio, reflection, reflective. The prominent colors used in the PowerPoint template are Blue, Gray, Black. Feed their curiosity with our Stages Of Pie Chart Data Interpretation Business Plan Template PowerPoint Templates. Arouse expectations with your thoughts.
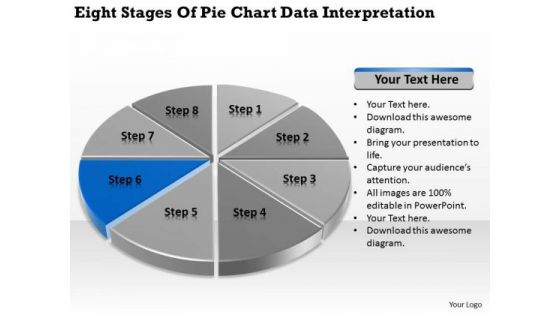
Stages Of Pie Chart Data Interpretation Example Business Plan PowerPoint Slides
We present our stages of pie chart data interpretation example business plan PowerPoint Slides.Download and present our Circle Charts PowerPoint Templates because It will let you Set new benchmarks with our PowerPoint Templates and Slides. They will keep your prospects well above par. Download our Marketing PowerPoint Templates because Our PowerPoint Templates and Slides will weave a web of your great ideas. They are gauranteed to attract even the most critical of your colleagues. Use our Business PowerPoint Templates because It will Strengthen your hand with your thoughts. They have all the aces you need to win the day. Present our Shapes PowerPoint Templates because It will get your audience in sync. Present our Process and Flows PowerPoint Templates because Our PowerPoint Templates and Slides will generate and maintain the level of interest you desire. They will create the impression you want to imprint on your audience.Use these PowerPoint slides for presentations relating to achievement, analysis, background, bank, banking, business, calculation, chart, circle, commerce, commercial, commission, concept, credit, crisis, debt, deposit, design, detail, diagram, earnings, economics, economy, element, finance, goal, gold, golden, graph, graphic, growth, icon, idea, illustration, income, increase, invest, isolated, level, loss, market, marketing, metal, modern, money, new, object, part, percent, percentage, pie, plot, politics, profit, progress, ratio, reflection, reflective. The prominent colors used in the PowerPoint template are Blue navy, Gray, Black. Add emphasis to your ideas with our Stages Of Pie Chart Data Interpretation Example Business Plan PowerPoint Slides. Lend greater credence to your expression.
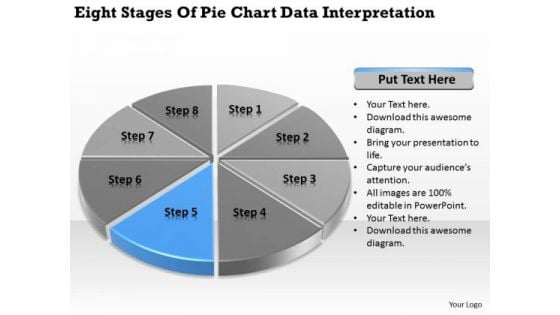
Stages Of Pie Chart Data Interpretation How To Write Business Plan PowerPoint Templates
We present our stages of pie chart data interpretation how to write business plan PowerPoint templates.Present our Circle Charts PowerPoint Templates because Our PowerPoint Templates and Slides will provide you a launch platform. Give a lift off to your ideas and send them into orbit. Present our Marketing PowerPoint Templates because Our PowerPoint Templates and Slides will let you Hit the right notes. Watch your audience start singing to your tune. Use our Business PowerPoint Templates because Our PowerPoint Templates and Slides come in all colours, shades and hues. They help highlight every nuance of your views. Download our Shapes PowerPoint Templates because It can Leverage your style with our PowerPoint Templates and Slides. Charm your audience with your ability. Use our Process and Flows PowerPoint Templates because You can Connect the dots. Fan expectations as the whole picture emerges.Use these PowerPoint slides for presentations relating to achievement, analysis, background, bank, banking, business, calculation, chart, circle, commerce, commercial, commission, concept, credit, crisis, debt, deposit, design, detail, diagram, earnings, economics, economy, element, finance, goal, gold, golden, graph, graphic, growth, icon, idea, illustration, income, increase, invest, isolated, level, loss, market, marketing, metal, modern, money, new, object, part, percent, percentage, pie, plot, politics, profit, progress, ratio, reflection, reflective. The prominent colors used in the PowerPoint template are Blue, Gray, Black. Our Stages Of Pie Chart Data Interpretation How To Write Business Plan PowerPoint Templates avoid exaggerations. They keep you away from any farce.
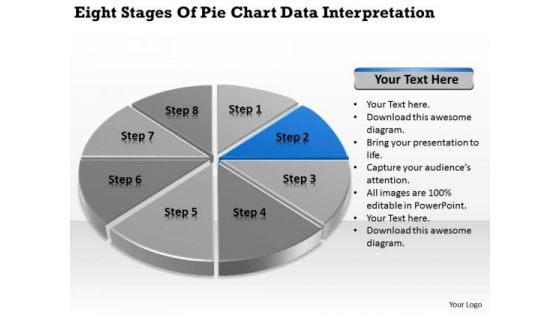
Stages Of Pie Chart Data Interpretation Vending Machine Business Plan PowerPoint Slides
We present our stages of pie chart data interpretation vending machine business plan PowerPoint Slides.Present our Circle Charts PowerPoint Templates because You should Bet on your luck with our PowerPoint Templates and Slides. Be assured that you will hit the jackpot. Present our Marketing PowerPoint Templates because Our PowerPoint Templates and Slides will provide you the cutting edge. Slice through the doubts in the minds of your listeners. Download our Business PowerPoint Templates because you should Experience excellence with our PowerPoint Templates and Slides. They will take your breath away. Download our Shapes PowerPoint Templates because It will Raise the bar of your Thoughts. They are programmed to take you to the next level. Present our Process and Flows PowerPoint Templates because Our PowerPoint Templates and Slides will give good value for money. They also have respect for the value of your time.Use these PowerPoint slides for presentations relating to achievement, analysis, background, bank, banking, business, calculation, chart, circle, commerce, commercial, commission, concept, credit, crisis, debt, deposit, design, detail, diagram, earnings, economics, economy, element, finance, goal, gold, golden, graph, graphic, growth, icon, idea, illustration, income, increase, invest, isolated, level, loss, market, marketing, metal, modern, money, new, object, part, percent, percentage, pie, plot, politics, profit, progress, ratio, reflection, reflective. The prominent colors used in the PowerPoint template are Blue, Gray, Black. Our Stages Of Pie Chart Data Interpretation Vending Machine Business Plan PowerPoint Slides come at a comfortable cost. They are definitely an economical choice.
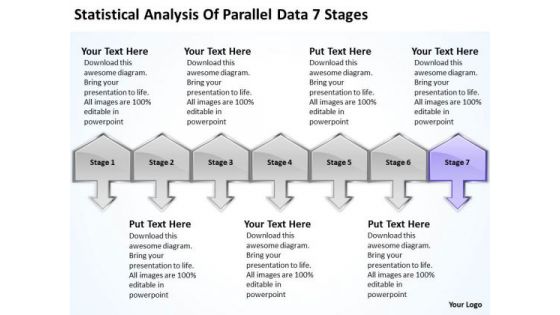
Statistical Analysis Of Parallel Data 7 Stages Ppt Help With Business Plan PowerPoint Slides
We present our statistical analysis of parallel data 7 stages ppt help with business plan PowerPoint Slides.Download and present our Communication PowerPoint Templates because You have gained great respect for your brilliant ideas. Use our PowerPoint Templates and Slides to strengthen and enhance your reputation. Present our Business PowerPoint Templates because you have developed a vision of where you want to be a few years from now. Use our Arrows PowerPoint Templates because this business powerpoint template helps expound on the logic of your detailed thought process to take your company forward. Download our Success PowerPoint Templates because iT outlines the entire thought process for the benefit of others. Tell it to the world with your characteristic aplomb. Use our Symbol PowerPoint Templates because this template helps you to bring your audiences to the table.Use these PowerPoint slides for presentations relating to 3d, Achievement, Action, Aim, Arrows, Black, Business, Color, Communication, Competition, Concept, Connection, Creative, Design, Different, Direction, Element, First, Forward, Graph, Graphic, Group, Growth, Higher, Icon, Illustration, Image, Isolated, Leader, Leadership, Line, Menu, Motion, Orange, Progress, Series, Seven, Sign, Slew, Solution, Success, Swerve, Symbol, Team, Teamwork, Turn, Up. The prominent colors used in the PowerPoint template are Purple, Gray, Black. Customers tell us our statistical analysis of parallel data 7 stages ppt help with business plan PowerPoint Slides will generate and maintain the level of interest you desire. They will create the impression you want to imprint on your audience. Use our Arrows PowerPoint templates and PPT Slides are Magnificent. PowerPoint presentation experts tell us our statistical analysis of parallel data 7 stages ppt help with business plan PowerPoint Slides will help them to explain complicated concepts. People tell us our Action PowerPoint templates and PPT Slides will make the presenter successul in his career/life. We assure you our statistical analysis of parallel data 7 stages ppt help with business plan PowerPoint Slides are Precious. People tell us our Aim PowerPoint templates and PPT Slides are Pleasant. Many a popular belief turn out fallacious. Establish the factual position with our Statistical Analysis Of Parallel Data 7 Stages Ppt Help With Business Plan PowerPoint Slides.

Five Years Data Analytics Career Roadmap With Live Industry Projects Portrait
Presenting our jaw-dropping five years data analytics career roadmap with live industry projects portrait. You can alternate the color, font size, font type, and shapes of this PPT layout according to your strategic process. This PPT presentation is compatible with Google Slides and is available in both standard screen and widescreen aspect ratios. You can also download this well-researched PowerPoint template design in different formats like PDF, JPG, and PNG. So utilize this visually-appealing design by clicking the download button given below.
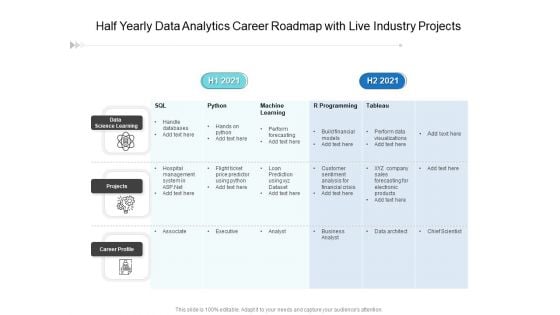
Half Yearly Data Analytics Career Roadmap With Live Industry Projects Formats
Presenting our jaw-dropping half yearly data analytics career roadmap with live industry projects formats You can alternate the color, font size, font type, and shapes of this PPT layout according to your strategic process. This PPT presentation is compatible with Google Slides and is available in both standard screen and widescreen aspect ratios. You can also download this well-researched PowerPoint template design in different formats like PDF, JPG, and PNG. So utilize this visually-appealing design by clicking the download button given below.
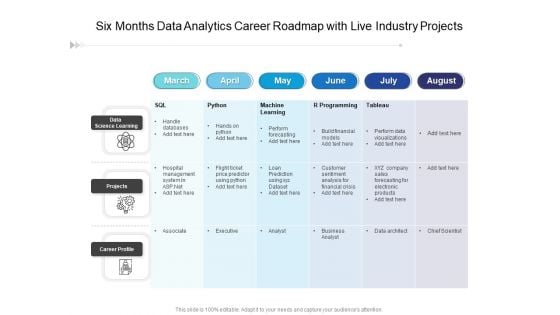
Six Months Data Analytics Career Roadmap With Live Industry Projects Demonstration
Presenting our jaw-dropping six months data analytics career roadmap with live industry projects demonstration. You can alternate the color, font size, font type, and shapes of this PPT layout according to your strategic process. This PPT presentation is compatible with Google Slides and is available in both standard screen and widescreen aspect ratios. You can also download this well-researched PowerPoint template design in different formats like PDF, JPG, and PNG. So utilize this visually-appealing design by clicking the download button given below.
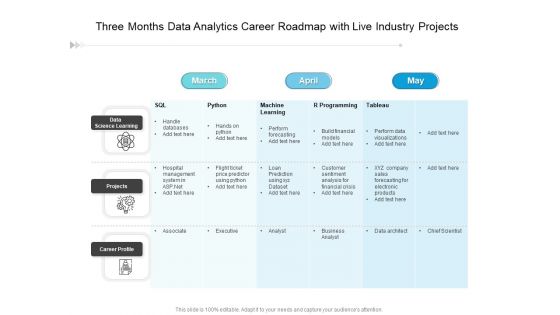
Three Months Data Analytics Career Roadmap With Live Industry Projects Elements
Presenting our jaw-dropping three months data analytics career roadmap with live industry projects elements. You can alternate the color, font size, font type, and shapes of this PPT layout according to your strategic process. This PPT presentation is compatible with Google Slides and is available in both standard screen and widescreen aspect ratios. You can also download this well-researched PowerPoint template design in different formats like PDF, JPG, and PNG. So utilize this visually-appealing design by clicking the download button given below.
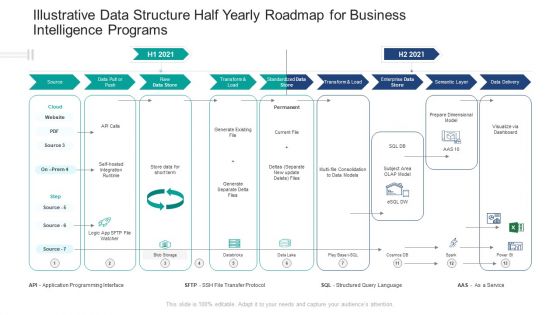
Illustrative Data Structure Half Yearly Roadmap For Business Intelligence Programs Guidelines
Presenting our jaw-dropping illustrative data structure half yearly roadmap for business intelligence programs guidelines. You can alternate the color, font size, font type, and shapes of this PPT layout according to your strategic process. This PPT presentation is compatible with Google Slides and is available in both standard screen and widescreen aspect ratios. You can also download this well-researched PowerPoint template design in different formats like PDF, JPG, and PNG. So utilize this visually-appealing design by clicking the download button given below.

Illustrative Data Structure Six Months Roadmap For Internet Of Things Slides
Presenting our jaw-dropping illustrative data structure six months roadmap for internet of things slides. You can alternate the color, font size, font type, and shapes of this PPT layout according to your strategic process. This PPT presentation is compatible with Google Slides and is available in both standard screen and widescreen aspect ratios. You can also download this well-researched PowerPoint template design in different formats like PDF, JPG, and PNG. So utilize this visually-appealing design by clicking the download button given below.
Data Center Relocation Implementation Three Months Roadmap Ppt Icon Graphics Template PDF
Presenting our jaw-dropping data center relocation implementation three months roadmap ppt icon graphics template pdf. You can alternate the color, font size, font type, and shapes of this PPT layout according to your strategic process. This PPT presentation is compatible with Google Slides and is available in both standard screen and widescreen aspect ratios. You can also download this well-researched PowerPoint template design in different formats like PDF, JPG, and PNG. So utilize this visually-appealing design by clicking the download button given below.
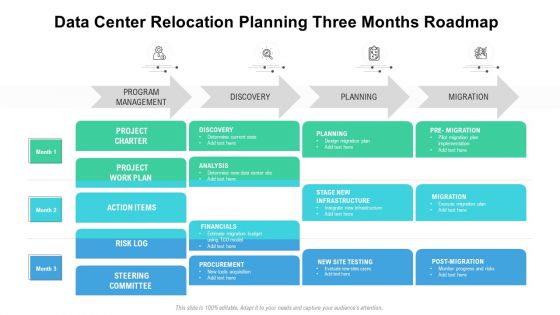
Data Center Relocation Planning Three Months Roadmap Ppt Gallery Shapes PDF
Presenting our jaw-dropping data center relocation planning three months roadmap ppt gallery shapes pdf. You can alternate the color, font size, font type, and shapes of this PPT layout according to your strategic process. This PPT presentation is compatible with Google Slides and is available in both standard screen and widescreen aspect ratios. You can also download this well-researched PowerPoint template design in different formats like PDF, JPG, and PNG. So utilize this visually-appealing design by clicking the download button given below.
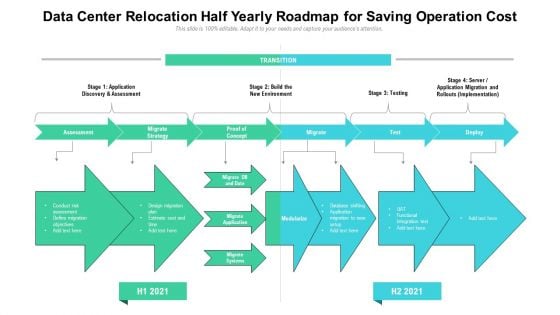
Data Center Relocation Half Yearly Roadmap For Saving Operation Cost Infographics PDF
Presenting our jaw-dropping data center relocation half yearly roadmap for saving operation cost infographics pdf. You can alternate the color, font size, font type, and shapes of this PPT layout according to your strategic process. This PPT presentation is compatible with Google Slides and is available in both standard screen and widescreen aspect ratios. You can also download this well-researched PowerPoint template design in different formats like PDF, JPG, and PNG. So utilize this visually-appealing design by clicking the download button given below.


 Continue with Email

 Home
Home


