Data Management Process
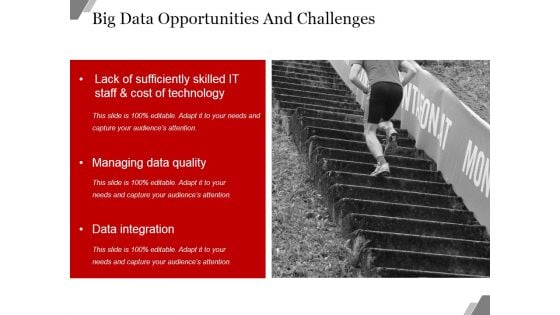
Big Data Opportunities And Challenges Template Ppt PowerPoint Presentation Design Ideas
This is a big data opportunities and challenges template ppt powerpoint presentation design ideas. This is a three stage process. The stages in this process are business, marketing, success, finance, analysis.
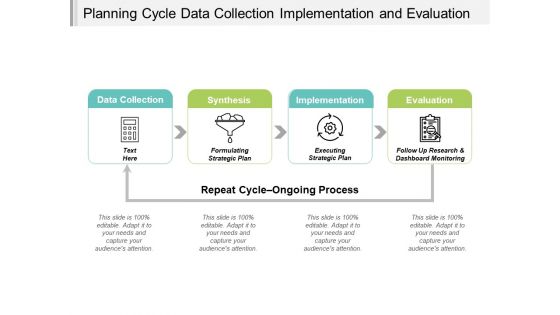
Planning Cycle Data Collection Implementation And Evaluation Ppt PowerPoint Presentation File Pictures
This is a planning cycle data collection implementation and evaluation ppt powerpoint presentation file pictures. This is a four stage process. The stages in this process are environmental scan, environmental study, environmental examine.
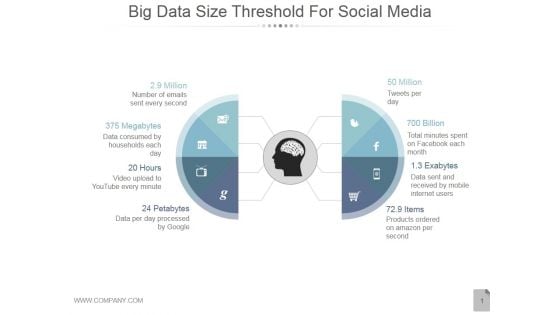
Big Data Size Threshold For Social Media Ppt PowerPoint Presentation Example
This is a big data size threshold for social media ppt powerpoint presentation example. This is a eight stage process. The stages in this process are million, megabytes, hours, petabytes, items.
Sales Order Management For Bpmn Model Icons PDF
This slide showcases the sales order procedure for business process model and notation. It includes steps such as receive order, production scheduling, logistics arrangement, price calculation and invoice processing.Showcasing this set of slides titled Sales Order Management For Bpmn Model Icons PDF. The topics addressed in these templates are Production Planning, Request Is Processed, Logistics Arrangement. All the content presented in this PPT design is completely editable. Download it and make adjustments in color, background, font etc. as per your unique business setting.
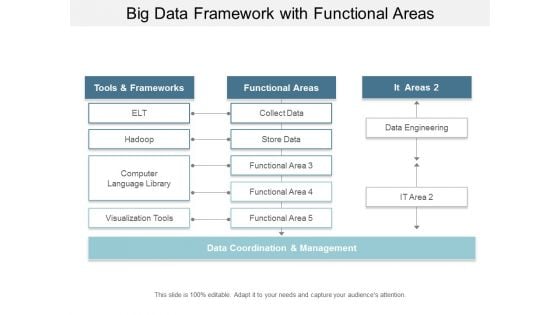
Big Data Framework With Functional Areas Ppt Powerpoint Presentation Infographic Template Infographics
This is a big data framework with functional areas ppt powerpoint presentation infographic template infographics. This is a three stage process. The stages in this process are functional architecture, functional planning, functional designing.
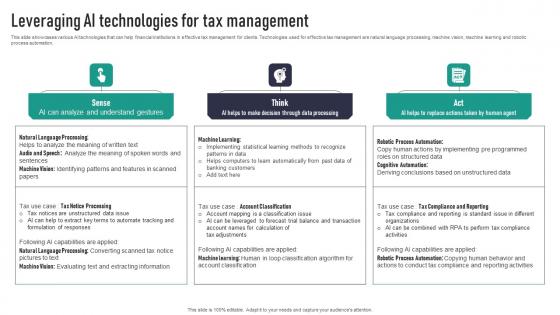
Leveraging AI Technologies For Tax Management Diagrams Pdf
This slide showcases various AI technologies that can help financial institutions in effective tax management for clients. Technologies used for effective tax management are natural language processing, machine vision, machine learning and robotic process automation. There are so many reasons you need a Leveraging AI Technologies For Tax Management Diagrams Pdf. The first reason is you can not spend time making everything from scratch, Thus, Slidegeeks has made presentation templates for you too. You can easily download these templates from our website easily. This slide showcases various AI technologies that can help financial institutions in effective tax management for clients. Technologies used for effective tax management are natural language processing, machine vision, machine learning and robotic process automation.
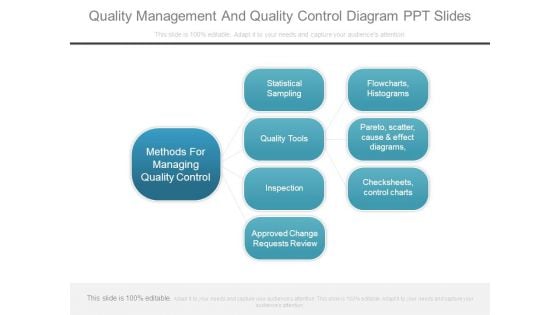
Quality Management And Quality Control Diagram Ppt Slides
This is a quality management and quality control diagram ppt slides. This is a three stage process. The stages in this process are methods for managing quality control, statistical sampling, quality tools, inspection, approved change requests review, flowcharts, histograms, pareto, scatter, cause and effect diagrams, checksheets, control charts.
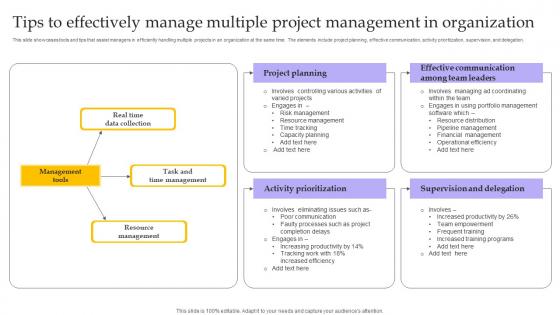
Tips To Effectively Manage Multiple Project Management In Organization Summary Pdf
This slide showcases tools and tips that assist managers in efficiently handling multiple projects in an organization at the same time. The elements include project planning, effective communication, activity prioritization, supervision, and delegation. Pitch your topic with ease and precision using this Tips To Effectively Manage Multiple Project Management In Organization Summary Pdf. This layout presents information on Project Planning, Activity Prioritization, Supervision And Delegation, Real Time Data Collection. It is also available for immediate download and adjustment. So, changes can be made in the color, design, graphics or any other component to create a unique layout. This slide showcases tools and tips that assist managers in efficiently handling multiple projects in an organization at the same time. The elements include project planning, effective communication, activity prioritization, supervision, and delegation.
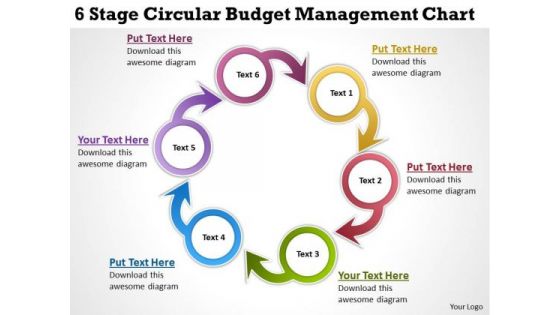
Business Diagram Templates 6 Stage Circular Budget Management Chart PowerPoint
We present our business diagram templates 6 stage circular budget management chart PowerPoint.Use our Circle Charts PowerPoint Templates because Our PowerPoint Templates and Slides will Activate the energies of your audience. Get their creative juices flowing with your words. Download and present our Business PowerPoint Templates because Our PowerPoint Templates and Slides will Activate the energies of your audience. Get their creative juices flowing with your words. Present our Shapes PowerPoint Templates because you should Whip up a frenzy with our PowerPoint Templates and Slides. They will fuel the excitement of your team. Use our Process and Flows PowerPoint Templates because You are an avid believer in ethical practices. Highlight the benefits that accrue with our PowerPoint Templates and Slides. Use our Arrows PowerPoint Templates because Our PowerPoint Templates and Slides will definately Enhance the stature of your presentation. Adorn the beauty of your thoughts with their colourful backgrounds.Use these PowerPoint slides for presentations relating to Arrow, Blue, Business, Chart, Circle, Complex, Concept, Data, Diagram, Financial, Graph, Graphic, Green, Icon, Illustration, Isolated, Model, Pink, Process, Purple, Red, Round, Set, Shape, Vector, Wheel, White, Yellow. The prominent colors used in the PowerPoint template are Yellow, Red, Blue. Engage our Business Diagram Templates 6 Stage Circular Budget Management Chart PowerPoint and experience the difference. Get accustomed to consistent brilliance.
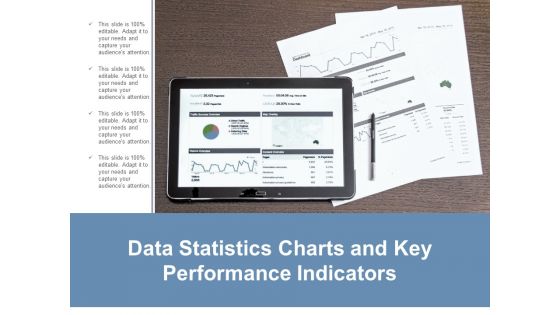
Data Statistics Charts And Key Performance Indicators Ppt Powerpoint Presentation Layouts Guide
This is a data statistics charts and key performance indicators ppt powerpoint presentation layouts guide. This is a four stage process. The stages in this process are business metrics, business kpi, business dashboard.
Global Benchmark Report Management And Finance Evaluation Icon Ideas PDF
Presenting Global Benchmark Report Management And Finance Evaluation Icon Ideas PDF to dispense important information. This template comprises one stages. It also presents valuable insights into the topics including Global Benchmark Report, Management And Finance, Evaluation Icon. This is a completely customizable PowerPoint theme that can be put to use immediately. So, download it and address the topic impactfully.
Project Management Strategic Foundation Approach Icon Designs PDF
Persuade your audience using this Project Management Strategic Foundation Approach Icon Designs PDF. This PPT design covers Three stages, thus making it a great tool to use. It also caters to a variety of topics including Project Management, Strategic Foundation, Approach Icon. Download this PPT design now to present a convincing pitch that not only emphasizes the topic but also showcases your presentation skills.
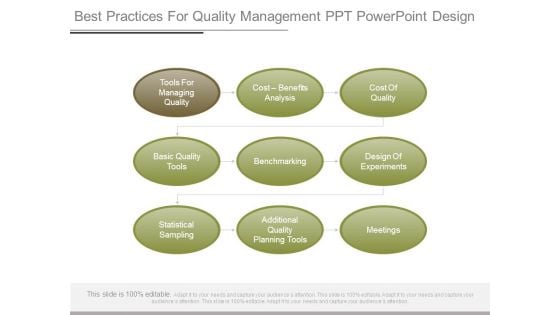
Best Practices For Quality Management Ppt Powerpoint Design
This is a best practices for quality management ppt powerpoint design. This is a nine stage process. The stages in this process are tools for managing quality, cost benefits analysis, cost of quality, basic quality tools, benchmarking, design of experiments, statistical sampling, additional quality planning tools, meetings.
Bar Graph Icon For Data Analysis Ppt PowerPoint Presentation Pictures Ideas
This is a bar graph icon for data analysis ppt powerpoint presentation pictures ideas. This is a four stage process. The stages in this process are financial analysis, quantitative, statistical modelling.
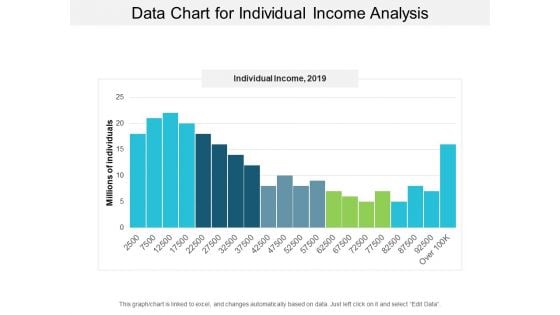
Data Chart For Individual Income Analysis Ppt PowerPoint Presentation Layouts Visual Aids
This is a data chart for individual income analysis ppt powerpoint presentation layouts visual aids. This is a five stage process. The stages in this process are financial analysis, quantitative, statistical modelling.
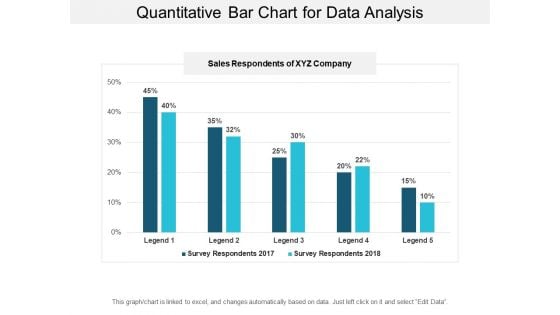
Quantitative Bar Chart For Data Analysis Ppt PowerPoint Presentation Model Graphic Tips
This is a quantitative bar chart for data analysis ppt powerpoint presentation model graphic tips. This is a two stage process. The stages in this process are financial analysis, quantitative, statistical modelling.
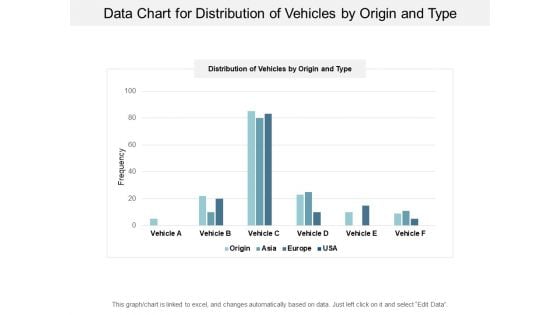
Data Chart For Distribution Of Vehicles By Origin And Type Ppt PowerPoint Presentation Infographics Topics
This is a data chart for distribution of vehicles by origin and type ppt powerpoint presentation infographics topics. This is a four stage process. The stages in this process are financial analysis, quantitative, statistical modelling.
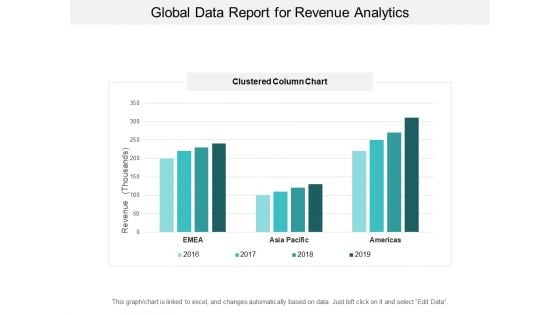
Global Data Report For Revenue Analytics Ppt PowerPoint Presentation Inspiration Visuals
This is a global data report for revenue analytics ppt powerpoint presentation inspiration visuals. This is a four stage process. The stages in this process are financial analysis, quantitative, statistical modelling.
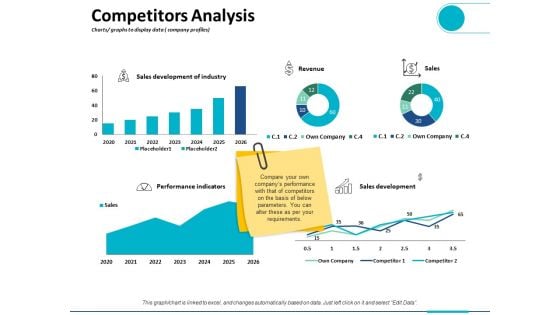
Competitors Analysis Charts Graphs To Display Data Company Profiles Ppt PowerPoint Presentation Outline Visual Aids
This is a competitors analysis charts graphs to display data company profiles ppt powerpoint presentation outline visual aids. This is a five stage process. The stages in this process are finance, analysis, business, investment, marketing.
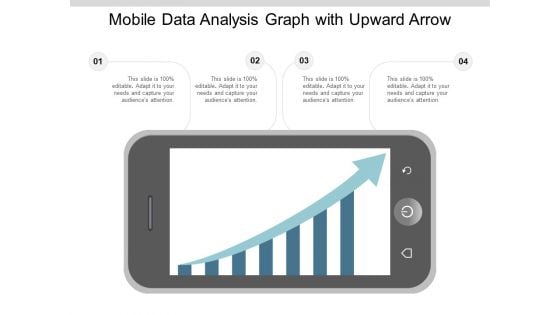
Mobile Data Analysis Graph With Upward Arrow Ppt PowerPoint Presentation Summary Styles
This is a mobile data analysis graph with upward arrow ppt powerpoint presentation summary styles. This is a four stage process. The stages in this process are mobile analytics, mobile tracking, mobile web analytics.

Business Analysis Data Charts And Reports Ppt Powerpoint Presentation Ideas Portrait
This is a business analysis data charts and reports ppt powerpoint presentation ideas portrait. This is a three stage process. The stages in this process are business metrics, business kpi, business dashboard.
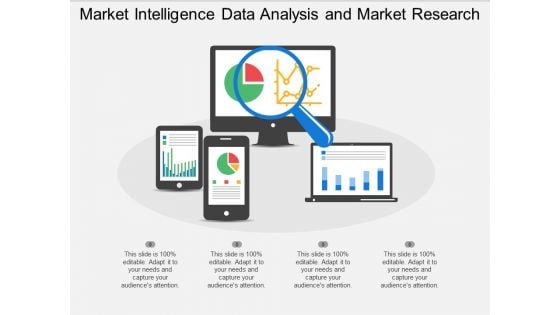
Market Intelligence Data Analysis And Market Research Ppt PowerPoint Presentation Professional Templates
This is a market intelligence data analysis and market research ppt powerpoint presentation professional templates. This is a four stage process. The stages in this process are digital analytics, digital dashboard, marketing.
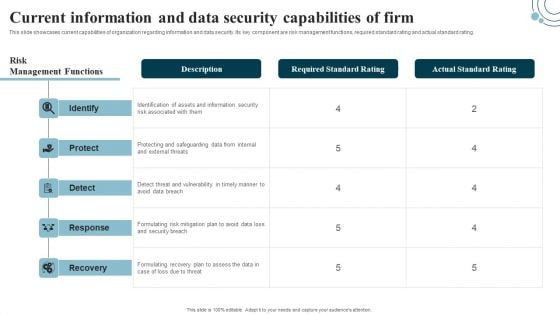
Developing IT Security Strategy Current Information And Data Security Capabilities Designs PDF
This slide showcases current capabilities of organization regarding information and data security. Its key component are risk management functions, required standard rating and actual standard rating. The best PPT templates are a great way to save time, energy, and resources. Slidegeeks have 100 percent editable powerpoint slides making them incredibly versatile. With these quality presentation templates, you can create a captivating and memorable presentation by combining visually appealing slides and effectively communicating your message. Download Developing IT Security Strategy Current Information And Data Security Capabilities Designs PDF from Slidegeeks and deliver a wonderful presentation.
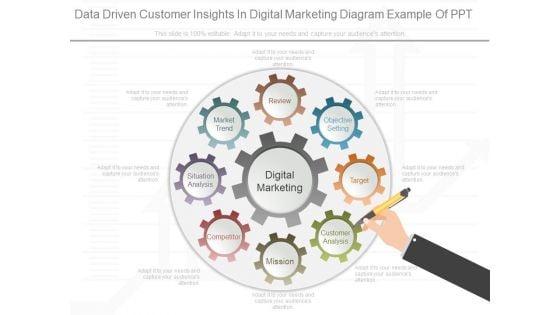
Data Driven Customer Insights In Digital Marketing Diagram Example Of Ppt
This is data driven customer insights in digital marketing diagram example of ppt. This is a eight stage process. The stages in this process are digital marketing, situation analysis, market trend, review, objective setting, customer analysis, competitor, mission.
Eight Sections Pie Chart For Percentage Data Analysis Ppt PowerPoint Presentation Styles Icons
This is a eight sections pie chart for percentage data analysis ppt powerpoint presentation styles icons. This is a eight stage process. The stages in this process are 6 piece pie chart, 6 segment pie chart, 6 parts pie chart.
Data Research And Analysis For Mobile Users Ppt PowerPoint Presentation Icon Inspiration
This is a data research and analysis for mobile users ppt powerpoint presentation icon inspiration. This is a four stage process. The stages in this process are mobile analytics, mobile tracking, mobile web analytics.
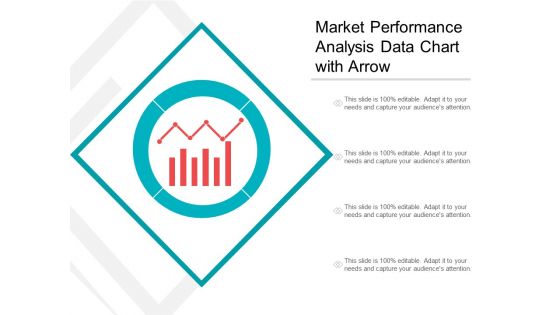
Market Performance Analysis Data Chart With Arrow Ppt PowerPoint Presentation Inspiration Graphics
This is a market performance analysis data chart with arrow ppt powerpoint presentation inspiration graphics. This is a four stage process. The stages in this process are marketing analytics, marketing performance, marketing discovery.
Quality Management Methods Techniques And Tools Powerpoint Design
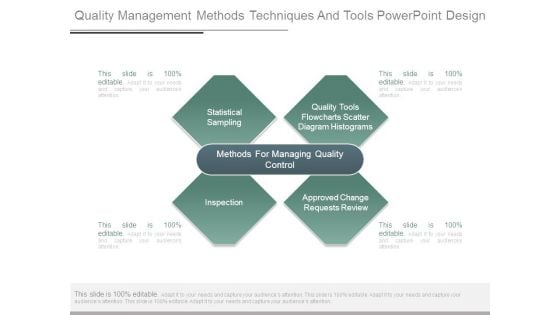
This is a quality management methods techniques and tools powerpoint design. This is a four stage process. The stages in this process are statistical sampling, quality tools flowcharts scatter diagram histograms, methods for managing quality control, inspection, approved change requests review.
Digital Ecosystem Data Link Application Session Ppt PowerPoint Presentation Ideas Rules
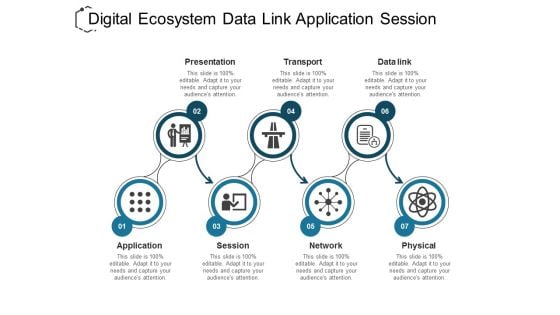
This is a digital ecosystem data link application session ppt powerpoint presentation ideas rules. This is a stage process. The stages in this process are osi model, technology layers, internetworking layer.
Departmental Error Tracking And Management Icon Microsoft PDF
Presenting Departmental Error Tracking And Management Icon Microsoft PDF to dispense important information. This template comprises three stages. It also presents valuable insights into the topics including Departmental, Error Tracking, Management. This is a completely customizable PowerPoint theme that can be put to use immediately. So, download it and address the topic impactfully.
Discounted Free Cash Flow Dcf Technique Data Set Ppt PowerPoint Presentation Gallery Display
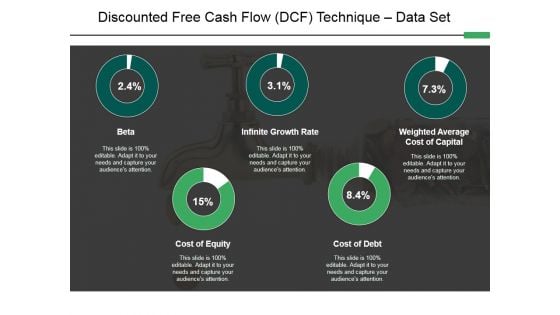
This is a discounted free cash flow dcf technique data set ppt powerpoint presentation gallery display. This is a five stage process. The stages in this process are analysis, finance, donut, business, marketing.
Financial Waterfall Chart For Data Visualization Ppt PowerPoint Presentation Ideas Elements
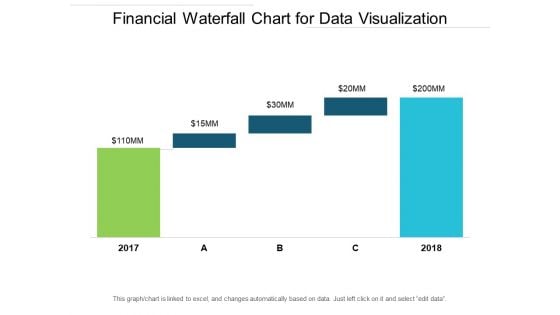
This is a financial waterfall chart for data visualization ppt powerpoint presentation ideas elements. This is a five stage process. The stages in this process are sales waterfall, waterfall chart, business.
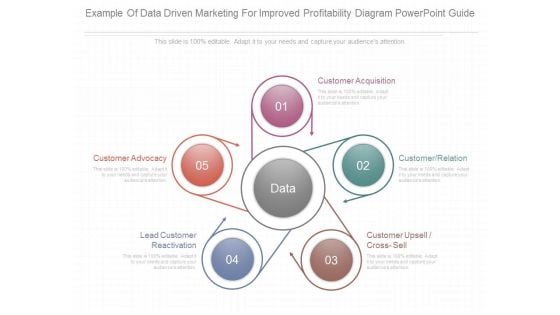
Example Of Data Driven Marketing For Improved Profitability Diagram Powerpoint Guide
This is a example of data driven marketing for improved profitability diagram powerpoint guide. This is a five stage process. The stages in this process are customer acquisition, customer relation, customer upsell cross sell, lead customer reactivation, customer advocacy.
Human Resource Management Functions Icon Depicting Recruitment Infographics PDF
Presenting human resource management functions icon depicting recruitment infographics pdf to dispense important information. This template comprises three stages. It also presents valuable insights into the topics including human resource management functions icon depicting recruitment. This is a completely customizable PowerPoint theme that can be put to use immediately. So, download it and address the topic impactfully.
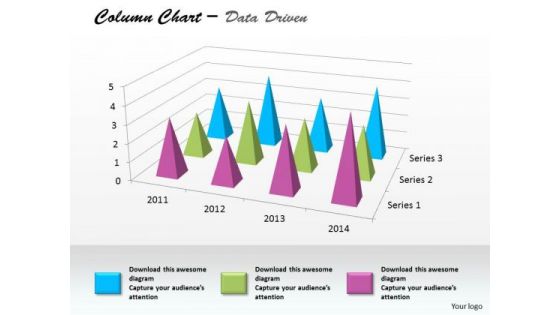
Data Analysis In Excel Column Chart For Business Project PowerPoint Templates
Edit Your Work With Our data analysis in excel column chart for business project Powerpoint Templates . They Will Help You Give The Final Form.
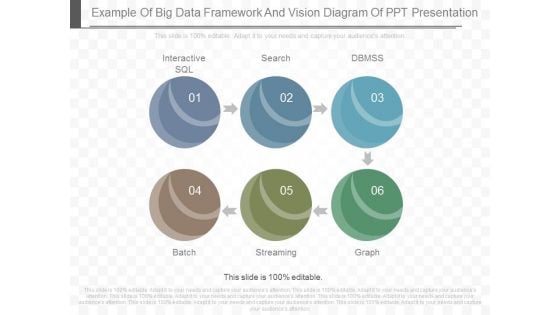
Example Of Big Data Framework And Vision Diagram Of Ppt Presentation
This is a example of big data framework and vision diagram of ppt presentation. This is a six stage process. The stages in this process are interactive sql, search, dbmss, batch, streaming, graph.
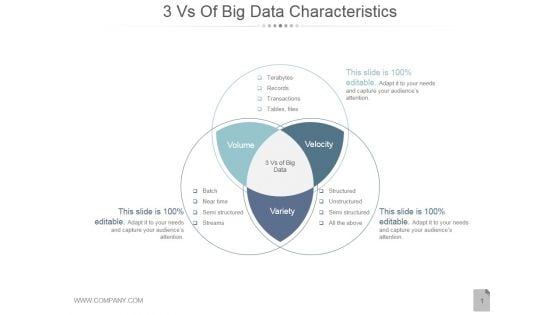
3 Vs Of Big Data Characteristics Ppt PowerPoint Presentation Example File
This is a 3 vs of big data characteristics ppt powerpoint presentation example file. This is a three stage process. The stages in this process are volume, velocity, variety.
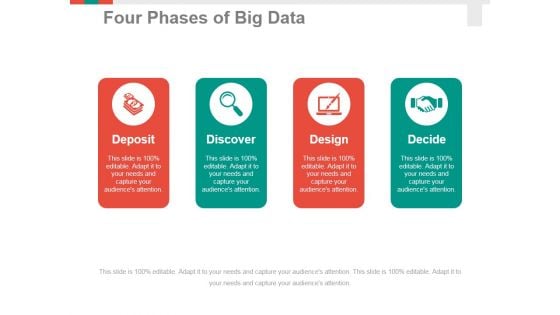
Four Phases Of Big Data Ppt PowerPoint Presentation Professional Format Ideas
This is a four phases of big data ppt powerpoint presentation professional format ideas. This is a four stage process. The stages in this process are deposit, discover, design, decide.
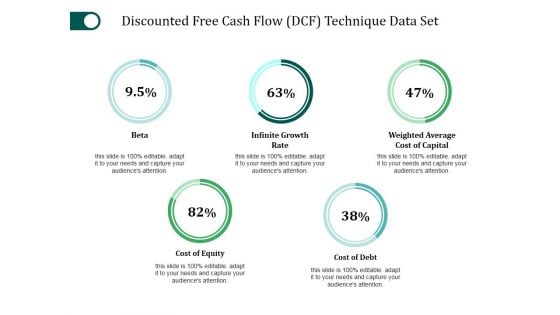
Discounted Free Cash Flow Technique Data Set Ppt PowerPoint Presentation File Summary
This is a discounted free cash flow technique data set ppt powerpoint presentation file summary. This is a five stage process. The stages in this process are beta, infinite growth rate, cost of equity, cost of debt.
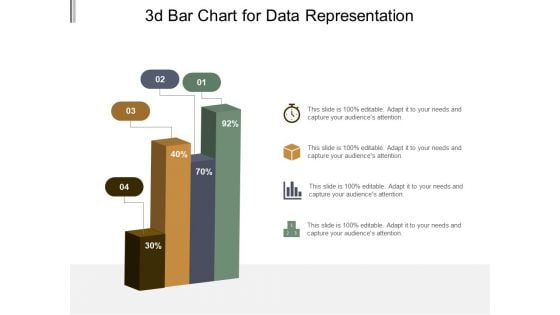
3D Bar Chart For Data Representation Ppt PowerPoint Presentation Model Graphic Tips
This is a 3d bar chart for data representation ppt powerpoint presentation model graphic tips. This is a four stage process. The stages in this process are art, colouring, paint brush.
3D Bar Chart To Display Data Ppt PowerPoint Presentation Icon Design Inspiration
This is a 3d bar chart to display data ppt powerpoint presentation icon design inspiration. This is a four stage process. The stages in this process are art, colouring, paint brush.
3D Chart For Graphical Display Of Data Ppt PowerPoint Presentation Styles Icon
This is a 3d chart for graphical display of data ppt powerpoint presentation styles icon. This is a four stage process. The stages in this process are art, colouring, paint brush.
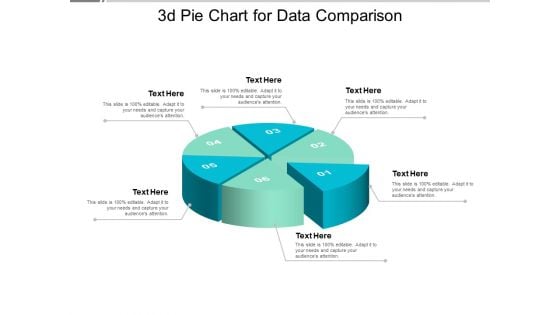
3D Pie Chart For Data Comparison Ppt PowerPoint Presentation Model Design Ideas
This is a 3d pie chart for data comparison ppt powerpoint presentation model design ideas. This is a six stage process. The stages in this process are art, colouring, paint brush.
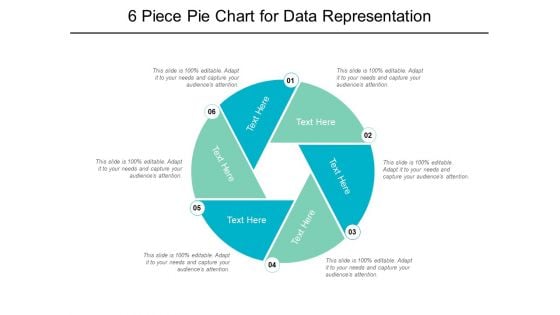
6 Piece Pie Chart For Data Representation Ppt PowerPoint Presentation Professional Brochure
This is a 6 piece pie chart for data representation ppt powerpoint presentation professional brochure. This is a six stage process. The stages in this process are 6 piece pie chart, 6 segment pie chart, 6 parts pie chart.
6 Segments Pie Chart For Data Representation Ppt PowerPoint Presentation Icon Graphics
This is a 6 segments pie chart for data representation ppt powerpoint presentation icon graphics. This is a six stage process. The stages in this process are 6 piece pie chart, 6 segment pie chart, 6 parts pie chart.
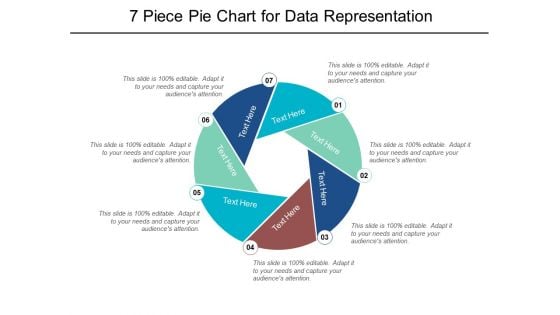
7 Piece Pie Chart For Data Representation Ppt PowerPoint Presentation Portfolio Graphics
This is a 7 piece pie chart for data representation ppt powerpoint presentation portfolio graphics. This is a seven stage process. The stages in this process are 6 piece pie chart, 6 segment pie chart, 6 parts pie chart.
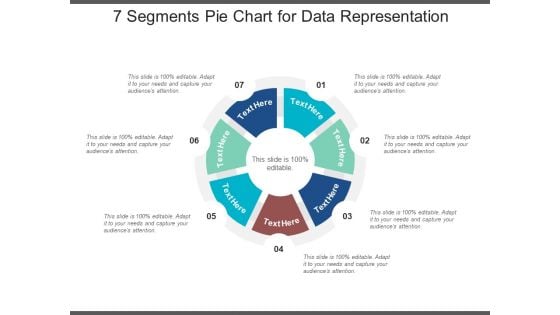
7 Segments Pie Chart For Data Representation Ppt PowerPoint Presentation Styles Summary
This is a 7 segments pie chart for data representation ppt powerpoint presentation styles summary. This is a seven stage process. The stages in this process are 6 piece pie chart, 6 segment pie chart, 6 parts pie chart.
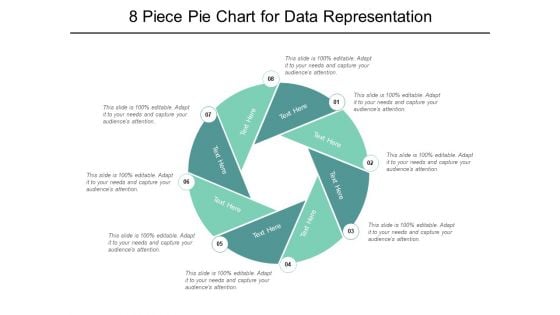
8 Piece Pie Chart For Data Representation Ppt PowerPoint Presentation Ideas
This is a 8 piece pie chart for data representation ppt powerpoint presentation ideas. This is a eight stage process. The stages in this process are 6 piece pie chart, 6 segment pie chart, 6 parts pie chart.
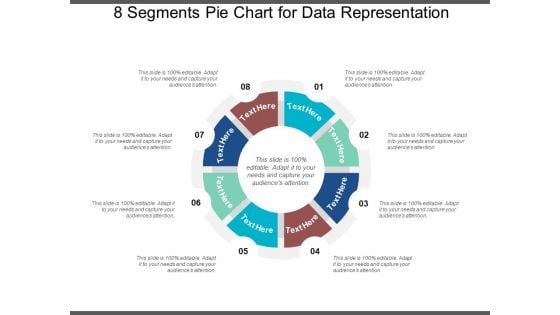
8 Segments Pie Chart For Data Representation Ppt PowerPoint Presentation Infographics Design Templates
This is a 8 segments pie chart for data representation ppt powerpoint presentation infographics design templates. This is a eight stage process. The stages in this process are 6 piece pie chart, 6 segment pie chart, 6 parts pie chart.
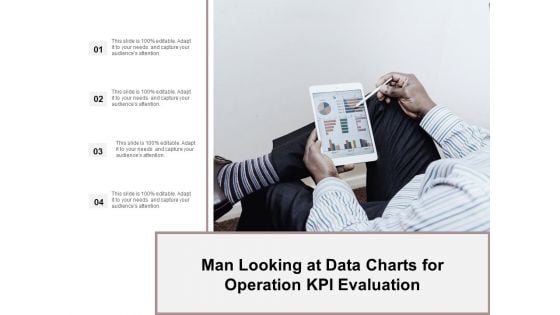
Man Looking At Data Charts For Operation Kpi Evaluation Ppt Powerpoint Presentation Ideas Demonstration
This is a man looking at data charts for operation kpi evaluation ppt powerpoint presentation ideas demonstration. This is a four stage process. The stages in this process are business metrics, business kpi, business dashboard.
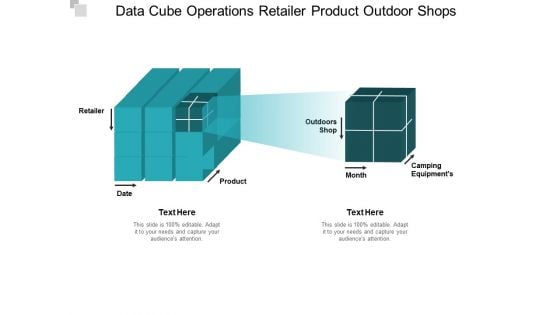
Data Cube Operations Retailer Product Outdoor Shops Ppt PowerPoint Presentation Ideas Skills
This is a data cube operations retailer product outdoor shops ppt powerpoint presentation ideas skills. This is a two stage process. The stages in this process are hierarchy, drill down, top downwards.
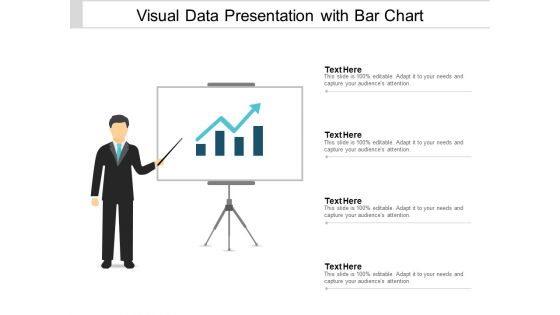
Visual Data Presentation With Bar Chart Ppt PowerPoint Presentation Portfolio Brochure
This is a visual data presentation with bar chart ppt powerpoint presentation portfolio brochure. This is a four stage process. The stages in this process are visual aids, communication, business.
Human Resource Management Analysis And Audit System Icon Infographics PDF
Persuade your audience using this Human Resource Management Analysis And Audit System Icon Infographics PDF. This PPT design covers three sstages, thus making it a great tool to use. It also caters to a variety of topics including Human Resource Management, Analysis And Audit System Icon. Download this PPT design now to present a convincing pitch that not only emphasizes the topic but also showcases your presentation skills.
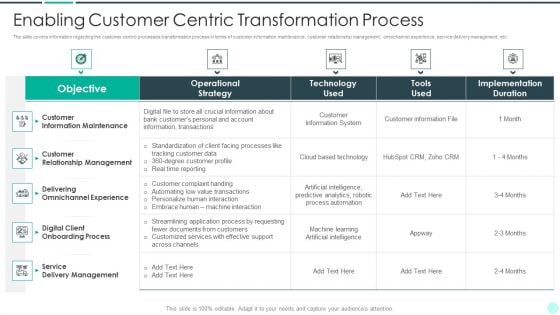
Executing Advance Data Analytics At Workspace Enabling Customer Centric Portrait PDF
The slide covers information regarding the customer centric processes transformation process in terms of customer information maintenance, customer relationship management, omnichannel experience, service delivery management, etc. Deliver an awe inspiring pitch with this creative executing advance data analytics at workspace enabling customer centric portrait pdf bundle. Topics like enabling customer centric transformation process can be discussed with this completely editable template. It is available for immediate download depending on the needs and requirements of the user.
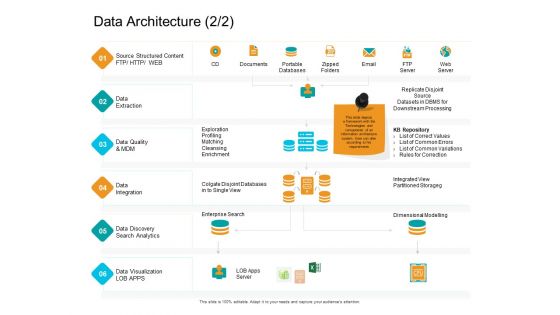
Facts Assessment Data Architecture Analytics Ppt PowerPoint Presentation Professional Templates PDF
Presenting this set of slides with name facts assessment data architecture analytics ppt powerpoint presentation professional templates pdf. This is a one stage process. The stages in this process are data extraction, data quality and mdm, data integration, enterprise search, data discovery search analytics. This is a completely editable PowerPoint presentation and is available for immediate download. Download now and impress your audience.
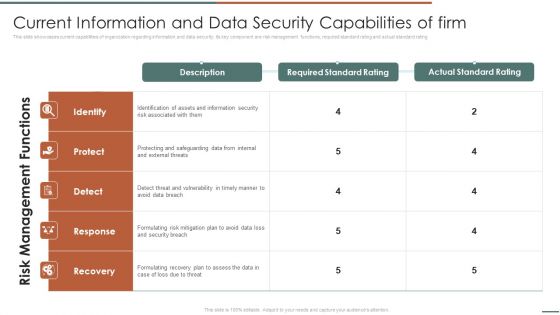
Information Security Risk Evaluation Current Information And Data Security Capabilities Of Firm Introduction PDF
This slide showcases checklist that can help to ensure formulate and implementing data security risk management program in organization. Its key components are activity, assigned to and status.Deliver and pitch your topic in the best possible manner with this Information Security Risk Evaluation Current Information And Data Security Capabilities Of Firm Introduction PDF. Use them to share invaluable insights on Required Standard Rating Actual, Standard Rating and impress your audience. This template can be altered and modified as per your expectations. So, grab it now.
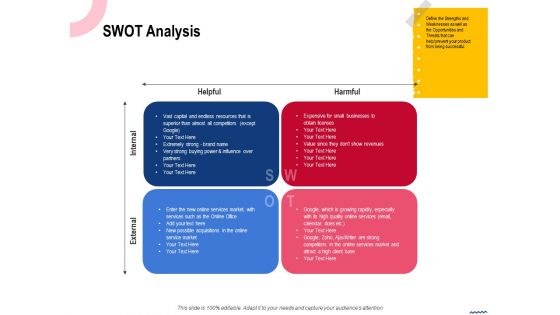
Wireless Phone Information Management Plan Swot Analysis Background PDF
Presenting this set of slides with name wireless phone information management plan swot analysis background pdf. This is a four stage process. The stages in this process are external, internal, helpful, harmful. This is a completely editable PowerPoint presentation and is available for immediate download. Download now and impress your audience.
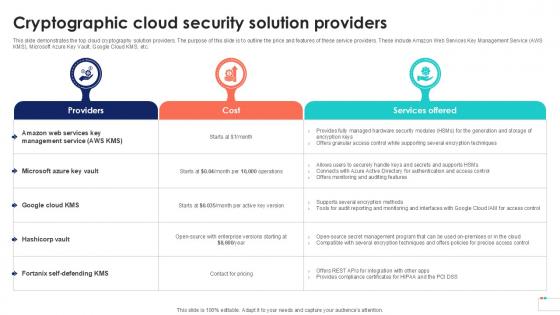
Cryptographic Cloud Security Solution Data Security In Cloud Computing Ppt Template
This slide demonstrates the top cloud cryptography solution providers. The purpose of this slide is to outline the price and features of these service providers. These include Amazon Web Services Key Management Service AWS KMS, Microsoft Azure Key Vault, Google Cloud KMS, etc. Coming up with a presentation necessitates that the majority of the effort goes into the content and the message you intend to convey. The visuals of a PowerPoint presentation can only be effective if it supplements and supports the story that is being told. Keeping this in mind our experts created Cryptographic Cloud Security Solution Data Security In Cloud Computing Ppt Template to reduce the time that goes into designing the presentation. This way, you can concentrate on the message while our designers take care of providing you with the right template for the situation. This slide demonstrates the top cloud cryptography solution providers. The purpose of this slide is to outline the price and features of these service providers. These include Amazon Web Services Key Management Service AWS KMS, Microsoft Azure Key Vault, Google Cloud KMS, etc.

Total Quality Management Implementation Implementing Manufacturing Strategy SS V
The following slide showcases total quality management TQM implementation process to ensure continuous products improvement. It includes elements such as analyzing current production, storage, transportation, production process line etc. Explore a selection of the finest Total Quality Management Implementation Implementing Manufacturing Strategy SS V here. With a plethora of professionally designed and pre-made slide templates, you can quickly and easily find the right one for your upcoming presentation. You can use our Total Quality Management Implementation Implementing Manufacturing Strategy SS V to effectively convey your message to a wider audience. Slidegeeks has done a lot of research before preparing these presentation templates. The content can be personalized and the slides are highly editable. Grab templates today from Slidegeeks. The following slide showcases total quality management TQM implementation process to ensure continuous products improvement. It includes elements such as analyzing current production, storage, transportation, production process line etc.
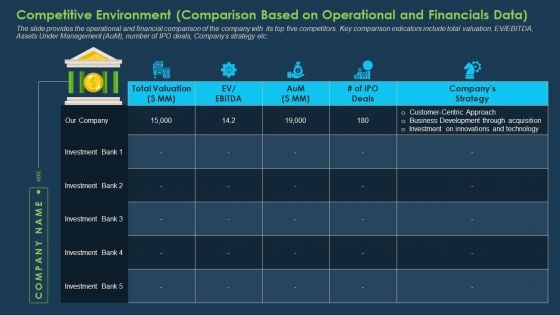
Competitive Environment Comparison Based On Operational And Financials Data Designs PDF
The slide provides the operational and financial comparison of the company with its top five competitors. Key comparison indicators include total valuation, EV or EBITDA, Assets Under Management AuM, number of IPO deals, Companys strategy etc. Deliver and pitch your topic in the best possible manner with this competitive environment comparison based on operational and financials data designs pdf. Use them to share invaluable insights on competitive environment, comparison, operational and financials data and impress your audience. This template can be altered and modified as per your expectations. So, grab it now.


 Continue with Email

 Home
Home


