Data Management
Data Mining Monitoring Dashboard Icon Introduction PDF
Persuade your audience using this data mining monitoring dashboard icon introduction pdf . This PPT design covers four stages, thus making it a great tool to use. It also caters to a variety of topics including data mining monitoring dashboard icon . Download this PPT design now to present a convincing pitch that not only emphasizes the topic but also showcases your presentation skills.
Data Maturity Assessment Chart Icon Demonstration PDF
Persuade your audience using this Data Maturity Assessment Chart Icon Demonstration PDF. This PPT design covers three stages, thus making it a great tool to use. It also caters to a variety of topics including Data Maturity, Assessment Chart Icon. Download this PPT design now to present a convincing pitch that not only emphasizes the topic but also showcases your presentation skills.
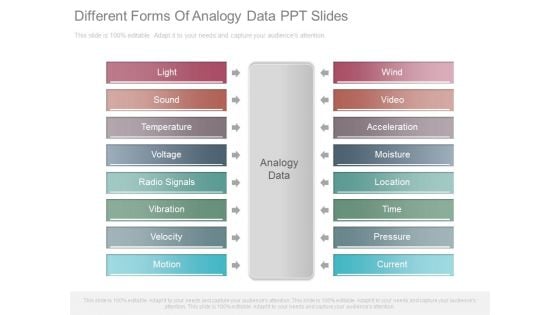
Different Forms Of Analogy Data Ppt Slides
This is a different forms of analogy data ppt slides. This is a eight stage process. The stages in this process are analogy data, light, sound, temperature, voltage, radio signals, vibration, velocity, motion, wind, video, acceleration, moisture, location, time, pressure, current.
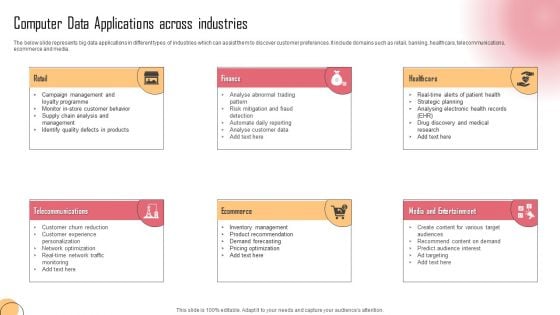
Computer Data Applications Across Industries Ideas PDF
The below slide represents big data applications in different types of industries which can assist them to discover customer preferences. It include domains such as retail, banking, healthcare, telecommunications, ecommerce and media. Persuade your audience using this Computer Data Applications Across Industries Ideas PDF. This PPT design covers six stages, thus making it a great tool to use. It also caters to a variety of topics including Retail, Finance, Healthcare. Download this PPT design now to present a convincing pitch that not only emphasizes the topic but also showcases your presentation skills.
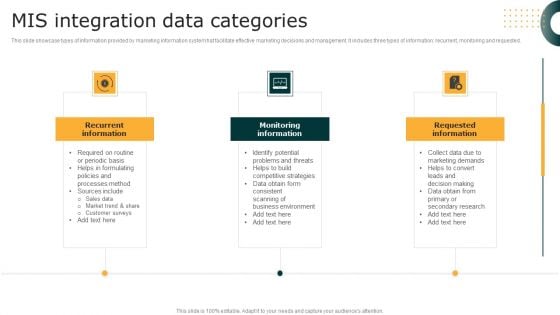
MIS Integration Data Categories Clipart PDF
This slide showcase types of information provided by marketing information system hat facilitate effective marketing decisions and management. It includes three types of information recurrent, monitoring and requested. Persuade your audience using this MIS Integration Data Categories Clipart PDF. This PPT design covers three stages, thus making it a great tool to use. It also caters to a variety of topics including Monitoring Information, Requested Information, Recurrent Information. Download this PPT design now to present a convincing pitch that not only emphasizes the topic but also showcases your presentation skills.
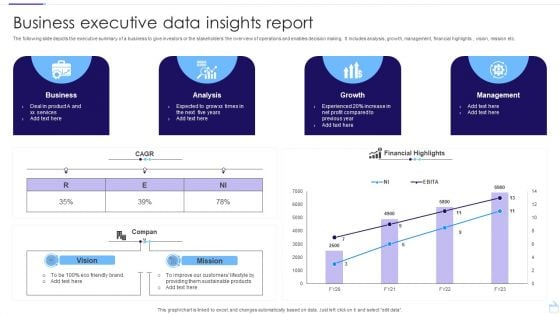
Business Executive Data Insights Report Pictures PDF
The following slide depicts the executive summary of a business to give investors or the stakeholders the overview of operations and enables decision making. It includes analysis, growth, management, financial highlights , vision, mission etc. Pitch your topic with ease and precision using this Business Executive Data Insights Report Pictures PDF. This layout presents information on Business, Analysis, Growth. It is also available for immediate download and adjustment. So, changes can be made in the color, design, graphics or any other component to create a unique layout.
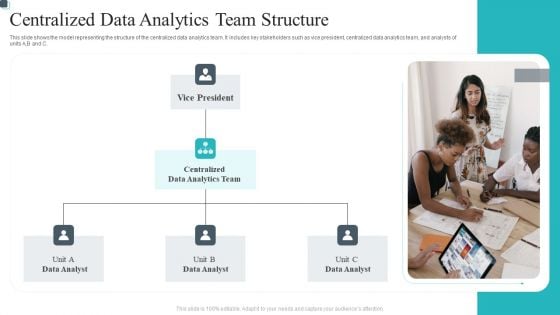
Centralized Data Analytics Team Structure Clipart PDF
This slide shows the model representing the structure of the centralized data analytics team. It includes key stakeholders such as vice president, centralized data analytics team, and analysts of units A,B and C.Persuade your audience using this Centralized Data Analytics Team Structure Clipart PDF. This PPT design coversone stage, thus making it a great tool to use. It also caters to a variety of topics including Vice President, Data Analytics, Analytics Team. Download this PPT design now to present a convincing pitch that not only emphasizes the topic but also showcases your presentation skills.
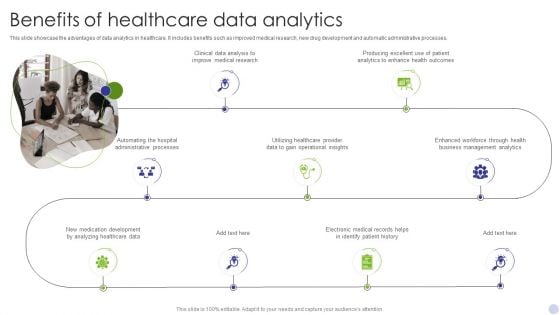
Benefits Of Healthcare Data Analytics Pictures PDF
This slide showcase the advantages of data analytics in healthcare. It includes benefits such as improved medical research, new drug development and automatic administrative processes. Persuade your audience using this Benefits Of Healthcare Data Analytics Pictures PDF. This PPT design covers Ten stages, thus making it a great tool to use. It also caters to a variety of topics including Clinical Data Analysis, Improve Medical Research. Download this PPT design now to present a convincing pitch that not only emphasizes the topic but also showcases your presentation skills.
Data Processing Cloud Services Icon Infographics PDF
Pitch your topic with ease and precision using this Data Processing Cloud Services Icon Infographics PDF. This layout presents information on Security Compliance, Monitor Visibility, Authentication. It is also available for immediate download and adjustment. So, changes can be made in the color, design, graphics or any other component to create a unique layout.
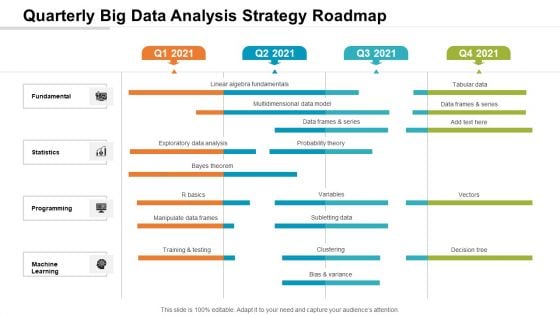
Quarterly Big Data Analysis Strategy Roadmap Infographics
Presenting our jaw-dropping quarterly big data analysis strategy roadmap infographics. You can alternate the color, font size, font type, and shapes of this PPT layout according to your strategic process. This PPT presentation is compatible with Google Slides and is available in both standard screen and widescreen aspect ratios. You can also download this well-researched PowerPoint template design in different formats like PDF, JPG, and PNG. So utilize this visually-appealing design by clicking the download button given below.
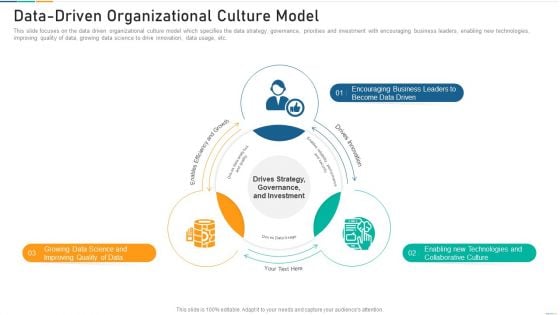
Data Driven Organizational Culture Model Formats PDF
Presenting data driven organizational culture model formats pdf to dispense important information. This template comprises three stages. It also presents valuable insights into the topics including strategy, drives innovation, business. This is a completely customizable PowerPoint theme that can be put to use immediately. So, download it and address the topic impactfully.
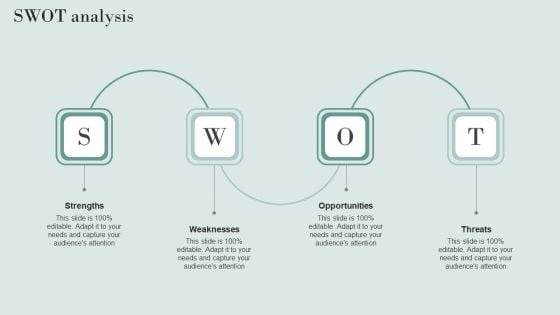
Data Structure IT Swot Analysis Diagrams PDF
Presenting this PowerPoint presentation, titled Data Structure IT Swot Analysis Diagrams PDF, with topics curated by our researchers after extensive research. This editable presentation is available for immediate download and provides attractive features when used. Download now and captivate your audience. Presenting this Data Structure IT Swot Analysis Diagrams PDF. Our researchers have carefully researched and created these slides with all aspects taken into consideration. This is a completely customizable Data Structure IT Swot Analysis Diagrams PDF that is available for immediate downloading. Download now and make an impact on your audience. Highlight the attractive features available with our PPTs.
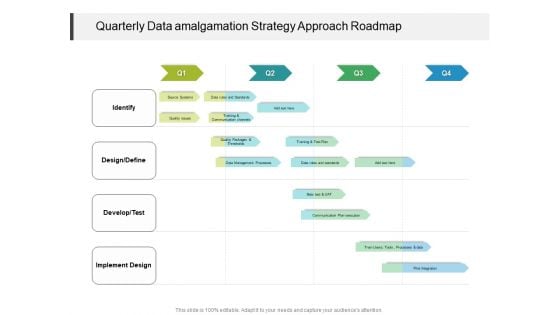
Quarterly Data Amalgamation Strategy Approach Roadmap Themes
Presenting our innovatively structured quarterly data amalgamation strategy approach roadmap themes Template. Showcase your roadmap process in different formats like PDF, PNG, and JPG by clicking the download button below. This PPT design is available in both Standard Screen and Widescreen aspect ratios. It can also be easily personalized and presented with modified font size, font type, color, and shapes to measure your progress in a clear way.
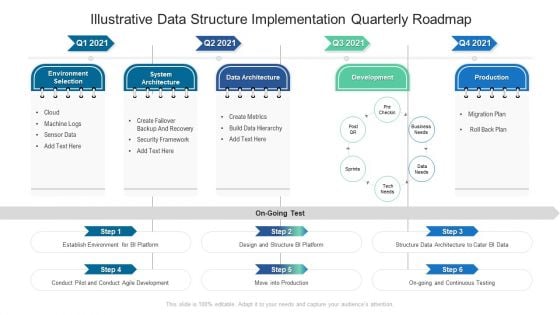
Illustrative Data Structure Implementation Quarterly Roadmap Slides
We present our illustrative data structure implementation quarterly roadmap slides. This PowerPoint layout is easy-to-edit so you can change the font size, font type, color, and shape conveniently. In addition to this, the PowerPoint layout is Google Slides compatible, so you can share it with your audience and give them access to edit it. Therefore, download and save this well-researched illustrative data structure implementation quarterly roadmap slides in different formats like PDF, PNG, and JPG to smoothly execute your business plan.

Financial Data Analysis Sample Diagram Presentation Slide
This is a financial data analysis sample diagram presentation slide. This is a four stage process. The stages in this process are finance, sales and marketing, operations, credit and risk.
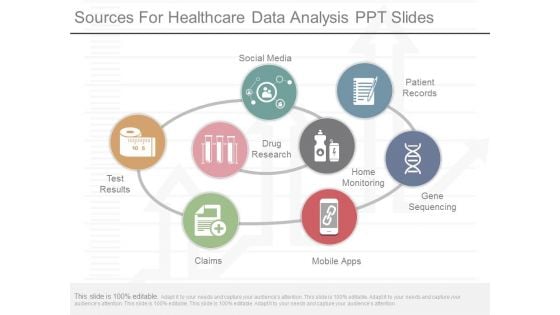
Sources For Healthcare Data Analysis Ppt Slides
This is a sources for healthcare data analysis ppt slides. This is a eight stage process. The stages in this process are social media, drug research, patient records, home monitoring, gene sequencing, mobile apps, claims, test results.
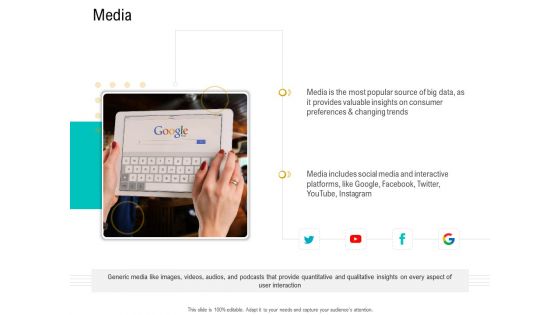
Business Data Analysis Media Themes PDF
This is a business data analysis media themes pdf template with various stages. Focus and dispense information on one stage using this creative set, that comes with editable features. It contains large content boxes to add your information on topics like media is the most popular source of big data, as it provides valuable insights on consumer preferences and changing trends, media includes social media and interactive platforms, like google, facebook, twitter, youtube, instagram. You can also showcase facts, figures, and other relevant content using this PPT layout. Grab it now.
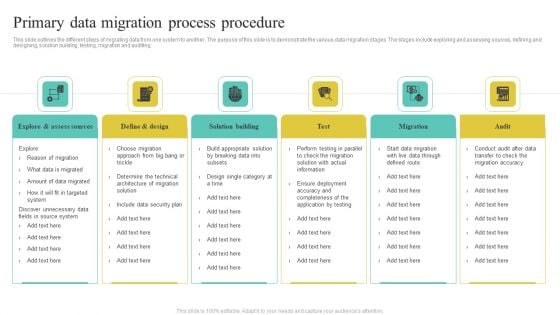
Primary Data Migration Process Procedure Template PDF
This slide outlines the different steps of migrating data from one system to another. The purpose of this slide is to demonstrate the various data migration stages. The stages include exploring and assessing sources, defining and designing, solution building, testing, migration and auditing. Persuade your audience using this On Premise To Cloud Migration Process Procedure Graphics PDF. This PPT design covers Six stages, thus making it a great tool to use. It also caters to a variety of topics including Solution Building, Migration, Assess Sources. Download this PPT design now to present a convincing pitch that not only emphasizes the topic but also showcases your presentation skills.

Ebitda Data Analytics Company Outline Topics PDF
This slide illustrates a graph of EBITDA for Kantar company showing growth trend in from 2021. It also showcases key insights for EBITDA highlighting estimated EBITDA for 2022 and 2023. Present like a pro with Ebitda Data Analytics Company Outline Topics PDF Create beautiful presentations together with your team, using our easy-to-use presentation slides. Share your ideas in real-time and make changes on the fly by downloading our templates. So whether you are in the office, on the go, or in a remote location, you can stay in sync with your team and present your ideas with confidence. With Slidegeeks presentation got a whole lot easier. Grab these presentations today. This slide illustrates a graph of EBITDA for Kantar company showing growth trend in from 2021. It also showcases key insights for EBITDA highlighting estimated EBITDA for 2022 and 2023
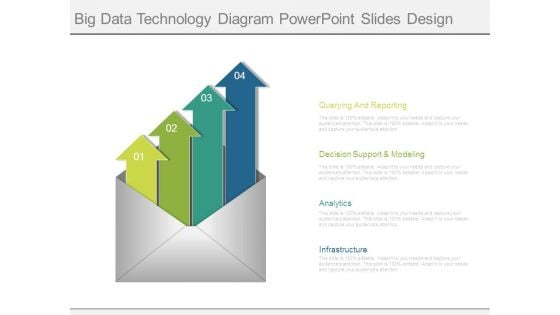
Big Data Technology Diagram Powerpoint Slides Design
This is a big data technology diagram powerpoint slides design. This is a four stage process. The stages in this process are querying and reporting, decision support and modeling, analytics, infrastructure.
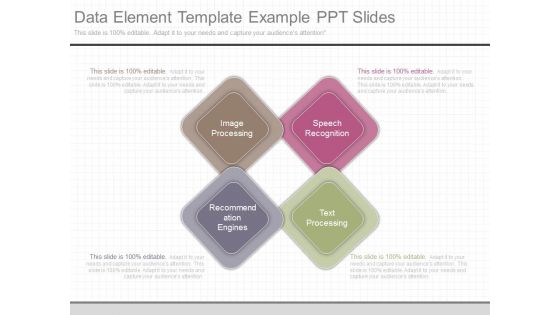
Data Element Template Example Ppt Slides
This is a data element template example ppt slides. This is a four stage process. The stages in this process are image processing, speech recognition, recommendation engines, text processing.
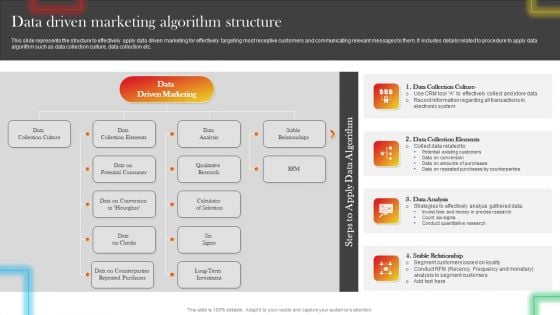
Data Driven Marketing Algorithm Structure Topics PDF
This slide represents the structure to effectively apply data driven marketing for effectively targeting most receptive customers and communicating relevant messages to them. It includes details related to procedure to apply data algorithm such as data collection culture, data collection etc. This Data Driven Marketing Algorithm Structure Topics PDF from Slidegeeks makes it easy to present information on your topic with precision. It provides customization options, so you can make changes to the colors, design, graphics, or any other component to create a unique layout. It is also available for immediate download, so you can begin using it right away. Slidegeeks has done good research to ensure that you have everything you need to make your presentation stand out. Make a name out there for a brilliant performance.
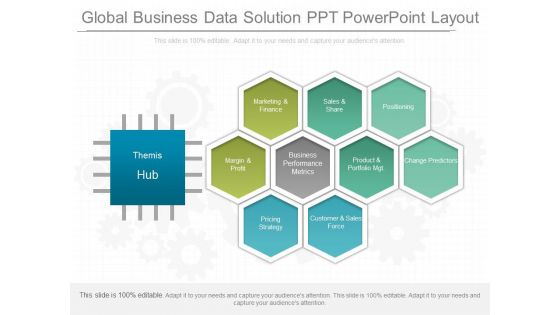
Global Business Data Solution Ppt Powerpoint Layout
This is a global business data solution ppt powerpoint layout. This is a ten stage process. The stages in this process are themis hub, marketing and finance, sales and share, positioning, margin and profit, business performance metrics, product and portfolio mgtchange predictors, pricing strategy, customer and sales force.\n\n\n\n\n\n\n\n\n\n\n\n\n\n\n\n\n\n\n\n
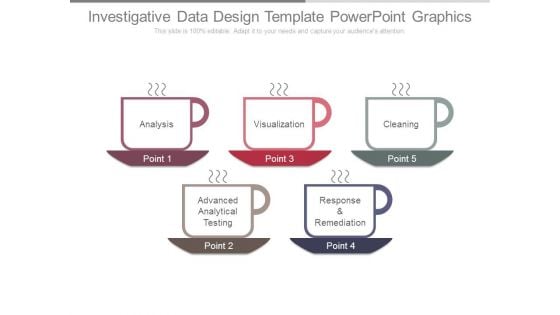
Investigative Data Design Template Powerpoint Graphics
This is a investigative data design template powerpoint graphics. This is a five stage process. The stages in this process are analysis, visualization, cleaning, response and remediation, advanced analytical testing.
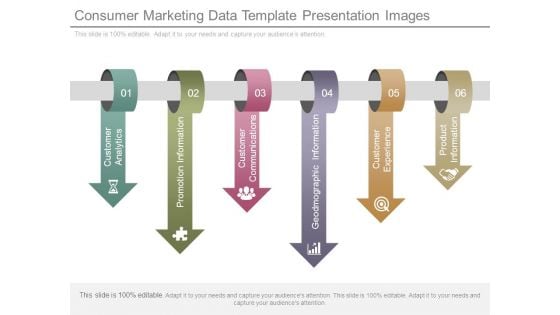
Consumer Marketing Data Template Presentation Images
This is a consumer marketing data template presentation images. This is a six stage process. The stages in this process are customer analytics, promotion information, customer communications, geodmographic information, customer experience, product information.
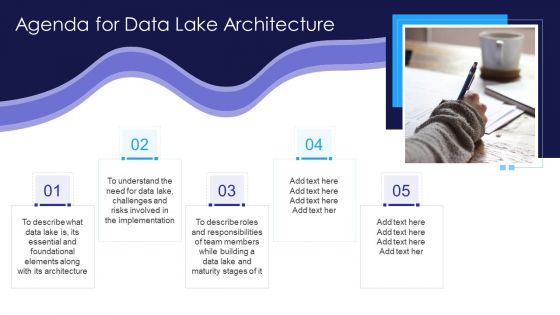
Agenda For Data Lake Architecture Mockup PDF
This is a Agenda For Data Lake Architecture Mockup PDF template with various stages. Focus and dispense information on five stages using this creative set, that comes with editable features. It contains large content boxes to add your information on topics like Data Lake, Elements Along, Risks Involved, Team Member. You can also showcase facts, figures, and other relevant content using this PPT layout. Grab it now.
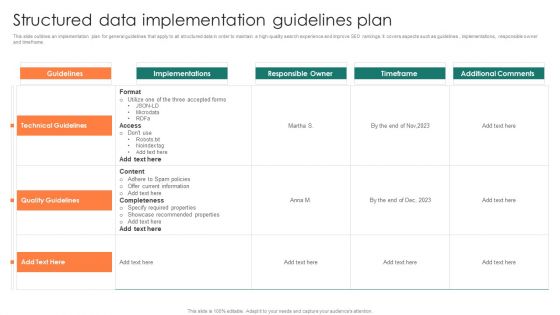
Structured Data Implementation Guidelines Plan Download PDF
This slide outlines an implementation plan for general guidelines that apply to all structured data in order to maintain a high-quality search experience and improve SEO rankings. It covers aspects such as guidelines , implementations, responsible owner and timeframe. Showcasing this set of slides titled Structured Data Implementation Guidelines Plan Download PDF. The topics addressed in these templates are Implementations, Responsible Owner, Timeframe. All the content presented in this PPT design is completely editable. Download it and make adjustments in color, background, font etc. as per your unique business setting.
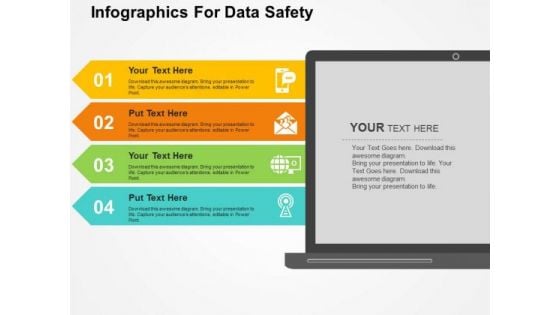
Infographics For Data Safety PowerPoint Templates
Add charm to your presentations with this professional slide of Infographics. Icons displayed in this diagram may be used to depict data safety concept. Illustrate your plans to your listeners with using this slide.
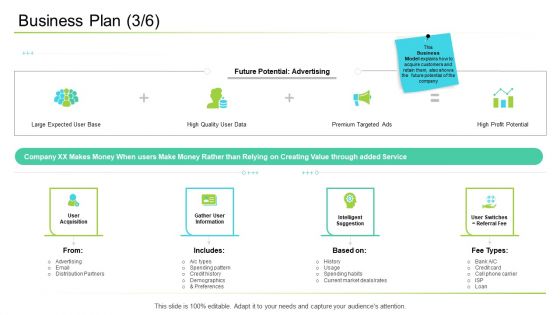
Business Plan Data Ppt Model Inspiration PDF
This is a business plan data ppt model inspiration pdf template with various stages. Focus and dispense information on four stages using this creative set, that comes with editable features. It contains large content boxes to add your information on topics like email, information, demographics, service. You can also showcase facts, figures, and other relevant content using this PPT layout. Grab it now.
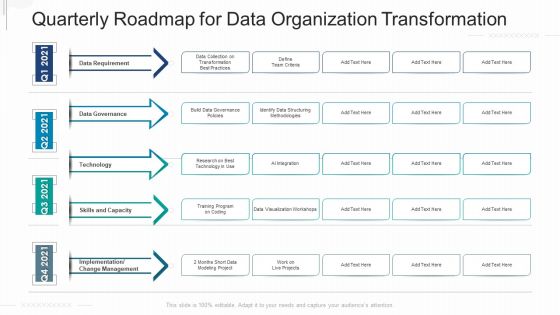
Quarterly Roadmap For Data Organization Transformation Designs
Introducing our quarterly roadmap for data organization transformation designs. This PPT presentation is Google Slides compatible, therefore, you can share it easily with the collaborators for measuring the progress. Also, the presentation is available in both standard screen and widescreen aspect ratios. So edit the template design by modifying the font size, font type, color, and shapes as per your requirements. As this PPT design is fully editable it can be presented in PDF, JPG and PNG formats.
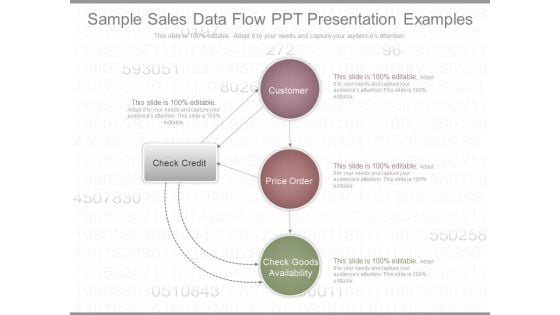
Sample Sales Data Flow Ppt Presentation Examples
This is a sample sales data flow ppt presentation examples. This is a four stage process. The stages in this process are check credit, customer, price order, check goods availability.
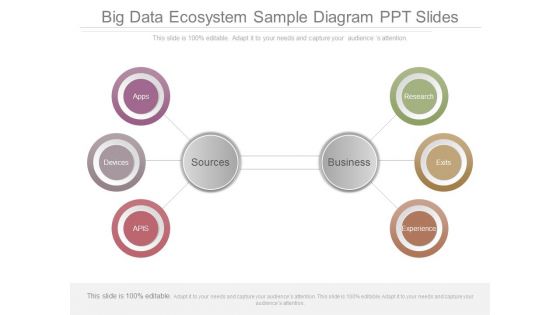
Big Data Ecosystem Sample Diagram Ppt Slides
This is a big data ecosystem sample diagram ppt slides. This is a two stage process. The stages in this process are apps, devices, apis, sources, business, experience, exits, research.

Market Research Data Collection Chart Presentation
This is a market research data collection chart presentation. This is a five stage process. The stages in this process are concept testing, customer satisfaction, pricing research, market segmentation, awareness usage.
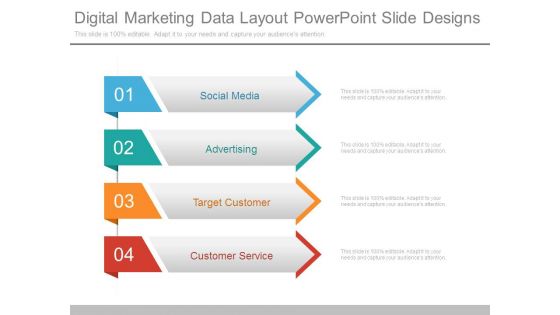
Digital Marketing Data Layout Powerpoint Slide Designs
This is a digital marketing data layout powerpoint slide designs. This is a four stage process. The stages in this process are social media, advertising, target customer, customer service.
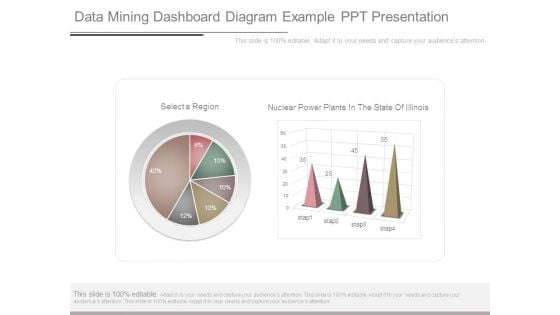
Data Mining Dashboard Diagram Example Ppt Presentation
This is a data mining dashboard diagram example ppt presentation. This is a six stage process. The stages in this process are select a region, nuclear power plants in the state of illinois.
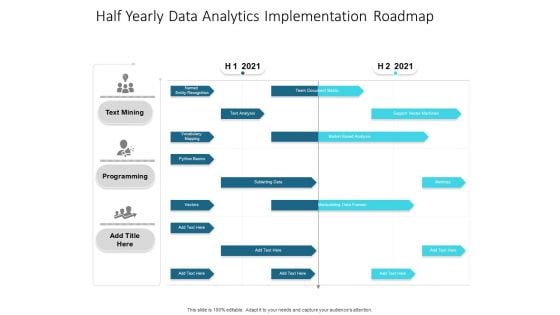
Half Yearly Data Analytics Implementation Roadmap Demonstration
We present our half yearly data analytics implementation roadmap demonstration. This PowerPoint layout is easy-to-edit so you can change the font size, font type, color, and shape conveniently. In addition to this, the PowerPoint layout is Google Slides compatible, so you can share it with your audience and give them access to edit it. Therefore, download and save this well-researched half yearly data analytics implementation roadmap demonstration in different formats like PDF, PNG, and JPG to smoothly execute your business plan.
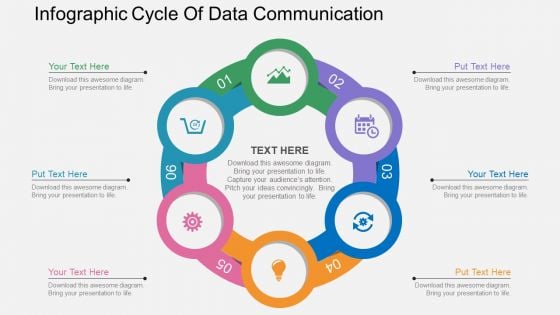
Infographic Cycle Of Data Communication Powerpoint Template
Our above PPT slide contains graphics of circular diagram. This business diagram helps to display outline of business plan. Use this template to impart more clarity to data and to create more sound impact on viewers.
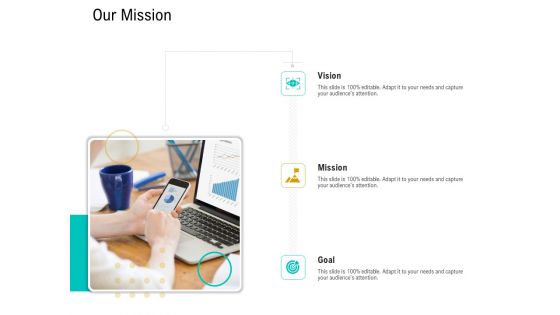
Business Data Analysis Our Mission Inspiration PDF
Presenting business data analysis our mission inspiration pdf to provide visual cues and insights. Share and navigate important information on one stage that need your due attention. This template can be used to pitch topics like vision, mission, goal. In addtion, this PPT design contains high resolution images, graphics, etc, that are easily editable and available for immediate download.
Three Months Data Analysis Procedure Roadmap Icons
We present our three months data analysis procedure roadmap icons. This PowerPoint layout is easy to edit so you can change the font size, font type, color, and shape conveniently. In addition to this, the PowerPoint layout is Google Slides compatible, so you can share it with your audience and give them access to edit it. Therefore, download and save this well researched three months data analysis procedure roadmap icons in different formats like PDF, PNG, and JPG to smoothly execute your business plan.
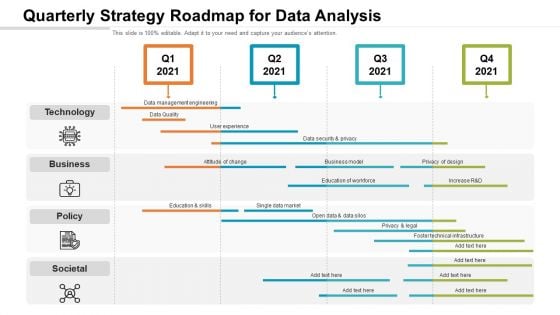
Quarterly Strategy Roadmap For Data Analysis Microsoft
Introducing our quarterly strategy roadmap for data analysis microsoft. This PPT presentation is Google Slides compatible, therefore, you can share it easily with the collaborators for measuring the progress. Also, the presentation is available in both standard screen and widescreen aspect ratios. So edit the template design by modifying the font size, font type, color, and shapes as per your requirements. As this PPT design is fully editable it can be presented in PDF, JPG and PNG formats.

Sold Personal Data Security PowerPoint Template 0910
3d illustration of a red Sold sticker with curled ends stuck to a large orange fingerprint on a red surface Our content is special. Join the revolution with our Sold Personal Data Security PowerPoint Template 0910. You'll always stay ahead of the game.
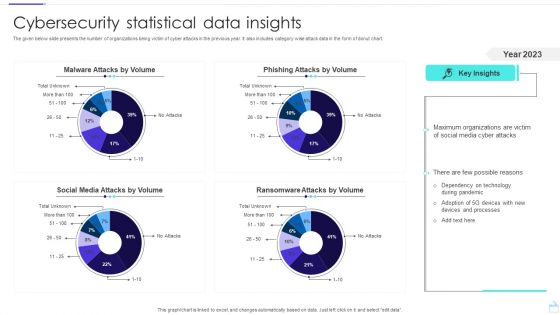
Cybersecurity Statistical Data Insights Sample PDF
The given below slide presents the number of organizations being victim of cyber attacks in the previous year. It also includes category wise attack data in the form of donut chart. Pitch your topic with ease and precision using this Cybersecurity Statistical Data Insights Sample PDF. This layout presents information on Social Media Attacks, Malware Attacks, Phishing Attacks. It is also available for immediate download and adjustment. So, changes can be made in the color, design, graphics or any other component to create a unique layout.
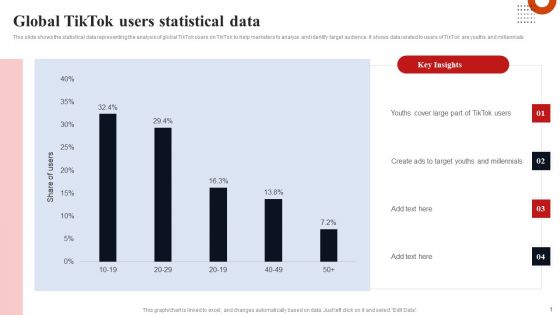
Global Tiktok Users Statistical Data Portrait PDF
This slide shows the statistical data representing the analysis of global TikTok users on TikTok to help marketers to analyze and identify target audience. It shows data related to users of TikTok are youths and millennials. If you are looking for a format to display your unique thoughts, then the professionally designed Global Tiktok Users Statistical Data Portrait PDF is the one for you. You can use it as a Google Slides template or a PowerPoint template. Incorporate impressive visuals, symbols, images, and other charts. Modify or reorganize the text boxes as you desire. Experiment with shade schemes and font pairings. Alter, share or cooperate with other people on your work. Download Global Tiktok Users Statistical Data Portrait PDF and find out how to give a successful presentation. Present a perfect display to your team and make your presentation unforgettable.
E Book Data PowerPoint Icon Cc
Microsoft PowerPoint Template and Background with of a multi colored bar chart sitting on top of a silver digital book reader on a dark reflective surface Our E Book Data PowerPoint Icon Cc will keep the faith. They will show allegiance to your thoughts.
E Book Data PowerPoint Icon F
Microsoft PowerPoint Template and Background with of a multi colored bar chart sitting on top of a silver digital book reader on a dark reflective surface Estabish the key factors of your scheme. Explain the crucial elements with our E Book Data PowerPoint Icon F.
E Book Data PowerPoint Icon R
Microsoft PowerPoint Template and Background with of a multi colored bar chart sitting on top of a silver digital book reader on a dark reflective surface Project your exercise regimen on our E Book Data PowerPoint Icon R. Elaborate on the benefits of each set.
E Book Data PowerPoint Icon C
Microsoft PowerPoint Template and Background with of a multi colored bar chart sitting on top of a silver digital book reader on a dark reflective surface Our E Book Data PowerPoint Icon C have a glossy look. Your thoughts will also acquire a sheen.
E Book Data PowerPoint Icon S
Microsoft PowerPoint Template and Background with of a multi colored bar chart sitting on top of a silver digital book reader on a dark reflective surface Our E Book Data PowerPoint Icon S will elevate the experience. Lift your thoughts to a higher plane.
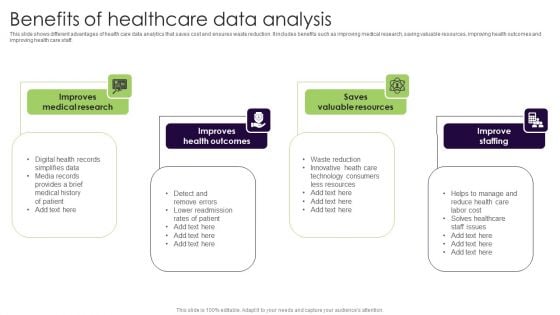
Benefits Of Healthcare Data Analysis Slides PDF
This slide shows different advantages of health care data analytics that saves cost and ensures waste reduction. It includes benefits such as improving medical research, saving valuable resources, improving health outcomes and improving health care staff. Persuade your audience using this Benefits Of Healthcare Data Analysis Slides PDF. This PPT design covers four stages, thus making it a great tool to use. It also caters to a variety of topics including Improves Health Outcomes, Saves Valuable Resources, Improve Staffing. Download this PPT design now to present a convincing pitch that not only emphasizes the topic but also showcases your presentation skills.
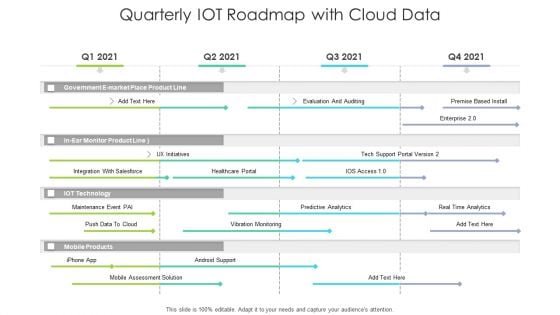
Quarterly IOT Roadmap With Cloud Data Demonstration
We present our quarterly iot roadmap with cloud data demonstration. This PowerPoint layout is easy to edit so you can change the font size, font type, color, and shape conveniently. In addition to this, the PowerPoint layout is Google Slides compatible, so you can share it with your audience and give them access to edit it. Therefore, download and save this well researched quarterly iot roadmap with cloud data demonstration in different formats like PDF, PNG, and JPG to smoothly execute your business plan.
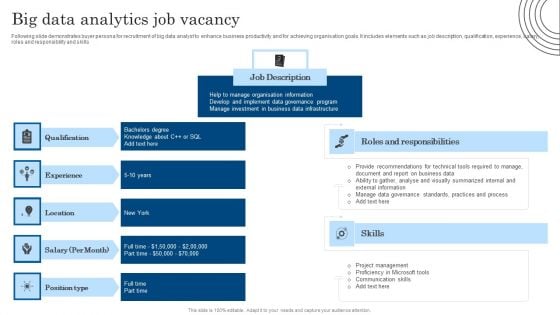
Big Data Analytics Job Vacancy Demonstration PDF
Following slide demonstrates buyer persona for recruitment of big data analyst to enhance business productivity and for achieving organisation goals. It includes elements such as job description, qualification, experience, salary, roles and responsibility and skills. Pitch your topic with ease and precision using this Big Data Analytics Job Vacancy Demonstration PDF. This layout presents information on Location, Information, Internal. It is also available for immediate download and adjustment. So, changes can be made in the color, design, graphics or any other component to create a unique layout.
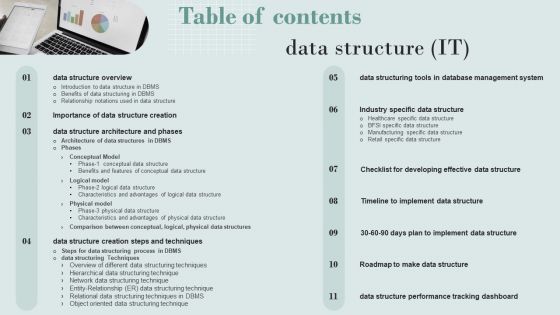
Table Of Contents Data Structure Portrait PDF
Take your projects to the next level with our ultimate collection of Table Of Contents Data Structure Portrait PDF. Slidegeeks has designed a range of layouts that are perfect for representing task or activity duration, keeping track of all your deadlines at a glance. Tailor these designs to your exact needs and give them a truly corporate look with your own brand colors they will make your projects stand out from the rest.
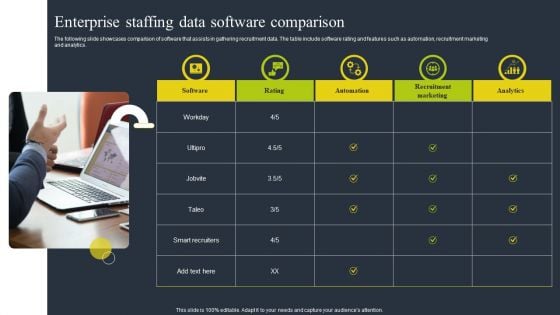
Enterprise Staffing Data Software Comparison Professional PDF
The following slide showcases comparison of software that assists in gathering recruitment data. The table include software rating and features such as automation, recruitment marketing and analytics. Persuade your audience using this Enterprise Staffing Data Software Comparison Professional PDF. This PPT design covers five stages, thus making it a great tool to use. It also caters to a variety of topics including Automation, Recruitment Marketing, Analytics. Download this PPT design now to present a convincing pitch that not only emphasizes the topic but also showcases your presentation skills.
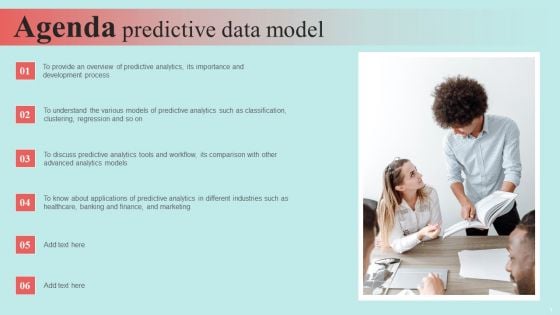
Agenda Predictive Data Model Microsoft PDF
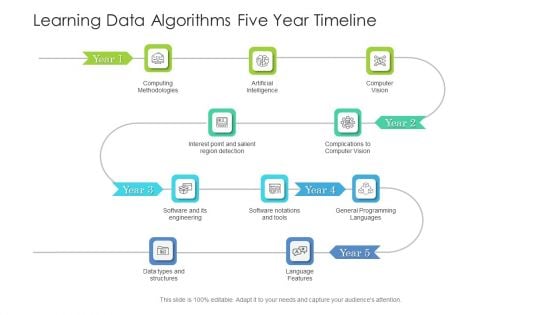
Learning Data Algorithms Five Year Timeline Structure
We present our learning data algorithms five year timeline structure. This PowerPoint layout is easy to edit so you can change the font size, font type, color, and shape conveniently. In addition to this, the PowerPoint layout is Google Slides compatible, so you can share it with your audience and give them access to edit it. Therefore, download and save this well researched learning data algorithms five year timeline structure in different formats like PDF, PNG, and JPG to smoothly execute your business plan.
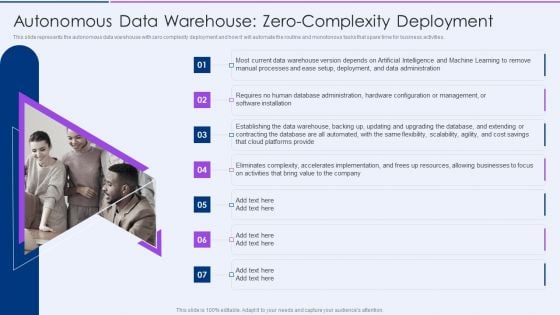
Autonomous Data Warehouse Zerocomplexity Deployment Pictures PDF
This slide represents the autonomous data warehouse with zero complexity deployment and how it will automate the routine and monotonous tasks that spare time for business activities.This is a Autonomous Data Warehouse Zerocomplexity Deployment Pictures PDF template with various stages. Focus and dispense information on seven stages using this creative set, that comes with editable features. It contains large content boxes to add your information on topics like Manual Processes, Software Installation, Platforms Provide. You can also showcase facts, figures, and other relevant content using this PPT layout. Grab it now.
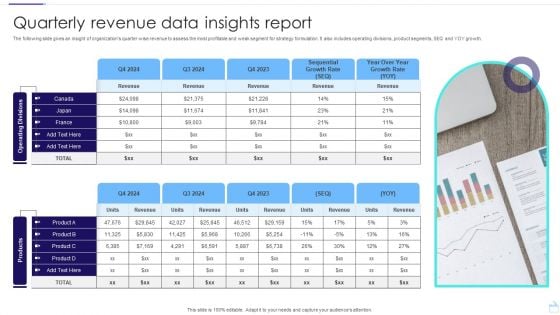
Quarterly Revenue Data Insights Report Template PDF
The following slide gives an insight of organizations quarter wise revenue to assess the most profitable and weak segment for strategy formulation. It also includes operating divisions, product segments, SEQ and YOY growth. Showcasing this set of slides titled Quarterly Revenue Data Insights Report Template PDF. The topics addressed in these templates are Operating, Divisions products, Insights Report. All the content presented in this PPT design is completely editable. Download it and make adjustments in color, background, font etc. as per your unique business setting.
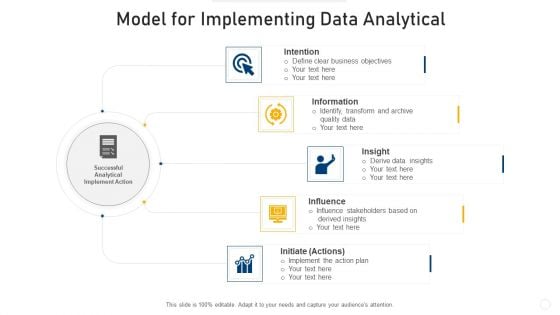
Model For Implementing Data Analytical Infographics PDF
Presenting model for implementing data analytical infographics pdf to dispense important information. This template comprises five stages. It also presents valuable insights into the topics including intention, insight, influence. This is a completely customizable PowerPoint theme that can be put to use immediately. So, download it and address the topic impactfully.
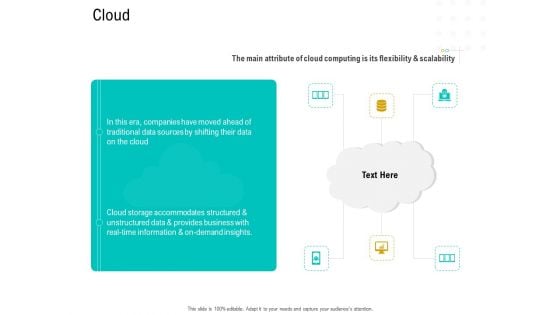
Business Data Analysis Cloud Topics PDF
This is a business data analysis cloud topics pdf template with various stages. Focus and dispense information on six stages using this creative set, that comes with editable features. It contains large content boxes to add your information on topics like Technology. You can also showcase facts, figures, and other relevant content using this PPT layout. Grab it now.
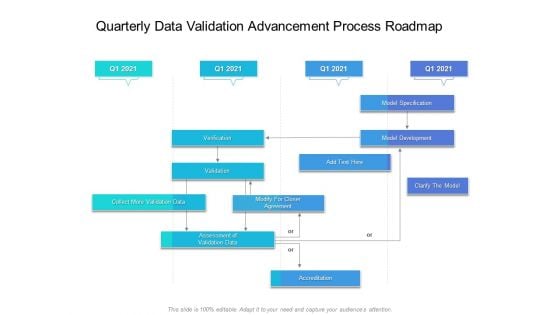
Quarterly Data Validation Advancement Process Roadmap Rules
Presenting our innovatively-structured quarterly data validation advancement process roadmap rules Template. Showcase your roadmap process in different formats like PDF, PNG, and JPG by clicking the download button below. This PPT design is available in both Standard Screen and Widescreen aspect ratios. It can also be easily personalized and presented with modified font size, font type, color, and shapes to measure your progress in a clear way.


 Continue with Email

 Home
Home


