Data Mapping

Busines Diagram Six Staged Vertical Process For Data Presentation Presentation Template
Six staged vertical process flow has been used to design this business diagram. This slide helps to depict business process flow. This slide offers an excellent background to build professional presentations.

Email Security Encryption And Data Loss Prevention Proposal Ppt PowerPoint Presentation Complete Deck With Slides
Induce strategic thinking by presenting this complete deck. Enthrall your audience by deploying this thought-provoking PPT deck. It can be downloaded in both standard and widescreen aspect ratios, thus making it a complete package to use and deploy. Convey your thoughts and actions using the twenty eight slides presented in this complete deck. Additionally, feel free to alter its components like color, graphics, design, etc, to create a great first impression. Grab it now by clicking on the download button below.

Busines Diagram Three Staged Text Boxes For Data Representation Presentation Template
Three staged text boxes are used to design this business diagram. This slide helps to depict business process flow. This slide offers an excellent background to build professional presentations.
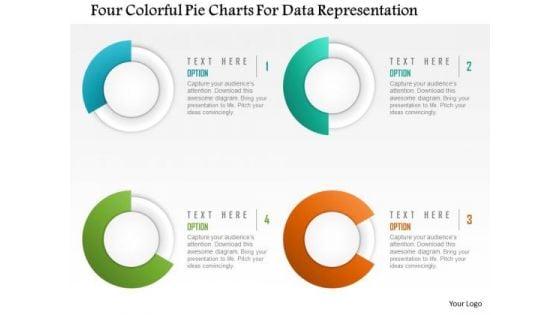
Business Diagram Four Colorful Pie Charts For Data Representation Presentation Template
This diagram is designed with four colorful pie charts. Download this diagram to analyze the key points. This diagram offers a way for your audience to visually conceptualize the process.
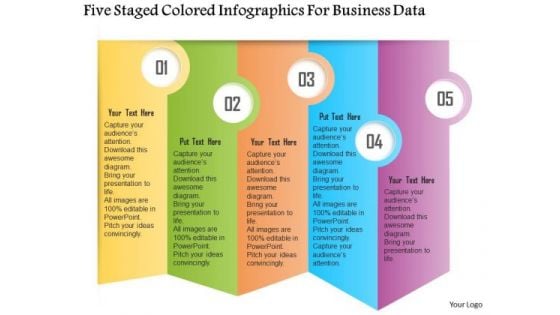
Business Diagram Five Staged Colored Infographics For Business Data Presentation Template
Five staged colored info graphics has been used to design this PowerPoint template. Download our above diagram to express information in a visual way. This diagram offers a way for your audience to visually conceptualize the process.
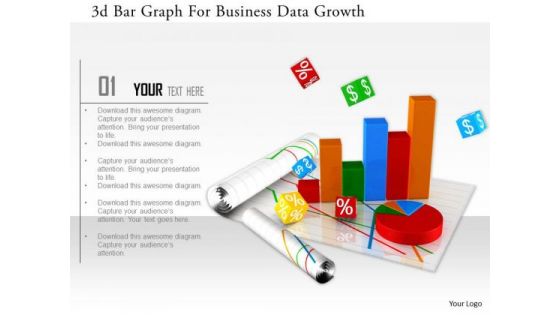
Stock Photo 3d Bar Graph For Business Data Growth Image Graphics For PowerPoint Slide
This image slide has graphics of financial charts and reports. This contains bar graph and pie chart to present business reports. Build an innovative presentations using this professional image slide.
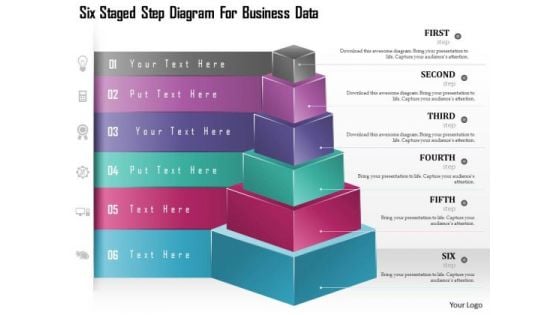
Business Diagram Six Staged Step Diagram For Business Data Presentation Template
Download this diagram to display business development strategies, business plans, decisions, and stages. This Business diagram contains graphics of six steps cubes with icons. Present your views using this innovative slide and be assured of leaving a lasting impression.
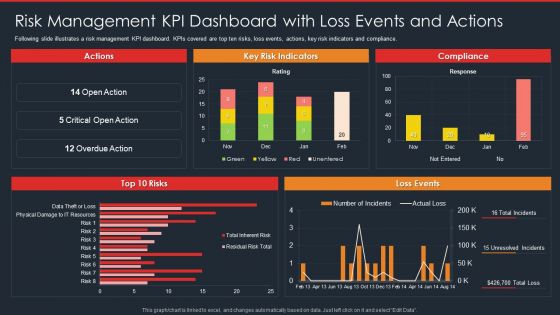
Data Safety Initiatives Risk Management KPI Dashboard With Loss Events And Actions Rules PDF
Following slide illustrates a risk management KPI dashboard. KPIs covered are top ten risks, loss events, actions, key risk indicators and compliance. Deliver an awe inspiring pitch with this creativedata safety initiatives overview of new it policy framework pictures pdf bundle. Topics like actions, key risk indicators, compliance, top 10 risks, loss events can be discussed with this completely editable template. It is available for immediate download depending on the needs and requirements of the user.

Risk Management Model For Data Security Ppt PowerPoint Presentation Complete Deck With Slides

Employee Data Management Portal Capital Funding Elevator Pitch Deck Ppt PowerPoint Presentation Complete With Slides
Induce strategic thinking by presenting this complete deck. Enthrall your audience by deploying this thought provoking PPT deck. It can be downloaded in both standard and widescreen aspect ratios, thus making it a complete package to use and deploy. Convey your thoughts and actions using the thirty two slides presented in this complete deck. Additionally, feel free to alter its components like color, graphics, design, etc, to create a great first impression. Grab it now by clicking on the download button below.
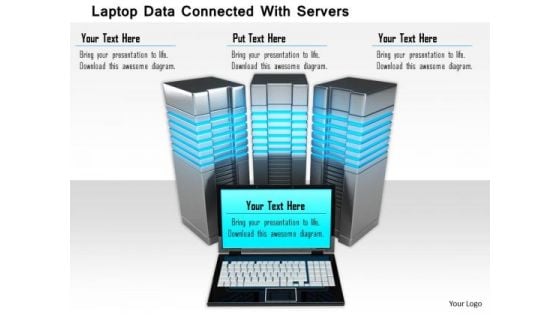
Stock Photo Laptop Data Connected With Servers Image Graphics For PowerPoint Slide
This image slide displays laptops with computer servers. This image slide may be used in your presentations to express views on client server computing and network. This image will make your presentations outshine.
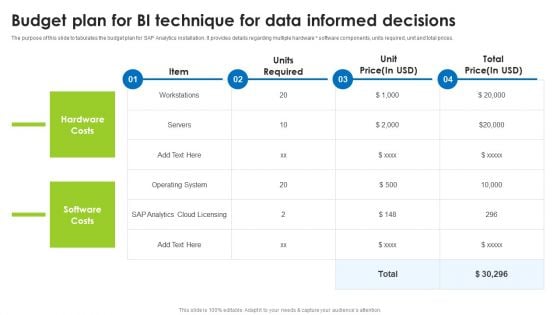
Budget Plan For BI Technique For Data Informed Decisions Clipart PDF
The purpose of this slide to tabulates the budget plan for SAP Analytics installation. It provides details regarding multiple hardware software components, units required, unit and total prices. Explore a selection of the finest Sap Analytics Cloud Dashboard For Income Analysis And Forecasting Formats PDF here. With a plethora of professionally designed and pre made slide templates, you can quickly and easily find the right one for your upcoming presentation. You can use our Sap Analytics Cloud Dashboard For Income Analysis And Forecasting Formats PDF to effectively convey your message to a wider audience. Slidegeeks has done a lot of research before preparing these presentation templates. The content can be personalized and the slides are highly editable. Grab templates today from Slidegeeks.
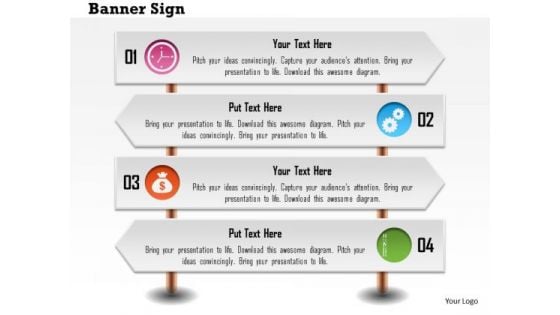
Business Diagram Four Banner Style Text Boxes For Data Representation Presentation Template
This business slide displays four banner style text boxes It contains graphic of text boxes with four steps. Use this diagram, in your presentations to express views on process, steps, stages, progress, targets, goals, success and achievements. Give professional appearance to your presentations using this business slide.
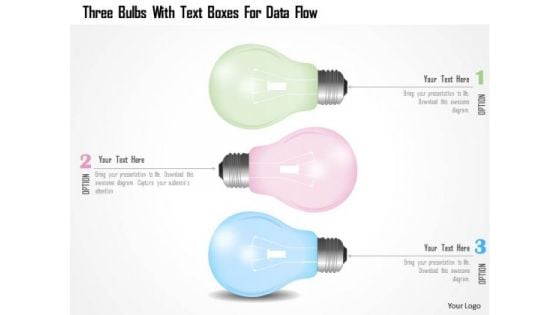
Business Diagram Three Bulbs With Text Boxes For Data Flow PowerPoint Template
This power point template has been designed with graphic of three bulbs and text boxes. These text boxes are used to show the text and data. Display your business and marketing related text in any presentation with this exclusive PPT.
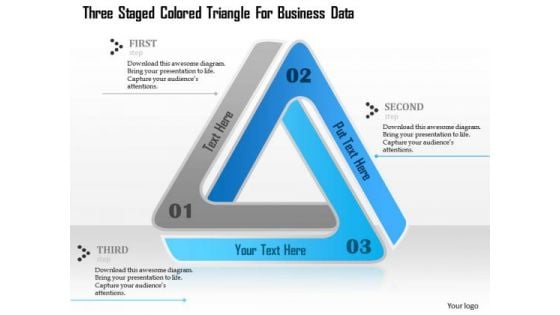
Business Diagram Three Staged Colored Triangle For Business Data Presentation Template
Three staged blue colored triangle has been used to design this business diagram. This slide contains triangle diagram to depict process flow. Use this PPT slide for your business and marketing presentations

Business Diagram Smiley With Check Box And Pencil For Data Representation Presentation Template
This business diagram has been designed with smiley with check box and pencil. Download this diagram to analyze the key points. This diagram offers a way for your audience to visually conceptualize the process.
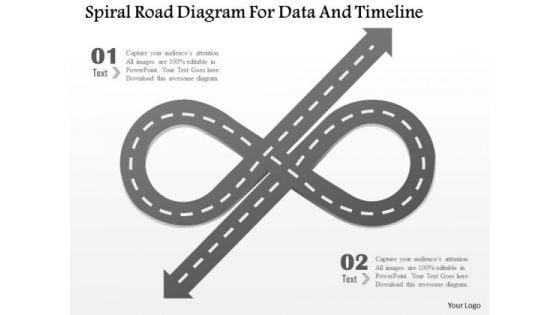
Business Diagram Spiral Road Diagram For Data And Timeline Presentation Template
this power point template slide has been designed with graphic of spiral road diagram. This diagram can be used for timeline and business process flow related topics. Use this PPT slide in your business and marketing related presentations.
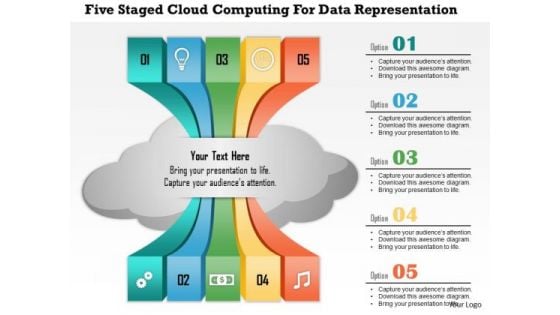
Business Diagram Five Staged Cloud Computing For Data Representation Presentation Template
Our above slide displays five steps with cloud icon. Download our above diagram to express information in a visual way. This diagram offers a way for your audience to visually conceptualize the process.

Utilizing Agile Methodology In Data Transformation Project IT Ppt PowerPoint Presentation Complete With Slides
Induce strategic thinking by presenting this complete deck. Enthrall your audience by deploying this thought provoking PPT deck. It can be downloaded in both standard and widescreen aspect ratios, thus making it a complete package to use and deploy. Convey your thoughts and actions using the fifty two slides presented in this complete deck. Additionally, feel free to alter its components like color, graphics, design, etc, to create a great first impression. Grab it now by clicking on the download button below.
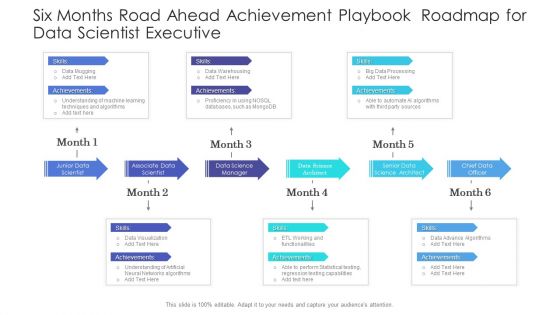
Six Months Road Ahead Achievement Playbook Roadmap For Data Scientist Executive Download
Presenting the Six Months Project Manager Road Ahead Achievement Playbook Roadmap Diagrams. The template includes a roadmap that can be used to initiate a strategic plan. Not only this, the PowerPoint slideshow is completely editable and you can effortlessly modify the font size, font type, and shapes according to your needs. This PPT slide can be easily reached in standard screen and widescreen aspect ratios. The set is also available in various formats like PDF, PNG, and JPG. So download and use it multiple times as per your knowledge.
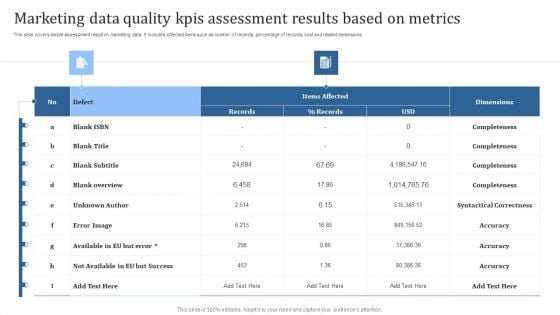
Marketing Data Quality Kpis Assessment Results Based On Metrics Summary PDF
This slide covers simple assessment result on marketing data. It includes affected items such as number of records, percentage of records, cost and related dimensions. Showcasing this set of slides titled Error Image, Unknown Author, Blank Overview. The topics addressed in these templates are Error Image, Unknown Author, Blank Overview. All the content presented in this PPT design is completely editable. Download it and make adjustments in color, background, font etc. as per your unique business setting.
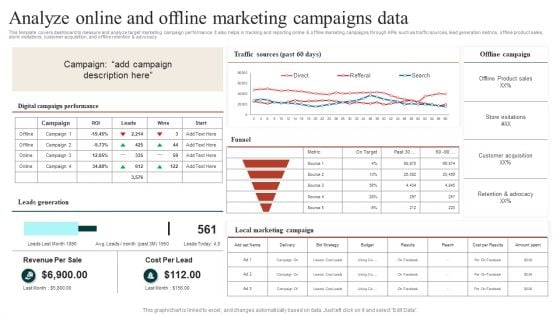
Target Marketing Techniques Analyze Online And Offline Marketing Campaigns Data Ideas PDF
This template covers dashboard to measure and analyze target marketing campaign performance. It also helps in tracking and reporting online and offline marketing campaigns through KPIs such as traffic sources, lead generation metrics, offline product sales, store visitations, customer acquisition, and offline retention and advocacy Find a pre designed and impeccable Target Marketing Techniques Evaluating Growth Rate For Target Marketing Slides PDF. The templates can ace your presentation without additional effort. You can download these easy to edit presentation templates to make your presentation stand out from others. So, what are you waiting for Download the template from Slidegeeks today and give a unique touch to your presentation.
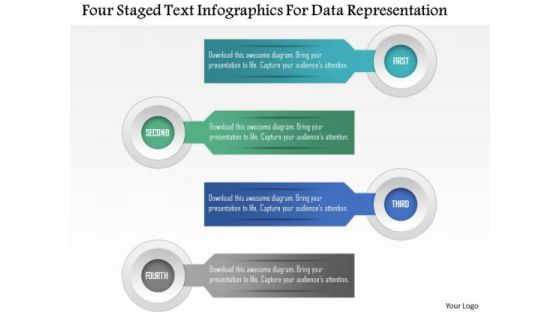
Business Diagram Four Staged Text Infographics For Data Representation Presentation Template
Four staged info graphics has been used to design this PowerPoint template. This slide can be used for text representation. Present your views using this innovative slide and be assured of leaving a lasting impression.
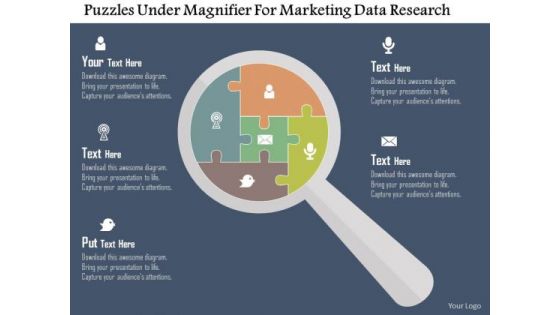
Business Diagram Puzzles Under Magnifier For Marketing Data Research Presentation Template
Our above business slide displays magnifying glass over puzzles. You may use this diagram for presentations on market research. Grab the attention of your listeners with this professional slide.
Business Diagram Four Staged Linear Text Boxes For Data Representation Presentation Template
This business diagram displays four staged linear text boxes. This diagram is suitable to depict flow of business activities or steps. Download this professional slide to present information in an attractive manner
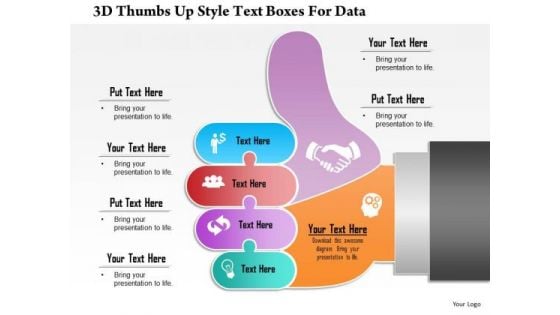
Business Diagram 3d Thumbs Up Style Text Boxes For Data Presentation Template
This Power Point diagram has been crafted with graphic of text boxes with icons. It contains diagram of thumb up hand graphics with communication icons. Use this diagram to build professional presentation for your viewers.
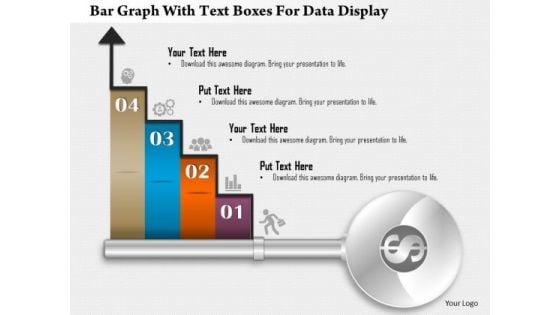
Business Diagram Bar Graph With Text Boxes For Data Display Presentation Template
Our above business diagram displays bar graph. It contains four steps on bar graph with icons. Use this diagram to display four stages of business growth. Download this Power Point slide to build quality presentation for your viewers.
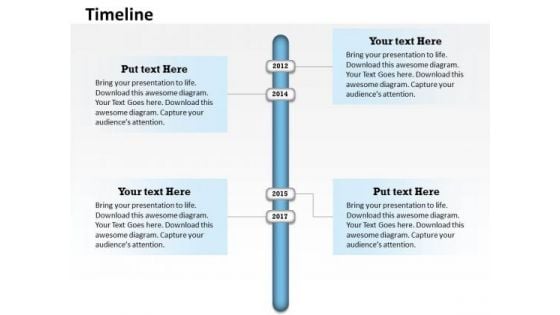
Business Finance Strategy Development Annual Data On Timeline Roadmap Diagram Marketing Diagram
Be The Doer With Our Business Diagram See Business Timeline Roadmap Diagram Strategy Diagram Powerpoint Templates. Put Your Thoughts Into Practice.
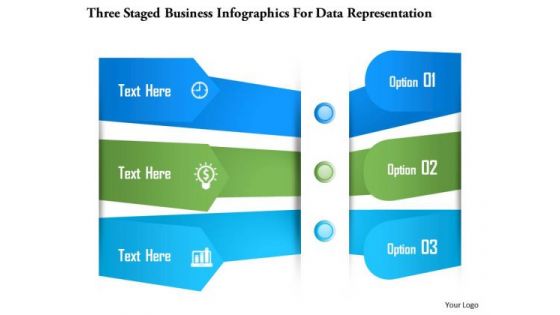
Business Diagram Three Staged Business Infographics For Data Representation Presentation Template
Three staged info graphics has been used to design this PowerPoint template. This slide can be used for text representation. Present your views using this innovative slide and be assured of leaving a lasting impression.
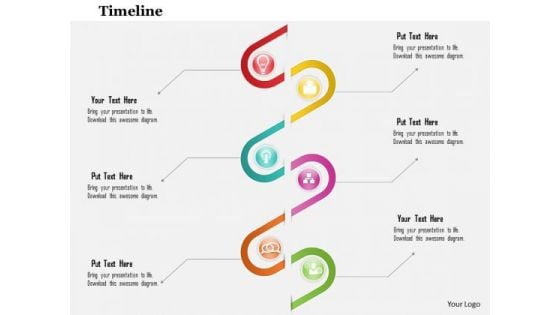
Business Diagram Six Staged Spiral Diagram For Data Flow Presentation Template
This business slide depicts six staged spiral diagram. This diagram provides an effective way of displaying information you can edit text, color, shade and style as per you need. Present your views using this innovative slide and be assured of leaving a lasting impression.
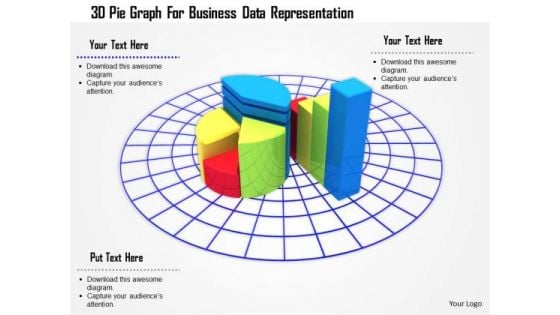
Stock Photo 3d Pie Graph For Business Data Representation PowerPoint Slide
3D business graph has been used to design this PowerPoint template. This Image slide is suitable to make business reports and charts. This slide can be used for business and marketing presentations.
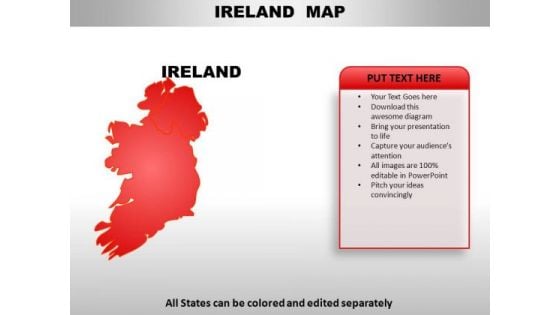
Israel Within Boundaries And Ceas Fire Lines PowerPoint Maps
Israel Within Boundaries And Ceas Fire Lines Country Powerpoint Maps-These high quality, editable powerpoint country maps have been carefully created by our professional team to display location and other geographic details in your PowerPoint presentation. Each map is vector based and is 100% editable in powerpoint. Each and every property of any region - color, size, shading etc can be modified to help you build an effective powerpoint presentation. Use these maps to show sales territories, business and new office locations, travel planning etc in your presentations. Any text can be entered at any point in the powerpoint map slide. Simply DOWNLOAD, TYPE and PRESENT! Be absolutely professional with our Israel Within Boundaries And Ceas Fire Lines PowerPoint Maps. Dont pass up this opportunity to shine.

Country PowerPoint Maps Israel Within Boundaries And Ceas Fire Lines
Israel Within Boundaries And Ceas Fire Lines Country Powerpoint Maps-These high quality, editable powerpoint country maps have been carefully created by our professional team to display location and other geographic details in your PowerPoint presentation. Each map is vector based and is 100% editable in powerpoint. Each and every property of any region - color, size, shading etc can be modified to help you build an effective powerpoint presentation. Use these maps to show sales territories, business and new office locations, travel planning etc in your presentations. Any text can be entered at any point in the powerpoint map slide. Simply DOWNLOAD, TYPE and PRESENT! Our Country PowerPoint Maps Israel Within Boundaries And Ceas Fire Lines make it a cakewalk. You will dominate the event with authority.
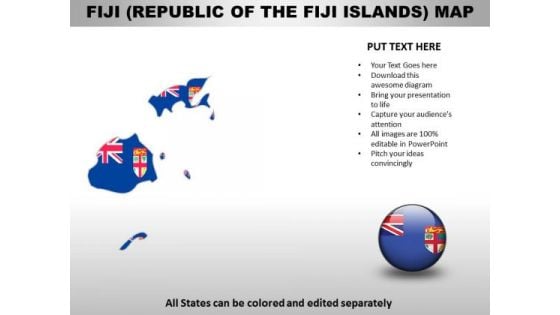
Country PowerPoint Maps Republic Of The Fiji Island
Republic of The Fiji Island Country Powerpoint Maps-These high quality, editable powerpoint country maps have been carefully created by our professional team to display location and other geographic details in your PowerPoint presentation. Each map is vector based and is 100% editable in powerpoint. Each and every property of any region - color, size, shading etc can be modified to help you build an effective powerpoint presentation. Use these maps to show sales territories, business and new office locations, travel planning etc in your presentations. Any text can be entered at any point in the powerpoint map slide. Simply DOWNLOAD, TYPE and PRESENT! Extend your reach in your career with our Country PowerPoint Maps Republic Of The Fiji Island. You will come out on top.
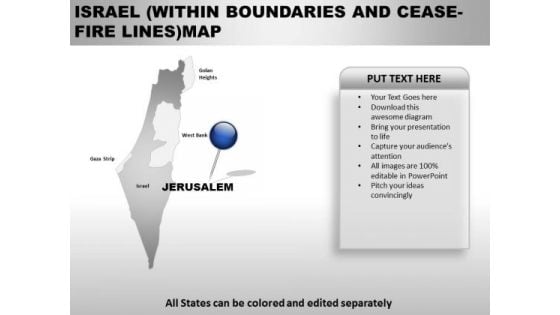
Israel Within Boundaries And Ceas Fire Lines Country PowerPoint Maps
Israel Within Boundaries And Ceas Fire Lines Country Powerpoint Maps-These high quality, editable powerpoint country maps have been carefully created by our professional team to display location and other geographic details in your PowerPoint presentation. Each map is vector based and is 100% editable in powerpoint. Each and every property of any region - color, size, shading etc can be modified to help you build an effective powerpoint presentation. Use these maps to show sales territories, business and new office locations, travel planning etc in your presentations. Any text can be entered at any point in the powerpoint map slide. Simply DOWNLOAD, TYPE and PRESENT! Hit the ground running with our Israel Within Boundaries And Ceas Fire Lines Country PowerPoint Maps. Your thoughts will get upto speed in a jiffy.

Republic Of The Fiji Island Country PowerPoint Maps
Republic of The Fiji Island Country Powerpoint Maps-These high quality, editable powerpoint country maps have been carefully created by our professional team to display location and other geographic details in your PowerPoint presentation. Each map is vector based and is 100% editable in powerpoint. Each and every property of any region - color, size, shading etc can be modified to help you build an effective powerpoint presentation. Use these maps to show sales territories, business and new office locations, travel planning etc in your presentations. Any text can be entered at any point in the powerpoint map slide. Simply DOWNLOAD, TYPE and PRESENT! You have been given an exacting task. Plan your approach with our Republic Of The Fiji Island Country PowerPoint Maps.
Republic Of Turkey And States Maps Template PowerPoint
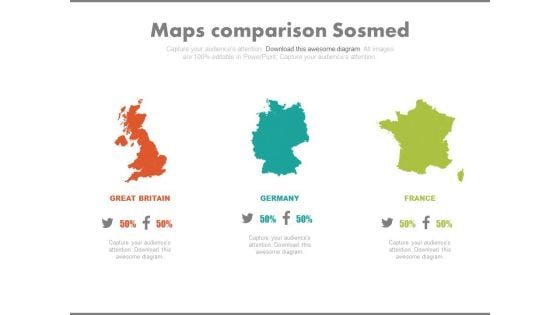
Maps For Great Britain Germany And France Powerpoint Slides
This PowerPoint template displays maps of Great Britain, Germany and France. This Map template can be used for countries comparison. This slide can also be used by school students for educational projects.
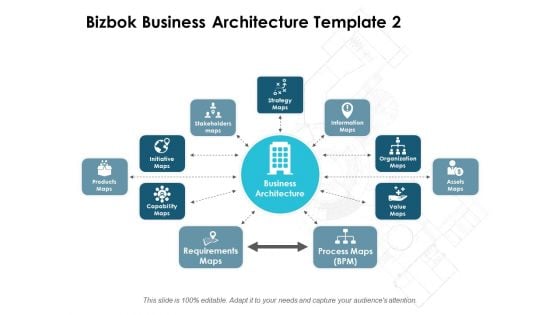
Bizbok Business Architecture Strategy Maps Ppt PowerPoint Presentation Layouts Rules
This is a bizbok business architecture strategy maps ppt powerpoint presentation layouts rules. This is a eight stage process. The stages in this process are assets maps, information maps, organization maps, strategy maps, stakeholders maps.
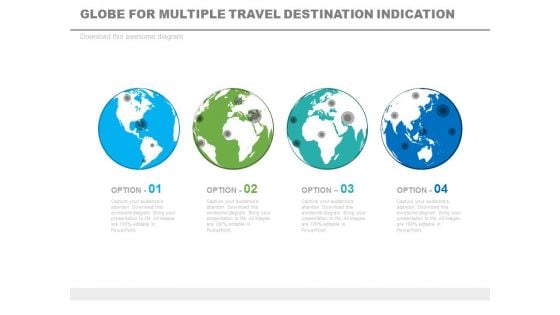
Four Globes For Different Location Maps Powerpoint Slides
This PowerPoint template displays graphics of four globes with different location maps. This Map template can be used in business presentations to depict organization?s existence in different parts of the world. This slide can also be used by school students for educational projects.
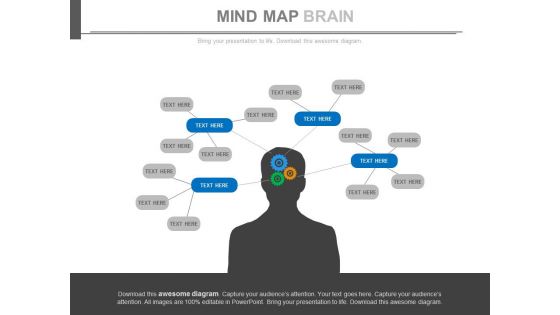
Mind Maps To Define Ideas And Agendas Powerpoint Slides
This PowerPoint template contains graphics of human brain with text tags. This mind map template can present monotonous information into a colorful, memorable and highly organized manner. Use this slide to define ideas and agendas.
Application Mappings In Powerpoint And Google Slides Cpb
Presenting our innovatively-designed set of slides titled Application Mappings In Powerpoint And Google Slides Cpb. This completely editable PowerPoint graphic exhibits Application Mappings that will help you convey the message impactfully. It can be accessed with Google Slides and is available in both standard screen and widescreen aspect ratios. Apart from this, you can download this well-structured PowerPoint template design in different formats like PDF, JPG, and PNG. So, click the download button now to gain full access to this PPT design. Our Application Mappings In Powerpoint And Google Slides Cpb are topically designed to provide an attractive backdrop to any subject. Use them to look like a presentation pro.
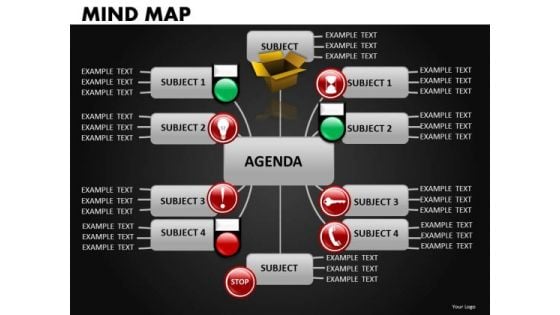
Mind Maps Diagrams For PowerPoint Editable Ppt Slides
Mind Maps Diagrams for PowerPoint Editable PPT Slides-These high quality powerpoint pre-designed slides and powerpoint templates have been carefully created by our professional team to help you impress your audience. All slides have been created and are 100% editable in powerpoint. Each and every property of any graphic - color, size, orientation, shading, outline etc. can be modified to help you build an effective powerpoint presentation. Any text can be entered at any point in the powerpoint template or slide. Simply DOWNLOAD, TYPE and PRESENT!-These slides can be used for presentation themes relating to-Brain, brainstorming, business, clearance, communications, decision, discharging, graphic, leadership, making, management, map, mapping, mind, mind-map, option, problem, problem-solving, process, project, question, red, solutions, solve, solving, technique, think, training, why Carry your team with our Mind Maps Diagrams For PowerPoint Editable Ppt Slides. You will come out on top.
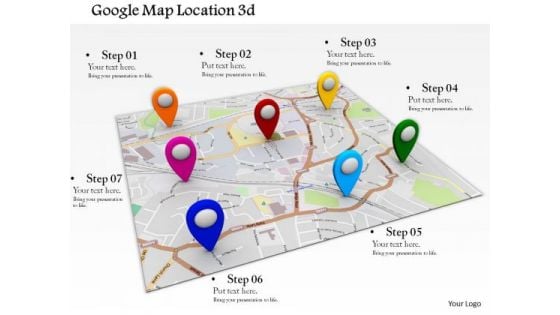
Stock Photo Google Maps Location Access PowerPoint Slide
Use this google maps image slide to make presentations related to technology, satellites, GPS or wireless networks. Design your presentation with this amazing slide and impress your audiences.
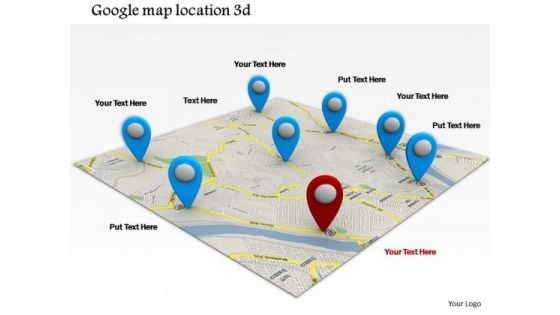
Stock Photo Google Maps Navigation Conceptual Image PowerPoint Slide
Download this google maps image slide to make presentations related to technology, satellites, GPS or wireless networks. Design your presentation with this amazing slide and impress your audiences.
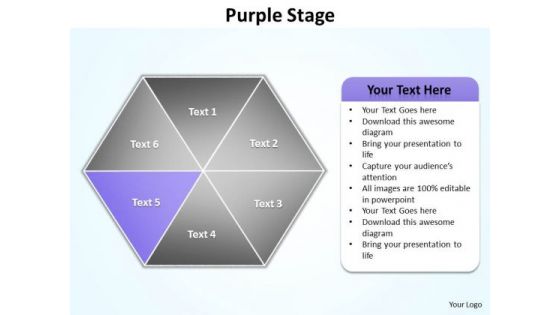
Ppt Purple Factor Hexagon Diagram PowerPoint Free Editable Maps Templates
PPT purple factor hexagon diagram PowerPoint free editable maps Templates-Use this Astonishing PowerPoint Diagram to abstract the different phases of a single Hexagonal procedure. It symbolizes forever and ever, interminable, looped, no end of, no end to, on a treadmill, perpetual, prolonged, regular etc. It explains its Purple Component.-PPT purple factor hexagon diagram PowerPoint free editable maps Templates-attached, backgrounds, blue, cell, color, component, connect, connection, diagram, elements, geometric, graphic, group, hexagon, honeycomb, icon, illustration, intricacy, lines, link, map, mesh, model, network, science, shape, shiny, strategy, structure, symbol, teamwork, technology Distribute tasks with our Ppt Purple Factor Hexagon Diagram PowerPoint Free Editable Maps Templates. Download without worries with our money back guaranteee.

Our Maps Location Ppt Powerpoint Presentation Model Graphics
This is a our maps location ppt powerpoint presentation model graphics. This is a one stage process. The stages in this process are location, information, geography, management, strategy.
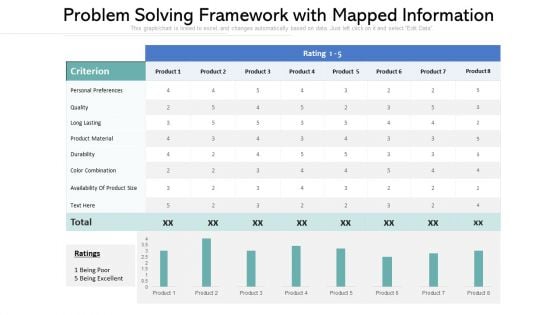
Problem Solving Framework With Mapped Information Information PDF
Showcasing this set of slides titled problem solving framework with mapped information information pdf. The topics addressed in these templates are product material, personal preferences, being excellent. All the content presented in this PPT design is completely editable. Download it and make adjustments in color, background, font etc. as per your unique business setting.
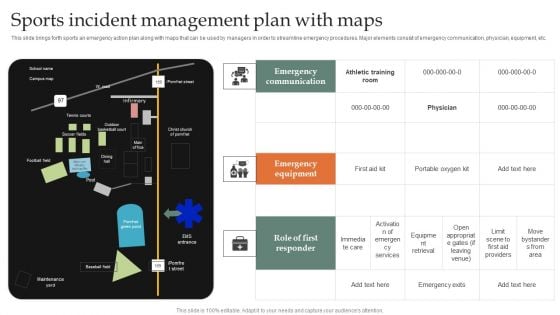
Sports Incident Management Plan With Maps Demonstration PDF
This slide brings forth sports an emergency action plan along with maps that can be used by managers in order to streamline emergency procedures. Major elements consist of emergency communication, physician, equipment, etc. Showcasing this set of slides titled Sports Incident Management Plan With Maps Demonstration PDF. The topics addressed in these templates are Emergency Communication, Emergency Equipment, Role First Responder. All the content presented in this PPT design is completely editable. Download it and make adjustments in color, background, font etc. as per your unique business setting.
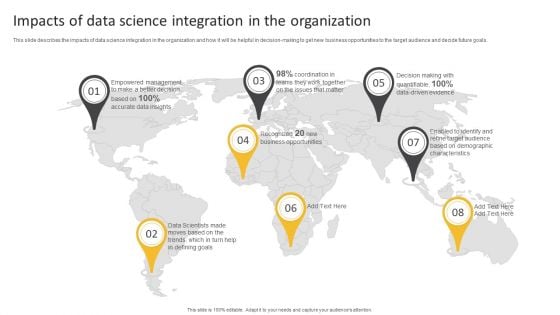
Information Science Impacts Of Data Science Integration In The Organization Ppt PowerPoint Presentation Portfolio Graphics Template PDF
This slide describes the impacts of data science integration in the organization and how it will be helpful in decision-making to get new business opportunities to the target audience and decide future goals.Presenting Information Science Impacts Of Data Science Integration In The Organization Ppt PowerPoint Presentation Portfolio Graphics Template PDF to provide visual cues and insights. Share and navigate important information on nine stages that need your due attention. This template can be used to pitch topics like Empowered Management, Accurate Data, Business Opportunities. In addtion, this PPT design contains high resolution images, graphics, etc, that are easily editable and available for immediate download.
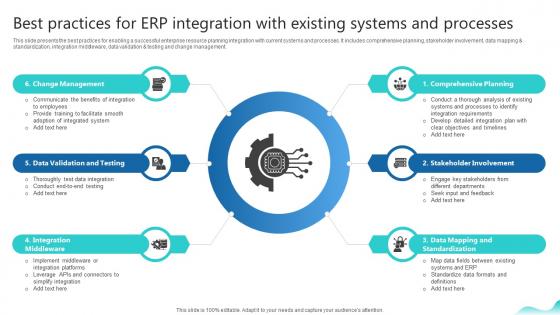
Best Practices For Erp Integration With Existing Systems Erp And Digital Transformation For Maximizing DT SS V
This slide presents the best practices for enabling a successful enterprise resource planning integration with current systems and processes. It includes comprehensive planning, stakeholder involvement, data mapping and standardization, integration middleware, data validation and testing and change management.From laying roadmaps to briefing everything in detail, our templates are perfect for you. You can set the stage with your presentation slides. All you have to do is download these easy-to-edit and customizable templates. Best Practices For Erp Integration With Existing Systems Erp And Digital Transformation For Maximizing DT SS V will help you deliver an outstanding performance that everyone would remember and praise you for. Do download this presentation today. This slide presents the best practices for enabling a successful enterprise resource planning integration with current systems and processes. It includes comprehensive planning, stakeholder involvement, data mapping and standardization, integration middleware, data validation and testing and change management.
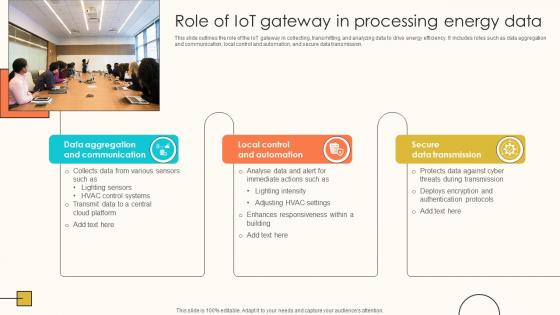
Role Of IoT Gateway In Processing Energy Data Internet Of Things Solutions To Enhance Energy IoT SS V
This slide outlines the role of the IoT gateway in collecting, transmitting, and analyzing data to drive energy efficiency. It includes roles such as data aggregation and communication, local control and automation, and secure data transmission. Do you know about Slidesgeeks Role Of IoT Gateway In Processing Energy Data Internet Of Things Solutions To Enhance Energy IoT SS V These are perfect for delivering any kind od presentation. Using it, create PowerPoint presentations that communicate your ideas and engage audiences. Save time and effort by using our pre-designed presentation templates that are perfect for a wide range of topic. Our vast selection of designs covers a range of styles, from creative to business, and are all highly customizable and easy to edit. Download as a PowerPoint template or use them as Google Slides themes. This slide outlines the role of the IoT gateway in collecting, transmitting, and analyzing data to drive energy efficiency. It includes roles such as data aggregation and communication, local control and automation, and secure data transmission.
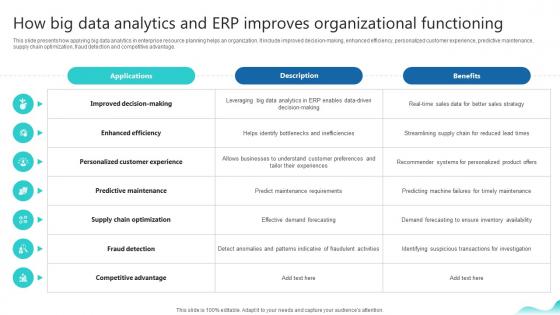
How Big Data Analytics And Erp Improves Organizational Erp And Digital Transformation For Maximizing DT SS V
This slide presents how applying big data analytics in enterprise resource planning helps an organization. It include improved decision-making, enhanced efficiency, personalized customer experience, predictive maintenance, supply chain optimization, fraud detection and competitive advantage.Slidegeeks is one of the best resources for PowerPoint templates. You can download easily and regulate How Big Data Analytics And Erp Improves Organizational Erp And Digital Transformation For Maximizing DT SS V for your personal presentations from our wonderful collection. A few clicks is all it takes to discover and get the most relevant and appropriate templates. Use our Templates to add a unique zing and appeal to your presentation and meetings. All the slides are easy to edit and you can use them even for advertisement purposes. This slide presents how applying big data analytics in enterprise resource planning helps an organization. It include improved decision-making, enhanced efficiency, personalized customer experience, predictive maintenance, supply chain optimization, fraud detection and competitive advantage.
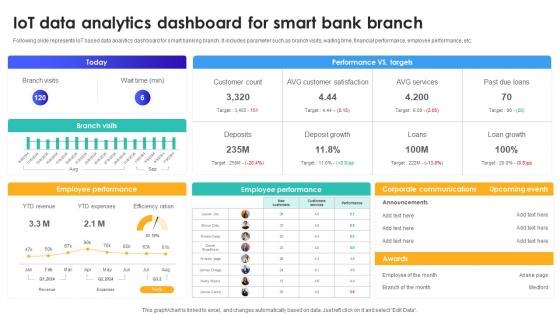
IoT Data Analytics Dashboard For Smart Bank Branch IoT In Banking For Digital Future IoT SS V
Following slide represents IoT based data analytics dashboard for smart banking branch. It includes parameter such as branch visits, waiting time, financial performance, employee performance, etc. Do you have an important presentation coming up Are you looking for something that will make your presentation stand out from the rest Look no further than IoT Data Analytics Dashboard For Smart Bank Branch IoT In Banking For Digital Future IoT SS V. With our professional designs, you can trust that your presentation will pop and make delivering it a smooth process. And with Slidegeeks, you can trust that your presentation will be unique and memorable. So why wait Grab IoT Data Analytics Dashboard For Smart Bank Branch IoT In Banking For Digital Future IoT SS V today and make your presentation stand out from the rest Following slide represents IoT based data analytics dashboard for smart banking branch. It includes parameter such as branch visits, waiting time, financial performance, employee performance, etc.
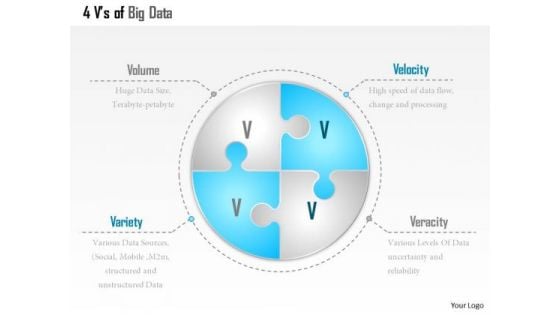
Business Diagram 4 Pieces Puzzle Showing 4 Vs Of Big Data Volume Velocity Variety Veracity Ppt Slide
This PowerPoint template has been designed with graphic of four layers of data. In this slide we have used circle diagram displaying volume, variety and velocity. Use this editable diagram for your data technology and communication related presentations.
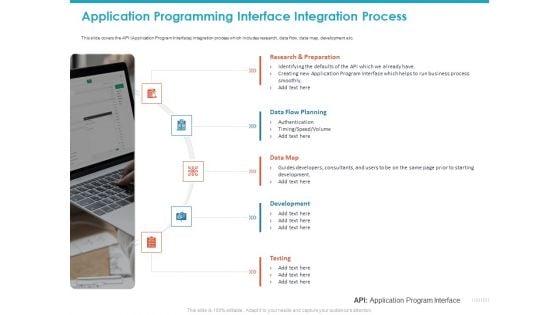
Application Programming Interface Integration Process Ppt Slides Template PDF
This slide covers the API Application Program Interface integration process which includes research, data flow, data map, development etc. This is a application programming interface integration process ppt slides template pdf template with various stages. Focus and dispense information on five stages using this creative set, that comes with editable features. It contains large content boxes to add your information on topics like data flow planning, data map, development, testing, research and preparation. You can also showcase facts, figures, and other relevant content using this PPT layout. Grab it now.
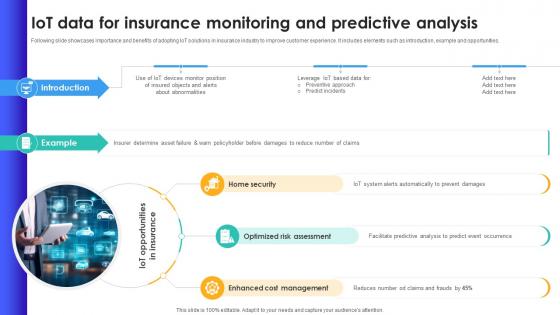
IoT Data For Insurance Monitoring And Predictive Analysis IoT In Banking For Digital Future IoT SS V
Following slide showcases importance and benefits of adopting IoT solutions in insurance industry to improve customer experience. It includes elements such as introduction, example and opportunities. Whether you have daily or monthly meetings, a brilliant presentation is necessary. IoT Data For Insurance Monitoring And Predictive Analysis IoT In Banking For Digital Future IoT SS V can be your best option for delivering a presentation. Represent everything in detail using IoT Data For Insurance Monitoring And Predictive Analysis IoT In Banking For Digital Future IoT SS V and make yourself stand out in meetings. The template is versatile and follows a structure that will cater to your requirements. All the templates prepared by Slidegeeks are easy to download and edit. Our research experts have taken care of the corporate themes as well. So, give it a try and see the results. Following slide showcases importance and benefits of adopting IoT solutions in insurance industry to improve customer experience. It includes elements such as introduction, example and opportunities.
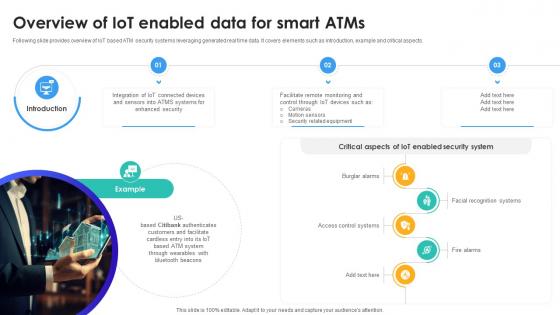
Overview Of IoT Enabled Data For Smart Atms IoT In Banking For Digital Future IoT SS V
Following slide provides overview of IoT based ATM security systems leveraging generated real time data. It covers elements such as introduction, example and critical aspects. Retrieve professionally designed Overview Of IoT Enabled Data For Smart Atms IoT In Banking For Digital Future IoT SS V to effectively convey your message and captivate your listeners. Save time by selecting pre-made slideshows that are appropriate for various topics, from business to educational purposes. These themes come in many different styles, from creative to corporate, and all of them are easily adjustable and can be edited quickly. Access them as PowerPoint templates or as Google Slides themes. You do not have to go on a hunt for the perfect presentation because Slidegeeks got you covered from everywhere. Following slide provides overview of IoT based ATM security systems leveraging generated real time data. It covers elements such as introduction, example and critical aspects.
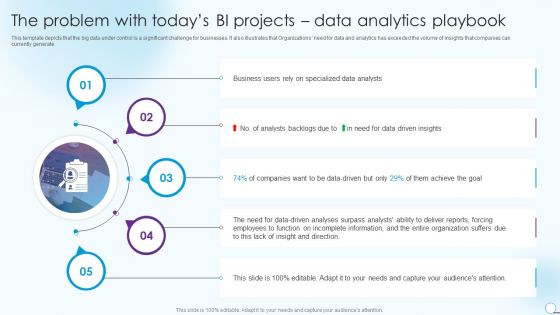
Information Analytics And Ml Strategy Playbook The Problem With Todays BI Projects Data Analytics Playbook Rules PDF
This template depicts that the big data under control is a significant challenge for businesses. It also illustrates that Organizations need for data and analytics has exceeded the volume of insights that companies can currently generate. This is a Information Analytics And Ml Strategy Playbook The Problem With Todays BI Projects Data Analytics Playbook Rules PDF template with various stages. Focus and dispense information on five stages using this creative set, that comes with editable features. It contains large content boxes to add your information on topics like Specialized Data Analysts, Business Users, Entire Organization. You can also showcase facts, figures, and other relevant content using this PPT layout. Grab it now.
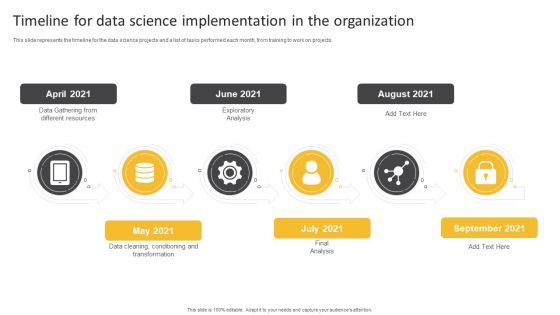
Information Science Timeline For Data Science Implementation In The Organization Ppt PowerPoint Presentation Infographic Template Slideshow PDF
This slide represents the timeline for the data science projects and a list of tasks performed each month, from training to work on projects.This is a Information Science Timeline For Data Science Implementation In The Organization Ppt PowerPoint Presentation Infographic Template Slideshow PDF template with various stages. Focus and dispense information on six stages using this creative set, that comes with editable features. It contains large content boxes to add your information on topics like Data Gathering, Exploratory Analysis, Final Analysis. You can also showcase facts, figures, and other relevant content using this PPT layout. Grab it now.


 Continue with Email

 Home
Home


