Data Mapping
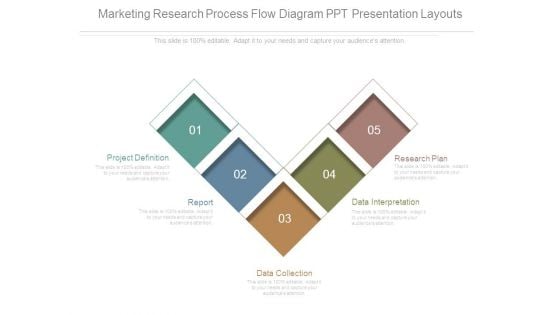
Marketing Research Process Flow Diagram Ppt Presentation Layouts
This is a marketing research process flow diagram ppt presentation layouts. This is a five stage process. The stages in this process are project definition, report, data collection, data interpretation, research plan.
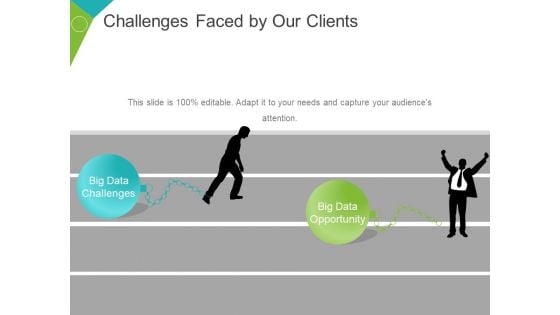
Challenges Faced By Our Clients Template 2 Ppt PowerPoint Presentation Outline Picture
This is a challenges faced by our clients template 2 ppt powerpoint presentation outline picture. This is a two stage process. The stages in this process are big data challenges, big data opportunity, silhouettes, communication, management.
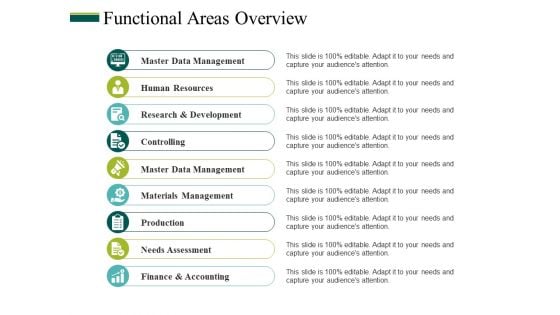
Functional Areas Overview Ppt PowerPoint Presentation Ideas Influencers
This is a functional areas overview ppt powerpoint presentation ideas influencers. This is a nine stage process. The stages in this process are master data management, human resources, research and development, controlling, master data management.
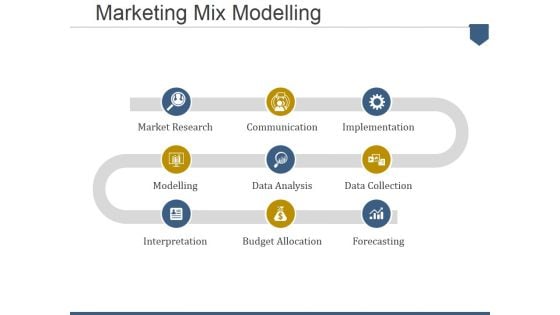
Marketing Mix Modelling Ppt PowerPoint Presentation Portfolio Graphics Template
This is a marketing mix modelling ppt powerpoint presentation portfolio graphics template. This is a three stage process. The stages in this process are market research, communication, implementation, data collection, forecasting, budget allocation, data analysis, modelling, interpretation.
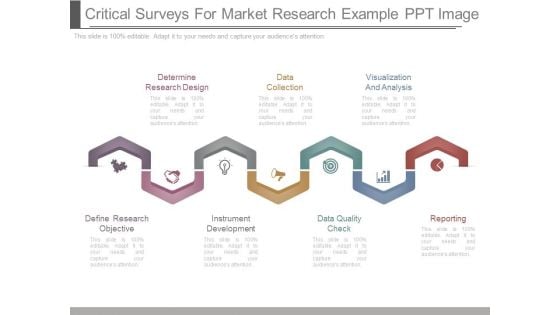
Critical Surveys For Market Research Example Ppt Image
This is a critical surveys for market research example ppt image. This is a seven stage process. The stages in this process are determine research design, data collection, visualization and analysis, define research objective, instrument development, data quality check, reporting.
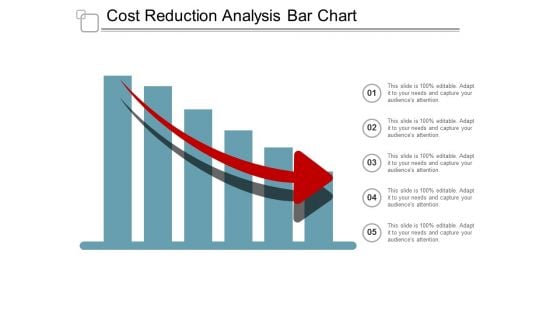
Cost Reduction Analysis Bar Chart Ppt Powerpoint Presentation File Graphics Design
This is a cost reduction analysis bar chart ppt powerpoint presentation file graphics design. This is a five stage process. The stages in this process are data analysis, data science, information science.
Business Diagram Zigzag Process Diagram With Six Icons Presentation Template
This business diagram has been designed with graphic of six staged zigzag process diagram and icons. This slide depicts concept of data and process flow. Use this diagram for data display in business presentations.
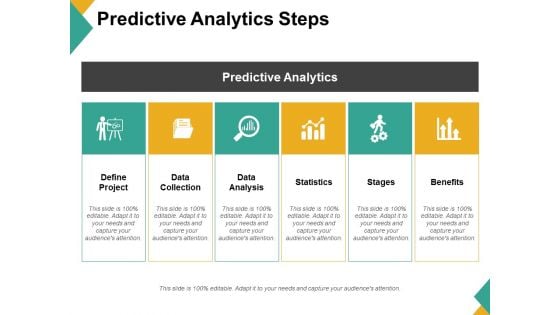
Predictive Analytics Steps Ppt PowerPoint Presentation Styles Guidelines
This is a predictive analytics steps ppt powerpoint presentation styles guidelines. This is a six stage process. The stages in this process are define project, data collection, data analysis, statistics, stages, benefits.
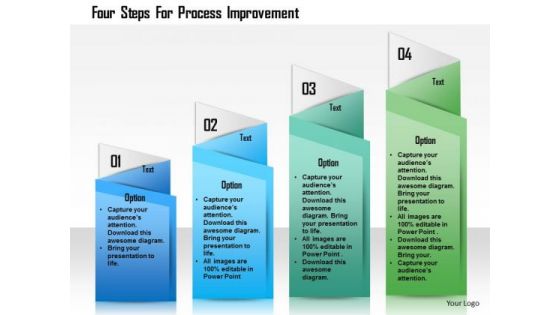
Business Diagram Four Steps For Process Improvement Presentation Template
Graphic of four sequential text boxes are used to design this power point template. This PPT contains the concept of data flow in any process. Use this PPT for your data and process flow related topics in any presentation.
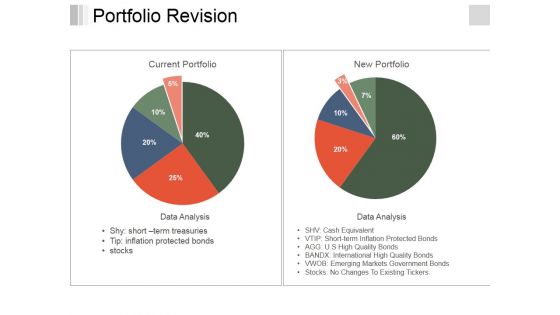
Portfolio Revision Ppt PowerPoint Presentation Visual Aids Infographic Template
This is a portfolio revision ppt powerpoint presentation visual aids infographic template. This is a two stage process. The stages in this process are current portfolio, data analysis, new portfolio, data analysis.

Industrial Marketing Research Ppt Background Template
This is a industrial marketing research ppt background template. This is a five stage process. The stages in this process are identify the problem, develop research design, collect data or info, process and analyze the data, create a report.
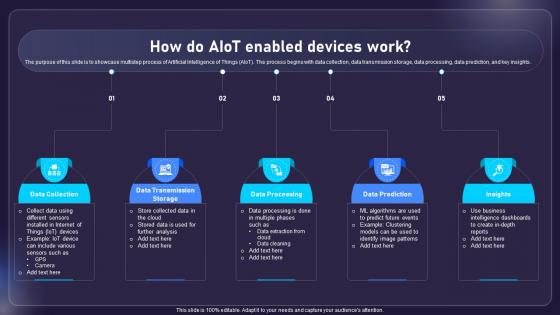
How Do AIOT Enabled Devices Work AIOT Applications For Various Industries IoT SS V
The purpose of this slide is to showcase multistep process of Artificial Intelligence of Things AIoT. The process begins with data collection, data transmission storage, data processing, data prediction, and key insights. Welcome to our selection of the How Do AIOT Enabled Devices Work AIOT Applications For Various Industries IoT SS V. These are designed to help you showcase your creativity and bring your sphere to life. Planning and Innovation are essential for any business that is just starting out. This collection contains the designs that you need for your everyday presentations. All of our PowerPoints are 100Percent editable, so you can customize them to suit your needs. This multi-purpose template can be used in various situations. Grab these presentation templates today. The purpose of this slide is to showcase multistep process of Artificial Intelligence of Things AIoT. The process begins with data collection, data transmission storage, data processing, data prediction, and key insights.
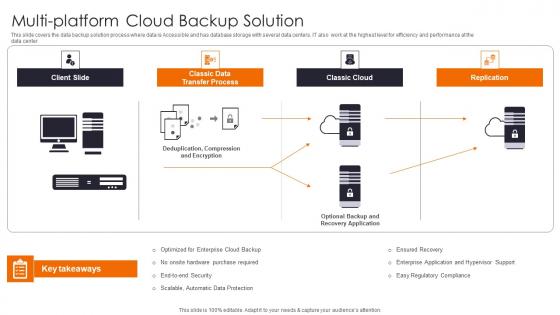
Multi Platform Cloud Backup Enhancing Workload Efficiency Through Cloud Architecture Rules Pdf
This slide covers the data backup solution process where data is Accessible and has database storage with several data centers. IT also work at the highest level for efficiency and performance at the data center Create an editable Multi Platform Cloud Backup Enhancing Workload Efficiency Through Cloud Architecture Rules Pdf that communicates your idea and engages your audience. Whether you are presenting a business or an educational presentation, pre designed presentation templates help save time. Multi Platform Cloud Backup Enhancing Workload Efficiency Through Cloud Architecture Rules Pdf is highly customizable and very easy to edit, covering many different styles from creative to business presentations. Slidegeeks has creative team members who have crafted amazing templates. So, go and get them without any delay. This slide covers the data backup solution process where data is Accessible and has database storage with several data centers. IT also work at the highest level for efficiency and performance at the data center Create
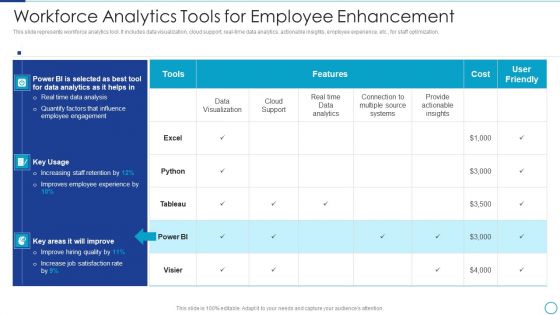
Workforce Management Strategies For Effective Hiring Process Workforce Analytics Tools Ideas PDF
This slide represents workforce analytics tool. It includes data visualization, cloud support, real time data analytics, actionable insights, employee experience, etc. for staff optimization. Deliver an awe inspiring pitch with this creative Workforce Management Strategies For Effective Hiring Process Workforce Analytics Tools Ideas PDF bundle. Topics like Data Analytics, Systems, Data Visualization can be discussed with this completely editable template. It is available for immediate download depending on the needs and requirements of the user.

How Blockchain Is Reshaping HIPAA Compliance In Blockchain Based Healthcare BCT SS V
This slide mentions how compliance with Health Insurance Portability and Accountability Act HIPAA helps in ensuring patient data privacy. It includes secured storage of health data, control over data access, data integrity and interoperability. The best PPT templates are a great way to save time, energy, and resources. Slidegeeks have 100 percent editable powerpoint slides making them incredibly versatile. With these quality presentation templates, you can create a captivating and memorable presentation by combining visually appealing slides and effectively communicating your message. Download How Blockchain Is Reshaping HIPAA Compliance In Blockchain Based Healthcare BCT SS V from Slidegeeks and deliver a wonderful presentation. This slide mentions how compliance with Health Insurance Portability and Accountability Act HIPAA helps in ensuring patient data privacy. It includes secured storage of health data, control over data access, data integrity and interoperability.
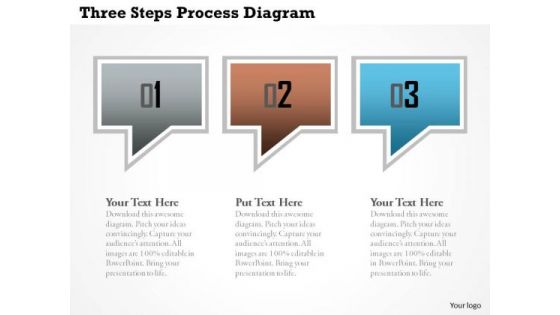
Business Diagram Three Steps Process Diagram Presentation Template
Graphic of three colored pillars has been used to design this power point template diagram. This PPT contains the concept of text and data representation. Use this PPT diagram for your business data related topics.
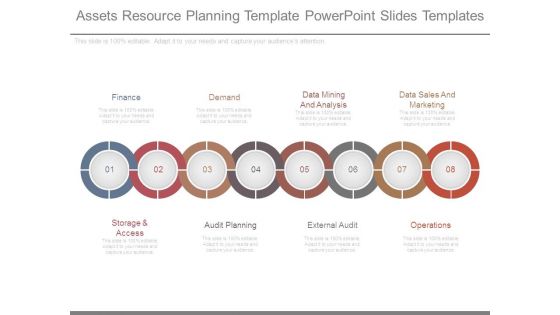
Assets Resource Planning Template Powerpoint Slides Templates
This is a assets resource planning template powerpoint slides templates. This is a eight stage process. The stages in this process are finance, storage and access, demand, data mining and analysis, external audit, data sales and marketing, operations.
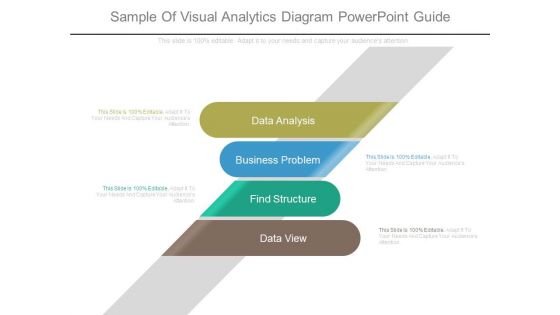
Sample Of Visual Analytics Diagram Powerpoint Guide
This is a sample of visual analytics diagram powerpoint guide. This is a four stage process. The stages in this process are data analysis, business problem, find structure, data view.
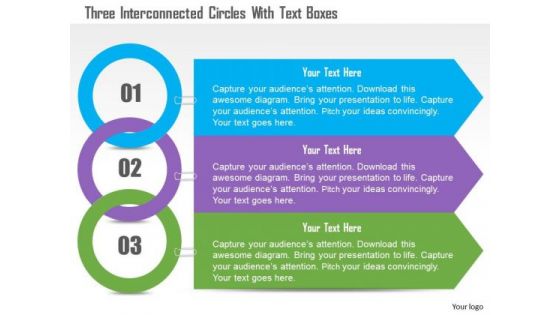
Business Diagram Three Interconnected Circles With Text Boxes Presentation Template
Three interconnected circles and text boxes are used to design this business diagram. This slide contains the concept of data and process flow. Use this amazing slide for your business and data related presentations.
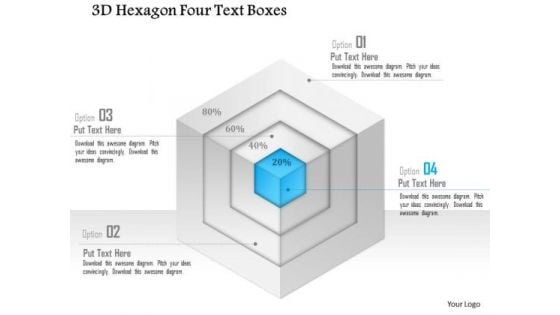
Business Diagram 3d Hexagon Four Text Boxes PowerPoint Template
Graphic of 3d hexagon diagram and text boxes are used to craft this power point template slide. This PPT slide contains the concept of data representation. Use this PPT for your business and marketing data flow related presentations.
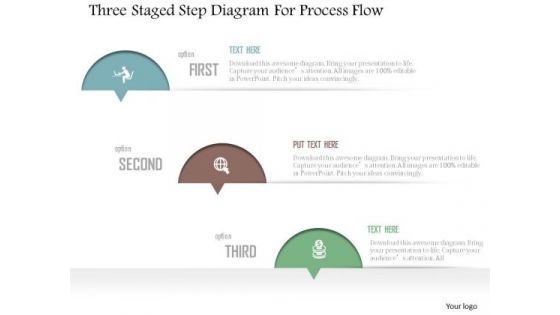
Business Diagram Three Staged Step Diagram For Process Flow Presentation Template
Three staged step diagram has been used to craft this power point template diagram. This PPT contains the concept of data and process flow representation. Use this PPT for business and marketing data related presentations.
Business Diagram Five Staged Multiple Icons Text Boxes Presentation Template
Five staged multiple icons style text boxes has been used to design this power point template. This PPT contains the concept of data representation. Display all data flow related topics in your business presentation with this PPT.

Corporate Marketing Example Ppt Sample
This is a corporate marketing example ppt sample. This is a four stage process. The stages in this process are corporate marketing, big data processing, external data append, messaging interaction.

Statistical Assessment Example Ppt Background Images
This is a statistical assessment example ppt background images. This is a five stage process. The stages in this process are data element, data field, indexed collection, keved collection, bean collection, statistical assessment.
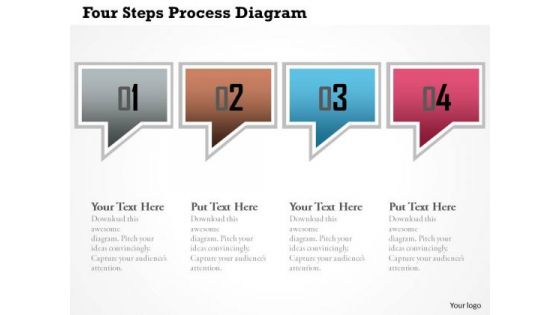
Business Diagram Four Steps Process Diagram Presentation Template
This power point template has been crafted with graphic of dialogue box. This PPT contains the concept of process and data flow. Use this PPT for your business and data related presentations.
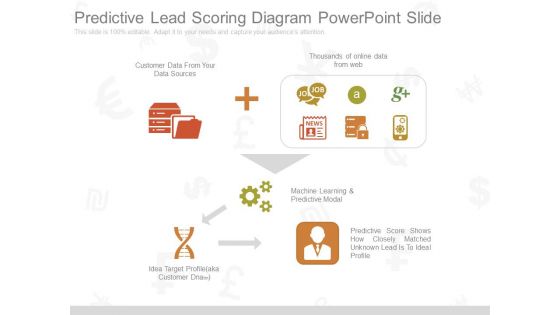
Predictive Lead Scoring Diagram Powerpoint Slide
This is a predictive lead scoring diagram powerpoint slide. This is a one stage process. The stages in this process are thousands of online data from web, customer data from your data sources, machine learning and predictive modal, predictive score shows how closely matched unknown lead is to ideal profile, idea target profile aka customer dnatm.
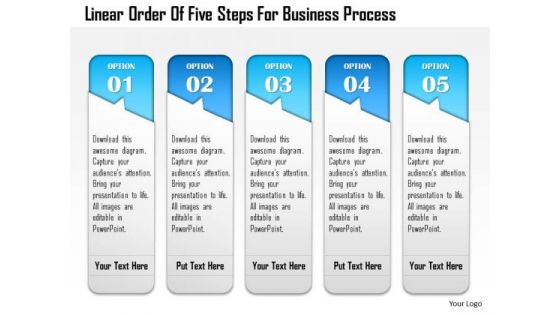
Business Diagram Linear Order Of Five Steps For Business Process Presentation Template
Five linear text boxes are used to design this power point template. This PPT contains the concept of data representation. Use this PPT for your data related topics in any presentation.

Reducing Cost Dollar Sign With Cloud On Mobile Ppt Powerpoint Presentation Styles File Formats
This is a reducing cost dollar sign with cloud on mobile ppt powerpoint presentation styles file formats. This is a four stage process. The stages in this process are data analysis, data science, information science.
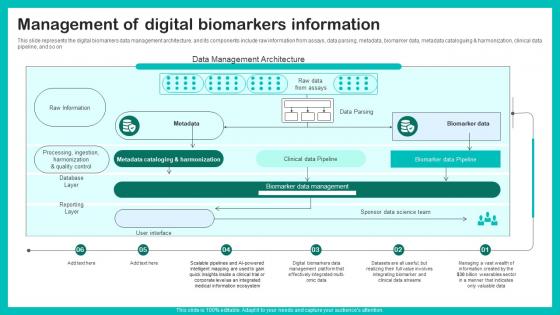
Management Of Digital Biomarkers Digital Biomarkers For Personalized Health Insights Slides Pdf
This slide represents the digital biomarkers data management architecture, and its components include raw information from assays, data parsing, metadata, biomarker data, metadata cataloguing and harmonization, clinical data pipeline, and so on Welcome to our selection of the Management Of Digital Biomarkers Digital Biomarkers For Personalized Health Insights Slides Pdf. These are designed to help you showcase your creativity and bring your sphere to life. Planning and Innovation are essential for any business that is just starting out. This collection contains the designs that you need for your everyday presentations. All of our PowerPoints are 100 percent editable, so you can customize them to suit your needs. This multi purpose template can be used in various situations. Grab these presentation templates today This slide represents the digital biomarkers data management architecture, and its components include raw information from assays, data parsing, metadata, biomarker data, metadata cataloguing and harmonization, clinical data pipeline, and so on

Marketing Report For Research Ppt Powerpoint Ideas
This is a marketing report for research ppt powerpoint ideas. This is a five stage process. The stages in this process are project definition, research plan, data collection, data interpretation, summary.

Market Research Report Template Powerpoint Slides
This is a market research report template powerpoint slides. This is a five stage process. The stages in this process are research plan, project definition, data collection, data interpretation, summary of finding and report.
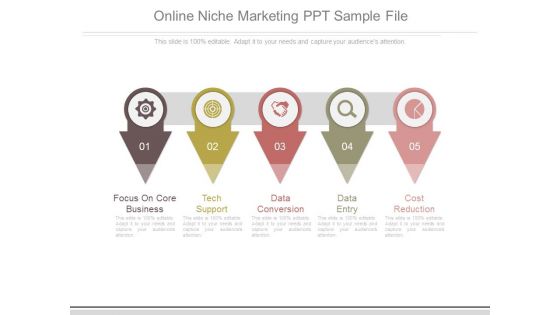
Online Niche Marketing Ppt Sample File
This is a online niche marketing ppt sample file. This is a five stage process. The stages in this process are focus on core business, tech support, data conversion, data entry, cost reduction.
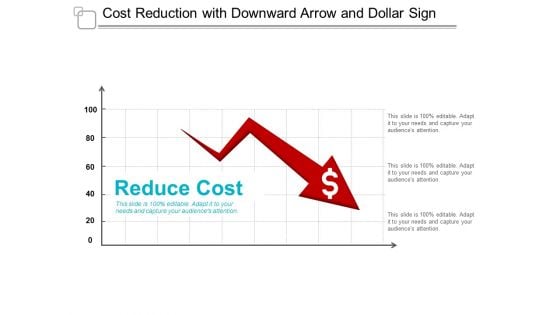
Cost Reduction With Downward Arrow And Dollar Sign Ppt Powerpoint Presentation Infographics Templates
This is a cost reduction with downward arrow and dollar sign ppt powerpoint presentation infographics templates. This is a three stage process. The stages in this process are data analysis, data science, information science.

Minimize Expenses To Reduce Business Cost Ppt Powerpoint Presentation Inspiration Pictures
This is a minimize expenses to reduce business cost ppt powerpoint presentation inspiration pictures. This is a four stage process. The stages in this process are data analysis, data science, information science.
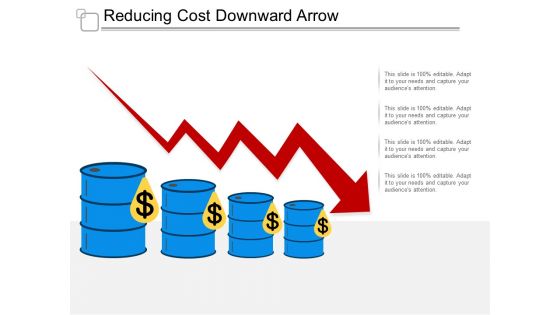
Reducing Cost Downward Arrow Ppt Powerpoint Presentation Outline Inspiration
This is a reducing cost downward arrow ppt powerpoint presentation outline inspiration. This is a four stage process. The stages in this process are data analysis, data science, information science.

Reducing Cost Vector Dollar Sign With Down Arrow Ppt Powerpoint Presentation Model Outline
This is a reducing cost vector dollar sign with down arrow ppt powerpoint presentation model outline. This is a four stage process. The stages in this process are data analysis, data science, information science.

Ways To Reduce Business Costs Ppt Powerpoint Presentation Portfolio Images
This is a ways to reduce business costs ppt powerpoint presentation portfolio images. This is a four stage process. The stages in this process are data analysis, data science, information science.
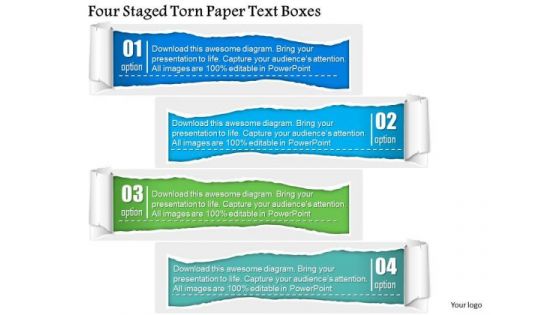
Business Diagram Four Staged Torn Paper Text Boxes PowerPoint Template
Four staged torn paper style text boxes are used to craft this power point template. This PPT contains the concept of data representation for business process. Use this PPT and build an innovative presentation for data based topics.
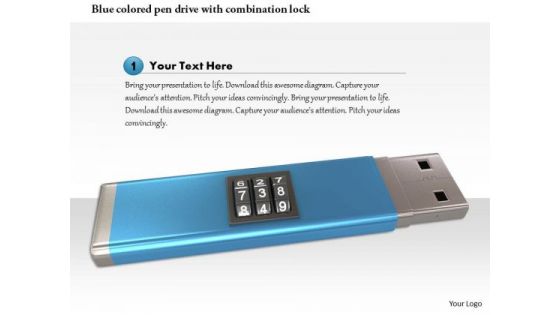
Stock Photo Blue Colored Pen Drive With Combination Lock PowerPoint Slide
Graphic of blue colored pen drive and combination lock has been used to design this power point template. This PPT contains the concept of data security and data technology. Use this PPT for your business and marketing related presentations.
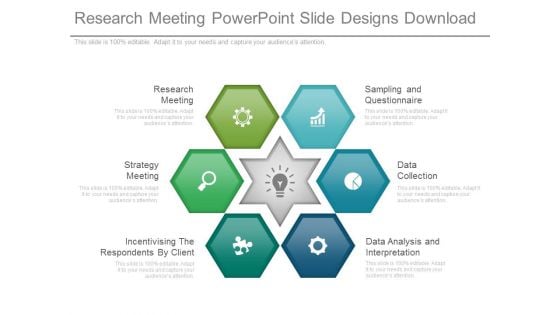
Research Meeting Powerpoint Slide Designs Download
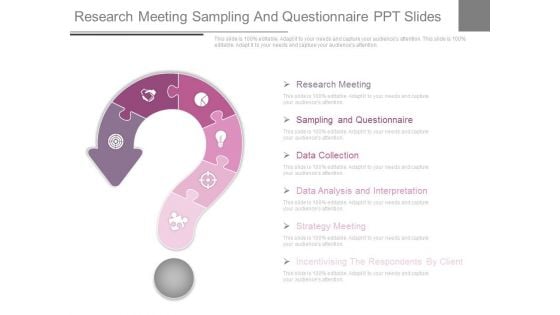
This is a research meeting powerpoint slide designs download. This is a six stage process. The stages in this process are research meeting, sampling and questionnaire, strategy meeting, data collection, incentivising the respondents by client, data analysis and interpretation.
Research Meeting Sampling And Questionnaire Ppt Slides
This is a research meeting sampling and questionnaire ppt slides. This is a six stage process. The stages in this process are sampling and questionnaire, research meeting, data collection, data analysis and interpretation, strategy meeting, incentivising the respondents by client.
Business Diagram Five Steps In Concentric Circle Presentation Template
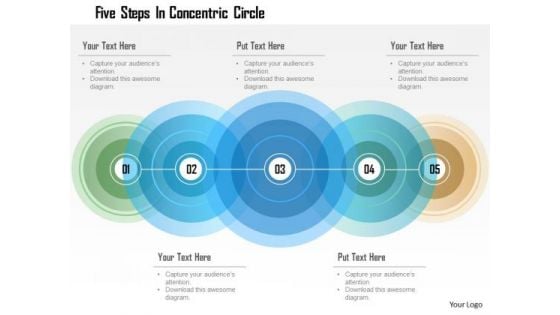
Five staged colorful circular text boxes in linear flow has been used to design this power point template. This PPT contains the concept of data representation. Use this PPT for your data related topics in any business or sales presentation.
Technology Insights Diagram Ppt Example
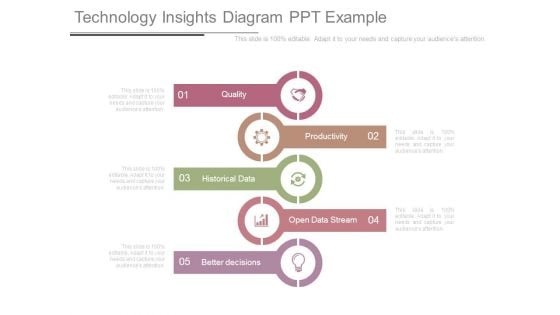
This is a technology insights diagram ppt example. This is a five stage process. The stages in this process are quality, productivity, historical data, open data stream, better decisions.
Business Diagram Three Triangles To Present Business Information Presentation Template
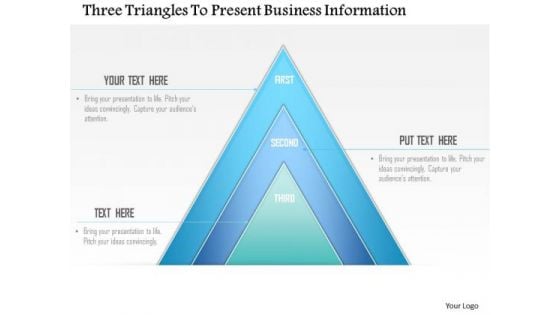
Three interconnected triangles are used to design this business diagram. This slide contains the concept of data and process flow. Use this slide for your business and data related presentations.
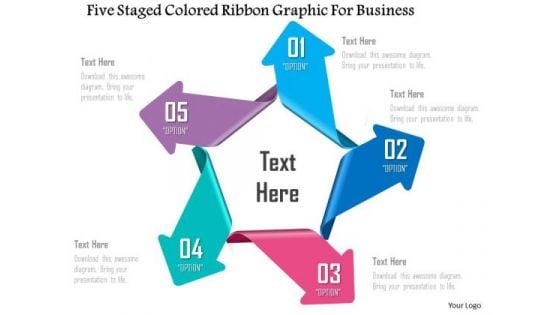
Business Diagram Five Staged Colored Ribbon Graphic For Business PowerPoint Template
Five staged colored ribbon text boxes are used to design this power point template. This PPT contains the concept of data representation. Use this PPT slide for your marketing and business data related presentations.
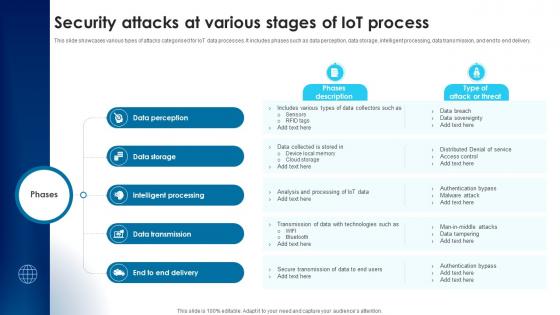
Building Trust With IoT Security Attacks At Various Stages Of IoT Process IoT SS V
This slide showcases various types of attacks categorised for IoT data processes. It includes phases such as data perception, data storage, intelligent processing, data transmission, and end to end delivery. Create an editable Building Trust With IoT Security Attacks At Various Stages Of IoT Process IoT SS V that communicates your idea and engages your audience. Whether you are presenting a business or an educational presentation, pre-designed presentation templates help save time. Building Trust With IoT Security Attacks At Various Stages Of IoT Process IoT SS V is highly customizable and very easy to edit, covering many different styles from creative to business presentations. Slidegeeks has creative team members who have crafted amazing templates. So, go and get them without any delay. This slide showcases various types of attacks categorised for IoT data processes. It includes phases such as data perception, data storage, intelligent processing, data transmission, and end to end delivery.

Business Diagram Building Diagram With Three Steps Presentation Template
Three staged house graphic has been used to craft this power point template. This PPT diagram contains the concept of data representation. Use this PPT for your data and business related presentations.
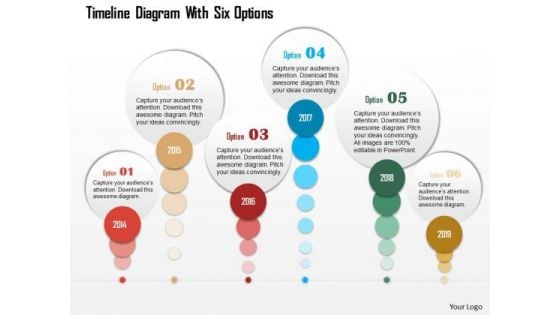
Business Diagram Timeline Diagram With Six Options Presentation Template
Graphic of designer circles has been used to design this power point template. This PPT contains the concept of data representation. Use this PPT for your business and data related presentation.
Business Diagram Five Icons With Circle Diagram Presentation Template
Five staged process flow diagram has been used to craft this power point template. This PPT diagram contains the concept of data and process flow .Use this PPT for business and data related presentations.

Stock Photo 3d Folders With Key And Lock PowerPoint Slide
Concept of data security has been displayed in this power point image template with suitable graphics. This image contains the graphics of 3d folders and key with lock. Use this PPT image for your data related presentations.
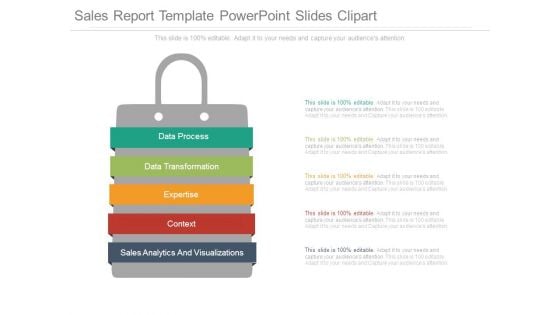
Sales Report Template Powerpoint Slides Clipart
This is a sales report template powerpoint slides clipart. This is a five stage process. The stages in this process are data process, data transformation, expertise, context, sales analytics and visualizations.
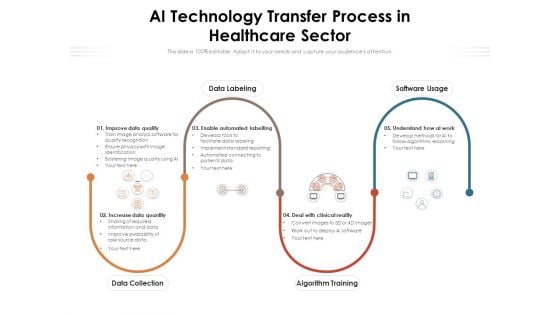
AI Technology Transfer Process In Healthcare Sector Ppt PowerPoint Presentation Infographics Layout PDF
Presenting ai technology transfer process in healthcare sector ppt powerpoint presentation infographics layout pdf to dispense important information. This template comprises five stages. It also presents valuable insights into the topics including improve data quality, data labeling, software usage, increase data quantity, data collection, algorithm training, deal with clinical reality, understand how al work, enable automated labelling. This is a completely customizable PowerPoint theme that can be put to use immediately. So, download it and address the topic impactfully.
Business Diagram Four Icons With Circle Diagram Presentation Template
Four staged process flows has been used to design this power point template. This PPT diagram contains the concept of data flow. Use this PPT for business and marketing data related topics in any presentation.
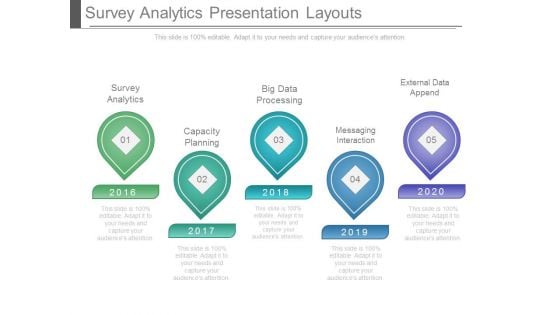
Survey Analytics Presentation Layouts
This is a survey analytics presentation layouts. This is a five stage process. The stages in this process are survey analytics, capacity planning, big data processing, messaging interaction, external data append.
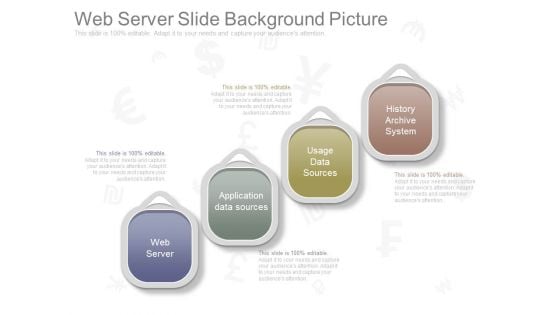
Web Server Slide Background Picture
This is a web server slide background picture. This is a four stage process. The stages in this process are web server, application data sources, usage data sources, history archive system.
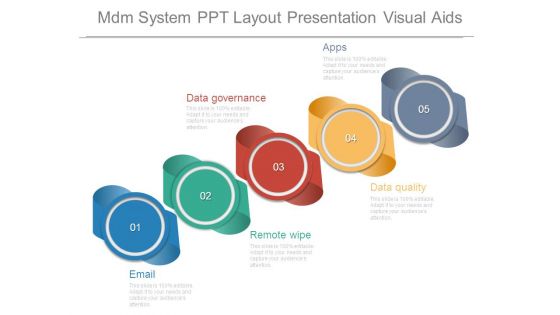
Mdm System Ppt Layout Presentation Visual Aids
This is a mdm system ppt layout presentation visual aids. This is a five stage process. The stages in this process are email, data governance, apps, remote wipe, data quality.
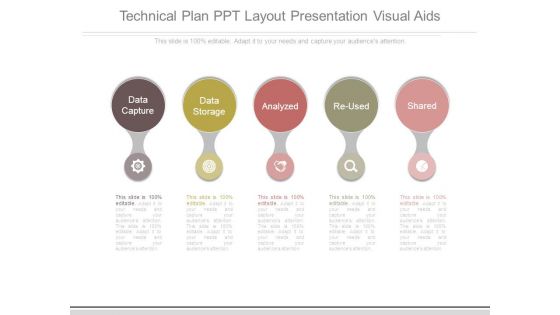
Technical Plan Ppt Layout Presentation Visual Aids
This is a technical plan ppt layout presentation visual aids. This is a five stage process. The stages in this process are data capture, data storage, analyzed, re used, shared.
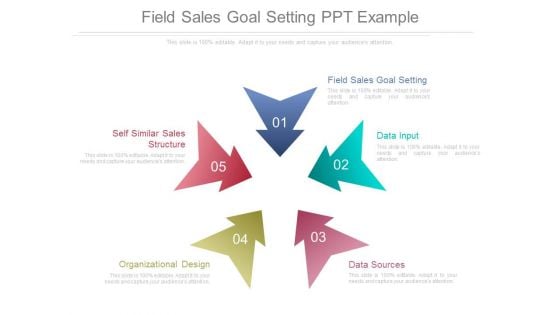
Field Sales Goal Setting Ppt Example
This is a field sales goal setting ppt example. This is a five stage process. The stages in this process are field sales goal setting, data input, data sources, organizational design, self similar sales structure.
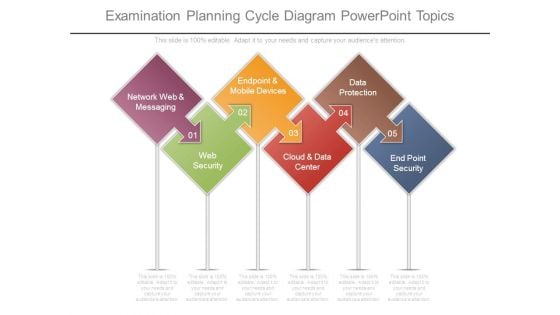
Examination Planning Cycle Diagram Powerpoint Topics
This is a examination planning cycle diagram powerpoint topics. This is a five stage process. The stages in this process are network web and messaging, web security, endpoint and mobile devices, cloud and data center, data protection, end point security.
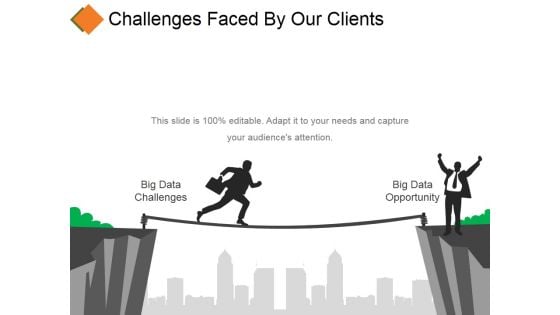
Challenges Faced By Our Clients Template 1 Ppt PowerPoint Presentation Diagrams
This is a challenges faced by our clients template 1 ppt powerpoint presentation diagrams. This is a two stage process. The stages in this process are big data challenges, big data opportunity, threat, communication.


 Continue with Email

 Home
Home


