Data Mapping
Adjusting The Data PowerPoint Icon C
3d illustration of a simple wrench turning/adjusting the elements on a multi-colored bar chart Eliminate doubts with our Adjusting The Data PowerPoint Icon C. Download without worries with our money back guaranteee.
Adjusting The Data PowerPoint Icon F
3d illustration of a simple wrench turning/adjusting the elements on a multi-colored bar chart Confident and committed define you well. Add to your dynamism with our Adjusting The Data PowerPoint Icon F.
Adjusting The Data PowerPoint Icon R
3d illustration of a simple wrench turning/adjusting the elements on a multi-colored bar chart Recapture your dream with our Adjusting The Data PowerPoint Icon R. Download without worries with our money back guaranteee.
Adjusting The Data PowerPoint Icon S
3d illustration of a simple wrench turning/adjusting the elements on a multi-colored bar chart Analyze growth with our Adjusting The Data PowerPoint Icon S. Download without worries with our money back guaranteee.
Analyzing The Data PowerPoint Icon C
3d illustration of a magnifying glass hovering over a three-dimensional multi-colored bar chart Our Analyzing The Data PowerPoint Icon C will get you all animated. You will become eager to assert your views.
Analyzing The Data PowerPoint Icon Cc
3d illustration of a magnifying glass hovering over a three-dimensional multi-colored bar chart Entertain dreams with our Analyzing The Data PowerPoint Icon Cc. Let your imagination run to places unknown.
Analyzing The Data PowerPoint Icon F
3d illustration of a magnifying glass hovering over a three-dimensional multi-colored bar chart Our Analyzing The Data PowerPoint Icon F are generous to an excess. They will give their all most willingly.
Analyzing The Data PowerPoint Icon R
3d illustration of a magnifying glass hovering over a three-dimensional multi-colored bar chart You are a renowned exponent of your trade. Ply your line with our Analyzing The Data PowerPoint Icon R.
Analyzing The Data PowerPoint Icon S
3d illustration of a magnifying glass hovering over a three-dimensional multi-colored bar chart Our Analyzing The Data PowerPoint Icon S are a great equaliser. They take everybody to the same level.

Three Tags For Data Comparison Powerpoint Slides
This PPT slide contains graphics of three tags. Download this PowerPoint template to depict data comparison in business presentations. Deliver amazing presentations to mesmerize your audience by using this PPT slide design.
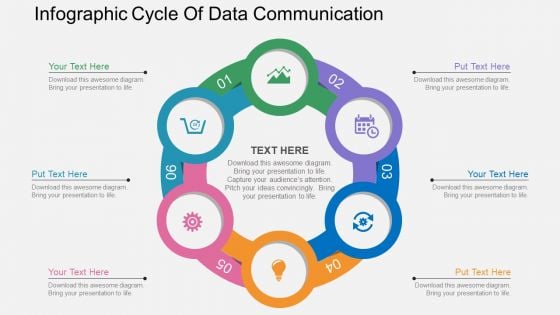
Infographic Cycle Of Data Communication Powerpoint Template
Our above PPT slide contains graphics of circular diagram. This business diagram helps to display outline of business plan. Use this template to impart more clarity to data and to create more sound impact on viewers.
Icons Slides Data Management Solutions Graphics PDF
Presenting our innovatively structured Icons Slides Data Management Solutions Graphics PDF set of slides. The slides contain a hundred percent editable icons. You can replace these icons without any inconvenience. Therefore, pick this set of slides and create a striking presentation.
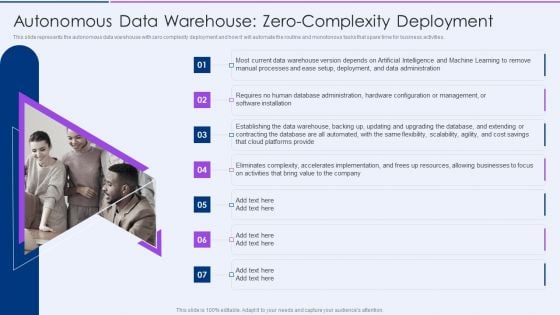
Autonomous Data Warehouse Zerocomplexity Deployment Pictures PDF
This slide represents the autonomous data warehouse with zero complexity deployment and how it will automate the routine and monotonous tasks that spare time for business activities.This is a Autonomous Data Warehouse Zerocomplexity Deployment Pictures PDF template with various stages. Focus and dispense information on seven stages using this creative set, that comes with editable features. It contains large content boxes to add your information on topics like Manual Processes, Software Installation, Platforms Provide. You can also showcase facts, figures, and other relevant content using this PPT layout. Grab it now.
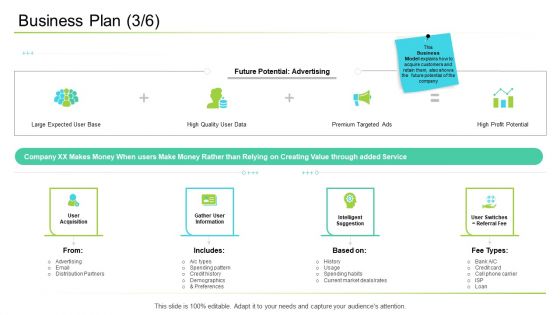
Business Plan Data Ppt Model Inspiration PDF
This is a business plan data ppt model inspiration pdf template with various stages. Focus and dispense information on four stages using this creative set, that comes with editable features. It contains large content boxes to add your information on topics like email, information, demographics, service. You can also showcase facts, figures, and other relevant content using this PPT layout. Grab it now.
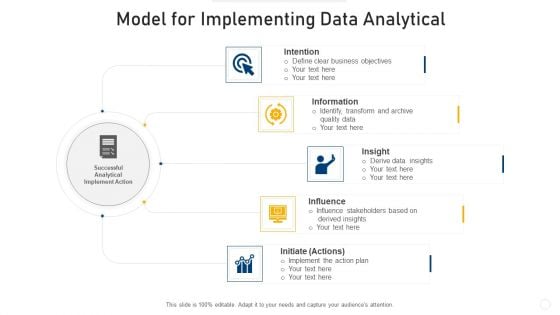
Model For Implementing Data Analytical Infographics PDF
Presenting model for implementing data analytical infographics pdf to dispense important information. This template comprises five stages. It also presents valuable insights into the topics including intention, insight, influence. This is a completely customizable PowerPoint theme that can be put to use immediately. So, download it and address the topic impactfully.
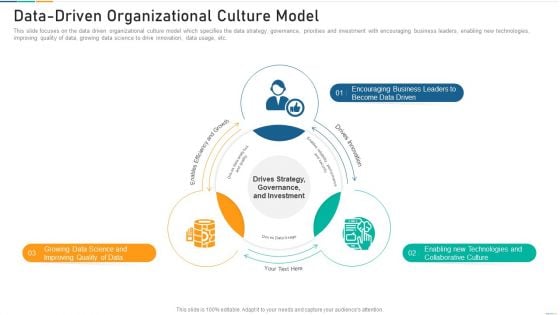
Data Driven Organizational Culture Model Formats PDF
Presenting data driven organizational culture model formats pdf to dispense important information. This template comprises three stages. It also presents valuable insights into the topics including strategy, drives innovation, business. This is a completely customizable PowerPoint theme that can be put to use immediately. So, download it and address the topic impactfully.
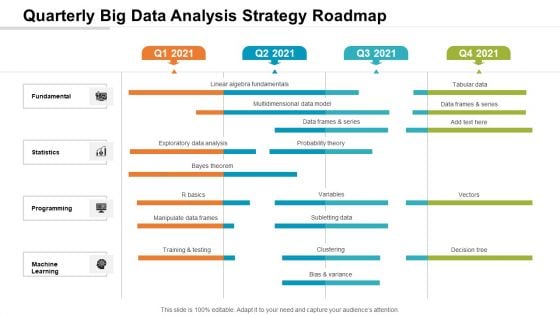
Quarterly Big Data Analysis Strategy Roadmap Infographics
Presenting our jaw-dropping quarterly big data analysis strategy roadmap infographics. You can alternate the color, font size, font type, and shapes of this PPT layout according to your strategic process. This PPT presentation is compatible with Google Slides and is available in both standard screen and widescreen aspect ratios. You can also download this well-researched PowerPoint template design in different formats like PDF, JPG, and PNG. So utilize this visually-appealing design by clicking the download button given below.
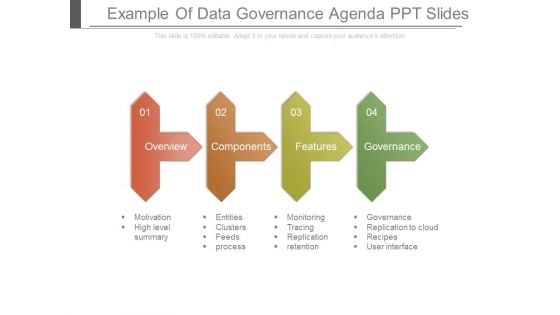
Example Of Data Governance Agenda Ppt Slides
This is a example of data governance agenda ppt slides. This is a four stage process. The stages in this process are overview, components, features, governance, motivation, high level summary, entities, clusters, feeds, process, monitoring, tracing, replication, retention, replication to cloud, recipes, user interface.
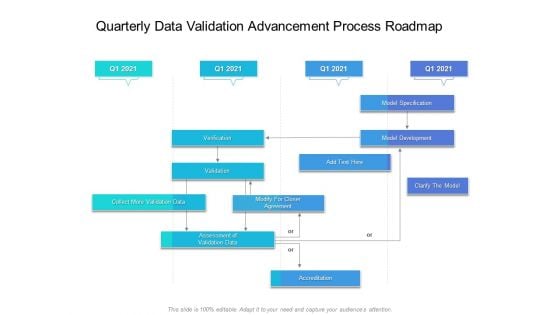
Quarterly Data Validation Advancement Process Roadmap Rules
Presenting our innovatively-structured quarterly data validation advancement process roadmap rules Template. Showcase your roadmap process in different formats like PDF, PNG, and JPG by clicking the download button below. This PPT design is available in both Standard Screen and Widescreen aspect ratios. It can also be easily personalized and presented with modified font size, font type, color, and shapes to measure your progress in a clear way.
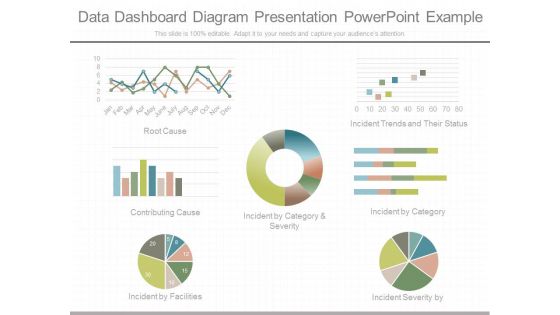
Data Dashboard Diagram Presentation Powerpoint Example
This is a data dashboard diagram presentation powerpoint example. This is a seven stage process. The stages in this process are root cause, incident trends and their status, contributing cause, incident by category and severity, incident by category, incident by facilities, incident severity by.
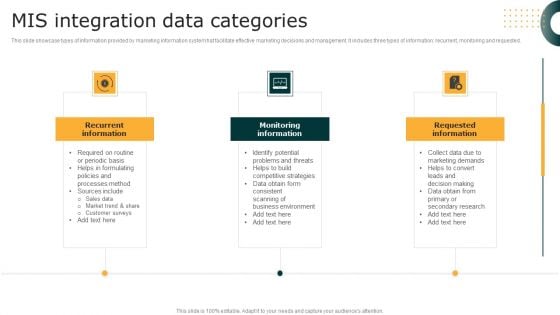
MIS Integration Data Categories Clipart PDF
This slide showcase types of information provided by marketing information system hat facilitate effective marketing decisions and management. It includes three types of information recurrent, monitoring and requested. Persuade your audience using this MIS Integration Data Categories Clipart PDF. This PPT design covers three stages, thus making it a great tool to use. It also caters to a variety of topics including Monitoring Information, Requested Information, Recurrent Information. Download this PPT design now to present a convincing pitch that not only emphasizes the topic but also showcases your presentation skills.
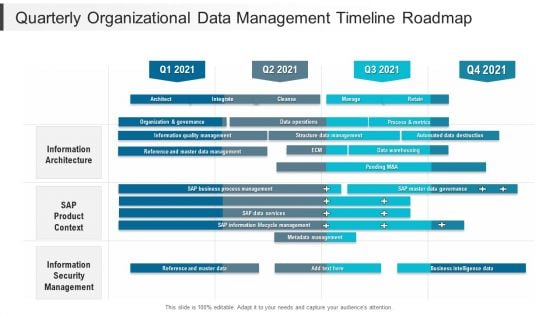
Quarterly Organizational Data Management Timeline Roadmap Pictures
Introducing our quarterly organizational data management timeline roadmap pictures. This PPT presentation is Google Slides compatible, therefore, you can share it easily with the collaborators for measuring the progress. Also, the presentation is available in both standard screen and widescreen aspect ratios. So edit the template design by modifying the font size, font type, color, and shapes as per your requirements. As this PPT design is fully editable it can be presented in PDF, JPG and PNG formats.
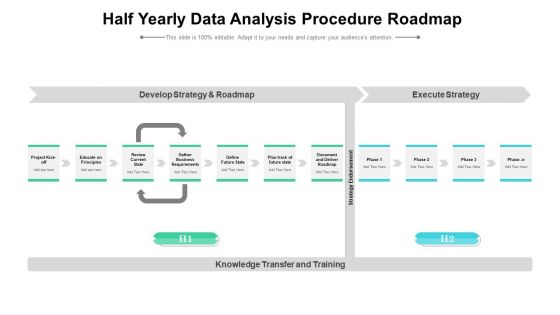
Half Yearly Data Analysis Procedure Roadmap Formats
Presenting our innovatively structured half yearly data analysis procedure roadmap formats Template. Showcase your roadmap process in different formats like PDF, PNG, and JPG by clicking the download button below. This PPT design is available in both Standard Screen and Widescreen aspect ratios. It can also be easily personalized and presented with modified font size, font type, color, and shapes to measure your progress in a clear way.
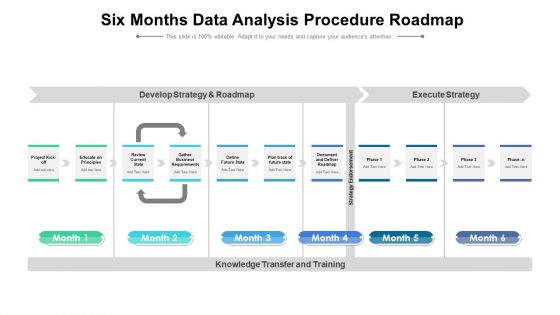
Six Months Data Analysis Procedure Roadmap Topics
Presenting our innovatively structured six months data analysis procedure roadmap topics Template. Showcase your roadmap process in different formats like PDF, PNG, and JPG by clicking the download button below. This PPT design is available in both Standard Screen and Widescreen aspect ratios. It can also be easily personalized and presented with modified font size, font type, color, and shapes to measure your progress in a clear way.
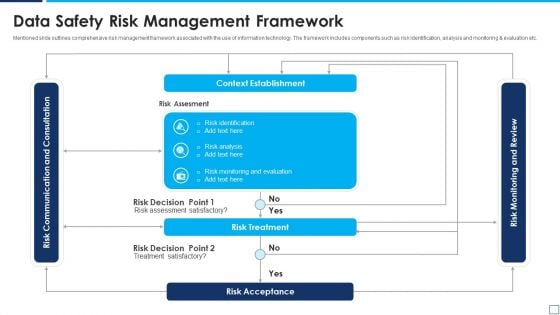
Data Safety Risk Management Framework Inspiration PDF
Mentioned slide outlines comprehensive risk management framework associated with the use of information technology. The framework includes components such as risk identification, analysis and monitoring and evaluation etc. Showcasing this set of slides titled data safety risk management framework inspiration pdf. The topics addressed in these templates are context establishment, risk treatment, risk acceptance. All the content presented in this PPT design is completely editable. Download it and make adjustments in color, background, font etc. as per your unique business setting.
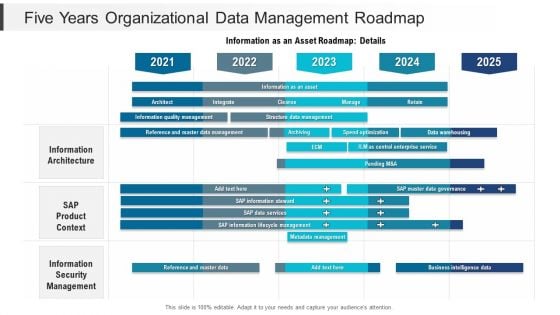
Five Years Organizational Data Management Roadmap Introduction
Introducing our five years organizational data management roadmap introduction. This PPT presentation is Google Slides compatible, therefore, you can share it easily with the collaborators for measuring the progress. Also, the presentation is available in both standard screen and widescreen aspect ratios. So edit the template design by modifying the font size, font type, color, and shapes as per your requirements. As this PPT design is fully editable it can be presented in PDF, JPG and PNG formats.
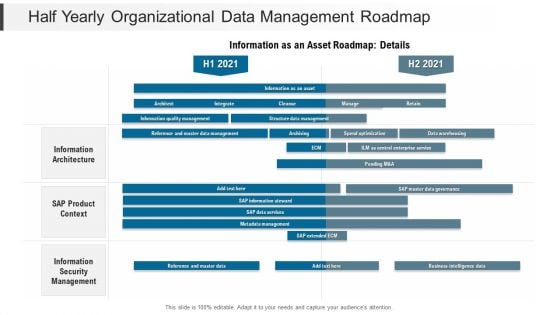
Half Yearly Organizational Data Management Roadmap Introduction
Introducing our half yearly organizational data management roadmap introduction. This PPT presentation is Google Slides compatible, therefore, you can share it easily with the collaborators for measuring the progress. Also, the presentation is available in both standard screen and widescreen aspect ratios. So edit the template design by modifying the font size, font type, color, and shapes as per your requirements. As this PPT design is fully editable it can be presented in PDF, JPG and PNG formats.
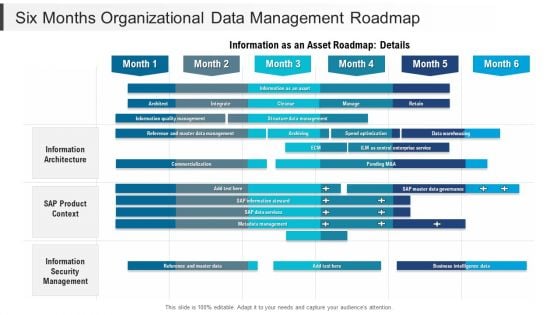
Six Months Organizational Data Management Roadmap Ideas
Introducing our six months organizational data management roadmap ideas. This PPT presentation is Google Slides compatible, therefore, you can share it easily with the collaborators for measuring the progress. Also, the presentation is available in both standard screen and widescreen aspect ratios. So edit the template design by modifying the font size, font type, color, and shapes as per your requirements. As this PPT design is fully editable it can be presented in PDF, JPG and PNG formats.
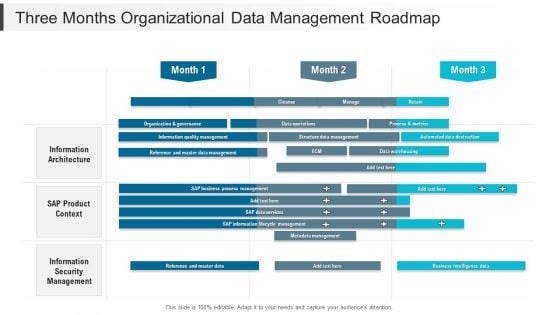
Three Months Organizational Data Management Roadmap Portrait
Introducing our three months organizational data management roadmap portrait. This PPT presentation is Google Slides compatible, therefore, you can share it easily with the collaborators for measuring the progress. Also, the presentation is available in both standard screen and widescreen aspect ratios. So edit the template design by modifying the font size, font type, color, and shapes as per your requirements. As this PPT design is fully editable it can be presented in PDF, JPG and PNG formats.
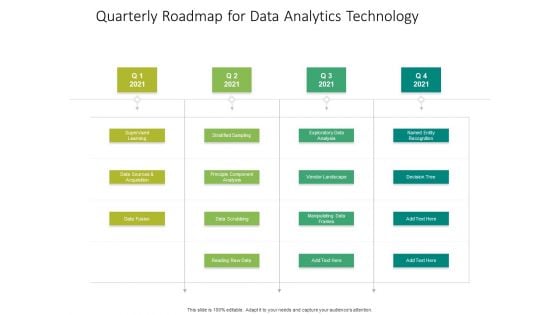
Quarterly Roadmap For Data Analytics Technology Slides
Presenting our jaw-dropping quarterly roadmap for data analytics technology slides. You can alternate the color, font size, font type, and shapes of this PPT layout according to your strategic process. This PPT presentation is compatible with Google Slides and is available in both standard screen and widescreen aspect ratios. You can also download this well-researched PowerPoint template design in different formats like PDF, JPG, and PNG. So utilize this visually-appealing design by clicking the download button given below.
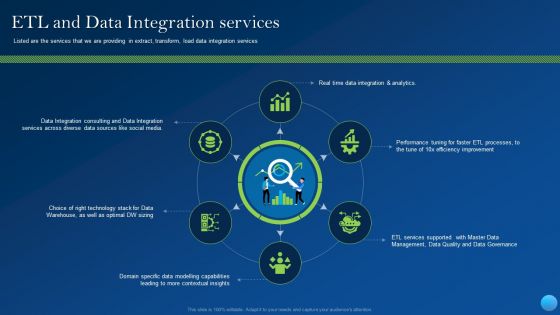
ETL And Data Integration Services Introduction PDF
This is a etl and data integration services introduction pdf template with various stages. Focus and dispense information on six stages using this creative set, that comes with editable features. It contains large content boxes to add your information on topics like services across diverse, choice of right technology, domain specific. You can also showcase facts, figures, and other relevant content using this PPT layout. Grab it now.
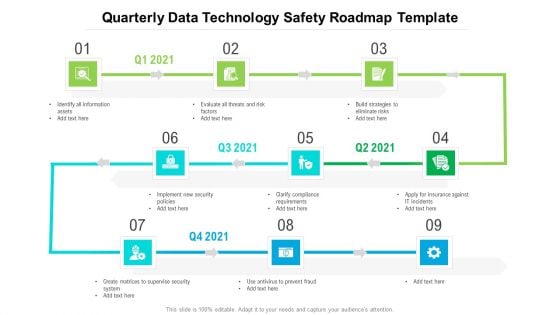
Quarterly Data Technology Safety Roadmap Template Guidelines
Presenting our jaw dropping quarterly data technology safety roadmap template guidelines. You can alternate the color, font size, font type, and shapes of this PPT layout according to your strategic process. This PPT presentation is compatible with Google Slides and is available in both standard screen and widescreen aspect ratios. You can also download this well researched PowerPoint template design in different formats like PDF, JPG, and PNG. So utilize this visually appealing design by clicking the download button given below.
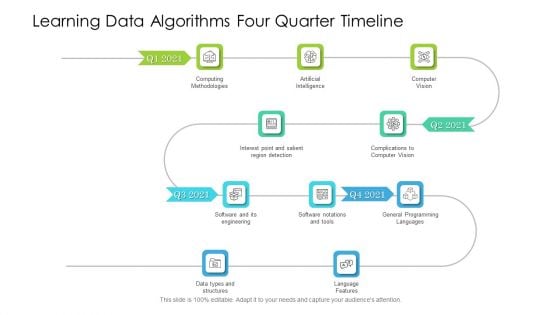
Learning Data Algorithms Four Quarter Timeline Brochure
Presenting our innovatively structured learning data algorithms four quarter timeline brochure Template. Showcase your roadmap process in different formats like PDF, PNG, and JPG by clicking the download button below. This PPT design is available in both Standard Screen and Widescreen aspect ratios. It can also be easily personalized and presented with modified font size, font type, color, and shapes to measure your progress in a clear way.
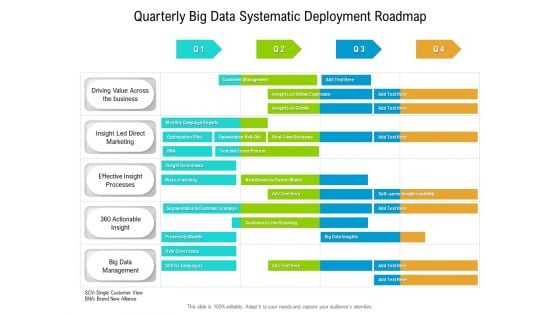
Quarterly Big Data Systematic Deployment Roadmap Diagrams
Presenting our innovatively-structured quarterly big data systematic deployment roadmap diagrams Template. Showcase your roadmap process in different formats like PDF, PNG, and JPG by clicking the download button below. This PPT design is available in both Standard Screen and Widescreen aspect ratios. It can also be easily personalized and presented with modified font size, font type, color, and shapes to measure your progress in a clear way.
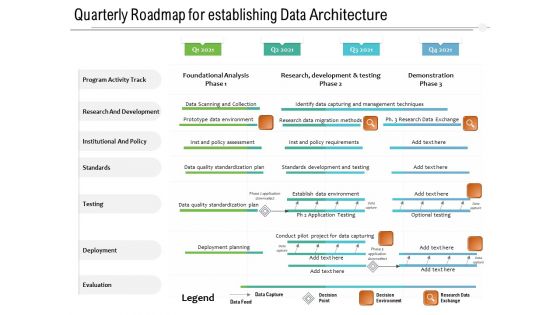
Quarterly Roadmap For Establishing Data Architecture Download
Presenting our jaw dropping quarterly roadmap for establishing data architecture download. You can alternate the color, font size, font type, and shapes of this PPT layout according to your strategic process. This PPT presentation is compatible with Google Slides and is available in both standard screen and widescreen aspect ratios. You can also download this well researched PowerPoint template design in different formats like PDF, JPG, and PNG. So utilize this visually appealing design by clicking the download button given below.
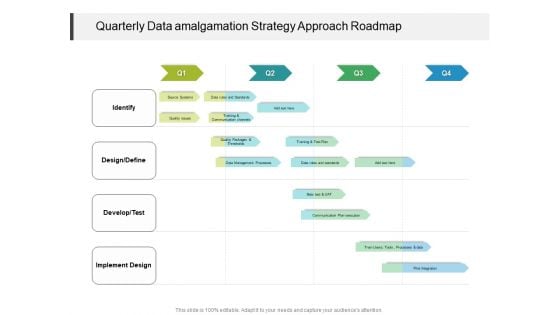
Quarterly Data Amalgamation Strategy Approach Roadmap Themes
Presenting our innovatively structured quarterly data amalgamation strategy approach roadmap themes Template. Showcase your roadmap process in different formats like PDF, PNG, and JPG by clicking the download button below. This PPT design is available in both Standard Screen and Widescreen aspect ratios. It can also be easily personalized and presented with modified font size, font type, color, and shapes to measure your progress in a clear way.
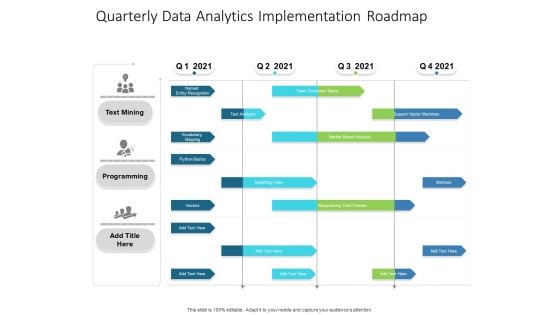
Quarterly Data Analytics Implementation Roadmap Pictures
Presenting our innovatively-structured quarterly data analytics implementation roadmap pictures Template. Showcase your roadmap process in different formats like PDF, PNG, and JPG by clicking the download button below. This PPT design is available in both Standard Screen and Widescreen aspect ratios. It can also be easily personalized and presented with modified font size, font type, color, and shapes to measure your progress in a clear way.
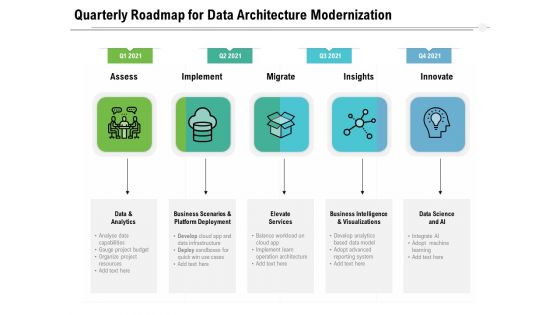
Quarterly Roadmap For Data Architecture Modernization Guidelines
Presenting our innovatively structured quarterly roadmap for data architecture modernization guidelines Template. Showcase your roadmap process in different formats like PDF, PNG, and JPG by clicking the download button below. This PPT design is available in both Standard Screen and Widescreen aspect ratios. It can also be easily personalized and presented with modified font size, font type, color, and shapes to measure your progress in a clear way.
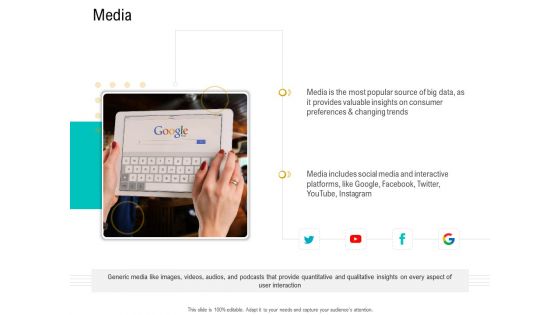
Business Data Analysis Media Themes PDF
This is a business data analysis media themes pdf template with various stages. Focus and dispense information on one stage using this creative set, that comes with editable features. It contains large content boxes to add your information on topics like media is the most popular source of big data, as it provides valuable insights on consumer preferences and changing trends, media includes social media and interactive platforms, like google, facebook, twitter, youtube, instagram. You can also showcase facts, figures, and other relevant content using this PPT layout. Grab it now.
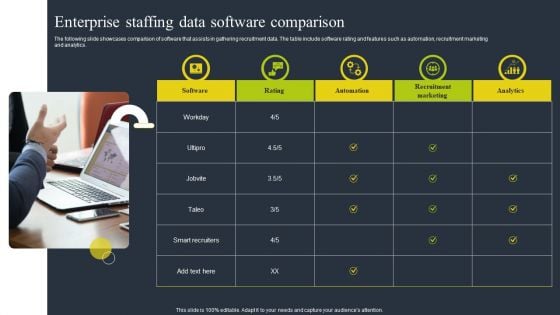
Enterprise Staffing Data Software Comparison Professional PDF
The following slide showcases comparison of software that assists in gathering recruitment data. The table include software rating and features such as automation, recruitment marketing and analytics. Persuade your audience using this Enterprise Staffing Data Software Comparison Professional PDF. This PPT design covers five stages, thus making it a great tool to use. It also caters to a variety of topics including Automation, Recruitment Marketing, Analytics. Download this PPT design now to present a convincing pitch that not only emphasizes the topic but also showcases your presentation skills.
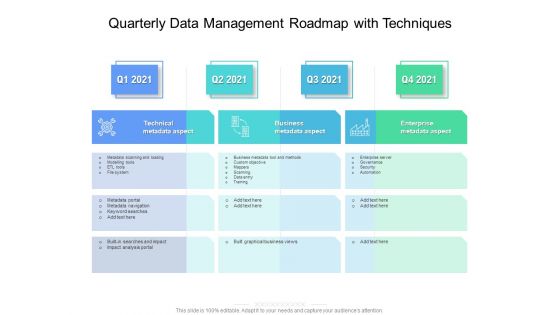
Quarterly Data Management Roadmap With Techniques Elements
Presenting the quarterly data management roadmap with techniques elements. The template includes a roadmap that can be used to initiate a strategic plan. Not only this, the PowerPoint slideshow is completely editable and you can effortlessly modify the font size, font type, and shapes according to your needs. This PPT slide can be easily reached in standard screen and widescreen aspect ratios. The set is also available in various formats like PDF, PNG, and JPG. So download and use it multiple times as per your knowledge.
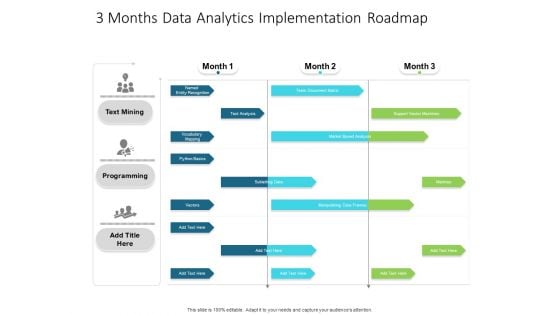
3 Months Data Analytics Implementation Roadmap Elements
Presenting our innovatively-structured 3 months data analytics implementation roadmap elements Template. Showcase your roadmap process in different formats like PDF, PNG, and JPG by clicking the download button below. This PPT design is available in both Standard Screen and Widescreen aspect ratios. It can also be easily personalized and presented with modified font size, font type, color, and shapes to measure your progress in a clear way.
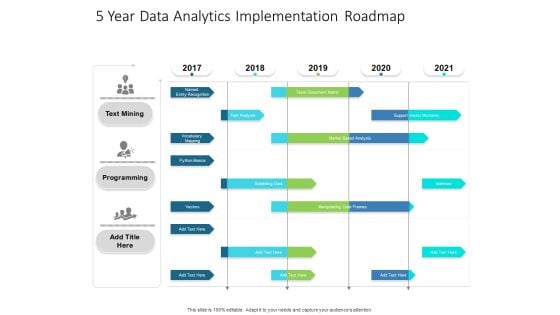
5 Year Data Analytics Implementation Roadmap Topics
Presenting our innovatively-structured 5 year data analytics implementation roadmap topics Template. Showcase your roadmap process in different formats like PDF, PNG, and JPG by clicking the download button below. This PPT design is available in both Standard Screen and Widescreen aspect ratios. It can also be easily personalized and presented with modified font size, font type, color, and shapes to measure your progress in a clear way.
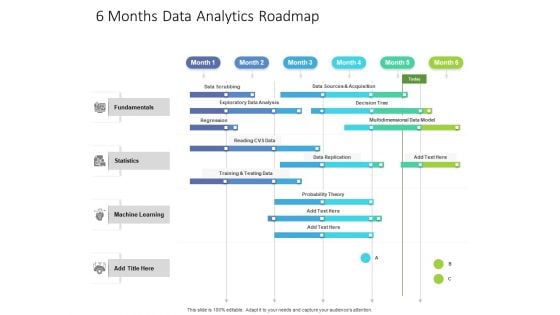
6 Months Data Analytics Roadmap Diagrams
Presenting our innovatively-structured 6 months data analytics roadmap diagrams Template. Showcase your roadmap process in different formats like PDF, PNG, and JPG by clicking the download button below. This PPT design is available in both Standard Screen and Widescreen aspect ratios. It can also be easily personalized and presented with modified font size, font type, color, and shapes to measure your progress in a clear way.
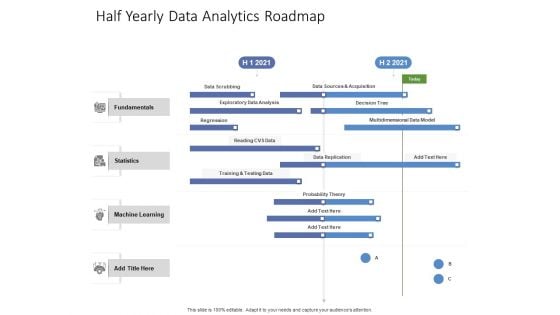
Half Yearly Data Analytics Roadmap Ideas
Presenting our innovatively-structured half yearly data analytics roadmap ideas Template. Showcase your roadmap process in different formats like PDF, PNG, and JPG by clicking the download button below. This PPT design is available in both Standard Screen and Widescreen aspect ratios. It can also be easily personalized and presented with modified font size, font type, color, and shapes to measure your progress in a clear way.
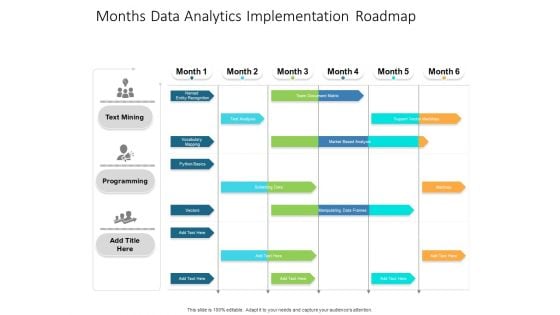
Months Data Analytics Implementation Roadmap Structure
Presenting our jaw-dropping months data analytics implementation roadmap structure. You can alternate the color, font size, font type, and shapes of this PPT layout according to your strategic process. This PPT presentation is compatible with Google Slides and is available in both standard screen and widescreen aspect ratios. You can also download this well-researched PowerPoint template design in different formats like PDF, JPG, and PNG. So utilize this visually-appealing design by clicking the download button given below.
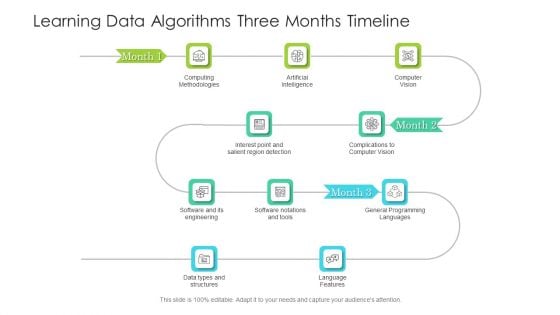
Learning Data Algorithms Three Months Timeline Mockup
Presenting our jaw dropping learning data algorithms three months timeline mockup. You can alternate the color, font size, font type, and shapes of this PPT layout according to your strategic process. This PPT presentation is compatible with Google Slides and is available in both standard screen and widescreen aspect ratios. You can also download this well researched PowerPoint template design in different formats like PDF, JPG, and PNG. So utilize this visually appealing design by clicking the download button given below.
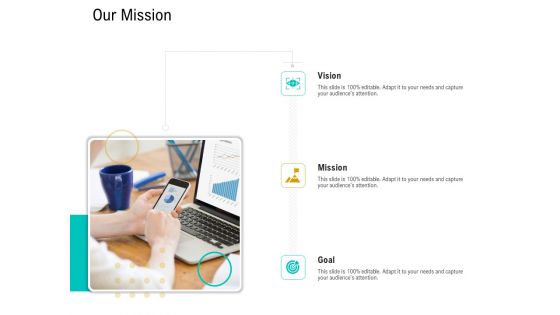
Business Data Analysis Our Mission Inspiration PDF
Presenting business data analysis our mission inspiration pdf to provide visual cues and insights. Share and navigate important information on one stage that need your due attention. This template can be used to pitch topics like vision, mission, goal. In addtion, this PPT design contains high resolution images, graphics, etc, that are easily editable and available for immediate download.
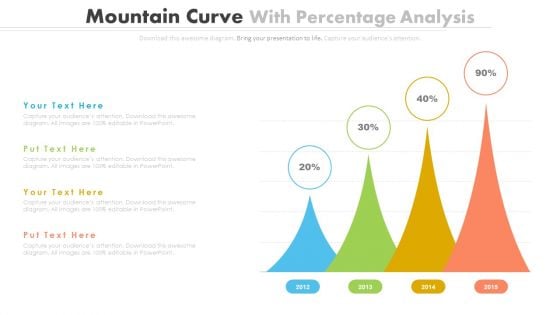
Percentage Data Growth Chart Powerpoint Slides
This PowerPoint template has been designed with percentage data growth chart. Download this PPT chart to depict financial ratio analysis. This PowerPoint slide is of great help in the business sector to make realistic presentations and provides effective way of presenting your newer thoughts.
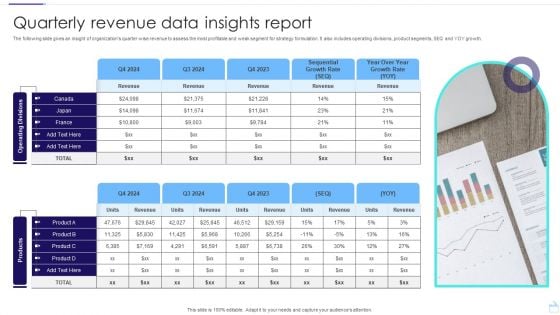
Quarterly Revenue Data Insights Report Template PDF
The following slide gives an insight of organizations quarter wise revenue to assess the most profitable and weak segment for strategy formulation. It also includes operating divisions, product segments, SEQ and YOY growth. Showcasing this set of slides titled Quarterly Revenue Data Insights Report Template PDF. The topics addressed in these templates are Operating, Divisions products, Insights Report. All the content presented in this PPT design is completely editable. Download it and make adjustments in color, background, font etc. as per your unique business setting.
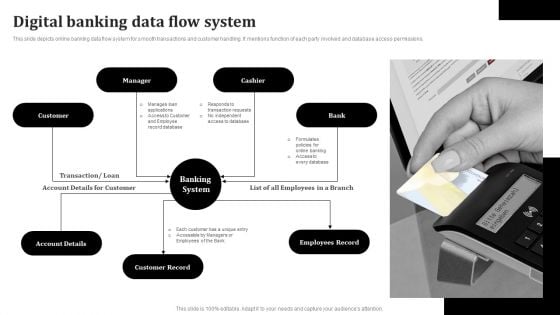
Digital Banking Data Flow System Template PDF
This slide depicts online banking data flow system for smooth transactions and customer handling. It mentions function of each party involved and database access permissions. Persuade your audience using this Digital Banking For Financial Management Icon Information PDF. This PPT design covers Seven stages, thus making it a great tool to use. It also caters to a variety of topics including Manager, Cashier, Banking System, Employees Record. Download this PPT design now to present a convincing pitch that not only emphasizes the topic but also showcases your presentation skills.
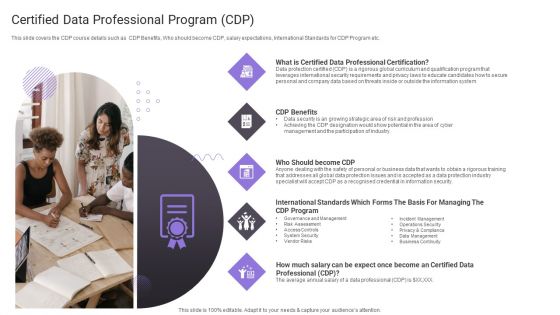
Certified Data Professional Program CDP Portrait PDF
This slide covers the CDP course details such as CDP Benefits, Who should become CDP, salary expectations, International Standards for CDP Program etc.This is a Certified Data Professional Program CDP Portrait PDF template with various stages. Focus and dispense information on five stages using this creative set, that comes with editable features. It contains large content boxes to add your information on topics like Professional Certification, International Standards, Governance And Management . You can also showcase facts, figures, and other relevant content using this PPT layout. Grab it now.
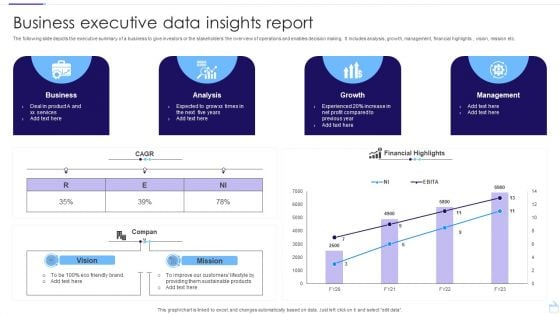
Business Executive Data Insights Report Pictures PDF
The following slide depicts the executive summary of a business to give investors or the stakeholders the overview of operations and enables decision making. It includes analysis, growth, management, financial highlights , vision, mission etc. Pitch your topic with ease and precision using this Business Executive Data Insights Report Pictures PDF. This layout presents information on Business, Analysis, Growth. It is also available for immediate download and adjustment. So, changes can be made in the color, design, graphics or any other component to create a unique layout.
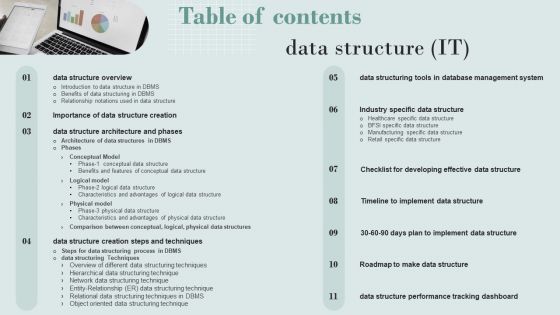
Table Of Contents Data Structure Portrait PDF
Take your projects to the next level with our ultimate collection of Table Of Contents Data Structure Portrait PDF. Slidegeeks has designed a range of layouts that are perfect for representing task or activity duration, keeping track of all your deadlines at a glance. Tailor these designs to your exact needs and give them a truly corporate look with your own brand colors they will make your projects stand out from the rest.
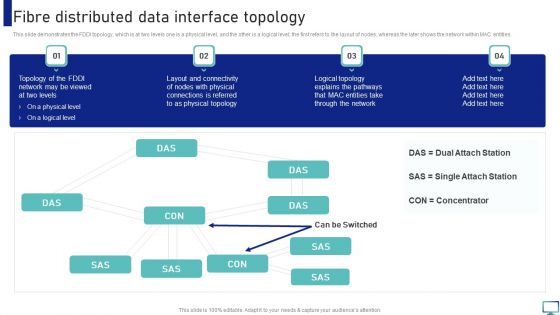
Fibre Distributed Data Interface Topology Slides PDF
This slide demonstrates the FDDI topology, which is at two levels one is a physical level, and the other is a logical level the first refers to the layout of nodes, whereas the later shows the network within MAC entities. This Fibre Distributed Data Interface Topology Slides PDF from Slidegeeks makes it easy to present information on your topic with precision. It provides customization options, so you can make changes to the colors, design, graphics, or any other component to create a unique layout. It is also available for immediate download, so you can begin using it right away. Slidegeeks has done good research to ensure that you have everything you need to make your presentation stand out. Make a name out there for a brilliant performance.
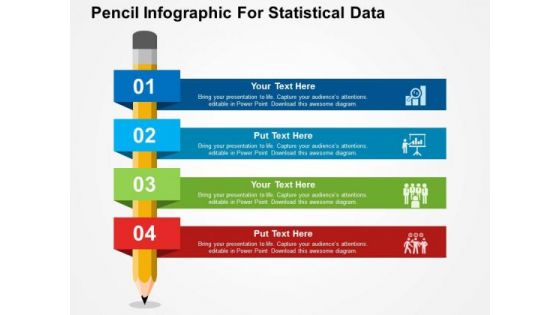
Pencil Infographic For Statistical Data PowerPoint Templates
Create dynamic presentations with our professional template containing pencil infographic. This diagram helps to present statistical data. Great impact can be created on the viewer easily with the help of this business template.
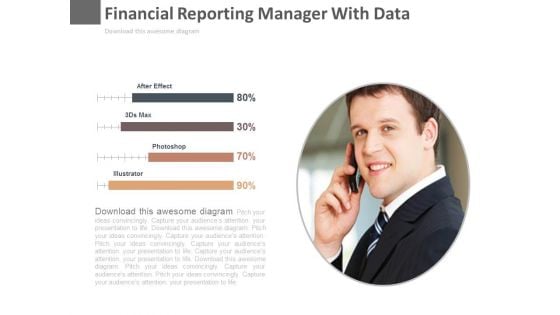
Financial Reporting Manager With Data Powerpoint Slides
This PowerPoint template has been designed with graphics of finance manager and percentage data. This diagram is useful to exhibit financial management. This diagram slide can be used to make impressive presentations.
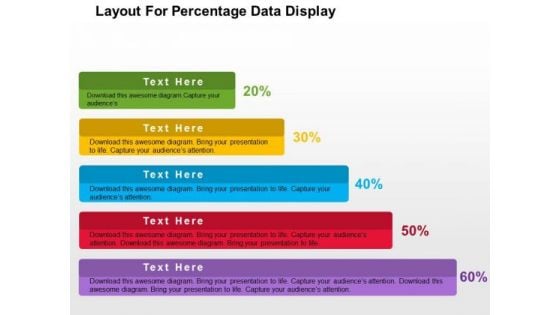
Layout For Precentage Data Display PowerPoint Template
Growth analysis for business can be defined with this business diagram. This slide depicts text boxes in increasing flow. Present your views using this innovative slide and be assured of leaving a lasting impression
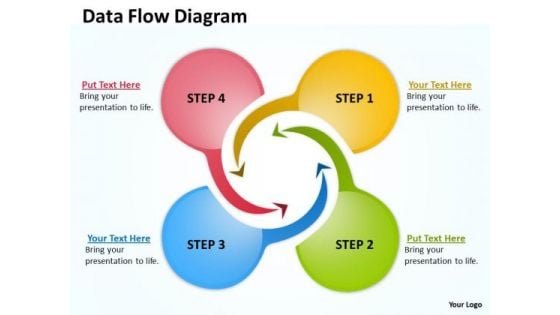
Marketing Diagram Data Flow Diagram Consulting Diagram
Open Up Doors That Lead To Success. Our Marketing_Diagram_Data_Flow_Diagram_Consulting_Diagram Powerpoint Templates Provide The Handles.
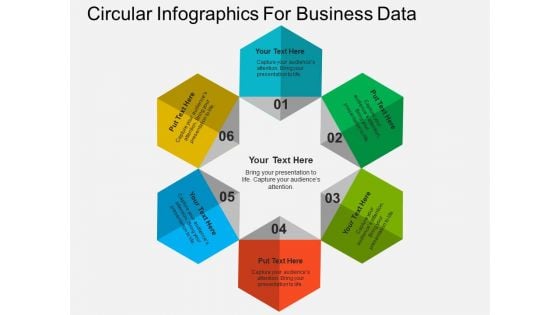
Circular Infographics For Business Data Powerpoint Templates
This PowerPoint diagram slide contains circular infographic. Download this diagram slide to display six steps of business process. You can edit text, color, shade and style of this diagram as per you need.


 Continue with Email

 Home
Home


