Data Presentation

Data Warehousing Review Ppt Presentation
This is a data warehousing review ppt presentation. This is a four stage process. The stages in this process are olttp server, meta data responsibility, pre data ware house, etl, data cleansing, data warehouse, data mart, data mart, ods, data repositories, opal, data mining, data visualization, reporting, front end analytics.
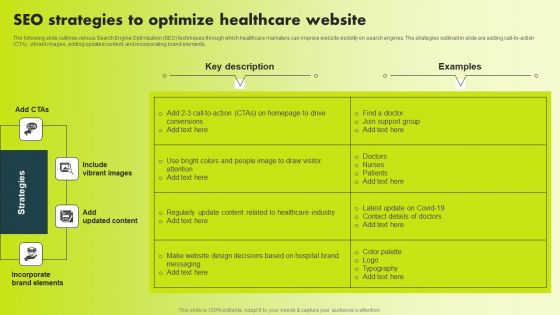
SEO Strategies To Optimize Healthcare Website Infographics PDF
The following slide outlines various Search Engine Optimization SEO techniques through which healthcare marketers can improve website visibility on search engines. The strategies outlined in slide are adding call-to-action CTA, vibrant images, adding updated content, and incorporating brand elements. Create an editable SEO Strategies To Optimize Healthcare Website Infographics PDF that communicates your idea and engages your audience. Whether you are presenting a business or an educational presentation, pre-designed presentation templates help save time. SEO Strategies To Optimize Healthcare Website Infographics PDF is highly customizable and very easy to edit, covering many different styles from creative to business presentations. Slidegeeks has creative team members who have crafted amazing templates. So, go and get them without any delay.
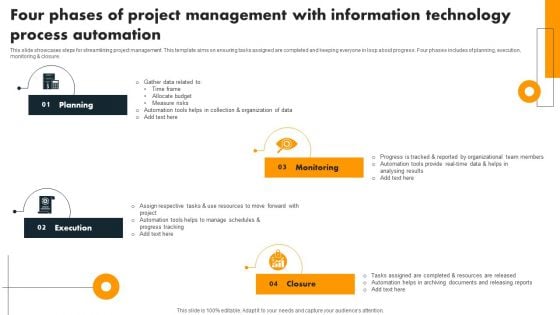
Four Phases Of Project Management With Information Technology Process Automation Microsoft PDF
This slide showcases steps for streamlining project management. This template aims on ensuring tasks assigned are completed and keeping everyone in loop about progress. Four phases includes of planning, execution, monitoring and closure. Presenting Four Phases Of Project Management With Information Technology Process Automation Microsoft PDF to dispense important information. This template comprises four stages. It also presents valuable insights into the topics including Planning, Monitoring, Execution. This is a completely customizable PowerPoint theme that can be put to use immediately. So, download it and address the topic impactfully.
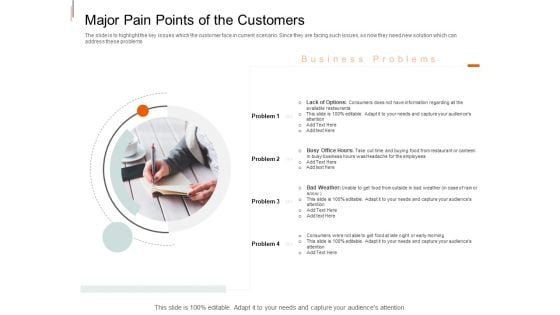
Equity Crowd Investing Major Pain Points Of The Customers Ppt File Samples PDF
The slide is to highlight the key issues which the customer face in current scenario. Since they are facing such issues, so now they need new solution which can address these problems. Presenting equity crowd investing major pain points of the customers ppt file samples pdf to provide visual cues and insights. Share and navigate important information on four stages that need your due attention. This template can be used to pitch topics like employees, business, consumers, time. In addtion, this PPT design contains high resolution images, graphics, etc, that are easily editable and available for immediate download.
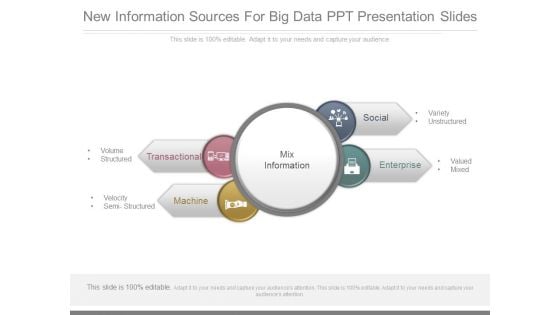
New Information Sources For Big Data Ppt Presentation Slides
This is a new information sources for big data ppt presentation slides. This is a four stage process. The stages in this process are mix information, transactional, machine, social, enterprise, volume, structured, velocity, semi structured, variety, unstructured, valued, mixed.
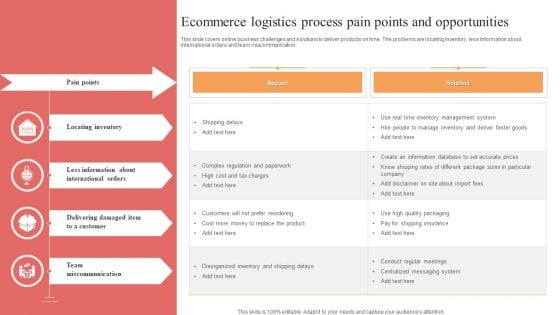
Ecommerce Logistics Process Pain Points And Opportunities Rules PDF
This slide covers online business challenges and solutions to deliver products on time. The problems are locating inventory, less information about international orders and team miscommunication. Persuade your audience using this Ecommerce Logistics Process Pain Points And Opportunities Rules PDF. This PPT design covers Fourstages, thus making it a great tool to use. It also caters to a variety of topics including Locating Inventory, Team Miscommunication, Less Information. Download this PPT design now to present a convincing pitch that not only emphasizes the topic but also showcases your presentation skills.
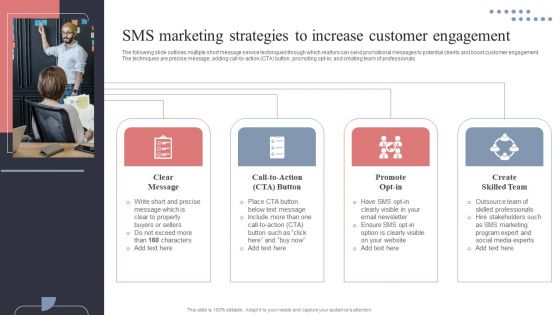
SMS Marketing Strategies To Increase Customer Engagement Slides PDF
The following slide outlines multiple short message service techniques through which realtors can send promotional messages to potential clients and boost customer engagement. The techniques are precise message, adding call-to-action CTA button, promoting opt-in, and creating team of professionals. Slidegeeks is one of the best resources for PowerPoint templates. You can download easily and regulate SMS Marketing Strategies To Increase Customer Engagement Slides PDF for your personal presentations from our wonderful collection. A few clicks is all it takes to discover and get the most relevant and appropriate templates. Use our Templates to add a unique zing and appeal to your presentation and meetings. All the slides are easy to edit and you can use them even for advertisement purposes.
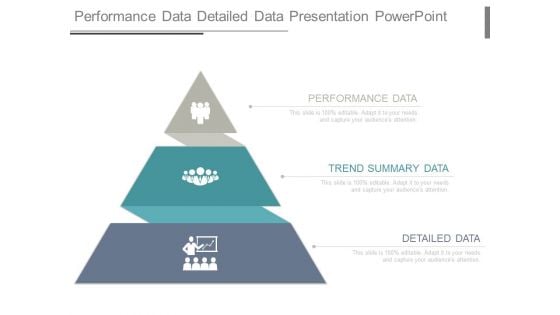
Performance Data Detailed Data Presentation Powerpoint
This is a performance data detailed data presentation powerpoint. This is a three stage process. The stages in this process are performance data, trend summary data, detailed data.
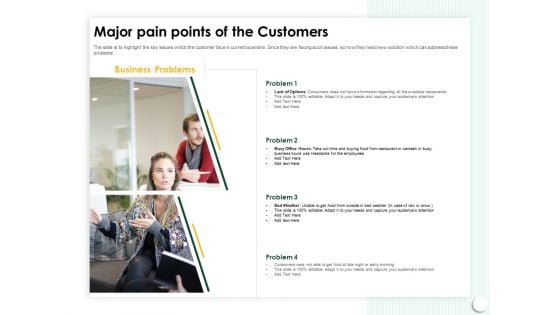
Startup Presentation For Collaborative Capital Funding Major Pain Points Of The Customers Ppt Model Slide Download PDF
Presenting this set of slides with name startup presentation for collaborative capital funding major pain points of the customers ppt model slide download pdf. This is a four stage process. The stages in this process are consumers, information, business problems, employees. This is a completely editable PowerPoint presentation and is available for immediate download. Download now and impress your audience.
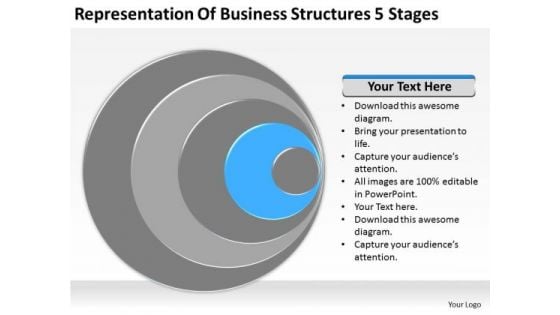
Representation Of Business Structures 5 Stages Plan Marketing PowerPoint Templates
We present our representation of business structures 5 stages plan marketing PowerPoint templates.Download and present our Process and Flows PowerPoint Templates because It can Leverage your style with our PowerPoint Templates and Slides. Charm your audience with your ability. Download and present our Shapes PowerPoint Templates because You should Bet on your luck with our PowerPoint Templates and Slides. Be assured that you will hit the jackpot. Use our Business PowerPoint Templates because Our PowerPoint Templates and Slides are aesthetically designed to attract attention. We gaurantee that they will grab all the eyeballs you need. Download our Circle Charts PowerPoint Templates because Our PowerPoint Templates and Slides are aesthetically designed to attract attention. We gaurantee that they will grab all the eyeballs you need. Download and present our Marketing PowerPoint Templates because Our PowerPoint Templates and Slides offer you the widest possible range of options.Use these PowerPoint slides for presentations relating to Diagram, process, catalog, graph, network, business, vector, report, abstract, website, statistics, item, junction, differentiate,corporate, plan, presentation, circle, brochure, multicolor, marketing, different, representational, management, multicolored, modern, illustration, sphere,options, strategy, segments, schematic, tab, company, information, navigation, structure, parts. The prominent colors used in the PowerPoint template are Blue light, White, Gray. Knit a great story with our Representation Of Business Structures 5 Stages Plan Marketing PowerPoint Templates. Make sure your presentation gets the attention it deserves.
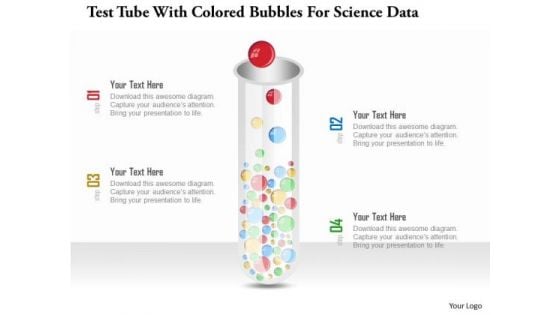
Business Diagram Test Tube With Colored Bubbles For Science Data Presentation Template
Test tubes with colored bubbles are used to design this power point template slide. This PPt slide contains the concept of science data analysis. Use this PPT slide for your business and science related presentations.
Green Eco House With Four Bullet Points Ppt Powerpoint Presentation Slide
This is a green eco house with four bullet points ppt powerpoint presentation slide. This is a four stage process. The stages in this process are green factory, eco friendly factory, green manufacturing.
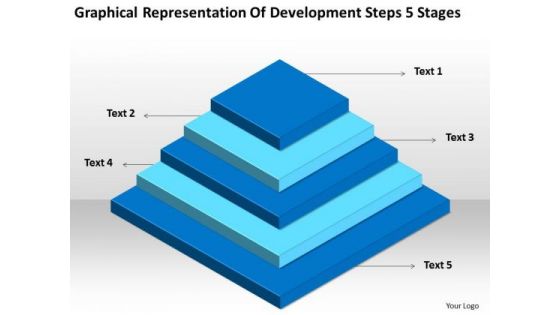
Development Steps 5 Stages Ppt How To Form Business Plan PowerPoint Templates
We present our development steps 5 stages ppt how to form business plan PowerPoint templates.Download and present our Business PowerPoint Templates because Our PowerPoint Templates and Slides will steer your racing mind. Hit the right buttons and spur on your audience. Download our Process and Flows PowerPoint Templates because You can Hit a home run with our PowerPoint Templates and Slides. See your ideas sail into the minds of your audience. Present our Success PowerPoint Templates because It can Leverage your style with our PowerPoint Templates and Slides. Charm your audience with your ability. Use our Flow Charts PowerPoint Templates because Our PowerPoint Templates and Slides are the chords of your song. String them along and provide the lilt to your views. Present our Shapes PowerPoint Templates because Our PowerPoint Templates and Slides will effectively help you save your valuable time. They are readymade to fit into any presentation structure. Use these PowerPoint slides for presentations relating to Abstract, background, business, chart, concept, conceptual, design, diagram, graph, graphic, growth, hierarchy, illustration, information, internet, isolated, item, presentation, pyramid, render, shadow, shape, sign, simple, template, web, website, white . The prominent colors used in the PowerPoint template are Blue, Blue light, Black. Figure out the finances with our Development Steps 5 Stages Ppt How To Form Business Plan PowerPoint Templates. They help you get the calculations correct.
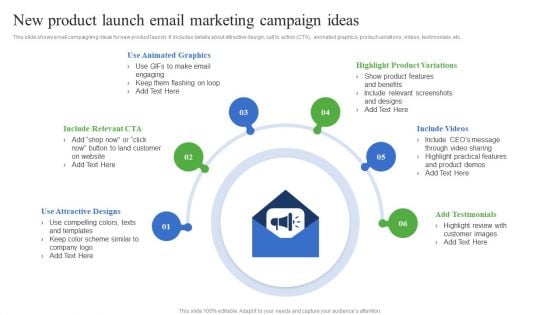
New Product Launch Email Marketing Campaign Ideas Mockup PDF
This slide shows email campaigning ideas for new product launch. It includes details about attractive design, call to action CTA, animated graphics, product variations, videos, testimonials, etc. Presenting New Product Launch Email Marketing Campaign Ideas Mockup PDF to dispense important information. This template comprises Six stages. It also presents valuable insights into the topics including Use Attractive Designs, Highlight Product Variations, Use Animated Graphics. This is a completely customizable PowerPoint theme that can be put to use immediately. So, download it and address the topic impactfully.
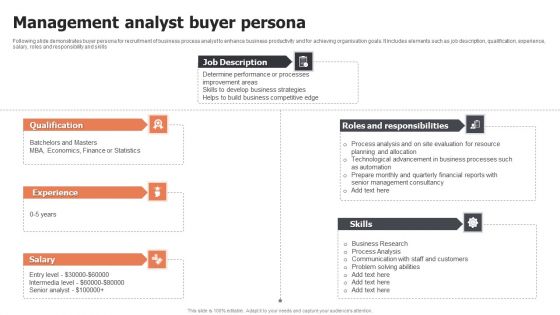
Management Analyst Buyer Persona Ppt Inspiration Professional PDF
Following slide demonstrates buyer persona for recruitment of business process analyst to enhance business productivity and for achieving organisation goals. It includes elements such as job description, qualification, experience, salary, roles and responsibility and skills. Pitch your topic with ease and precision using this Management Analyst Buyer Persona Ppt Inspiration Professional PDF. This layout presents information on Qualification, Experience, Salary, Roles And Responsibilities . It is also available for immediate download and adjustment. So, changes can be made in the color, design, graphics or any other component to create a unique layout.
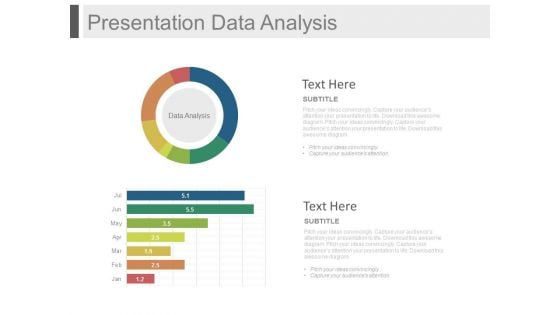
Presentation Data Analysis Ppt Slides
This is a presentation data analysis ppt slides. This is a two stage process. The stages in this process are business, finance, marketing.

Professional Qualifications Ppt PowerPoint Presentation Gallery Samples
This is a professional qualifications ppt powerpoint presentation gallery samples. This is a four stage process. The stages in this process are business, icons, marketing, strategy, analysis.

Playbook For Advancing Technology Through Digital Services Ppt PowerPoint Presentation Complete Deck With Slides
This Playbook For Advancing Technology Through Digital Services Ppt PowerPoint Presentation Complete Deck With Slides is designed to help you retain your audiences attention. This content-ready PowerPoint Template enables you to take your audience on a journey and share information in a way that is easier to recall. It helps you highlight the crucial parts of your work so that the audience does not get saddled with information download. This fifty four slide PPT Deck comes prepared with the graphs and charts you could need to showcase your information through visuals. You only need to enter your own data in them. Download this editable PowerPoint Theme and walk into that meeting with confidence.
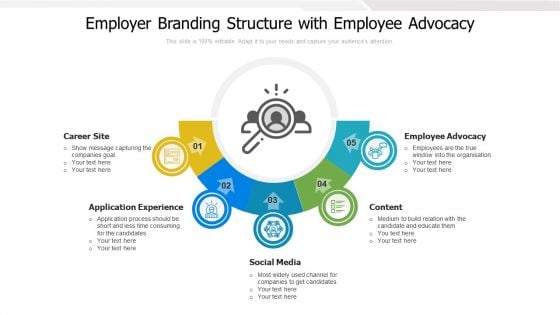
Employer Branding Structure With Employee Advocacy Ppt Summary File Formats PDF
Presenting employer branding structure with employee advocacy ppt summary file formats pdf. to dispense important information. This template comprises five stages. It also presents valuable insights into the topics including application experience, social media, employee advocacy. This is a completely customizable PowerPoint theme that can be put to use immediately. So, download it and address the topic impactfully.
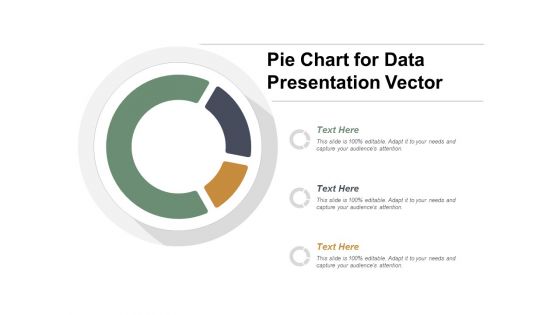
Pie Chart For Data Presentation Vector Ppt Powerpoint Presentation Summary Display
This is a pie chart for data presentation vector ppt powerpoint presentation summary display. This is a three stage process. The stages in this process are data visualization icon, data management icon.
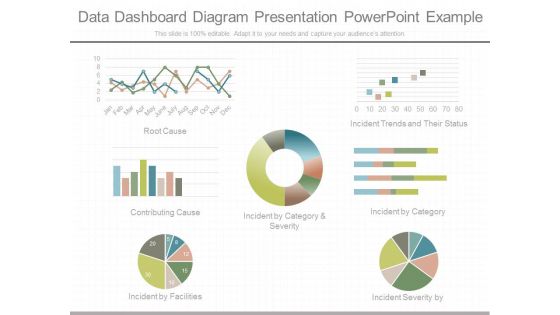
Data Dashboard Diagram Presentation Powerpoint Example
This is a data dashboard diagram presentation powerpoint example. This is a seven stage process. The stages in this process are root cause, incident trends and their status, contributing cause, incident by category and severity, incident by category, incident by facilities, incident severity by.
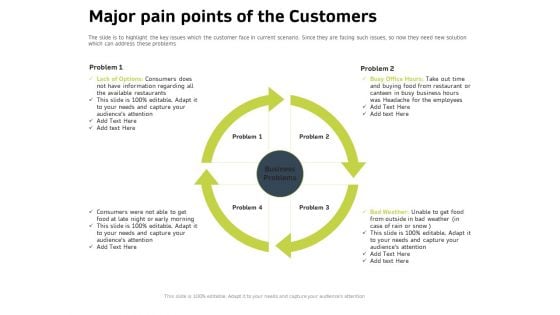
Customer Relationship Management In Freehold Property Major Pain Points Of The Customers Rules PDF
Presenting this set of slides with name startup presentation for collaborative capital funding major pain points of the customers ppt model slide download pdf. This is a four stage process. The stages in this process are consumers, information, business problems, employees. This is a completely editable PowerPoint presentation and is available for immediate download. Download now and impress your audience.
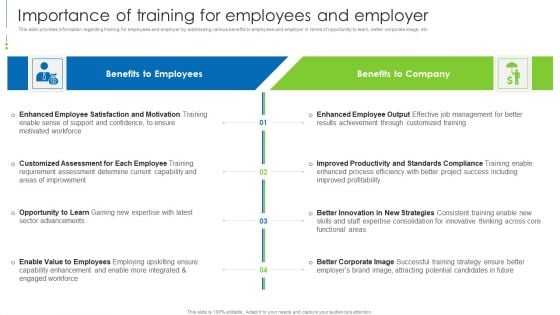
Staff Awareness Playbook Importance Of Training For Employees And Employer Clipart PDF
This slide provides information regarding training for employees and employer by addressing various benefits to employees and employer in terms of opportunity to learn, better corporate image, etc. Do you have to make sure that everyone on your team knows about any specific topic I yes, then you should give Staff Awareness Playbook Importance Of Training For Employees And Employer Clipart PDF a try. Our experts have put a lot of knowledge and effort into creating this impeccable Staff Awareness Playbook Importance Of Training For Employees And Employer Clipart PDF. You can use this template for your upcoming presentations, as the slides are perfect to represent even the tiniest detail. You can download these templates from the Slidegeeks website and these are easy to edit. So grab these today.
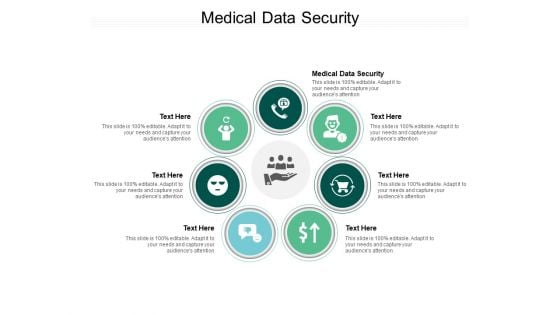
Medical Data Security Ppt PowerPoint Presentation Show Cpb Pdf
Presenting this set of slides with name medical data security ppt powerpoint presentation show cpb pdf. This is an editable Powerpoint seven stages graphic that deals with topics like medical data security to help convey your message better graphically. This product is a premium product available for immediate download and is 100 percent editable in Powerpoint. Download this now and use it in your presentations to impress your audience.

Professional Qualifications Ppt PowerPoint Presentation Show Slide Portrait
This is a professional qualifications ppt powerpoint presentation show slide portrait. This is a four stage process. The stages in this process are professional, qualifications, business, strategy, technology.
Business Diagram Three Cups For Market Research Data Presentation Template
This business diagram has been designed with graphic of three cups. This diagram can be used to display information in visual manner. Use this diagram in your presentations to get good remarks from your viewers.

Five Action Items For Daily Standup Meeting Ppt PowerPoint Presentation File Ideas PDF
Presenting five action items for daily standup meeting ppt powerpoint presentation file ideas pdf to dispense important information. This template comprises five stages. It also presents valuable insights into the topics including goals, blockers, yesterday. This is a completely customizable PowerPoint theme that can be put to use immediately. So, download it and address the topic impactfully.

Remote Sales Plan For Frameworks For Lead Qualification During Inside Sales Process Strategy SS V
This slide showcases frameworks that can help organization in effective lead qualification to increase the sales probability, It highlights two types of lead qualification framework for business that are BANT and CHAMP framework. Are you in need of a template that can accommodate all of your creative concepts This one is crafted professionally and can be altered to fit any style. Use it with Google Slides or PowerPoint. Include striking photographs, symbols, depictions, and other visuals. Fill, move around, or remove text boxes as desired. Test out color palettes and font mixtures. Edit and save your work, or work with colleagues. Download Remote Sales Plan For Frameworks For Lead Qualification During Inside Sales Process Strategy SS V and observe how to make your presentation outstanding. Give an impeccable presentation to your group and make your presentation unforgettable. This slide showcases frameworks that can help organization in effective lead qualification to increase the sales probability, It highlights two types of lead qualification framework for business that are BANT and CHAMP framework.
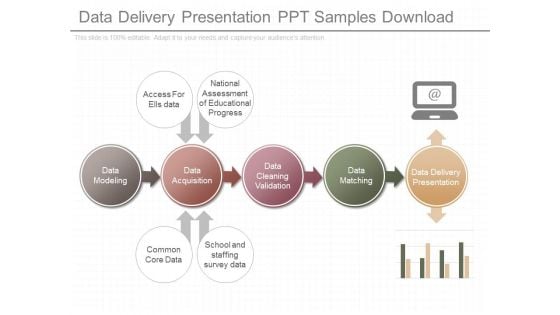
Data Delivery Presentation Ppt Samples Download
This is a data delivery presentation ppt samples download. This is a five stage process. The stages in this process are access for ells data, national assessment of educational progress, data modeling, data acquisition, data cleaning validation, data matching, data delivery presentation, common core data, school and staffing survey data.
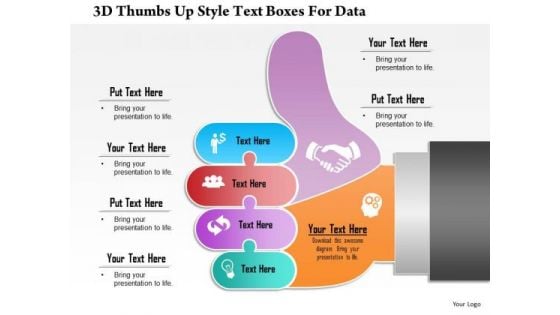
Business Diagram 3d Thumbs Up Style Text Boxes For Data Presentation Template
This Power Point diagram has been crafted with graphic of text boxes with icons. It contains diagram of thumb up hand graphics with communication icons. Use this diagram to build professional presentation for your viewers.

Business Diagram Business Bar Graph For Data Analysis Presentation Template
This business slide displays pie charts with percentage ratios. This diagram is a data visualization tool that gives you a simple way to present statistical information. This slide helps your audience examines and interprets the data you present.
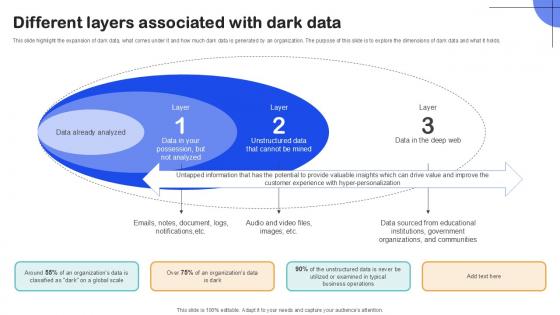
Different Layers Associated With Importance Of Unstructured Data Ppt Presentation
This slide highlight the expansion of dark data, what comes under it and how much dark data is generated by an organization. The purpose of this slide is to explore the dimensions of dark data and what it holds.Are you in need of a template that can accommodate all of your creative concepts This one is crafted professionally and can be altered to fit any style. Use it with Google Slides or PowerPoint. Include striking photographs, symbols, depictions, and other visuals. Fill, move around, or remove text boxes as desired. Test out color palettes and font mixtures. Edit and save your work, or work with colleagues. Download Different Layers Associated With Importance Of Unstructured Data Ppt Presentation and observe how to make your presentation outstanding. Give an impeccable presentation to your group and make your presentation unforgettable. This slide highlight the expansion of dark data, what comes under it and how much dark data is generated by an organization. The purpose of this slide is to explore the dimensions of dark data and what it holds.
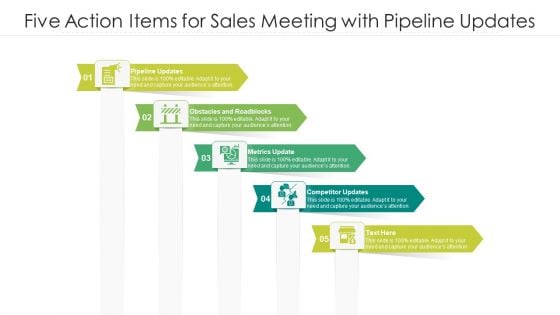
Five Action Items For Sales Meeting With Pipeline Updates Ppt PowerPoint Presentation File Topics PDF
Presenting five action items for sales meeting with pipeline updates ppt powerpoint presentation file topics pdf to dispense important information. This template comprises five stages. It also presents valuable insights into the topics including pipeline updates, obstacles and roadblocks, metrics update. This is a completely customizable PowerPoint theme that can be put to use immediately. So, download it and address the topic impactfully.
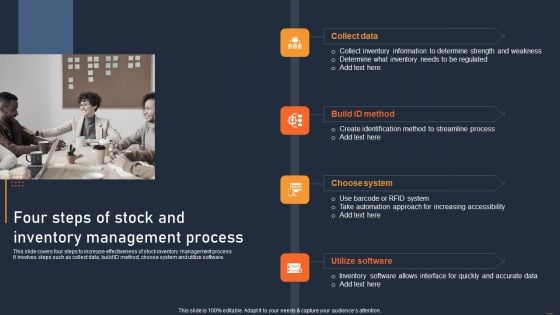
ATS Administration To Improve Four Steps Of Stock And Inventory Management Process Rules PDF
This slide covers four steps to increase effectiveness of stock inventory management process. It involves steps such as collect data, build ID method, choose system and utilize software. Crafting an eye-catching presentation has never been more straightforward. Let your presentation shine with this tasteful yet straightforward ATS Administration To Improve Four Steps Of Stock And Inventory Management Process Rules PDF template. It offers a minimalistic and classy look that is great for making a statement. The colors have been employed intelligently to add a bit of playfulness while still remaining professional. Construct the ideal ATS Administration To Improve Four Steps Of Stock And Inventory Management Process Rules PDF that effortlessly grabs the attention of your audience Begin now and be certain to wow your customers.

Strategies For Flipping Houses For Maximum Revenue Impact Of Real Estate Flipping On Local Community Mockup PDF
This slide represents impact of house flipping on local community. It covers improvement in neighborhood, increase in property value, employment and helping homeowners. Explore a selection of the finest Strategies For Flipping Houses For Maximum Revenue Impact Of Real Estate Flipping On Local Community Mockup PDF here. With a plethora of professionally designed and pre made slide templates, you can quickly and easily find the right one for your upcoming presentation. You can use our Strategies For Flipping Houses For Maximum Revenue Impact Of Real Estate Flipping On Local Community Mockup PDF to effectively convey your message to a wider audience. Slidegeeks has done a lot of research before preparing these presentation templates. The content can be personalized and the slides are highly editable. Grab templates today from Slidegeeks.
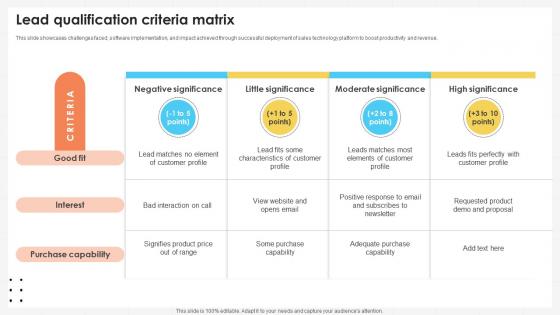
Business Development Team Lead Qualification Criteria Matrix SA SS V
This slide showcases challenges faced, software implementation, and impact achieved through successful deployment of sales technology platform to boost productivity and revenue. Retrieve professionally designed Business Development Team Lead Qualification Criteria Matrix SA SS V to effectively convey your message and captivate your listeners. Save time by selecting pre-made slideshows that are appropriate for various topics, from business to educational purposes. These themes come in many different styles, from creative to corporate, and all of them are easily adjustable and can be edited quickly. Access them as PowerPoint templates or as Google Slides themes. You do not have to go on a hunt for the perfect presentation because Slidegeeks got you covered from everywhere. This slide showcases challenges faced, software implementation, and impact achieved through successful deployment of sales technology platform to boost productivity and revenue.
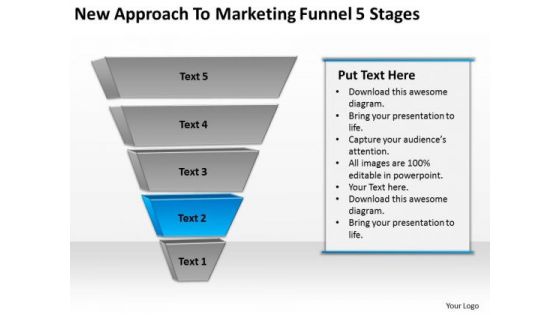
To Marketing Funnel 5 Stages Ppt Business Plan Template PowerPoint Slides
We present our to marketing funnel 5 stages ppt business plan template PowerPoint Slides.Download our Business PowerPoint Templates because you should Whip up a frenzy with our PowerPoint Templates and Slides. They will fuel the excitement of your team. Download our Triangles PowerPoint Templates because You have gained great respect for your brilliant ideas. Use our PowerPoint Templates and Slides to strengthen and enhance your reputation. Present our Process and Flows PowerPoint Templates because You aspire to touch the sky with glory. Let our PowerPoint Templates and Slides provide the fuel for your ascent. Present our Flow Charts PowerPoint Templates because Our PowerPoint Templates and Slides will provide weight to your words. They will bring out the depth of your thought process. Download our Shapes PowerPoint Templates because You can Inspire your team with our PowerPoint Templates and Slides. Let the force of your ideas flow into their minds.Use these PowerPoint slides for presentations relating to Collection, web, info, item, grade, business,, concept, vector, line, visual, presentation, internet, gradation, template, shadow, graphic, clean, element, simple, abstract, multicolored, modern, creative, illustration, backdrop, design, cover, color,, composition, set, banner, stripe, information, background. The prominent colors used in the PowerPoint template are Blue, Black, Gray. Our To Marketing Funnel 5 Stages Ppt Business Plan Template PowerPoint Slides are destined to meet your standards. They conform to your exacting demands.
Customer Pain Points And Opportunities Icon Designs PDF
Presenting Customer Pain Points And Opportunities Icon Designs PDF to dispense important information. This template comprises Four stages. It also presents valuable insights into the topics including Customer Pain Points And Opportunities. This is a completely customizable PowerPoint theme that can be put to use immediately. So, download it and address the topic impactfully.
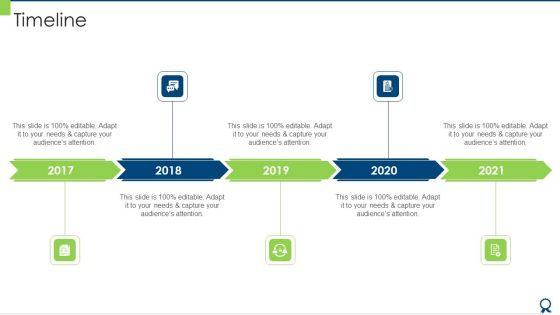
Qualification Process For Project Management Professional Certificate IT Timeline Graphics PDF
Presenting qualification process for project management professional certificate it timeline graphics pdf to provide visual cues and insights. Share and navigate important information on five stages that need your due attention. This template can be used to pitch topics like timeline, 2017 to 2021. In addtion, this PPT design contains high resolution images, graphics, etc, that are easily editable and available for immediate download.
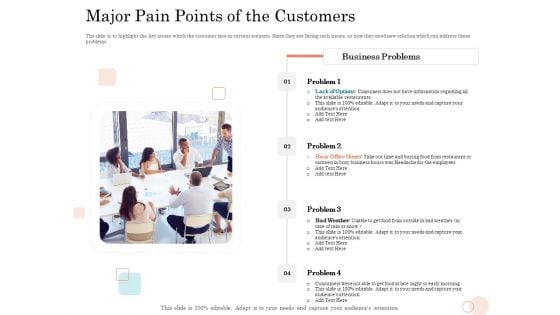
Option Pool Funding Pitch Deck Major Pain Points Of The Customers Ppt Summary Introduction PDF
The slide is to highlight the key issues which the customer face in current scenario. Since they are facing such issues, so now they need new solution which can address these problems. Presenting option pool funding pitch deck major pain points of the customers ppt summary introduction pdf to provide visual cues and insights. Share and navigate important information on four stages that need your due attention. This template can be used to pitch topics like major pain points of the customers. In addtion, this PPT design contains high resolution images, graphics, etc, that are easily editable and available for immediate download.
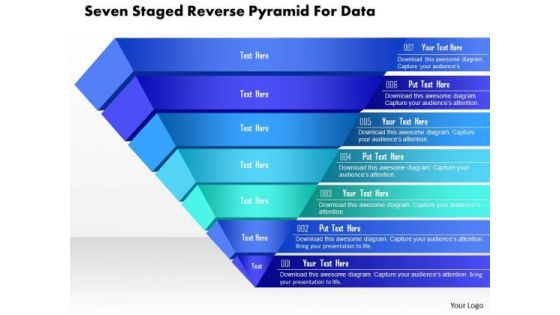
Business Diagram Seven Staged Reverse Pyramid For Data Presentation Template
This business slide is designed with seven staged pyramid diagram. Download this professional slide to depict sales and marketing analysis. This image slide is best to present your newer thoughts.
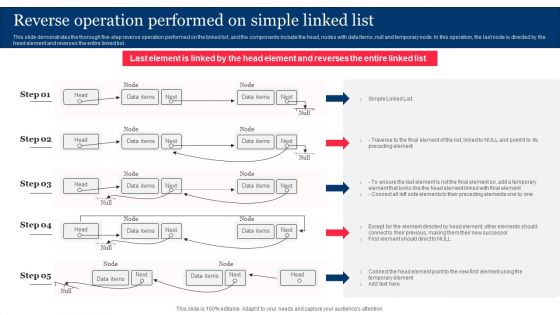
Reverse Operation Performed On Simple Linked List Integrating Linked Data To Enhance Operational Elements PDF
This slide demonstrates the thorough five-step reverse operation performed on the linked list, and the components include the head, nodes with data items, null and temporary node. In this operation, the last node is directed by the head element and reverses the entire linked list.Crafting an eye-catching presentation has never been more straightforward. Let your presentation shine with this tasteful yet straightforward Reverse Operation Performed On Simple Linked List Integrating Linked Data To Enhance Operational Elements PDF template. It offers a minimalistic and classy look that is great for making a statement. The colors have been employed intelligently to add a bit of playfulness while still remaining professional. Construct the ideal Reverse Operation Performed On Simple Linked List Integrating Linked Data To Enhance Operational Elements PDF that effortlessly grabs the attention of your audience Begin now and be certain to wow your customers.
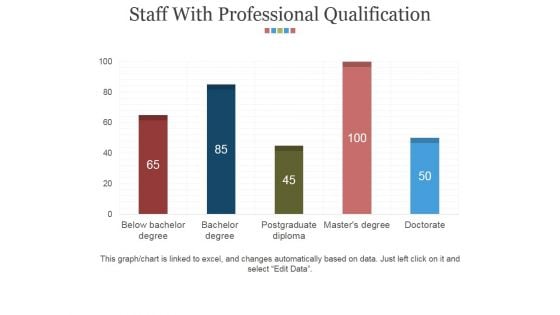
Staff With Professional Qualification Ppt PowerPoint Presentation Slides Tips
This is a staff with professional qualification ppt powerpoint presentation slides tips. This is a five stage process. The stages in this process are business, finance, success, professional, qualification.
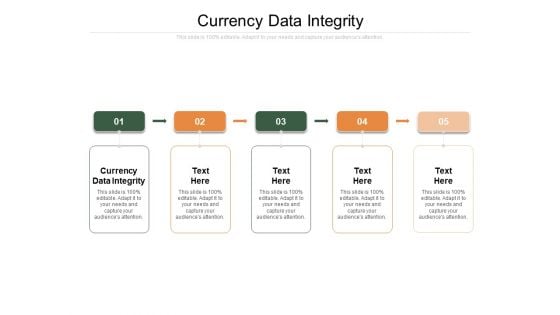
Currency Data Integrity Ppt PowerPoint Presentation Summary Show Cpb
Presenting this set of slides with name currency data integrity ppt powerpoint presentation summary show cpb. This is an editable Powerpoint five stages graphic that deals with topics like currency data integrity to help convey your message better graphically. This product is a premium product available for immediate download and is 100 percent editable in Powerpoint. Download this now and use it in your presentations to impress your audience.
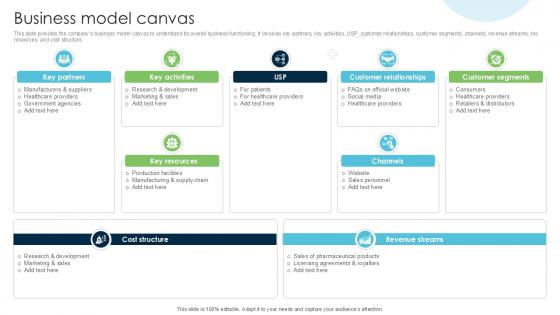
Business Model Canvas Strategies Driving Business Triumph Through Pfizer PPT Example BMC SS V
This slide provides the companys business model canvas to understand its overall business functioning. It involves key partners, key activities, USP, customer relationships, customer segments, channels, revenue streams, key resources, and cost structure. Crafting an eye-catching presentation has never been more straightforward. Let your presentation shine with this tasteful yet straightforward Business Model Canvas Strategies Driving Business Triumph Through Pfizer PPT Example BMC SS V template. It offers a minimalistic and classy look that is great for making a statement. The colors have been employed intelligently to add a bit of playfulness while still remaining professional. Construct the ideal Business Model Canvas Strategies Driving Business Triumph Through Pfizer PPT Example BMC SS V that effortlessly grabs the attention of your audience Begin now and be certain to wow your customers This slide provides the companys business model canvas to understand its overall business functioning. It involves key partners, key activities, USP, customer relationships, customer segments, channels, revenue streams, key resources, and cost structure.
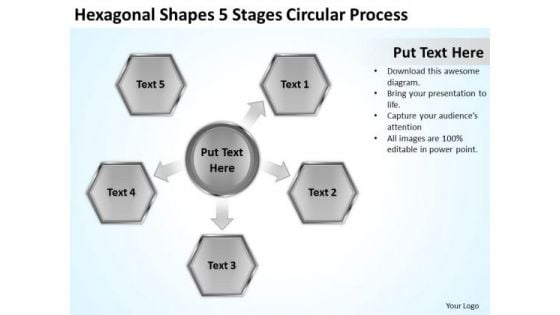
Hexagonal Shapes 5 Stages Circular Process Business Plan PowerPoint Slides
We present our hexagonal shapes 5 stages circular process business plan PowerPoint Slides.Download our Hexagon PowerPoint Templates because You are well armed with penetrative ideas. Our PowerPoint Templates and Slides will provide the gunpowder you need. Use our Arrows PowerPoint Templates because It will Strengthen your hand with your thoughts. They have all the aces you need to win the day. Use our Shapes PowerPoint Templates because Our PowerPoint Templates and Slides will let you Hit the right notes. Watch your audience start singing to your tune. Download our Success PowerPoint Templates because Our PowerPoint Templates and Slides will embellish your thoughts. See them provide the desired motivation to your team. Download our Process and Flows PowerPoint Templates because Our PowerPoint Templates and Slides are designed to help you succeed. They have all the ingredients you need.Use these PowerPoint slides for presentations relating to info, banner, website, wallpaper, paper cut out, item, grade, layout, business, blank, vector, sign, line, visual, presentation, internet, gradation, template, brochure, graphic, clean, element, card, simple, design template, label, abstract, modern, creative, palette, illustration, stationery, number, backdrop, web, design, cover, text, composition, empty, paper, choice, set, infographic, stripe, information, background, advertising, gradient, editable. The prominent colors used in the PowerPoint template are Gray, Black, White. Take control with our Hexagonal Shapes 5 Stages Circular Process Business Plan PowerPoint Slides. Do not be fatalistic in your approach.
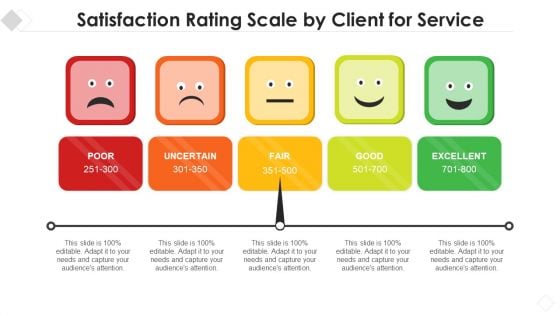
Satisfaction Rating Scale By Client For Service Structure PDF
Presenting satisfaction rating scale by client for service structure pdf to dispense important information. This template comprises five stages. It also presents valuable insights into the topics including satisfaction rating scale by client for service. This is a completely customizable PowerPoint theme that can be put to use immediately. So, download it and address the topic impactfully.
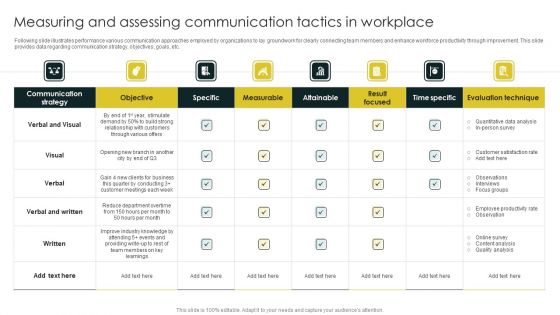
Measuring And Assessing Communication Tactics In Workplace Mockup PDF
Following slide illustrates performance various communication approaches employed by organizations to lay groundwork for clearly connecting team members and enhance workforce productivity through improvement. This slide provides data regarding communication strategy, objectives, goals, etc. Showcasing this set of slides titled Measuring And Assessing Communication Tactics In Workplace Mockup PDF. The topics addressed in these templates are Communication Strategy, Measurable, Time Specific. All the content presented in this PPT design is completely editable. Download it and make adjustments in color, background, font etc. as per your unique business setting.

Investor Funding Elevator Pitch Deck For Online Learning Platform Ppt Template
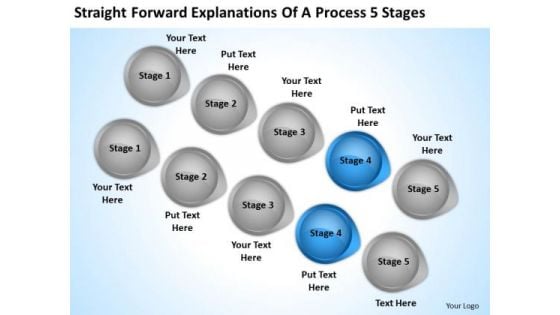
PowerPoint Arrow Straight Forward Explanations Of Process 5 Stages Template
We present our powerpoint arrow straight forward explanations of process 5 stages template.Download and present our Process and Flows PowerPoint Templates because It will mark the footprints of your journey. Illustrate how they will lead you to your desired destination. Download and present our Success PowerPoint Templates because They will bring a lot to the table. Their alluring flavours will make your audience salivate. Present our Flow Charts PowerPoint Templates because You aspire to touch the sky with glory. Let our PowerPoint Templates and Slides provide the fuel for your ascent. Download and present our Shapes PowerPoint Templates because Our PowerPoint Templates and Slides will let your words and thoughts hit bullseye everytime. Use our Target PowerPoint Templates because Our PowerPoint Templates and Slides are the chords of your song. String them along and provide the lilt to your views.Use these PowerPoint slides for presentations relating to Abstract, access, brochure, business, circle,color, colorful, concept, conceptual,connection, corporate, creative, cycle,dark, design, diagram, different, vector, five, frame, graphic, group, idea,illustration, information, item,management, marketing, model,navigation, options, parts, piece, plan,presentation, report, round, shape,solution, speech, strategy, structure. The prominent colors used in the PowerPoint template are Blue, White, Gray. PowerPoint presentation experts tell us our powerpoint arrow straight forward explanations of process 5 stages template are designed to make your presentations professional. Presenters tell us our conceptual PowerPoint templates and PPT Slides are designed to make your presentations professional. Use our powerpoint arrow straight forward explanations of process 5 stages template are designed to make your presentations professional. People tell us our conceptual PowerPoint templates and PPT Slides effectively help you save your valuable time. Presenters tell us our powerpoint arrow straight forward explanations of process 5 stages template provide great value for your money. Be assured of finding the best projection to highlight your words. Presenters tell us our brochure PowerPoint templates and PPT Slides will help you be quick off the draw. Just enter your specific text and see your points hit home. Decorate your thoughts with our PowerPoint Arrow Straight Forward Explanations Of Process 5 Stages Template. Take full advantage of their colourful appearance.
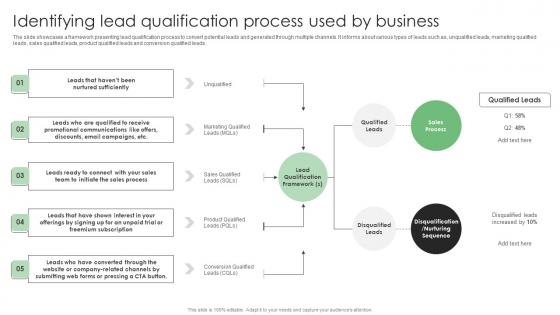
Performance Enhancement Plan Identifying Lead Qualification Process Used Pictures Pdf
The slide showcases a framework presenting lead qualification process to convert potential leads and generated through multiple channels. It informs about various types of leads such as, unqualified leads, marketing qualified leads, sales qualified leads, product qualified leads and conversion qualified leads. If you are looking for a format to display your unique thoughts, then the professionally designed Performance Enhancement Plan Identifying Lead Qualification Process Used Pictures Pdf is the one for you. You can use it as a Google Slides template or a PowerPoint template. Incorporate impressive visuals, symbols, images, and other charts. Modify or reorganize the text boxes as you desire. Experiment with shade schemes and font pairings. Alter, share or cooperate with other people on your work. Download Performance Enhancement Plan Identifying Lead Qualification Process Used Pictures Pdf and find out how to give a successful presentation. Present a perfect display to your team and make your presentation unforgettable. The slide showcases a framework presenting lead qualification process to convert potential leads and generated through multiple channels. It informs about various types of leads such as, unqualified leads, marketing qualified leads, sales qualified leads, product qualified leads and conversion qualified leads.
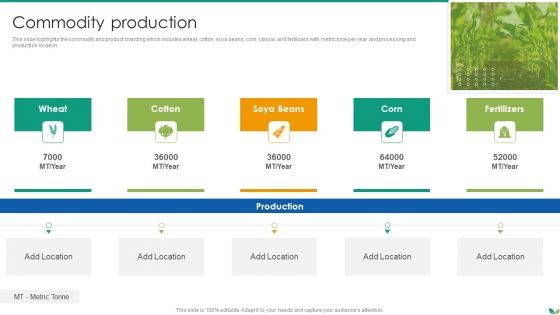
Agricultural Business Company Profile Commodity Production Introduction PDF
This slide highlights the commodity and product branding which includes wheat, cotton, soya beans, corn, canola, and fertilizers with metric tone per year and processing and production location.Presenting Agricultural Business Company Profile Commodity Production Introduction PDF to provide visual cues and insights. Share and navigate important information on five stages that need your due attention. This template can be used to pitch topics like Commodity Production In addtion, this PPT design contains high resolution images, graphics, etc, that are easily editable and available for immediate download.
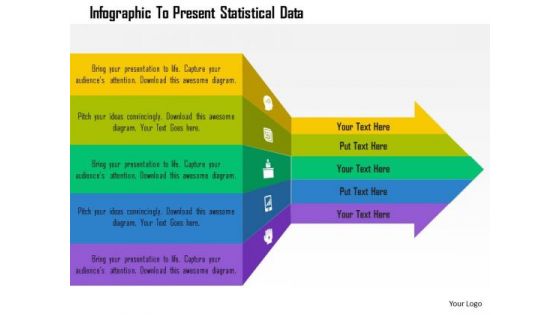
Business Diagram Infographic To Present Statistical Data Presentation Template
This business diagram contains arrow infographic. Our professionally designed business diagram helps to present statistical data. Enlighten your audience with your breathtaking ideas.
Techniques Data Mining Ppt PowerPoint Presentation Infographic Template Show Cpb
Presenting this set of slides with name techniques data mining ppt powerpoint presentation infographic template show cpb. This is an editable Powerpoint three stages graphic that deals with topics like techniques data mining to help convey your message better graphically. This product is a premium product available for immediate download and is 100 percent editable in Powerpoint. Download this now and use it in your presentations to impress your audience.
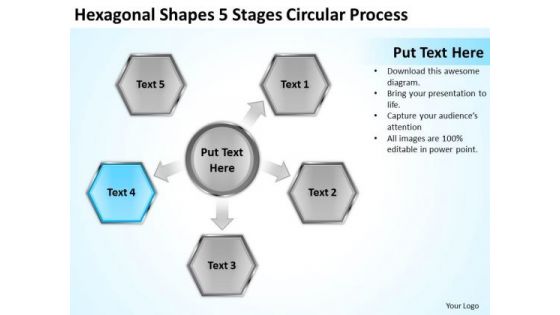
Hexagonal Shapes 5 Stages Circular Process Ppt Sample Of Small Business Plan PowerPoint Slides
We present our hexagonal shapes 5 stages circular process ppt sample of small business plan PowerPoint Slides.Use our Hexagon PowerPoint Templates because Our PowerPoint Templates and Slides ensures Effective communication. They help you put across your views with precision and clarity. Present our Arrows PowerPoint Templates because Our PowerPoint Templates and Slides help you pinpoint your timelines. Highlight the reasons for your deadlines with their use. Download our Shapes PowerPoint Templates because Our PowerPoint Templates and Slides will embellish your thoughts. See them provide the desired motivation to your team. Download and present our Success PowerPoint Templates because Our PowerPoint Templates and Slides will definately Enhance the stature of your presentation. Adorn the beauty of your thoughts with their colourful backgrounds. Download our Process and Flows PowerPoint Templates because Our PowerPoint Templates and Slides will let you Hit the target. Go the full distance with ease and elan.Use these PowerPoint slides for presentations relating to info, banner, website, wallpaper, paper cut out, item, grade, layout, business, blank, vector, sign, line, visual, presentation, internet, gradation, template, brochure, graphic, clean, element, card, simple, design template, label, abstract, modern, creative, palette, illustration, stationery, number, backdrop, web, design, cover, text, composition, empty, paper, choice, set, infographic, stripe, information, background, advertising, gradient, editable. The prominent colors used in the PowerPoint template are Blue, Gray, Black. Our Hexagonal Shapes 5 Stages Circular Process Ppt Sample Of Small Business Plan PowerPoint Slides team are a multi-faceted lot. They address issues from different angles.
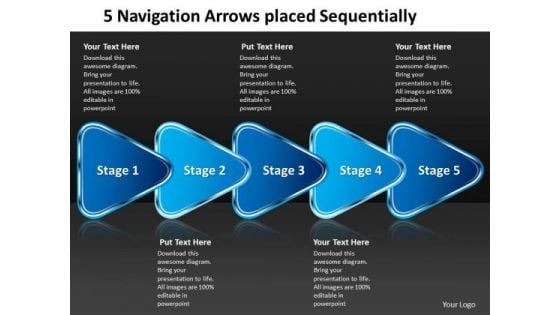
5 Navigation Arrows Placed Sequentially Schematic Design PowerPoint Templates
We present our 5 navigation arrows placed sequentially schematic design PowerPoint templates.Use our Advertising PowerPoint Templates because, This slide depicts the occasion for gifting and giving. Use our Business PowerPoint Templates because,Like the famed William Tell, they put aside all emotions and concentrate on the target. Use our Shapes PowerPoint Templates because,It Shines the light on your thoughts and motivates your team to improve the quality of celebration for all around you. Use our Signs PowerPoint Templates because,Using our templates for your colleagues will impart knowledge tofeed. Use our Abstract PowerPoint Templates because, you can Ring them out loud with your brilliant ideas.Use these PowerPoint slides for presentations relating to arrow, background, badge, browse, business, button, card, collection, color, copy, dart, design, download, editable, element, golden, graphic, icon, illustration, isolated, item, label, menu, modern, navigation, object, on-line, original, paper, red, select, set, sign, site, sticker, sticky, style, symbol, tape, template, vector, web. The prominent colors used in the PowerPoint template are Blue, Blue navy, White. People tell us our 5 navigation arrows placed sequentially schematic design PowerPoint templates are Pleasant. The feedback we get is that our browse PowerPoint templates and PPT Slides are Fantastic. People tell us our 5 navigation arrows placed sequentially schematic design PowerPoint templates are Magnificent. Presenters tell us our color PowerPoint templates and PPT Slides will help you be quick off the draw. Just enter your specific text and see your points hit home. The feedback we get is that our 5 navigation arrows placed sequentially schematic design PowerPoint templates are Classic. Professionals tell us our collection PowerPoint templates and PPT Slides will save the presenter time. Our slides and your story create a beautiful combination with our 5 Navigation Arrows Placed Sequentially Schematic Design PowerPoint Templates. Dont pass up this opportunity to shine.
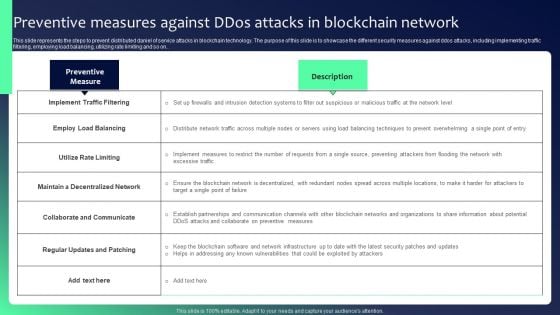
Blockchain Security Solutions Deployment Preventive Measures Against Ddos Attacks Professional PDF
This slide represents the steps to prevent distributed daniel of service attacks in blockchain technology. The purpose of this slide is to showcase the different security measures against ddos attacks, including implementing traffic filtering, employing load balancing, utilizing rate limiting and so on.. If your project calls for a presentation, then Slidegeeks is your go-to partner because we have professionally designed, easy-to-edit templates that are perfect for any presentation. After downloading, you can easily edit Blockchain Security Solutions Deployment Preventive Measures Against Ddos Attacks Professional PDF and make the changes accordingly. You can rearrange slides or fill them with different images. Check out all the handy templates
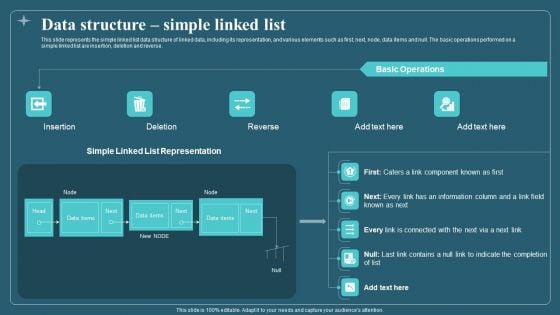
Data Structure Simple Linked List Associated Data IT Demonstration PDF
This slide represents the simple linked list data structure of linked data, including its representation, and various elements such as first, next, node, data items and null. The basic operations performed on a simple linked list are insertion, deletion and reverse. Presenting Data Structure Simple Linked List Associated Data IT Demonstration PDF to provide visual cues and insights. Share and navigate important information on five stages that need your due attention. This template can be used to pitch topics like Deletion, Reverse, Insertion. In addtion, this PPT design contains high resolution images, graphics, etc, that are easily editable and available for immediate download.
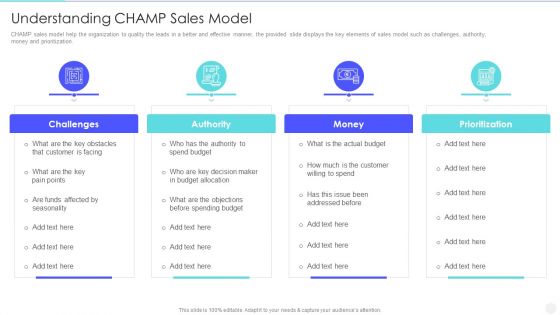
Increase Returns By Examining And Executing New Sales Qualification Procedure Understanding Champ Sales Professional PDF
CHAMP sales model help the organization to quality the leads in a better and effective manner, the provided slide displays the key elements of sales model such as challenges, authority, money and prioritization. Presenting increase returns by examining and executing new sales qualification procedure understanding champ sales professional pdf to provide visual cues and insights. Share and navigate important information on four stages that need your due attention. This template can be used to pitch topics like challenges, authority, money, prioritization. In addtion, this PPT design contains high resolution images, graphics, etc, that are easily editable and available for immediate download.

Stock Photo Illustration Of Chopper Planes PowerPoint Slide
This image is designed with 3d image of chopper planes. Download this image to display concepts like travel and technology. This image will help to express your views in your presentations.


 Continue with Email

 Home
Home


