Data Quality Dashboard
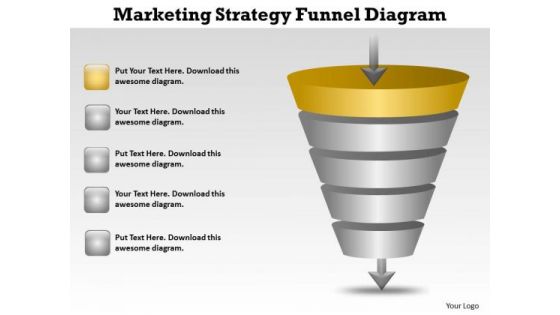
PowerPoint Business Funnel Diagram Templates Backgrounds For Slides
We present our powerpoint business funnel diagram templates backgrounds for slides.Download our Process and flows PowerPoint Templates because You should Press the right buttons with our PowerPoint Templates and Slides. They will take your ideas down the perfect channel. Download our Flow Charts PowerPoint Templates because You are working at that stage with an air of royalty. Let our PowerPoint Templates and Slides be the jewels in your crown. Use our Shapes PowerPoint Templates because You have a driving passion to excel in your field. Our PowerPoint Templates and Slides will prove ideal vehicles for your ideas. Download and present our Business PowerPoint Templates because It will mark the footprints of your journey. Illustrate how they will lead you to your desired destination. Download our Marketing PowerPoint Templates because Our PowerPoint Templates and Slides will let you Hit the target. Go the full distance with ease and elan.Use these PowerPoint slides for presentations relating to Business, chart, concept, conceptual, construction, corporate, data, design, diagram, direction, elegant, focus, growth, hierarchy, illustration, information, layer, layered, level, manage, management, metal, metallic, model, organization, process, progress, pyramid, pyramid chart, rank, reflection, resource, set, shape, silver, stage, statistics, structure, support, symbol. The prominent colors used in the PowerPoint template are Yellow, Gray, Black. Professionals tell us our powerpoint business funnel diagram templates backgrounds for slides are readymade to fit into any presentation structure. Presenters tell us our corporate PowerPoint templates and PPT Slides will generate and maintain the level of interest you desire. They will create the impression you want to imprint on your audience. The feedback we get is that our powerpoint business funnel diagram templates backgrounds for slides are designed to make your presentations professional. Use our diagram PowerPoint templates and PPT Slides have awesome images to get your point across. You can be sure our powerpoint business funnel diagram templates backgrounds for slides will generate and maintain the level of interest you desire. They will create the impression you want to imprint on your audience. Customers tell us our construction PowerPoint templates and PPT Slides have awesome images to get your point across. Get your fill of applause with our PowerPoint Business Funnel Diagram Templates Backgrounds For Slides. The claps will just continue to come.
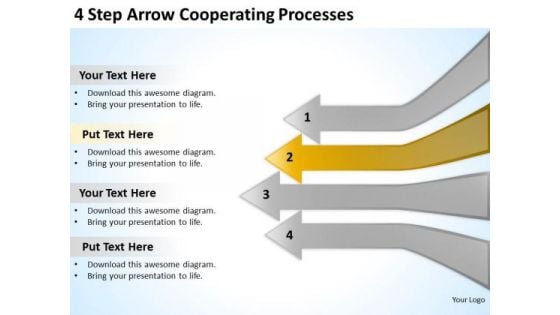
4 Step Arrow Cooperating Processes Business Action Plan PowerPoint Slides
We present our 4 step arrow cooperating processes business action plan PowerPoint Slides.Download and present our Arrows PowerPoint Templates because Our PowerPoint Templates and Slides are aesthetically designed to attract attention. We gaurantee that they will grab all the eyeballs you need. Download our Marketing PowerPoint Templates because You have gained great respect for your brilliant ideas. Use our PowerPoint Templates and Slides to strengthen and enhance your reputation. Download our Finance PowerPoint Templates because Our PowerPoint Templates and Slides are innately eco-friendly. Their high recall value negate the need for paper handouts. Download and present our Business PowerPoint Templates because You can Channelise the thoughts of your team with our PowerPoint Templates and Slides. Urge them to focus on the goals you have set. Present our Shapes PowerPoint Templates because You will get more than you ever bargained for. Use these PowerPoint slides for presentations relating to 3d, Abstract, Accounting, Arrow, Background, Bank, Bar, Benefit, Business, Calculation, Capital, Chart, Company, Connection, Corporate, Data, Design, Diagram, Directive, Earnings, Economy, Enterprise, Finance, Forecast, Graph, Growth, Illustration, Income, Increase, Information, Interest, Internet, Investment, Investor, Management, Market, Measure, Network, Office, Perspective, Plan, Price, Profit, Progress, Rise, Statistics, Technology, Vector, Wealth, World. The prominent colors used in the PowerPoint template are Yellow, Gray, Black. People tell us our 4 step arrow cooperating processes business action plan PowerPoint Slides provide great value for your money. Be assured of finding the best projection to highlight your words. Customers tell us our Benefit PowerPoint templates and PPT Slides are second to none. You can be sure our 4 step arrow cooperating processes business action plan PowerPoint Slides are designed to make your presentations professional. You can be sure our Bank PowerPoint templates and PPT Slides will generate and maintain the level of interest you desire. They will create the impression you want to imprint on your audience. Presenters tell us our 4 step arrow cooperating processes business action plan PowerPoint Slides will make you look like a winner. People tell us our Business PowerPoint templates and PPT Slides will impress their bosses and teams. Display your conscientious approach with our 4 Step Arrow Cooperating Processes Business Action Plan PowerPoint Slides. Demonstrate your commitment to the cause.
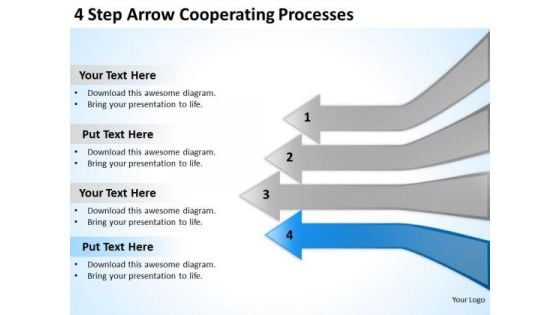
4 Step Arrow Cooperating Processes Ppt How To Form Business Plan PowerPoint Templates
We present our 4 step arrow cooperating processes ppt how to form business plan PowerPoint templates.Download our Arrows PowerPoint Templates because Our PowerPoint Templates and Slides will give good value for money. They also have respect for the value of your time. Present our Marketing PowerPoint Templates because It will mark the footprints of your journey. Illustrate how they will lead you to your desired destination. Present our Finance PowerPoint Templates because Our PowerPoint Templates and Slides will let you Clearly mark the path for others to follow. Download our Business PowerPoint Templates because You can Zap them with our PowerPoint Templates and Slides. See them reel under the impact. Download and present our Shapes PowerPoint Templates because Our PowerPoint Templates and Slides will let your words and thoughts hit bullseye everytime.Use these PowerPoint slides for presentations relating to 3d, Abstract, Accounting, Arrow, Background, Bank, Bar, Benefit, Business, Calculation, Capital, Chart, Company, Connection, Corporate, Data, Design, Diagram, Directive, Earnings, Economy, Enterprise, Finance, Forecast, Graph, Growth, Illustration, Income, Increase, Information, Interest, Internet, Investment, Investor, Management, Market, Measure, Network, Office, Perspective, Plan, Price, Profit, Progress, Rise, Statistics, Technology, Vector, Wealth, World. The prominent colors used in the PowerPoint template are Blue, Gray, Black. People tell us our 4 step arrow cooperating processes ppt how to form business plan PowerPoint templates help you meet deadlines which are an element of today's workplace. Just browse and pick the slides that appeal to your intuitive senses. Customers tell us our Arrow PowerPoint templates and PPT Slides are designed to make your presentations professional. You can be sure our 4 step arrow cooperating processes ppt how to form business plan PowerPoint templates are specially created by a professional team with vast experience. They diligently strive to come up with the right vehicle for your brilliant Ideas. You can be sure our Background PowerPoint templates and PPT Slides provide great value for your money. Be assured of finding the best projection to highlight your words. Presenters tell us our 4 step arrow cooperating processes ppt how to form business plan PowerPoint templates are designed by professionals People tell us our Benefit PowerPoint templates and PPT Slides are the best it can get when it comes to presenting. Convincing an audience is no mean feat. Do it with ease with our 4 Step Arrow Cooperating Processes Ppt How To Form Business Plan PowerPoint Templates.
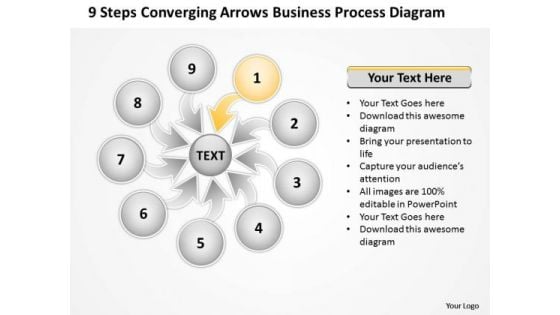
Arrows Business PowerPoint Theme Process Diagram Ppt 2 Cycle Flow Chart Templates
We present our arrows business powerpoint theme process diagram ppt 2 Cycle Flow Chart templates.Present our Business PowerPoint Templates because The foundation of the structure of your business is resilient and dependable. Convey this confidence to your colleagues and assure them of a great and enduring future. Download and present our Spheres PowerPoint Templates because you have made significant headway in this field. Download our Arrows PowerPoint Templates because you have the people in place, selected the team leaders and all are raring to go. Use our Marketing PowerPoint Templates because The marketplace is the merger of your dreams and your ability. Download our Circle Charts PowerPoint Templates because the ideas and plans are on your finger tips.Use these PowerPoint slides for presentations relating to Arrow, Business, Button, Chart, Circle, Company, Cross, Data, Design, Diagram, Direction, Document, Financial, Management, Marketing, Multiple, Plan, Presentation, Process, Results, Sphere, Template, Website, Wheel. The prominent colors used in the PowerPoint template are Yellow, White, Gray. Presenters tell us our arrows business powerpoint theme process diagram ppt 2 Cycle Flow Chart templates are Festive. We assure you our Button PowerPoint templates and PPT Slides are Adorable. Presenters tell us our arrows business powerpoint theme process diagram ppt 2 Cycle Flow Chart templates are Elegant. Use our Design PowerPoint templates and PPT Slides are Sparkling. We assure you our arrows business powerpoint theme process diagram ppt 2 Cycle Flow Chart templates are Royal. You can be sure our Circle PowerPoint templates and PPT Slides are Upbeat. Get rid of the blues with our Arrows Business PowerPoint Theme Process Diagram Ppt 2 Cycle Flow Chart Templates. Let hope and happiness flow into your mind.
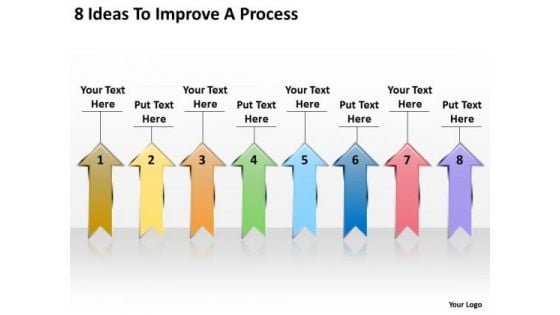
Explain Parallel Processing 8 Ideas To Improve PowerPoint Slides
We present our explain parallel processing 8 ideas to improve PowerPoint Slides.Download our Arrows PowerPoint Templates because you can Set pulses racing with our PowerPoint Templates and Slides. They will raise the expectations of your team. Download and present our Marketing PowerPoint Templates because Our PowerPoint Templates and Slides will give you great value for your money. Be assured of finding the best projection to highlight your words. Download and present our Business PowerPoint Templates because You canTake a leap off the starting blocks with our PowerPoint Templates and Slides. They will put you ahead of the competition in quick time. Download and present our Signs PowerPoint Templates because Our PowerPoint Templates and Slides will let your ideas bloom. Create a bed of roses for your audience. Present our Shapes PowerPoint Templates because Our PowerPoint Templates and Slides help you meet the demand of the Market. Just browse and pick the slides that appeal to your intuitive senses.Use these PowerPoint slides for presentations relating to Arrow, Box, Brochure, Business, Button, Chart, Company, Cross, Data, Design, Diagram, Direction, Document, Financial, Goals, Graph, Management, Marketing, Navigation, Network, Options, Plan, Presentation, Process, Results, Shiny, Sphere, Statistics, Stock, Structure, Template, Vector, Website, Wheel. The prominent colors used in the PowerPoint template are Yellow, Red, Green. Customers tell us our explain parallel processing 8 ideas to improve PowerPoint Slides will get their audience's attention. We assure you our Chart PowerPoint templates and PPT Slides provide great value for your money. Be assured of finding the best projection to highlight your words. Use our explain parallel processing 8 ideas to improve PowerPoint Slides will make you look like a winner. You can be sure our Brochure PowerPoint templates and PPT Slides provide great value for your money. Be assured of finding the best projection to highlight your words. PowerPoint presentation experts tell us our explain parallel processing 8 ideas to improve PowerPoint Slides are topically designed to provide an attractive backdrop to any subject. The feedback we get is that our Chart PowerPoint templates and PPT Slides are specially created by a professional team with vast experience. They diligently strive to come up with the right vehicle for your brilliant Ideas. Lead teams with our Explain Parallel Processing 8 Ideas To Improve PowerPoint Slides. Download without worries with our money back guaranteee.
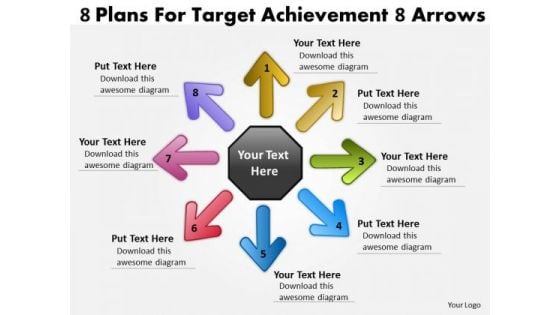
8 Plans For Target Achievement Arrows Cycle Process PowerPoint Templates
We present our 8 plans for target achievement arrows Cycle Process PowerPoint templates.Use our Arrows PowerPoint Templates because it is all there in bits and pieces. Download our Circle Charts PowerPoint Templates because it outlines the process with this innovative graphic to authenticate your plan of achieving the goal of added value/profit. Use our Shapes PowerPoint Templates because Our PowerPoint Templates and Slides will let you Hit the target. Go the full distance with ease and elan. Download and present our Business PowerPoint Templates because you can Flutter your wings and enchant the world. Impress them with the innate attractiveness of your thoughts and words. Use our Flow Charts PowerPoint Templates because the vision of being the market leader is clear to you.Use these PowerPoint slides for presentations relating to abstract, arrow, brochure, business, businessman, button, chart, circle, company, cyclic, data, demonstration, diagram, economic, financial, five, glossy, goal, graph, illustration, info, information, investment, man, manage, marketing, model, navigation, option, part, people, person, pie, presentation, process, result, section, segmented, sharing, silhouette, sphere, statistics, stock, strategy, template, variation, vector, wheel. The prominent colors used in the PowerPoint template are Blue, Red, Purple. Presenters tell us our 8 plans for target achievement arrows Cycle Process PowerPoint templates are Graceful. You can be sure our brochure PowerPoint templates and PPT Slides are Detailed. Professionals tell us our 8 plans for target achievement arrows Cycle Process PowerPoint templates are Vintage. People tell us our company PowerPoint templates and PPT Slides are Luxurious. People tell us our 8 plans for target achievement arrows Cycle Process PowerPoint templates are Playful. Professionals tell us our company PowerPoint templates and PPT Slides are Enchanting. Filter out ideas with our 8 Plans For Target Achievement Arrows Cycle Process PowerPoint Templates. They get actionable ones to emerge.
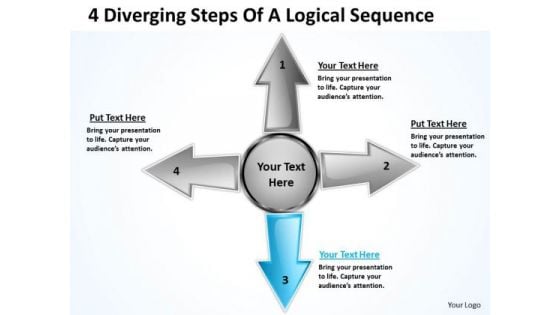
4 Diverging Steps Of A Logical Sequence Ppt Cycle Chart PowerPoint Templates
We present our 4 diverging steps of a logical sequence ppt Cycle Chart PowerPoint templates.Download our Success PowerPoint Templates because iT outlines the entire thought process for the benefit of others. Tell it to the world with your characteristic aplomb. Download our Business PowerPoint Templates because your product has established a foothold in the market. Customers are happy with the value it brings to their lives. Use our Arrows PowerPoint Templates because Our PowerPoint Templates and Slides will let you Clearly mark the path for others to follow. Use our Flow Charts PowerPoint Templates because your brain is always churning out ideas like cogs in a wheel. Download our Shapes PowerPoint Templates because Our PowerPoint Templates and Slides will weave a web of your great ideas. They are gauranteed to attract even the most critical of your colleagues.Use these PowerPoint slides for presentations relating to Arrow, Brochure, Business, Chart, Circle, Cyclic, Data, Diagram, Financial, Goal, Graph, Illustration, Info, Information, Investment, Manage, Marketing, Model, Option, Part, Pie, Presentation, Process, Result, Sphere, Statistics, Stock, Strategy, Template, Wheel. The prominent colors used in the PowerPoint template are Blue light, Gray, White. People tell us our 4 diverging steps of a logical sequence ppt Cycle Chart PowerPoint templates are Reminiscent. Customers tell us our Cyclic PowerPoint templates and PPT Slides effectively help you save your valuable time. People tell us our 4 diverging steps of a logical sequence ppt Cycle Chart PowerPoint templates are Luxurious. Professionals tell us our Business PowerPoint templates and PPT Slides are effectively colour coded to prioritise your plans They automatically highlight the sequence of events you desire. Customers tell us our 4 diverging steps of a logical sequence ppt Cycle Chart PowerPoint templates are Dazzling. Use our Business PowerPoint templates and PPT Slides are Quaint. Make your presentations come alive with our 4 Diverging Steps Of A Logical Sequence Ppt Cycle Chart PowerPoint Templates. You will be at the top of your game.
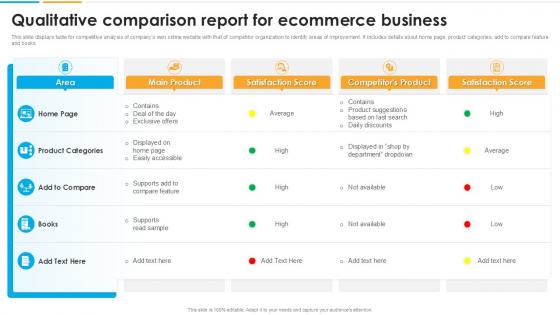
Qualitative Comparison Report For Ecommerce Business
From laying roadmaps to briefing everything in detail, our templates are perfect for you. You can set the stage with your presentation slides. All you have to do is download these easy-to-edit and customizable templates. Qualitative Comparison Report For Ecommerce Business will help you deliver an outstanding performance that everyone would remember and praise you for. Do download this presentation today. This template focuses on presenting a qualitative comparison of different aspects of e-commerce businesses, such as customer experience, product offerings, and marketing strategies. It includes detailed comparison charts and narrative sections to support business analysis. Useful for stakeholders, strategists, and marketers to identify competitive advantages and areas for improvement.
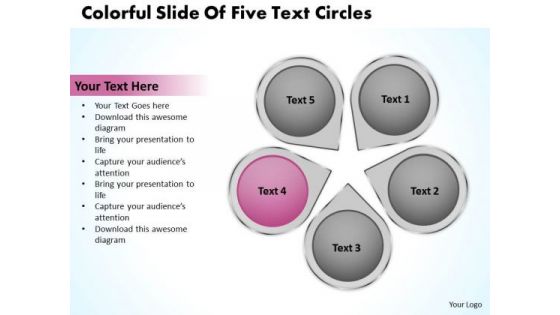
Business Cycle Diagram Colorful Slide Of Five Text Circles PowerPoint Slides
We present our business cycle diagram colorful slide of five text circles PowerPoint Slides.Use our Circle Charts PowerPoint Templates because You are an avid believer in ethical practices. Highlight the benefits that accrue with our PowerPoint Templates and Slides. Use our Ring Charts PowerPoint Templates because It will mark the footprints of your journey. Illustrate how they will lead you to your desired destination. Present our Process and Flows PowerPoint Templates because you can Set pulses racing with our PowerPoint Templates and Slides. They will raise the expectations of your team. Download and present our Business PowerPoint Templates because It will mark the footprints of your journey. Illustrate how they will lead you to your desired destination. Download our Shapes PowerPoint Templates because You aspire to touch the sky with glory. Let our PowerPoint Templates and Slides provide the fuel for your ascent.Use these PowerPoint slides for presentations relating to Boxes, brochure, business, button, catalog, chart, circle, company, cross, data, design, diagram, direction, document, financial, four, glossy, goals, graph, junction, management, market, marketing, model, multicolored, multiple, navigation, network, options, plan, presentation, process, purple, results, shiny, sphere, . The prominent colors used in the PowerPoint template are Pink, Gray, White. Professionals tell us our business cycle diagram colorful slide of five text circles PowerPoint Slides will help you be quick off the draw. Just enter your specific text and see your points hit home. Presenters tell us our chart PowerPoint templates and PPT Slides look good visually. The feedback we get is that our business cycle diagram colorful slide of five text circles PowerPoint Slides will make you look like a winner. Use our chart PowerPoint templates and PPT Slides are aesthetically designed to attract attention. We guarantee that they will grab all the eyeballs you need. You can be sure our business cycle diagram colorful slide of five text circles PowerPoint Slides are specially created by a professional team with vast experience. They diligently strive to come up with the right vehicle for your brilliant Ideas. Customers tell us our button PowerPoint templates and PPT Slides will make the presenter successul in his career/life. Exercise options with our Business Cycle Diagram Colorful Slide Of Five Text Circles PowerPoint Slides. Find answers to multiple challenges.
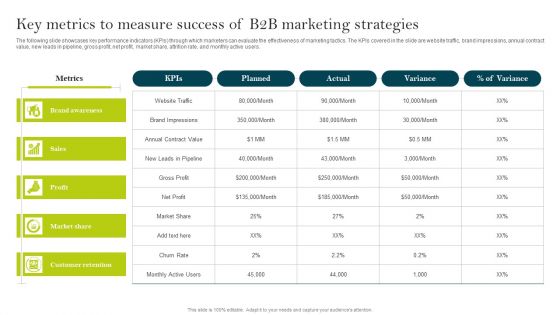
Key Metrics To Measure Success Of B2B Marketing Strategies Ppt PowerPoint Presentation File Styles PDF
The following slide showcases key performance indicators KPIs through which marketers can evaluate the effectiveness of marketing tactics. The KPIs covered in the slide are website traffic, brand impressions, annual contract value, new leads in pipeline, gross profit, net profit, market share, attrition rate, and monthly active users. Slidegeeks has constructed Key Metrics To Measure Success Of B2B Marketing Strategies Ppt PowerPoint Presentation File Styles PDF after conducting extensive research and examination. These presentation templates are constantly being generated and modified based on user preferences and critiques from editors. Here, you will find the most attractive templates for a range of purposes while taking into account ratings and remarks from users regarding the content. This is an excellent jumping off point to explore our content and will give new users an insight into our top notch PowerPoint Templates.
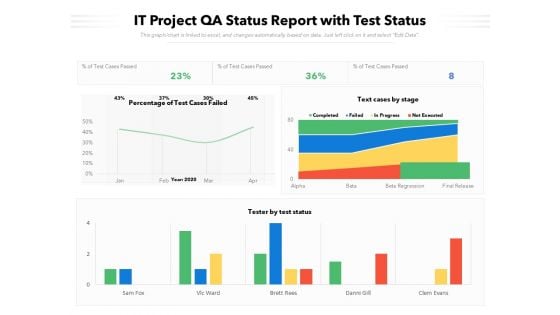
IT Project QA Status Report With Test Status Ppt PowerPoint Presentation Gallery Good PDF
Showcasing this set of slides titled it project qa status report with test status ppt powerpoint presentation gallery good pdf. The topics addressed in these templates are it project qa status report with test status. All the content presented in this PPT design is completely editable. Download it and make adjustments in color, background, font etc. as per your unique business setting.
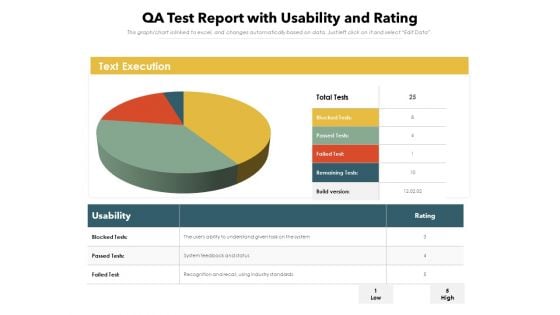
QA Test Report With Usability And Rating Ppt PowerPoint Presentation File Files PDF
Showcasing this set of slides titled qa test report with usability and rating ppt powerpoint presentation file files pdf. The topics addressed in these templates are qa test report with usability and rating. All the content presented in this PPT design is completely editable. Download it and make adjustments in color, background, font etc. as per your unique business setting.
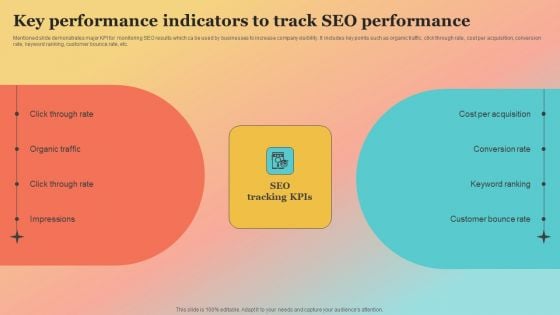
New Website Launch Strategy Key Performance Indicators To Track SEO Performance Pictures PDF
Mentioned slide demonstrates major KPI for monitoring SEO results which ca be used by businesses to increase company visibility. It includes key points such as organic traffic, click through rate, cost per acquisition, conversion rate, keyword ranking, customer bounce rate, etc. From laying roadmaps to briefing everything in detail, our templates are perfect for you. You can set the stage with your presentation slides. All you have to do is download these easy to edit and customizable templates. New Website Launch Strategy Key Performance Indicators To Track SEO Performance Pictures PDF will help you deliver an outstanding performance that everyone would remember and praise you for. Do download this presentation today.
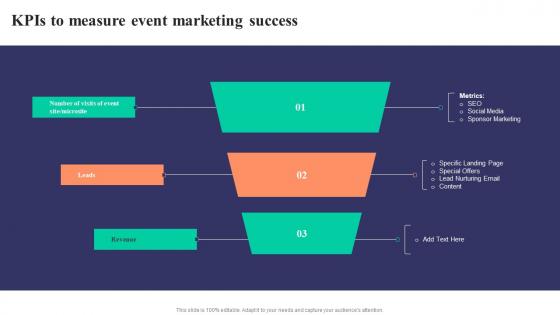
KPIs To Measure Event Marketing Success Strategies To Develop Successful Structure Pdf
If your project calls for a presentation, then Slidegeeks is your go-to partner because we have professionally designed, easy-to-edit templates that are perfect for any presentation. After downloading, you can easily edit KPIs To Measure Event Marketing Success Strategies To Develop Successful Structure Pdf and make the changes accordingly. You can rearrange slides or fill them with different images. Check out all the handy templates Our KPIs To Measure Event Marketing Success Strategies To Develop Successful Structure Pdf are topically designed to provide an attractive backdrop to any subject. Use them to look like a presentation pro.
Linear Flow Connecting Diverging 9 Arrows Gear Process PowerPoint Templates
We present our linear flow connecting diverging 9 arrows Gear Process PowerPoint templates.Use our Arrows PowerPoint Templates because this diagram depicts the essence of this chain reaction like sequence of events. Present our Success PowerPoint Templates because iT outlines the entire thought process for the benefit of others. Tell it to the world with your characteristic aplomb. Download and present our Signs PowerPoint Templates because you can gain the success to desired levels in one go. Download our Shapes PowerPoint Templates because you should take your team soaring to the pinnacle they crave. Download our Process and Flows PowerPoint Templates because you can come forth with the plans you have so carefully laid out.Use these PowerPoint slides for presentations relating to Abstract, arrow, brochure, business,button, chart, circle, company, cyclic,data, demonstration, diagram,economic, financial, glossy, goal, graph,illustration, info, information, investment,manage, marketing, model, navigation,option, part, pie, presentation, process,result, section, segmented, sharing,sphere. The prominent colors used in the PowerPoint template are Gray, Black, White. People tell us our linear flow connecting diverging 9 arrows Gear Process PowerPoint templates are Enchanting. Customers tell us our business PowerPoint templates and PPT Slides are Stunning. Professionals tell us our linear flow connecting diverging 9 arrows Gear Process PowerPoint templates are Glamorous. Presenters tell us our business PowerPoint templates and PPT Slides are Wistful. Use our linear flow connecting diverging 9 arrows Gear Process PowerPoint templates are Tranquil. Presenters tell us our button PowerPoint templates and PPT Slides will help you be quick off the draw. Just enter your specific text and see your points hit home. Benefit from diverse contributions with our Linear Flow Connecting Diverging 9 Arrows Gear Process PowerPoint Templates. They contain the best from all around.
Linear Flow Connecting Diverging 9 Arrows Ppt Gear Process PowerPoint Templates
We present our linear flow connecting diverging 9 arrows ppt Gear Process PowerPoint templates.Download our Flow charts PowerPoint Templates because we provide the means to project your views. Present our Ring Charts PowerPoint Templates because brilliant ideas popping up all over the place. Use our Arrows PowerPoint Templates because it depicts Rolling along while gathering profits along the way is the aim. Download and present our Success PowerPoint Templates because your quest has taken you well onto the path of success. Download and present our Business PowerPoint Templates because watch the excitement levels rise as they realise their worth.Use these PowerPoint slides for presentations relating to Abstract, arrow, brochure, business,button, chart, circle, company, cyclic,data, demonstration, diagram,economic, financial, glossy, goal, graph,illustration, info, information, investment,manage, marketing, model, navigation,option, part, pie, presentation, process. The prominent colors used in the PowerPoint template are Yellow, Black, White. People tell us our linear flow connecting diverging 9 arrows ppt Gear Process PowerPoint templates are Cheerful. Customers tell us our cyclic PowerPoint templates and PPT Slides are Efficient. Professionals tell us our linear flow connecting diverging 9 arrows ppt Gear Process PowerPoint templates are Precious. Presenters tell us our chart PowerPoint templates and PPT Slides will make the presenter successul in his career/life. Use our linear flow connecting diverging 9 arrows ppt Gear Process PowerPoint templates provide you with a vast range of viable options. Select the appropriate ones and just fill in your text. Presenters tell us our company PowerPoint templates and PPT Slides are Functional. See your audience react before your very eyes. Our Linear Flow Connecting Diverging 9 Arrows Ppt Gear Process PowerPoint Templates extract positive delight.
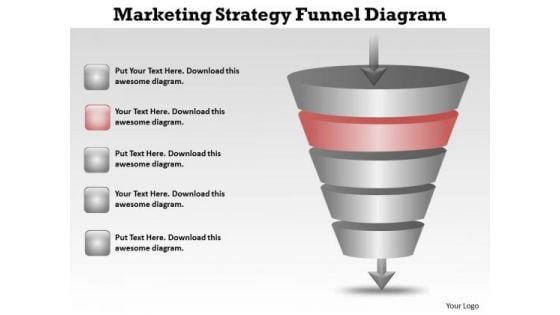
Flowchart For Business Marketing Strategy Funnel Diagram Ppt 2 PowerPoint Templates
We present our flowchart for business marketing strategy funnel diagram ppt 2 PowerPoint templates.Use our Process and flows PowerPoint Templates because Our PowerPoint Templates and Slides are innately eco-friendly. Their high recall value negate the need for paper handouts. Use our Flow Charts PowerPoint Templates because You can Bask in the warmth of our PowerPoint Templates and Slides. Enjoy the heartfelt glowing response of your listeners. Use our Marketing PowerPoint Templates because Our PowerPoint Templates and Slides are designed to help you succeed. They have all the ingredients you need. Download and present our Shapes PowerPoint Templates because Our PowerPoint Templates and Slides are focused like a searchlight beam. They highlight your ideas for your target audience. Present our Business PowerPoint Templates because Our PowerPoint Templates and Slides are innately eco-friendly. Their high recall value negate the need for paper handouts.Use these PowerPoint slides for presentations relating to Business, chart, concept, conceptual, construction, corporate, data, design, diagram, direction, elegant, focus, growth, hierarchy, illustration, information, layer, layered, level, manage, management, metal, metallic, model, organization, process, progress, pyramid, pyramid chart, rank, reflection, resource, set, shape, silver, stage, statistics, structure, support, symbol. The prominent colors used in the PowerPoint template are Red, Gray, White. Professionals tell us our flowchart for business marketing strategy funnel diagram ppt 2 PowerPoint templates are aesthetically designed to attract attention. We guarantee that they will grab all the eyeballs you need. Presenters tell us our conceptual PowerPoint templates and PPT Slides will save the presenter time. The feedback we get is that our flowchart for business marketing strategy funnel diagram ppt 2 PowerPoint templates will help you be quick off the draw. Just enter your specific text and see your points hit home. Use our corporate PowerPoint templates and PPT Slides will make you look like a winner. You can be sure our flowchart for business marketing strategy funnel diagram ppt 2 PowerPoint templates are designed to make your presentations professional. Customers tell us our construction PowerPoint templates and PPT Slides are the best it can get when it comes to presenting. Drive to success with our Flowchart For Business Marketing Strategy Funnel Diagram Ppt 2 PowerPoint Templates. You will come out on top.
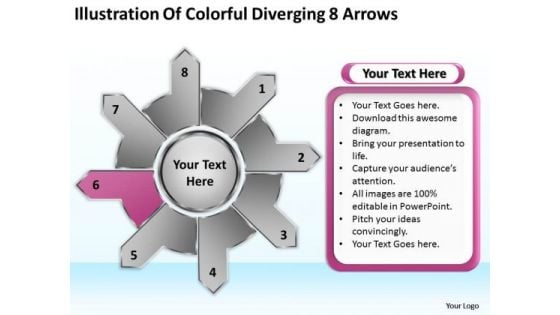
Illustration Of Colorful Diverging 8 Arrows Cycle Motion Chart PowerPoint Slides
We present our illustration of colorful diverging 8 arrows Cycle Motion Chart PowerPoint Slides.Use our Process and Flows PowerPoint Templates because it helps you to display your ideas and thoughts. Download our Success PowerPoint Templates because the choices you make today will determine the future growth of your enterprise. Download our Arrows PowerPoint Templates because you have to coordinate and motivate your team. Present our Flow charts PowerPoint Templates because chain reactions are the element of teamwork which add value to your efforts. Present our Shapes PowerPoint Templates because you have the product you are very confident of and are very sure it will prove immensely popular with clients all over your target areas.Use these PowerPoint slides for presentations relating to Arrow, box, business,ceo, chain, chart, color, concept, connect,connection, connectivity, corporate, data,design, diagram, financial, flow,flowchart, glassy, global, glossy, graph,graphical, group, hierarchy, highlight,important, ladder, manager, office,officer, organization, organize, plan,process. The prominent colors used in the PowerPoint template are Pink, Gray, Black. People tell us our illustration of colorful diverging 8 arrows Cycle Motion Chart PowerPoint Slides are Delightful. Customers tell us our connect PowerPoint templates and PPT Slides are Zippy. Professionals tell us our illustration of colorful diverging 8 arrows Cycle Motion Chart PowerPoint Slides are Charming. Presenters tell us our ceo PowerPoint templates and PPT Slides are Multicolored. Use our illustration of colorful diverging 8 arrows Cycle Motion Chart PowerPoint Slides are Youthful. Presenters tell us our chain PowerPoint templates and PPT Slides are Ultra. Field your thoughts with our Illustration Of Colorful Diverging 8 Arrows Cycle Motion Chart PowerPoint Slides. They will make an enormous contribution to your effort.
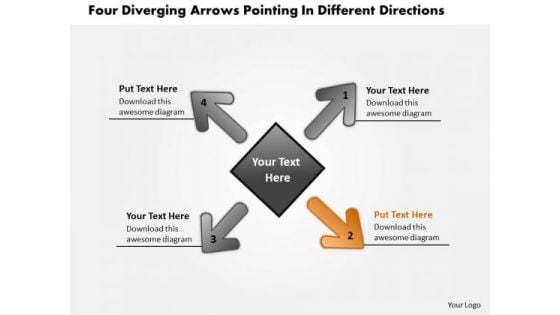
Diverging Arrows Pointing Different Directions Circular Process Chart PowerPoint Slides
We present our diverging arrows pointing different directions Circular Process Chart PowerPoint Slides.Present our Arrows PowerPoint Templates because you have an idea of which you are sure. Present our Process and flows PowerPoint Templates because this diagram helps in examine each brilliant thought in thorough detail highlighting all the pros and cons as minutely as possible. Download and present our Business PowerPoint Templates because project your ideas to you colleagues and complete the full picture. Present our Flow charts PowerPoint Templates because you have churned your mind and come up with effective ways and means to further refine it. Use our Signs PowerPoint Templates because forward thinking is the way to go.Use these PowerPoint slides for presentations relating to Arrow, brochure, business,businessman, button, chart, circle,company, cyclic, data, demonstration,diagram, financial, five,glossy, goal, graph, illustration, info,information, investment, man, manage,marketing, model, navigation, option,part, people, person, pie, presentation,process, result, section, segmented. The prominent colors used in the PowerPoint template are Green, White, Black. People tell us our diverging arrows pointing different directions Circular Process Chart PowerPoint Slides will save the presenter time. Professionals tell us our company PowerPoint templates and PPT Slides are Detailed. We assure you our diverging arrows pointing different directions Circular Process Chart PowerPoint Slides will make you look like a winner. PowerPoint presentation experts tell us our business PowerPoint templates and PPT Slides are Elevated. We assure you our diverging arrows pointing different directions Circular Process Chart PowerPoint Slides are Spiffy. People tell us our chart PowerPoint templates and PPT Slides are Appealing. Sharpen your strategy with our Diverging Arrows Pointing Different Directions Circular Process Chart PowerPoint Slides. You will come out on top.
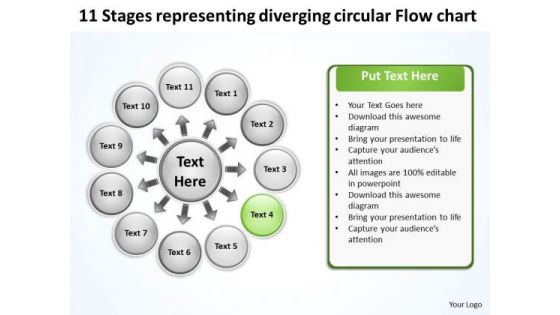
Representing Diverging Circular Flow Chart PowerPoint Templates
We present our representing diverging circular flow chart PowerPoint templates.Present our Ring charts PowerPoint Templates because this PPt slide helps you to measure key aspects of the current process and collect relevant data. Download our Circle charts PowerPoint Templates because the mind is always whirring with new ideas. Download our Process and Flows PowerPoint Templates because you have a clear vision of the cake you want. Download our Business PowerPoint Templates because you can Flutter your wings and enchant the world. Impress them with the innate attractiveness of your thoughts and words. Download our Marketing PowerPoint Templates because with the help of our Slides you can Illustrate your ideas one by one and demonstrate how each is an important cog in running the entire wheel.Use these PowerPoint slides for presentations relating to Circle, circulation, cobalt,colorful, cyan, cycle, element,emblem, grayshadow, green,icon, indicator, interface, internet, label,link, load, marker, motion, movement,navigationpanel, next, orientation, pagsite, pink, pointer, previous, process, reload, rotation, satined, sign, signpost,smooth, sticker, sticky, symbol. The prominent colors used in the PowerPoint template are Green, Black, White. Customers tell us our representing diverging circular flow chart PowerPoint templates will make the presenter successul in his career/life. We assure you our cobalt PowerPoint templates and PPT Slides are Nifty. PowerPoint presentation experts tell us our representing diverging circular flow chart PowerPoint templates are Fabulous. People tell us our grayshadow PowerPoint templates and PPT Slides will help you be quick off the draw. Just enter your specific text and see your points hit home. We assure you our representing diverging circular flow chart PowerPoint templates are Excellent. Use our cobalt PowerPoint templates and PPT Slides have awesome images to get your point across. Compile targets with our Representing Diverging Circular Flow Chart PowerPoint Templates. Download without worries with our money back guaranteee.
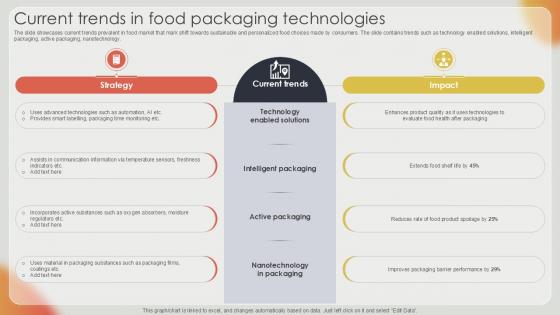
Current Trends In Food Packaging Effective Strategies For Strengthening Food Ppt Presentation
The slide showcases current trends prevalent in food market that mark shift towards sustainable and personalized food choices made by consumers. The slide contains trends such as technology enabled solutions, intelligent packaging, active packaging, nanotechnology. Do you have to make sure that everyone on your team knows about any specific topic I yes, then you should give Current Trends In Food Packaging Effective Strategies For Strengthening Food Ppt Presentation a try. Our experts have put a lot of knowledge and effort into creating this impeccable Current Trends In Food Packaging Effective Strategies For Strengthening Food Ppt Presentation. You can use this template for your upcoming presentations, as the slides are perfect to represent even the tiniest detail. You can download these templates from the Slidegeeks website and these are easy to edit. So grab these today The slide showcases current trends prevalent in food market that mark shift towards sustainable and personalized food choices made by consumers. The slide contains trends such as technology enabled solutions, intelligent packaging, active packaging, nanotechnology.

QA Project Prioritization Report With Budget And Benefits Ppt PowerPoint Presentation Gallery Themes PDF
Showcasing this set of slides titled qa project prioritization report with budget and benefits ppt powerpoint presentation gallery themes pdf. The topics addressed in these templates are budget, resources, complexity. All the content presented in this PPT design is completely editable. Download it and make adjustments in color, background, font etc. as per your unique business setting.
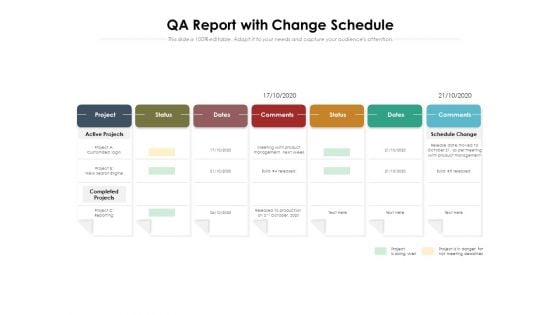
QA Report With Change Schedule Ppt PowerPoint Presentation Gallery Diagrams PDF
Showcasing this set of slides titled qa report with change schedule ppt powerpoint presentation gallery diagrams pdf. The topics addressed in these templates are management, customized login, search engine. All the content presented in this PPT design is completely editable. Download it and make adjustments in color, background, font etc. as per your unique business setting.
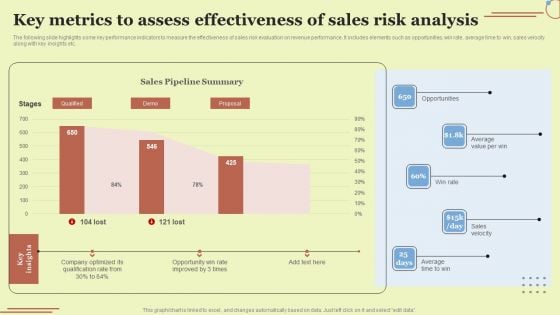
Key Metrics To Assess Effectiveness Of Sales Risk Analysis Download PDF
The following slide highlights some key performance indicators to measure the effectiveness of sales risk evaluation on revenue performance. It includes elements such as opportunities, win rate, average time to win, sales velocity along with key insights etc. Get a simple yet stunning designed Key Metrics To Assess Effectiveness Of Sales Risk Analysis Download PDF. It is the best one to establish the tone in your meetings. It is an excellent way to make your presentations highly effective. So, download this PPT today from Slidegeeks and see the positive impacts. Our easy to edit Key Metrics To Assess Effectiveness Of Sales Risk Analysis Download PDF can be your go to option for all upcoming conferences and meetings. So, what are you waiting for Grab this template today.
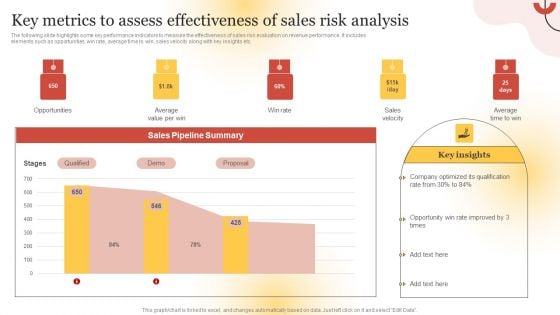
Executing Sales Risk Reduction Plan Key Metrics To Assess Effectiveness Of Sales Risk Analysis Background PDF
The following slide highlights some key performance indicators to measure the effectiveness of sales risk evaluation on revenue performance. It includes elements such as opportunities, win rate, average time to win, sales velocity along with key insights etc. Get a simple yet stunning designed Executing Sales Risk Reduction Plan Key Metrics To Assess Effectiveness Of Sales Risk Analysis Background PDF. It is the best one to establish the tone in your meetings. It is an excellent way to make your presentations highly effective. So, download this PPT today from Slidegeeks and see the positive impacts. Our easy to edit Executing Sales Risk Reduction Plan Key Metrics To Assess Effectiveness Of Sales Risk Analysis Background PDF can be your go to option for all upcoming conferences and meetings. So, what are you waiting for Grab this template today.
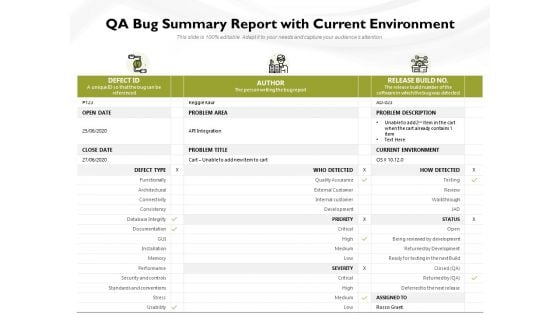
QA Bug Summary Report With Current Environment Ppt PowerPoint Presentation File Structure PDF
Pitch your topic with ease and precision using this qa bug summary report with current environment ppt powerpoint presentation file structure pdf. This layout presents information on development, environment, performance. It is also available for immediate download and adjustment. So, changes can be made in the color, design, graphics or any other component to create a unique layout.
QA Status Report With Open Defects And Development Ppt PowerPoint Presentation Icon Infographics PDF
Pitch your topic with ease and precision using this qa status report with open defects and development ppt powerpoint presentation icon infographics pdf. This layout presents information on criteria, developer, environment. It is also available for immediate download and adjustment. So, changes can be made in the color, design, graphics or any other component to create a unique layout.
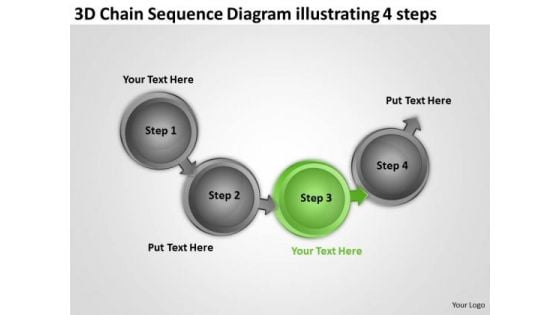
3d Chain Sequence Diagram Illustrating 4 Steps Ppt Business Plan Financials PowerPoint Slides
We present our 3d chain sequence diagram illustrating 4 steps ppt business plan financials PowerPoint Slides.Present our Finance PowerPoint Templates because Our PowerPoint Templates and Slides will fulfill your every need. Use them and effectively satisfy the desires of your audience. Use our Business PowerPoint Templates because you can see clearly through to the bigger bowl ahead. Time your jump to perfection and hit the nail on the head. Use our Circle Charts PowerPoint Templates because this template will explain the value of its wellness to human life. Use our Flow charts PowerPoint Templates because it depicts Rolling along while gathering profits along the way is the aim. Use our Arrows PowerPoint Templates because clear thnking is your strength, transmit your thoughts to your eager team.Use these PowerPoint slides for presentations relating to Arrow, Business, Chain, Chart, Circle, Circle, Frame, Color, Concept, Connect, Connection, Connectivity, Corporate, Data, Design, Diagram, Financial, Flow, Flowchart, Graph, Graphical, Group, Important, Organization, Organize, Plan, Process, Rectangle, Relation, Set, Steps, Structure, Teamwork. The prominent colors used in the PowerPoint template are Green, Gray, Black. Professionals tell us our 3d chain sequence diagram illustrating 4 steps ppt business plan financials PowerPoint Slides will make the presenter successul in his career/life. We assure you our Concept PowerPoint templates and PPT Slides are Gorgeous. People tell us our 3d chain sequence diagram illustrating 4 steps ppt business plan financials PowerPoint Slides are Ultra. Customers tell us our Chart PowerPoint templates and PPT Slides are Perfect. Use our 3d chain sequence diagram illustrating 4 steps ppt business plan financials PowerPoint Slides are Efficient. We assure you our Circle PowerPoint templates and PPT Slides are Gorgeous. End all differences with our 3d Chain Sequence Diagram Illustrating 4 Steps Ppt Business Plan Financials PowerPoint Slides. They encourage achieving consensus.

How To Draw Business Process Diagram 3d Man With Yes PowerPoint Slides
We present our how to draw business process diagram 3d man with yes PowerPoint Slides.Download and present our Business PowerPoint Templates because Our PowerPoint Templates and Slides will let Your superior ideas hit the target always and everytime. Use our Marketing PowerPoint Templates because Your ideas provide food for thought. Our PowerPoint Templates and Slides will help you create a dish to tickle the most discerning palate. Present our Finance PowerPoint Templates because Our PowerPoint Templates and Slides will let you meet your Deadlines. Download our Shapes PowerPoint Templates because It can Leverage your style with our PowerPoint Templates and Slides. Charm your audience with your ability. Download our Background PowerPoint Templates because You can Be the star of the show with our PowerPoint Templates and Slides. Rock the stage with your ideas.Use these PowerPoint slides for presentations relating to 3d, Allowed, Assistance, Authority, Ball, Bright, Business, Cartoon, Color, Confidence, Data, Direction, Glass, Go, Green, Help, Helper, Human, Illustration, Image, Law, Letter, Lying, Man, Manual, Occupation, One, Only, Open, People, Person, Post, Prompting, Puppet, Resolved, Safety, Sanction, Security, Showing, Sign, Sphere, Symbol, System, Traffic, Waiting, White, Word. The prominent colors used in the PowerPoint template are Green, Gray, Blue. Presenters tell us our how to draw business process diagram 3d man with yes PowerPoint Slides are second to none. PowerPoint presentation experts tell us our Color PowerPoint templates and PPT Slides will help them to explain complicated concepts. Professionals tell us our how to draw business process diagram 3d man with yes PowerPoint Slides are designed to make your presentations professional. People tell us our Color PowerPoint templates and PPT Slides will impress their bosses and teams. The feedback we get is that our how to draw business process diagram 3d man with yes PowerPoint Slides will help them to explain complicated concepts. Customers tell us our Bright PowerPoint templates and PPT Slides will help them to explain complicated concepts. Analyse strategies with our How To Draw Business Process Diagram 3d Man With Yes PowerPoint Slides. You will come out on top.

Business People Walking 3d Man With Www PowerPoint Templates
We present our business people walking 3d man with www PowerPoint templates.Download our People PowerPoint Templates because Our PowerPoint Templates and Slides will give you great value for your money. Be assured of finding the best projection to highlight your words. Present our Business PowerPoint Templates because you should once Tap the ingenuity of our PowerPoint Templates and Slides. They are programmed to succeed. Download our Computer PowerPoint Templates because Our PowerPoint Templates and Slides will let your words and thoughts hit bullseye everytime. Download our Future PowerPoint Templates because You have a driving passion to excel in your field. Our PowerPoint Templates and Slides will prove ideal vehicles for your ideas. Download our Shapes PowerPoint Templates because Your audience will believe you are the cats whiskers.Use these PowerPoint slides for presentations relating to 3d, abstract, background, business, character, cloud, communication, company, computer, concept, connection, data, design, idea, illustration, image, information, internet, laptop, people, person, puppet, render, sign, site, tech, web, website, white, world, www. The prominent colors used in the PowerPoint template are Blue , Gray, White. We assure you our business people walking 3d man with www PowerPoint templates help you meet deadlines which are an element of today's workplace. Just browse and pick the slides that appeal to your intuitive senses. You can be sure our computer PowerPoint templates and PPT Slides are readymade to fit into any presentation structure. Use our business people walking 3d man with www PowerPoint templates will save the presenter time. We assure you our character PowerPoint templates and PPT Slides effectively help you save your valuable time. Use our business people walking 3d man with www PowerPoint templates effectively help you save your valuable time. Professionals tell us our communication PowerPoint templates and PPT Slides have awesome images to get your point across. Our Business People Walking 3d Man With Www PowerPoint Templates are able architects. They give concrete shape to your ideas.
Online Promotional Activities Analyze And Optimize Icons Pdf
This slide showcases KPIs that can be tracked by restaurant for measuring effectiveness of email marketing campaign. It also showcases A B testing for optimizing bad performing emails Want to ace your presentation in front of a live audience Our Online Promotional Activities Analyze And Optimize Icons Pdf can help you do that by engaging all the users towards you. Slidegeeks experts have put their efforts and expertise into creating these impeccable powerpoint presentations so that you can communicate your ideas clearly. Moreover, all the templates are customizable, and easy to edit and downloadable. Use these for both personal and commercial use. This slide showcases KPIs that can be tracked by restaurant for measuring effectiveness of email marketing campaign. It also showcases A B testing for optimizing bad performing emails
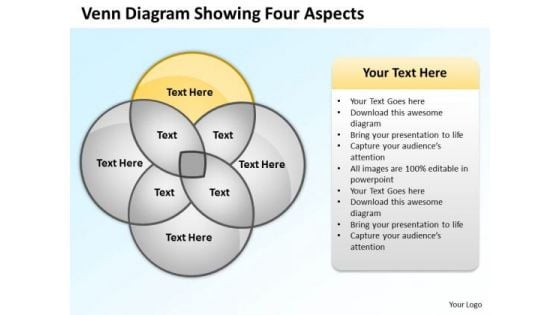
Business Power Point Venn Diagram Showing Four Aspects PowerPoint Slides
We present our business power point venn diagram showing four aspects PowerPoint Slides.Download and present our Circle Charts PowerPoint Templates because Our PowerPoint Templates and Slides are specially created by a professional team with vast experience. They diligently strive to come up with the right vehicle for your brilliant Ideas. Download our Ring Charts PowerPoint Templates because It can be used to Set your controls for the heart of the sun. Our PowerPoint Templates and Slides will be the propellant to get you there. Use our Process and Flows PowerPoint Templates because Our PowerPoint Templates and Slides will let you Hit the target. Go the full distance with ease and elan. Download and present our Flow Charts PowerPoint Templates because It will Raise the bar of your Thoughts. They are programmed to take you to the next level. Present our Business PowerPoint Templates because You are working at that stage with an air of royalty. Let our PowerPoint Templates and Slides be the jewels in your crown.Use these PowerPoint slides for presentations relating to Business, button, catalog, chart, circle, company, cross, data, design, diagram, direction, document, financial, four, glossy, goals, graph, junction, management, market, marketing, model, multicolored, multiple, navigation, network, options, plan, presentation, process, purple, results, shiny, sphere, statistics, stock, structure. The prominent colors used in the PowerPoint template are Yellow, Gray, White. People tell us our business power point venn diagram showing four aspects PowerPoint Slides are the best it can get when it comes to presenting. PowerPoint presentation experts tell us our cross PowerPoint templates and PPT Slides are effectively colour coded to prioritise your plans They automatically highlight the sequence of events you desire. Presenters tell us our business power point venn diagram showing four aspects PowerPoint Slides will help you be quick off the draw. Just enter your specific text and see your points hit home. Use our chart PowerPoint templates and PPT Slides provide great value for your money. Be assured of finding the best projection to highlight your words. Customers tell us our business power point venn diagram showing four aspects PowerPoint Slides are incredible easy to use. People tell us our cross PowerPoint templates and PPT Slides are specially created by a professional team with vast experience. They diligently strive to come up with the right vehicle for your brilliant Ideas. Our Business Power Point Venn Diagram Showing Four Aspects PowerPoint Slides are highly esteemed. They have jump started many a career.
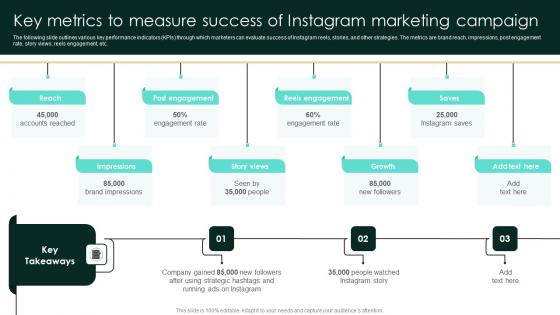
Key Metrics To Measure Success Of Instagram Marketing Campaign Strategic Real Estate Rules Pdf
The following slide outlines various key performance indicators KPIs through which marketers can evaluate success of Instagram reels, stories, and other strategies. The metrics are brand reach, impressions, post engagement rate, story views, reels engagement, etc. Slidegeeks has constructed Key Metrics To Measure Success Of Instagram Marketing Campaign Strategic Real Estate Rules Pdf after conducting extensive research and examination. These presentation templates are constantly being generated and modified based on user preferences and critiques from editors. Here, you will find the most attractive templates for a range of purposes while taking into account ratings and remarks from users regarding the content. This is an excellent jumping-off point to explore our content and will give new users an insight into our top-notch PowerPoint Templates. The following slide outlines various key performance indicators KPIs through which marketers can evaluate success of Instagram reels, stories, and other strategies. The metrics are brand reach, impressions, post engagement rate, story views, reels engagement, etc.
Four Key Techniques To Measure Business Excellence Ppt Icon Inspiration PDF
This slide covers four diagnostics to measure commercial excellence. It includes tactics such as leadership team strategic alignment, asking for team suggestions, receiving feedback from right customers and use metrics beyond beyond revenue. Presenting Four Key Techniques To Measure Business Excellence Ppt Icon Inspiration PDF to dispense important information. This template comprises four stages. It also presents valuable insights into the topics including Leadership Team, Strategic Alignment, Feedback Right Customers. This is a completely customizable PowerPoint theme that can be put to use immediately. So, download it and address the topic impactfully.
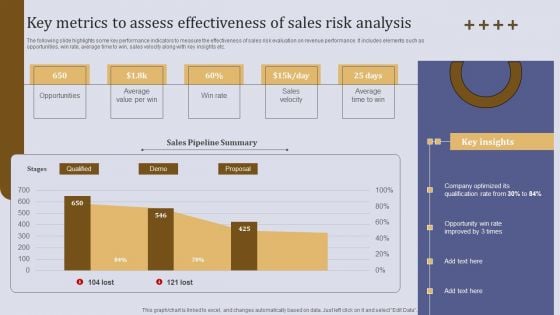
Key Metrics To Assess Effectiveness Of Sales Risk Analysis Ppt Outline Design Ideas PDF
The following slide highlights some key performance indicators to measure the effectiveness of sales risk evaluation on revenue performance. It includes elements such as opportunities, win rate, average time to win, sales velocity along with key insights etc. Retrieve professionally designed Key Metrics To Assess Effectiveness Of Sales Risk Analysis Ppt Outline Design Ideas PDF to effectively convey your message and captivate your listeners. Save time by selecting pre made slideshows that are appropriate for various topics, from business to educational purposes. These themes come in many different styles, from creative to corporate, and all of them are easily adjustable and can be edited quickly. Access them as PowerPoint templates or as Google Slides themes. You do not have to go on a hunt for the perfect presentation because Slidegeeks got you covered from everywhere.
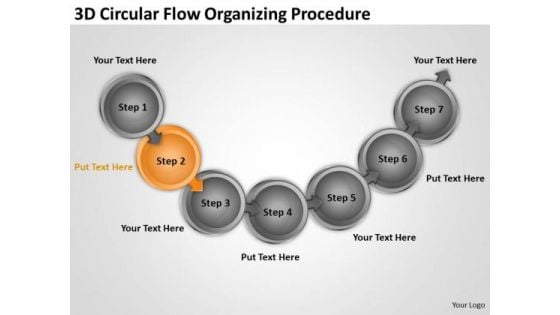
3d Circular Flow Organizing Procedure Daycare Business Plan Template PowerPoint Slides
We present our 3d circular flow organizing procedure daycare business plan template PowerPoint Slides.Download our Finance PowerPoint Templates because you can Bullet-point your thoughts and ideas to profitably accomplish every step of every stage along the way. Use our Business PowerPoint Templates because you have churned your mind and come upwith solutions. Present our Circle Charts PowerPoint Templates because this template helps you to delve on these thoughts and brief your team on the value of your depth of understanding of the subject. Download and present our Flow charts PowerPoint Templates because Our Template designs are State of the Art. Download and present our Arrows PowerPoint Templates because the graphic is a symbol of growth and success.Use these PowerPoint slides for presentations relating to Arrow, Business, Chain, Chart, Circle, Circle, Frame, Color, Concept, Connect, Connection, Connectivity, Corporate, Data, Design, Diagram, Financial, Flow, Flowchart, Graph, Graphical, Group, Important, Organization, Organize, Plan, Process, Rectangle, Relation, Set, Steps, Structure, Teamwork. The prominent colors used in the PowerPoint template are Orange, Gray, Black. Professionals tell us our 3d circular flow organizing procedure daycare business plan template PowerPoint Slides are Perfect. We assure you our Circle PowerPoint templates and PPT Slides are Bold. People tell us our 3d circular flow organizing procedure daycare business plan template PowerPoint Slides are Elevated. Customers tell us our Circle PowerPoint templates and PPT Slides are Splendid. Use our 3d circular flow organizing procedure daycare business plan template PowerPoint Slides are Flirty. We assure you our Chart PowerPoint templates and PPT Slides are Functional. Put your customer in the spotlight with your thoughts. Centre it on him with our 3d Circular Flow Organizing Procedure Daycare Business Plan Template PowerPoint Slides.
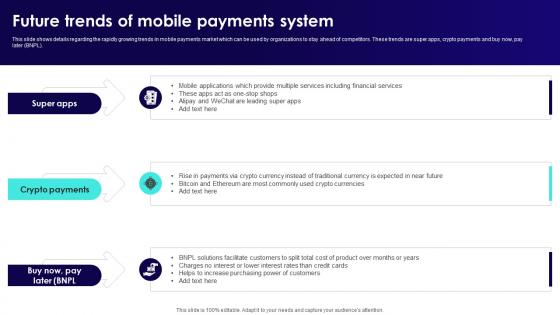
Wireless Banking To Improve Future Trends Of Mobile Payments System Fin SS V
This slide shows details regarding the rapidly growing trends in mobile payments market which can be used by organizations to stay ahead of competitors. These trends are super apps, crypto payments and buy now, pay later BNPL. Retrieve professionally designed Wireless Banking To Improve Future Trends Of Mobile Payments System Fin SS V to effectively convey your message and captivate your listeners. Save time by selecting pre-made slideshows that are appropriate for various topics, from business to educational purposes. These themes come in many different styles, from creative to corporate, and all of them are easily adjustable and can be edited quickly. Access them as PowerPoint templates or as Google Slides themes. You do not have to go on a hunt for the perfect presentation because Slidegeeks got you covered from everywhere. This slide shows details regarding the rapidly growing trends in mobile payments market which can be used by organizations to stay ahead of competitors. These trends are super apps, crypto payments and buy now, pay later BNPL.
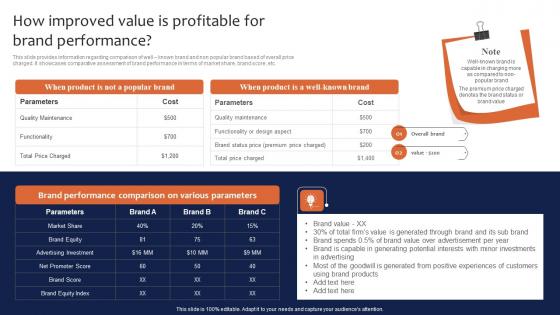
How Improved Value Is Profitable For Brand Performance Leveraging Corporate Infographics Pdf
This slide provides information regarding comparison of well known brand and non popular brand based of overall price charged. It showcases comparative assessment of brand performance in terms of market share, brand score, etc. This How Improved Value Is Profitable For Brand Performance Leveraging Corporate Infographics Pdf is perfect for any presentation, be it in front of clients or colleagues. It is a versatile and stylish solution for organizing your meetings. The How Improved Value Is Profitable For Brand Performance Leveraging Corporate Infographics Pdf features a modern design for your presentation meetings. The adjustable and customizable slides provide unlimited possibilities for acing up your presentation. Slidegeeks has done all the homework before launching the product for you. So, do not wait, grab the presentation templates today This slide provides information regarding comparison of well known brand and non popular brand based of overall price charged. It showcases comparative assessment of brand performance in terms of market share, brand score, etc.
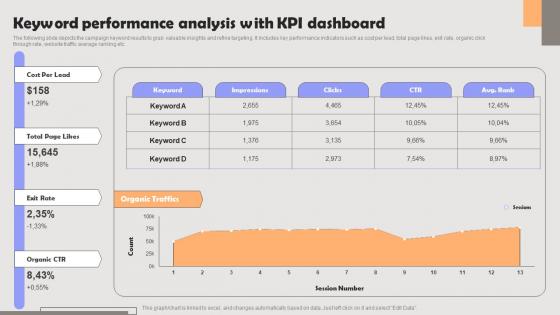
Improving PPC Campaign Results Keyword Performance Analysis With KPI Sample Pdf
The following slide depicts the campaign keyword results to grab valuable insights and refine targeting. It includes key performance indicators such as cost per lead, total page likes, exit rate, organic click through rate, website traffic average ranking etc. This Improving PPC Campaign Results Keyword Performance Analysis With KPI Sample Pdf is perfect for any presentation, be it in front of clients or colleagues. It is a versatile and stylish solution for organizing your meetings. The Improving PPC Campaign Results Keyword Performance Analysis With KPI Sample Pdf features a modern design for your presentation meetings. The adjustable and customizable slides provide unlimited possibilities for acing up your presentation. Slidegeeks has done all the homework before launching the product for you. So, do not wait, grab the presentation templates today The following slide depicts the campaign keyword results to grab valuable insights and refine targeting. It includes key performance indicators such as cost per lead, total page likes, exit rate, organic click through rate, website traffic average ranking etc.
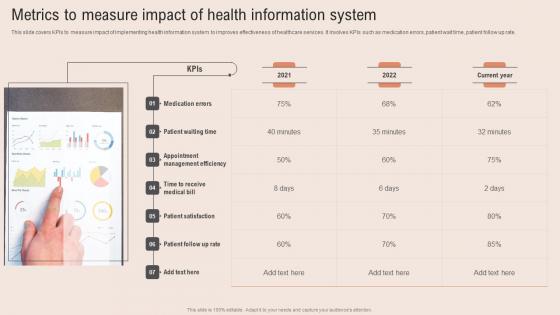
Metrics To Measure Impact Healthcare Information Tech To Enhance Medical Facilities Infographics Pdf
This slide covers KPIs to measure impact of implementing health information system to improves effectiveness of healthcare services. It involves KPIs such as medication errors, patient wait time, patient follow up rate. Do you know about Slidesgeeks Metrics To Measure Impact Healthcare Information Tech To Enhance Medical Facilities Infographics Pdf These are perfect for delivering any kind od presentation. Using it, create PowerPoint presentations that communicate your ideas and engage audiences. Save time and effort by using our pre designed presentation templates that are perfect for a wide range of topic. Our vast selection of designs covers a range of styles, from creative to business, and are all highly customizable and easy to edit. Download as a PowerPoint template or use them as Google Slides themes. This slide covers KPIs to measure impact of implementing health information system to improves effectiveness of healthcare services. It involves KPIs such as medication errors, patient wait time, patient follow up rate.
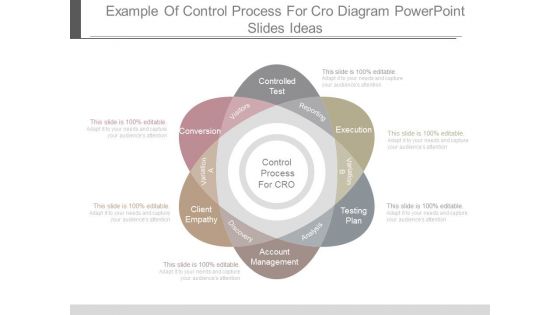
Example Of Control Process For Cro Diagram Powerpoint Slides Ideas
This is a example of control process for cro diagram powerpoint slides ideas. This is a six stage process. The stages in this process are control process for cro, controlled test, execution, testing plan, account management, client empathy, conversion, reporting, variation b, analysis, discovery, variation a, visitors.
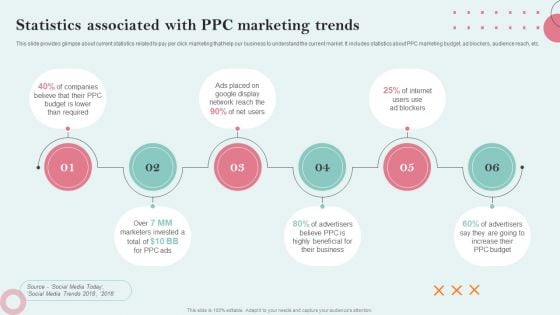
Strategies Employing PPC Advertising Statistics Associated With PPC Marketing Trends Portrait PDF
This slide provides glimpse about current statistics related to pay per click marketing that help our business to understand the current market. It includes statistics about PPC marketing budget, ad blockers, audience reach, etc. Slidegeeks has constructed Network Reach, Business, Beneficial after conducting extensive research and examination. These presentation templates are constantly being generated and modified based on user preferences and critiques from editors. Here, you will find the most attractive templates for a range of purposes while taking into account ratings and remarks from users regarding the content. This is an excellent jumping off point to explore our content and will give new users an insight into our top notch PowerPoint Templates.
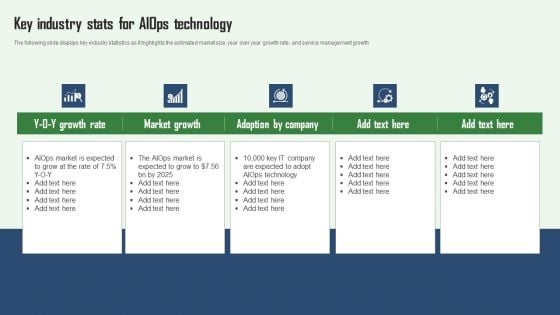
Aiops Integration Summary Report Key Industry Stats For Aiops Technology Formats PDF
The following slide displays key industry statistics as it highlights the estimated market size, year over year growth rate, and service management growth. Do you have to make sure that everyone on your team knows about any specific topic I yes, then you should give Aiops Integration Summary Report Key Industry Stats For Aiops Technology Formats PDF a try. Our experts have put a lot of knowledge and effort into creating this impeccable Aiops Integration Summary Report Key Industry Stats For Aiops Technology Formats PDF. You can use this template for your upcoming presentations, as the slides are perfect to represent even the tiniest detail. You can download these templates from the Slidegeeks website and these are easy to edit. So grab these today.
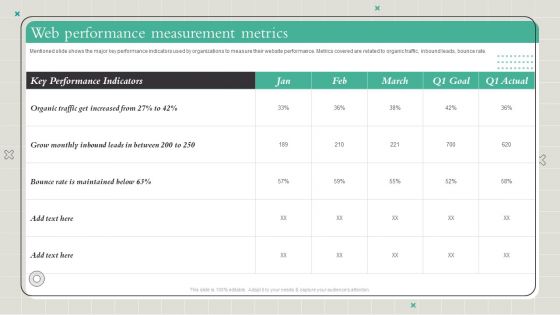
Playbook To Formulate Efficient Web Performance Measurement Metrics Diagrams PDF
Mentioned slide shows the major key performance indicators used by organizations to measure their website performance. Metrics covered are related to organic traffic, inbound leads, bounce rate. Slidegeeks has constructed Playbook To Formulate Efficient Web Performance Measurement Metrics Diagrams PDF after conducting extensive research and examination. These presentation templates are constantly being generated and modified based on user preferences and critiques from editors. Here, you will find the most attractive templates for a range of purposes while taking into account ratings and remarks from users regarding the content. This is an excellent jumping-off point to explore our content and will give new users an insight into our top-notch PowerPoint Templates.
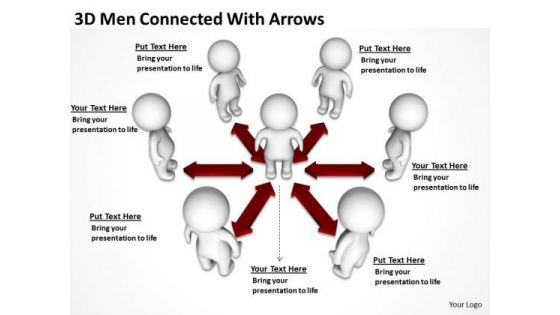
Business Charts Examples 3d Men Connected With Arrows PowerPoint Templates
We present our business charts examples 3d men connected with arrows PowerPoint templates.Download our People PowerPoint Templates because You have gained great respect for your brilliant ideas. Use our PowerPoint Templates and Slides to strengthen and enhance your reputation. Download our Arrows PowerPoint Templates because You aspire to touch the sky with glory. Let our PowerPoint Templates and Slides provide the fuel for your ascent. Present our Leadership PowerPoint Templates because You will get more than you ever bargained for. Present our Shapes PowerPoint Templates because you can Add colour to your speech with our PowerPoint Templates and Slides. Your presentation will leave your audience speechless. Download and present our Business PowerPoint Templates because Our PowerPoint Templates and Slides will let you Leave a lasting impression to your audiences. They possess an inherent longstanding recall factor.Use these PowerPoint slides for presentations relating to 3d, arrow, background, business, circle,circular, colleagues, colors,communicate, communication,community, concept, connect,connection, connectivity, data,discussion, flow, forum, friends, gossip,gossiping, hierarchy, inform, information,internet, lead, leader, leadership, link,linked, linking, men, mouth, network,networking, people, person. The prominent colors used in the PowerPoint template are Red, White, Black. You can be sure our business charts examples 3d men connected with arrows PowerPoint templates look good visually. Use our circular PowerPoint templates and PPT Slides will help them to explain complicated concepts. Professionals tell us our business charts examples 3d men connected with arrows PowerPoint templates help you meet deadlines which are an element of today's workplace. Just browse and pick the slides that appeal to your intuitive senses. Customers tell us our circle PowerPoint templates and PPT Slides are second to none. Customers tell us our business charts examples 3d men connected with arrows PowerPoint templates will help them to explain complicated concepts. Use our communicate PowerPoint templates and PPT Slides are effectively colour coded to prioritise your plans They automatically highlight the sequence of events you desire. Make your presentations quickly with our Business Charts Examples 3d Men Connected With Arrows PowerPoint Templates. You'll always stay ahead of the game.
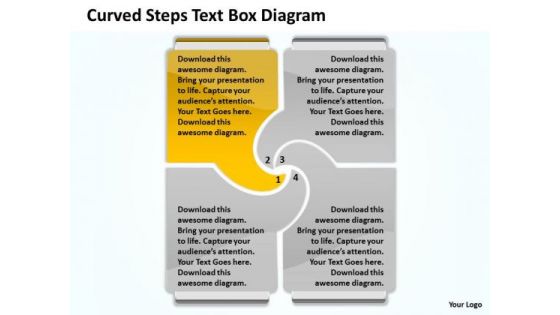
Business Flowchart Steps Text Box Diagram PowerPoint Templates
We present our business flowchart steps text box diagram powerpoint templates.Download our Boxes PowerPoint Templates because our PowerPoint Templates and Slides are the string of your bow. Fire of your ideas and conquer the podium. Download and present our Shapes PowerPoint Templates because Our PowerPoint Templates and Slides will let your words and thoughts hit bullseye everytime. Present our Process and Flows PowerPoint Templates because Our PowerPoint Templates and Slides has conjured up a web of all you need with the help of our great team. Use them to string together your glistening ideas. Download our Flow Charts PowerPoint Templates because Our PowerPoint Templates and Slides are effectively colour coded to prioritise your plans They automatically highlight the sequence of events you desire. Download and present our Business PowerPoint Templates because Our PowerPoint Templates and Slides will weave a web of your great ideas. They are gauranteed to attract even the most critical of your colleagues.Use these PowerPoint slides for presentations relating to Boxes, business, chain, chart, circle, circle frame, color, concept, connect, connection, connectivity, corporate, data, design, diagram, financial, flow, flowchart, graph, graphical, group, hierarchy, highlight, illustration, important, ladder, manager, office, officer, organization, organize, plan, process, rectangle, relation, set, steps, structure, supervisor, teamwork, text. The prominent colors used in the PowerPoint template are Yellow, Gray, Black. People tell us our business flowchart steps text box diagram powerpoint templates are visually appealing. PowerPoint presentation experts tell us our chart PowerPoint templates and PPT Slides look good visually. Presenters tell us our business flowchart steps text box diagram powerpoint templates will impress their bosses and teams. Use our color PowerPoint templates and PPT Slides provide great value for your money. Be assured of finding the best projection to highlight your words. Customers tell us our business flowchart steps text box diagram powerpoint templates effectively help you save your valuable time. People tell us our chain PowerPoint templates and PPT Slides look good visually. Exert some pressure with our Business Flowchart Steps Text Box Diagram PowerPoint Templates. Get the decision in your favour.
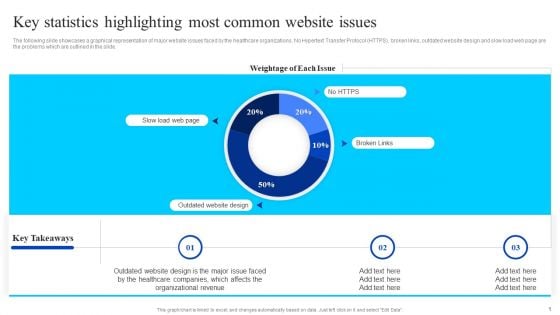
Healthcare Management Overview Trends Stats And Operational Areas Key Statistics Highlighting Most Common Website Issues Infographics PDF
The following slide showcases a graphical representation of major website issues faced by the healthcare organizations. No Hypertext Transfer Protocol HTTPS, broken links, outdated website design and slow load web page are the problems which are outlined in the slide. From laying roadmaps to briefing everything in detail, our templates are perfect for you. You can set the stage with your presentation slides. All you have to do is download these easy to edit and customizable templates. Healthcare Management Overview Trends Stats And Operational Areas Key Statistics Highlighting Most Common Website Issues Infographics PDF will help you deliver an outstanding performance that everyone would remember and praise you for. Do download this presentation today.
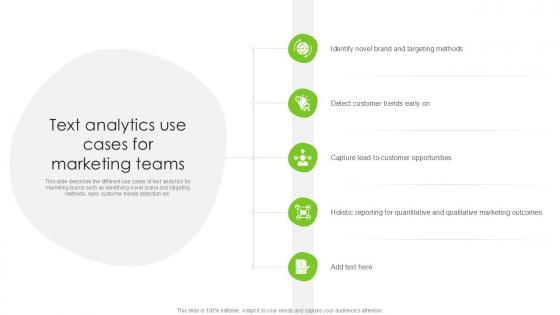
Text Analytics Use Cases For Marketing Teams PPT Sample SS
This slide describes the different use cases of text analytics for marketing teams such as identifying novel brand and targeting methods, early customer trends detection etc. Retrieve professionally designed Text Analytics Use Cases For Marketing Teams PPT Sample SS to effectively convey your message and captivate your listeners. Save time by selecting pre-made slideshows that are appropriate for various topics, from business to educational purposes. These themes come in many different styles, from creative to corporate, and all of them are easily adjustable and can be edited quickly. Access them as PowerPoint templates or as Google Slides themes. You do not have to go on a hunt for the perfect presentation because Slidegeeks got you covered from everywhere. This slide describes the different use cases of text analytics for marketing teams such as identifying novel brand and targeting methods, early customer trends detection etc.
Business Organizational Chart Template 3d Man And Red Folder PowerPoint Templates
We present our business organizational chart template 3d man and red folder PowerPoint templates.Use our Computer PowerPoint Templates because Our PowerPoint Templates and Slides are specially created by a professional team with vast experience. They diligently strive to come up with the right vehicle for your brilliant Ideas. Download and present our Business PowerPoint Templates because It will get your audience in sync. Use our Symbol PowerPoint Templates because You have gained great respect for your brilliant ideas. Use our PowerPoint Templates and Slides to strengthen and enhance your reputation. Use our Technology PowerPoint Templates because You aspire to touch the sky with glory. Let our PowerPoint Templates and Slides provide the fuel for your ascent. Present our Shapes PowerPoint Templates because our PowerPoint Templates and Slides are the string of your bow. Fire of your ideas and conquer the podium.Use these PowerPoint slides for presentations relating to 3d, Archive, Background, Binder, Bureaucracy, Business, Cartoon, Computer, Concept, Data, Document, File, Folder, Group, Heavy, Human, Icon, Idea, Illustration, Image, Information, Internet, Isolated, Manager, Men, Occupation, Office, Order, Organization, Paper, Paperwork, People, Person, Portfolio, Red, Render, Shape, Storage, Success, Support, Symbol, Technology, Three-Dimensional. The prominent colors used in the PowerPoint template are Red, Gray, White. We assure you our business organizational chart template 3d man and red folder PowerPoint templates will make you look like a winner. Use our Cartoon PowerPoint templates and PPT Slides will make the presenter successul in his career/life. We assure you our business organizational chart template 3d man and red folder PowerPoint templates are designed by a team of presentation professionals. Professionals tell us our Bureaucracy PowerPoint templates and PPT Slides are specially created by a professional team with vast experience. They diligently strive to come up with the right vehicle for your brilliant Ideas. The feedback we get is that our business organizational chart template 3d man and red folder PowerPoint templates will make you look like a winner. You can be sure our Bureaucracy PowerPoint templates and PPT Slides effectively help you save your valuable time. Our Business Organizational Chart Template 3d Man And Red Folder PowerPoint Templates are geared for excellence. They will have your thoughts accelerating away.
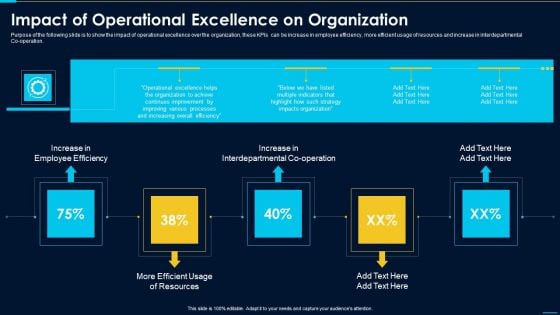
Impact Of Operational Excellence On Organization Background PDF
Increase in Employee Efficiency, Increase in Interdepartmental, Co operation Efficient Purpose of the following slide is to show the impact of operational excellence over the organization, these KPIs can be increase in employee efficiency, more efficient usage of resources and increase in interdepartmental Co operation.This is a impact of operational excellence on organization background pdf template with various stages. Focus and dispense information on five stages using this creative set, that comes with editable features. It contains large content boxes to add your information on topics like identify gaps in the strategy, decide upon strategies, defining key metrics You can also showcase facts, figures, and other relevant content using this PPT layout. Grab it now.

Business Charts Men With Group Of Blue Globe PowerPoint Templates Ppt Backgrounds For Slides
We present our business charts men with group of blue globe PowerPoint templates PPT backgrounds for slides.Download and present our Technology PowerPoint Templates because It will let you Set new benchmarks with our PowerPoint Templates and Slides. They will keep your prospects well above par. Use our Globe PowerPoint Templates because Our PowerPoint Templates and Slides are conceived by a dedicated team. Use them and give form to your wondrous ideas. Present our Business PowerPoint Templates because It is Aesthetically crafted by artistic young minds. Our PowerPoint Templates and Slides are designed to display your dexterity. Download our Communication PowerPoint Templates because Our PowerPoint Templates and Slides will let Your superior ideas hit the target always and everytime. Present our Internet PowerPoint Templates because Our PowerPoint Templates and Slides are specially created by a professional team with vast experience. They diligently strive to come up with the right vehicle for your brilliant Ideas. Use these PowerPoint slides for presentations relating to 3d, Abstract, America, Blue, Business, Circle, Collective, Communication, Concept, Contact, Continent, Country, Crowd, Cyber, Data, Design, Digital, Earth, Establish, Europe, Figure, Global, Globe, Group, Icon, Idea, Illustration, Internet, Isolated, Man, Map, Offer, Peace, People, Planet, Population, Render, Society, Sphere, Stand, Strong, Structure, Team, Teamwork, Tech, Technology, Unity, Web, Woman, World. The prominent colors used in the PowerPoint template are Blue, Gray, White. The feedback we get is that our business charts men with group of blue globe PowerPoint templates PPT backgrounds for slides will make you look like a winner. Customers tell us our America PowerPoint templates and PPT Slides are readymade to fit into any presentation structure. The feedback we get is that our business charts men with group of blue globe PowerPoint templates PPT backgrounds for slides are visually appealing. Professionals tell us our Blue PowerPoint templates and PPT Slides are designed by a team of presentation professionals. Presenters tell us our business charts men with group of blue globe PowerPoint templates PPT backgrounds for slides will help them to explain complicated concepts. You can be sure our Concept PowerPoint templates and PPT Slides are aesthetically designed to attract attention. We guarantee that they will grab all the eyeballs you need. Our Business Charts Men With Group Of Blue Globe PowerPoint Templates Ppt Backgrounds For Slides are up for any experiment. They are ready to establish new benchmarks.
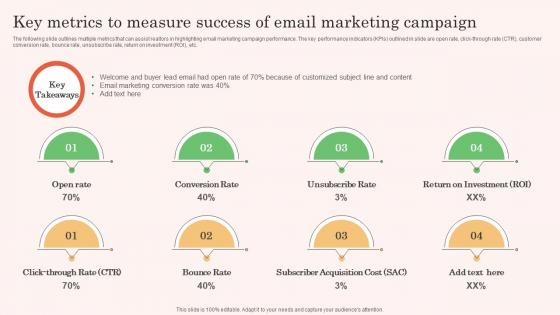
Key Metrics To Measure Success Of Email Real Estate Property Marketing Demonstration Pdf
The following slide outlines multiple metrics that can assist realtors in highlighting email marketing campaign performance. The key performance indicators KPIs outlined in slide are open rate, click-through rate CTR, customer conversion rate, bounce rate, unsubscribe rate, return on investment ROI, etc. Slidegeeks has constructed Key Metrics To Measure Success Of Email Real Estate Property Marketing Demonstration Pdf after conducting extensive research and examination. These presentation templates are constantly being generated and modified based on user preferences and critiques from editors. Here, you will find the most attractive templates for a range of purposes while taking into account ratings and remarks from users regarding the content. This is an excellent jumping-off point to explore our content and will give new users an insight into our top-notch PowerPoint Templates. The following slide outlines multiple metrics that can assist realtors in highlighting email marketing campaign performance. The key performance indicators KPIs outlined in slide are open rate, click-through rate CTR, customer conversion rate, bounce rate, unsubscribe rate, return on investment ROI, etc.
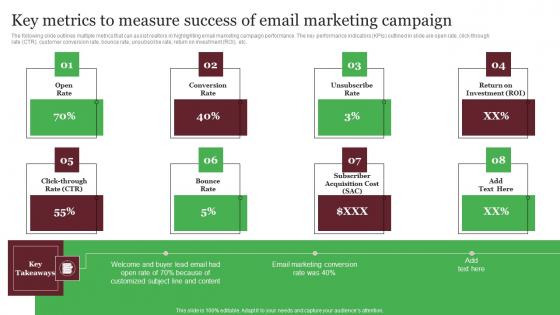
Key Metrics To Measure Success Of Email Marketing Campaign Out Of The Box Real Topics Pdf
The following slide outlines multiple metrics that can assist realtors in highlighting email marketing campaign performance. The key performance indicators KPIs outlined in slide are open rate, click-through rate CTR, customer conversion rate, bounce rate, unsubscribe rate, return on investment ROI, etc. Slidegeeks has constructed Key Metrics To Measure Success Of Email Marketing Campaign Out Of The Box Real Topics Pdf after conducting extensive research and examination. These presentation templates are constantly being generated and modified based on user preferences and critiques from editors. Here, you will find the most attractive templates for a range of purposes while taking into account ratings and remarks from users regarding the content. This is an excellent jumping-off point to explore our content and will give new users an insight into our top-notch PowerPoint Templates. The following slide outlines multiple metrics that can assist realtors in highlighting email marketing campaign performance. The key performance indicators KPIs outlined in slide are open rate, click-through rate CTR, customer conversion rate, bounce rate, unsubscribe rate, return on investment ROI, etc.
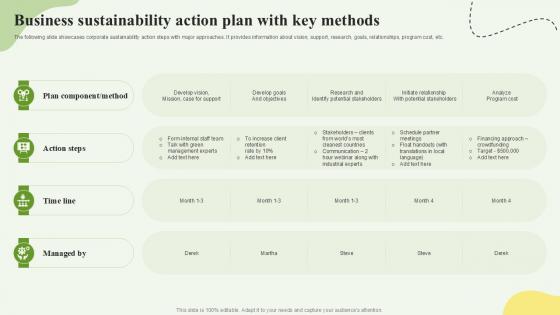
Business Sustainability Action Plan With Key Methods Ppt Template SS
This slide showcases HR analysis using business intelligence tool. The purpose of this slide is to understand the workforce demographics and effective management of employees to achieve business goals. It includes key metrics such as absenteeism rate, overtime hours, overall effectiveness and cost of training along with key takeaways. Do you have to make sure that everyone on your team knows about any specific topic I yes, then you should give Business Sustainability Action Plan With Key Methods Ppt Template SS a try. Our experts have put a lot of knowledge and effort into creating this impeccable Business Sustainability Action Plan With Key Methods Ppt Template SS You can use this template for your upcoming presentations, as the slides are perfect to represent even the tiniest detail. You can download these templates from the Slidegeeks website and these are easy to edit. So grab these today This slide showcases HR analysis using business intelligence tool. The purpose of this slide is to understand the workforce demographics and effective management of employees to achieve business goals. It includes key metrics such as absenteeism rate, overtime hours, overall effectiveness and cost of training along with key takeaways.

Global Cubesat Market Analysis Report IoT In Orbit Unleashing The Power IoT SS V
This slide showcases information about the global market size of miniature satellites also known as CubeSat. It showcases global market size, types of CubeSat market share by size, and the largest growing geographic area. From laying roadmaps to briefing everything in detail, our templates are perfect for you. You can set the stage with your presentation slides. All you have to do is download these easy-to-edit and customizable templates. Global Cubesat Market Analysis Report IoT In Orbit Unleashing The Power IoT SS V will help you deliver an outstanding performance that everyone would remember and praise you for. Do download this presentation today. This slide showcases information about the global market size of miniature satellites also known as CubeSat. It showcases global market size, types of CubeSat market share by size, and the largest growing geographic area.
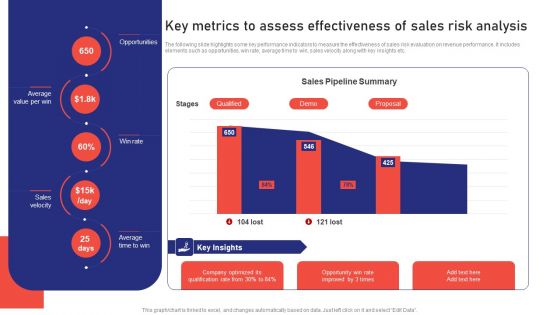
Sales Risk Assessment For Profit Maximization Key Metrics To Assess Effectiveness Of Sales Risk Analysis Ideas PDF
The following slide highlights some key performance indicators to measure the effectiveness of sales risk evaluation on revenue performance. It includes elements such as opportunities, win rate, average time to win, sales velocity along with key insights etc. Get a simple yet stunning designed Sales Risk Assessment For Profit Maximization Key Metrics To Assess Effectiveness Of Sales Risk Analysis Ideas PDF. It is the best one to establish the tone in your meetings. It is an excellent way to make your presentations highly effective. So, download this PPT today from Slidegeeks and see the positive impacts. Our easy to edit Sales Risk Assessment For Profit Maximization Key Metrics To Assess Effectiveness Of Sales Risk Analysis Ideas PDF can be your go to option for all upcoming conferences and meetings. So, what are you waiting for Grab this template today.
Product Repositioning KPI Monitoring And Tracking Ppt PowerPoint Presentation File Infographic Template PDF
This slide highlights the key performance indicator of product repositioning which includes product sales, product demand in the market, position in the market and social media channels growth rate. If you are looking for a format to display your unique thoughts, then the professionally designed Product Repositioning KPI Monitoring And Tracking Ppt PowerPoint Presentation File Infographic Template PDF is the one for you. You can use it as a Google Slides template or a PowerPoint template. Incorporate impressive visuals, symbols, images, and other charts. Modify or reorganize the text boxes as you desire. Experiment with shade schemes and font pairings. Alter, share or cooperate with other people on your work. Download Product Repositioning KPI Monitoring And Tracking Ppt PowerPoint Presentation File Infographic Template PDF and find out how to give a successful presentation. Present a perfect display to your team and make your presentation unforgettable.
Monthly Project Status Report Icon PPT Sample SS
Do you have to make sure that everyone on your team knows about any specific topic I yes, then you should give Monthly Project Status Report Icon PPT Sample SS a try. Our experts have put a lot of knowledge and effort into creating this impeccable Monthly Project Status Report Icon PPT Sample SS. You can use this template for your upcoming presentations, as the slides are perfect to represent even the tiniest detail. You can download these templates from the Slidegeeks website and these are easy to edit. So grab these today Our Monthly Project Status Report Icon PPT Sample SS are topically designed to provide an attractive backdrop to any subject. Use them to look like a presentation pro.
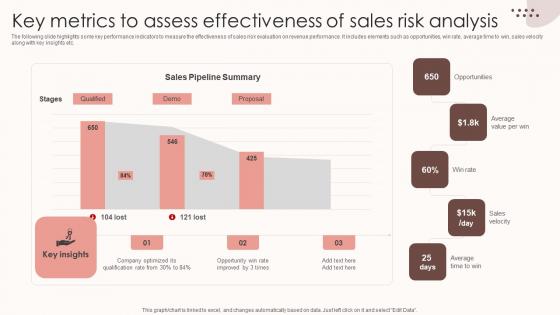
Assessing Sales Risks Key Metrics To Assess Effectiveness Of Sales Risk Analysis Diagrams PDF
The following slide highlights some key performance indicators to measure the effectiveness of sales risk evaluation on revenue performance. It includes elements such as opportunities, win rate, average time to win, sales velocity along with key insights etc. This Assessing Sales Risks Key Metrics To Assess Effectiveness Of Sales Risk Analysis Diagrams PDF is perfect for any presentation, be it in front of clients or colleagues. It is a versatile and stylish solution for organizing your meetings. The Assessing Sales Risks Key Metrics To Assess Effectiveness Of Sales Risk Analysis Diagrams PDF features a modern design for your presentation meetings. The adjustable and customizable slides provide unlimited possibilities for acing up your presentation. Slidegeeks has done all the homework before launching the product for you. So, do not wait, grab the presentation templates today The following slide highlights some key performance indicators to measure the effectiveness of sales risk evaluation on revenue performance. It includes elements such as opportunities, win rate, average time to win, sales velocity along with key insights etc.
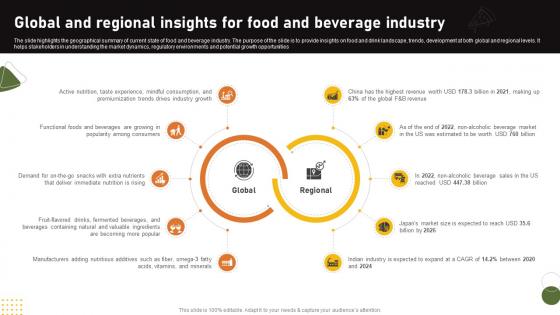
Food And Drink Industry Report Global And Regional Insights For Food And Beverage Industry IR SS V
The slide highlights the geographical summary of current state of food and beverage industry. The purpose of the slide is to provide insights on food and drink landscape, trends, development at both global and regional levels. It helps stakeholders in understanding the market dynamics, regulatory environments and potential growth opportunities. If your project calls for a presentation, then Slidegeeks is your go-to partner because we have professionally designed, easy-to-edit templates that are perfect for any presentation. After downloading, you can easily edit Food And Drink Industry Report Global And Regional Insights For Food And Beverage Industry IR SS V and make the changes accordingly. You can rearrange slides or fill them with different images. Check out all the handy templates The slide highlights the geographical summary of current state of food and beverage industry. The purpose of the slide is to provide insights on food and drink landscape, trends, development at both global and regional levels. It helps stakeholders in understanding the market dynamics, regulatory environments and potential growth opportunities.


 Continue with Email

 Home
Home


